Engineering Hydrology
|
|
|
- Alyson Morris
- 5 years ago
- Views:
Transcription
1 Engineering Hydrology Prof. Rajesh Bhagat Asst. Professor Civil Engineering Department Yeshwantrao Chavan College Of Engineering Nagpur B. E. (Civil Engg.) M. Tech. (Enviro. Engg.) GCOE, Amravati VNIT, Nagpur Experience: 1) Lecturer, KDKCOE, Nagpur 2) Lecturer, PRPCOE, Amravati 3) Assistant Professor, PCE, Nagpur Achievements: 1) Selected Scientist, NEERI-CSIR, Govt. of India. 2) GATE Qualified Three Times 3) Selected Junior Engineer, ZP Washim. 4) Assistant Professor, Cummins College of Engg. For Women (MKSSS, Nagpur) Mobile No.: / ID :- rajeysh7bhagat@gmail.com Website:-
2 UNIT-IV Floods: Causes and effects, Factors affecting peak flows and its estimation, Flood routing and Flood forecasting. Frequency analysis. Economic planning for flood control. Statistical Methods: Statistics in hydrological analysis, probability and probability distribution. (Gumbel s Probability Distribution Method for Prediction of Flood Peak)
3 Importance of Statistics and Probability in Hydrology: 1) If the outcome of a process can be precisely predicted is known as deterministic process. 2) But in some cases, there is uncertainty or unpredictability regarding outcome. 3) Average weather condition are same from year to year, but yearly rainfall at a given place is not same every year. 4) In all such a cases, process is treated as a probabilistic process and outcome governed by some probability law.
4 Flood 1) Any flow which is relatively high and which overtops the natural or artificial banks in any reach of a river may be called a flood. 2) Abnormal quantity of water arising from heavy rainfall. 3) Flood is the most worldwide natural disaster. 4) It occurs in every country and wherever there is rainfall or coastal hazards. 5) Flood may be controlled by hydraulic structure. 6) Floods are be estimated with reasonable accuracy for an economic and efficient design of hydraulic structure.
5 Different types of flood:- Local flood:- caused due to high intensity of local rainfall which generate higher surface run-off. Urbanization, Surface sealing and loss of infiltration capacity increases the surface runoff causes local flood. River floods: - River flood occur when the river volume exceeds due to excess of run-off beyond the river capacity. The river levels rise slowly due to high intensity rainfall for long lasting duration. Flash floods:-flash floods occur as a result of the rapid accumulation and release of runoff waters from upstream mountainous areas, which can be caused by very heavy rainfall, bursting of clouds, landslides, sudden break-up of an ice jam or failure of flood control works. Coastal floods:- High tides and storm caused by tropical depressions and cyclones can cause coastal floods in urban areas, low-lying land near the sea in general. Tidal effects can keep the river levels high for long periods of time and sustain flooding.
6 Major parameters factors responsible for the occurrences of flood: 1) Climate:- Due to global warming or climate change many subsystems of the global water cycle are effected causing an increase of flood magnitude as well as flood frequency. 2) Nature of collecting basin:- A collecting basin is an area where surface water from rain converges to a single point, it is usually exit of basin, where water join another water body, such as a river. Larger the area of basin more will be the water receiving capacity. 3) Nature of the streams: - Water flowing through a channel, such as a stream, has the ability to transport sediment. Some percolates deep into the ground and replenishes the groundwater supply. 4) Vegetative cover:- Trees reduce top soil erosion, prevent harmful land pollutants contained in the soil from getting into our waterways, slow down water run-off, and ensure that our groundwater supplies are continually being replenished. 5) Rainfall: - It is difficult to predict and measure the precise changes in the hydrological cycle because of the processes such as evaporation, transport, and precipitation.
7 CAUSES OF FLOOD 1) Intense rainfall 2) Melting of snow 3) High Tides & Cyclone CAUSES OF FLOODING 1) Culvert, drain and gully entry blockage (partial or total) Dumped rubbish. Floating debris, including leaves and branches. Sediment deposition 2) Poorly maintained urban watercourses (silted, overgrown with vegetation, or blocked with rubbish.) 3) Bridge, culvert or tunnel waterway capacity exceeded. 4) Failure of drainage pump or jammed sluice gate. 5) High water level in receiving river that flows back up the drain or sewer.
8 1) Design of culvert, bridges, drainage work and irrigation diversion works, needs a reliable estimates of the flood. 2) The maximum flood that any structure can safely pass is called the design flood. 3) As the magnitude of the design flood increase, the capital cost of the structure also increases but the probability of annual damages will decrease. 4) Standard Project Flood (SPF) is the estimate of the flood likely to occur from the severe combination of the meteorological & hydrological conditions, which are reasonably characteristics of the drainage basin being considered, but excluding extremely rare combination. Floods with return period of 100 years are accouted. 5) Maximum Probable Flood (MPF) differs from the SPF in that it includes the extremely rare / severe combination of the meteorological & hydrological conditions. It is a catastrophic floods and is usually confined to spillway design of very high dams. The SPF is usually around 80% of the MPF for the basin.
9 DESIGN FLOOD:- 1) Actual value of flood for which structure is designed. 2) Flood adopted for the design of hydraulic structure like spillways, bridges, flood banks, etc. 3) Floods are be estimated with reasonable accuracy for an economic and efficient design. 4) It may be MPF or SPF or flood of any desired recurrence interval. 5) As the magnitude of design flood increases, the capital cost of structure also increases but the probability of annual damage will decrease. 6) Design flood in many cases is less than MPF because MPF is not economical. 7) Several design flood may be adopted in a single structure for example MPF is used for spillway.
10 DESIGN FLOOD:- The methods used in the estimation of the design flood can be grouped as under: 1) Physical indication of past flood 2) Envelop curves 3) Empirical formulae 4) Rational method 5) Unit hydrograph application 6) Frequency analysis orstatistical method Methods 1 to 4 of above only give the flood peak. Method 5 give the complete flood hydrograph but it can not be used for very large areas. In method 6, flood hydrograph may be constructed by making its peak discharge equal to the estimated design flood. (Gumbel s Distribution)
11 Empirical Formulae: A. Formulae considering area of the basin only into consideration. 1) Dickens Formula: Q = C x A (3/4) A is in km 2 and C is a constant depending on other catchment parameter which may and Q is in m 3 /s. 2) Ryves Formula: Q = C x A (2/3) A is in km 2 and Q is in m 3 /s. Widely used in south. Values of C varies from ) Inglis Formula: Q = (124 A) / (A ) (1/2) A is in km 2 and and Q is in m 3 /s. 4) Ali Nawaz Bahadur Formula: Q = C A (0.993 (1/14(Log A))) Developed for Hyderabad. C is 48 60, A is in km 2 and and Q is in m 3 /s. B. Formulae may consider one or more basin parameters apart from area and also rainfall characteristics. C.Formulae may consider recurrence interval either explicitly into consideration.
12 Empirical Formulae: 5) Iszkowski s : Q = C M H A B. Formulae may consider one or more basin parameters apart from area and also rainfall characteristics. 1) Craig s Formula: Q = 10 k BVI ln ((4.97 L 2 ) / B) Q is in m 3 /s, L is greatest length of catchment in km, B is avg width of catchment in km, v is velocity of runoff in m/s, k is runoff coefficient & I is avg rainfall intensity in cm /hr. 2) Lillie s Formula: Q = V R k θ L Catchment is divided in triangles, Q is m 3 /s, V is velocity of flow m/s, R is rainfall coefficient, k is coefficient, θ is apical angle and L is length in km. 3) Rhinds Formula: Q = C S R (0.386 A ) p Q is m 3 /s, S is avg fall of last 5 km, R is greatest annual rainfall in cm, p is variable ndex, L is greatest length in catchment, C is coefficient. 4) Chamiers Formula: Q = 3.5 I K A 3/4
13 C. Formulae may consider recurrence interval either explicitly into consideration. 1) Fullers Formula: Q = C x A (0.8) 1) Hortons Formula: Q = (114 Tr 0.25 ) / A Q is m 3 /s, Tr is return period & A is drainage area on km 2. 1) Pettis Formula: Q = C (P B ) 1.25 Q is flood discharge with return period of 100 years in m 3 /s, P is one day rainfall with 100 years return period, B is width of basin in km & C is coefficient.
14 Rational Method for Estimation of Design Flood:- 1) The time of concentration is the maximum time required by the surface runoff to reach the basin outlet. 2) When storms continues beyond concentration time every part of the catchment would be contributing to the runoff at outlet and therefore it represents condition of peak runoff. 3) It is given by Q = C x A x I Where, C is runoff coefficient or impermeability coefficient = (runoff/rainfall) A = catchment area I = intensity of rainfall. If different portions of catchment have different runoff coefficient then C is calculated by Ceq = (C 1 A 1 + C 2 A 2 + C 3 A 3 ) / (A 1 + A 2 + A 3 )
15 Rational Method forestimation of Design Flood:- 1) Q = C x A x I 2) The rational formula is found to be suitable for a peak flow prediction in small catchment up to 50 km 2 in area. 3) Application in urban drainage designs and in the design of small culverts and bridges. Rainfall Intensity, I = (K T x ) / (t c + a) m Probability exceedance P : (Return Period T = 1/P) K, a, x and m are constant. (K = 80-90, a =13-49, x =0.2 & m = ) Kirpich Equation, t c = L 0.77 S t c = Time of concentration in minutes L = Max. Length of traveller of water in meter S = Slope of catchment = H / L H = Difference in elevation
16 What is a return period? 1) The probability that events such as floods, wind storms & earthquake will occur is often expressed as a return period. 2) The inverse of probability (generally expressed in %), it gives the estimated time interval between events of a similar size or intensity. 3) For example, the return period of a flood might be 100 years; otherwise expressed as its probability of occurring being 1/100, or 1% in any one year. This does not mean that if a flood with such a return period occurs, then the next will occur in about one hundred years' time - instead, it means that, in any given year, there is a 1% chance that it will happen, regardless of when the last similar event was. Or, put differently, it is 10 times less likely to occur than a flood with a return period of 10 years (or a probability of 10%). 16
17 1) An urban catchment has an area of 0.85 km2. the slope of the catchment is and the maximum length of travel of water is 950 m. The maximum depth of rainfall with a 25 years return period is as below:- Duration, Minute Depth of rainfall, mm if culvert for drainage at the outlet of this area is to designed for a return period of 25 years, estimates the required peak flow rate by assuming the runoff coefficient as 0.3. Sol:- Time of concentration by Kirpich Equation, t c = L 0.77 S t c = x ( ) x (0.006) = minutes Max. Depth of rainfall for minute duration (by interpolation): (50-40) / (30-20) = (50 - x) / ( ) x = mm = max. Depth of rainfall for minutes. Avg intensity of rainfall = I = (47.39 / ) 60 = mm/hr Q = C x A x I = (0.3 x 0.85 x x ) / 1000 x 60 x 60 = 7.35 m 3 / s
18 2) If in the urban area, the land use of the area and the corresponding runoff coefficient are as given below calculate the equivalent runoff coefficient. Land Use Area (ha) Runoff coefficient Roads Lawn Residential area Industrial area Sol: Equivalent runoff coefficient Ceq = (C 1 A 1 + C 2 A 2 + C 3 A 3 + C 4 A 4 ) / (A 1 + A 2 + A 3 +A 4 ) Ceq = ((0.7x8) + (0.1x17) + (0.3x50) + (0.8x10)) / ( ) = 0.36
19 3) A small watershed consists of 1.5 km2 of cultivate area (C=0.2), 2.5 km2 under forest (C=0.1) and 1.0 km2 under grass cover (C=0.35). There is a fall of 22 m in a watercourse length of 1.8 km. The intensity frequency-duration relation for the area may be taken as I = (80 x T 0.2 r ) / (t c + 13) 0.46 Where I is in cm/hr, t c is in minutes. Estimate the peak rate of runoff for a 25 year frequency. Sol: length of water course = 1.8 km = 1800 m & Fall in the elevation = 22 m S = 22 / 1800 = t c = x (L 0.77 ) x (S) t c = x ( ) x (0.0122) = minutes I = (80 x T 0.2 r ) / (t c + 13) 0.46 I = (80 x ) / ( ) 0.46 = cm/hr Ceq = (C 1 A 1 + C 2 A 2 + C 3 A 3 ) / (A 1 + A 2 + A 3 ) Ceq = ((0.2x1.5) + (0.1x2.5) + (0.35x1)) / ( ) = 0.18
20 3) A small watershed consists of 1.5 km2 of cultivate area (C=0.2), 2.5 km2 under forest (C=0.1) and 1.0 km2 under grass cover (C=0.35). There is a fall of 22 m in a watercourse length of 1.8 km. The intensity frequency-duration relation for the area may be taken as I = (80 x T 0.2 r ) / (t c + 13) 0.46 Where I is in cm/hr, t c is in minutes. Estimate the peak rate of runoff for a 25 year frequency. Sol: S = t c = minutes I = cm/hr = m / hr Ceq = 0.18 Q = C x A x I = (0.18 x 5 x x / 60 x 60 = m 3 / s
21 4) A bridge is proposed to constant across a river having catchment area of 2027 hectors. The catchment has a slope of and length of travel of water is 20270m. Estimates 30 years flood, the intensity frequency duration relationship is given by I = (9876 x T 0.2 r ) / (t c + 45) 0.98 Where I is in mm/hr, Tr is in years & tc is in minutes. Assume runoff coefficient as Sol:- Time of concentration by Kirpich Equation, t c = L 0.77 S t c = x ( ) x (0.007) = minutes Max. intensity of rainfall = I = ((9876 x )) / (( ) 0.98 ) = mm/hr = cm/hr A = 2027 Ha = Km 2 1 Km 2 = 100 Ha Q = C x A x I Peak Discharge, Q = C x A x I = (0.35 x x x / (100 x 60 x 60) = cumec.
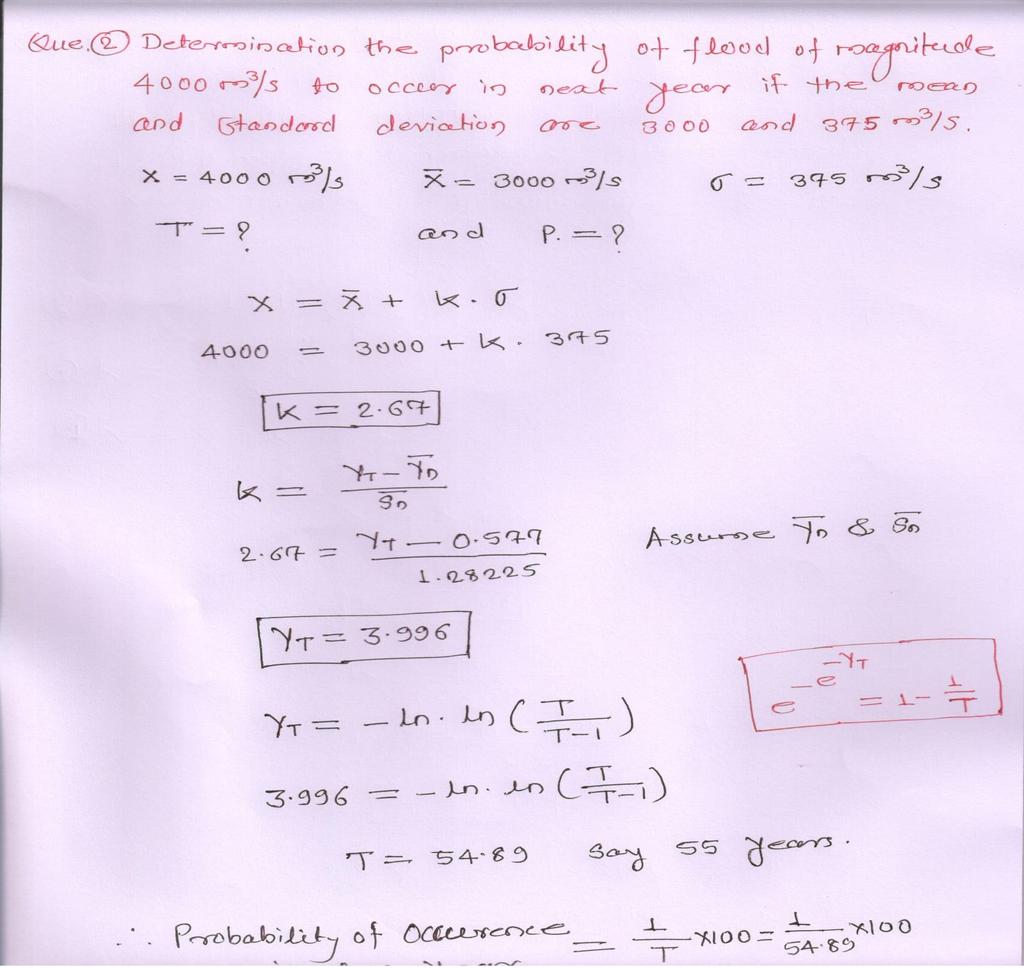
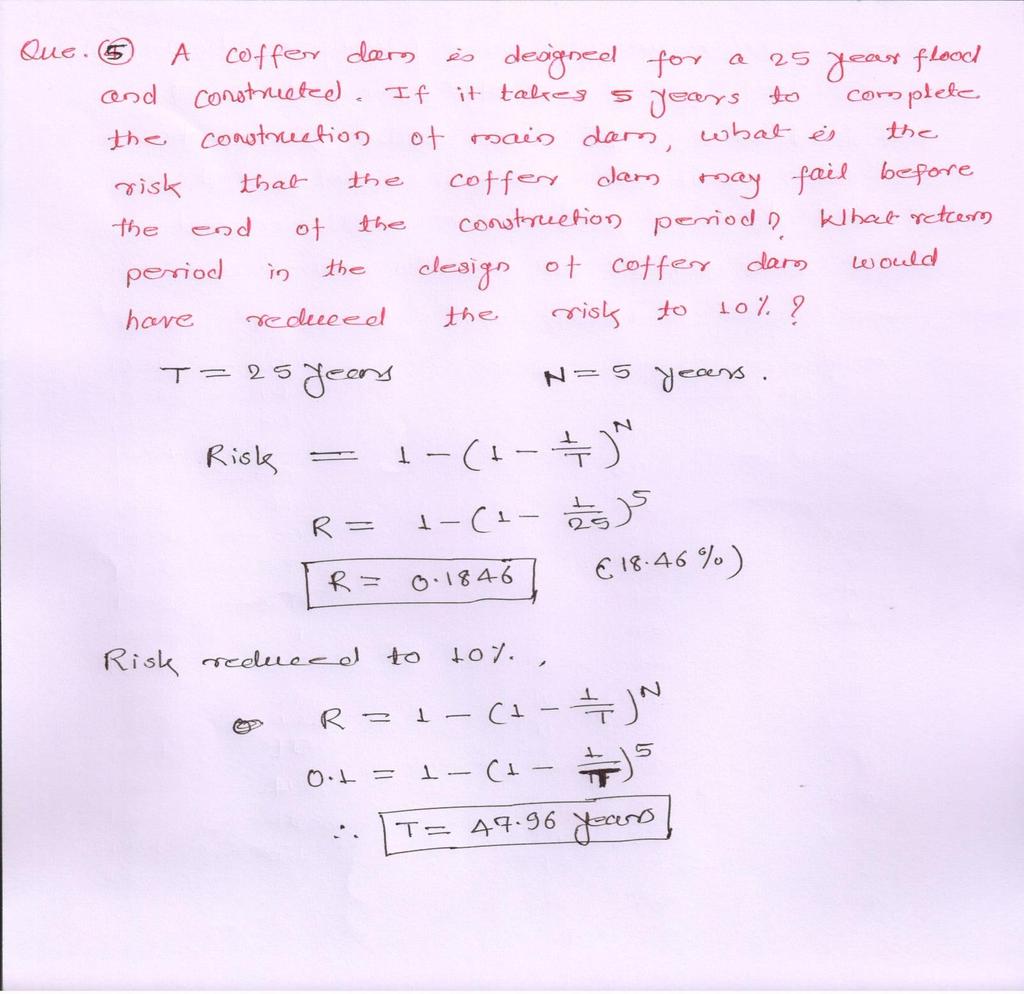
22 Estimation of Design Flood For A Particular Return Period: 1) The return period is calculated by using Weibull s formula: T r = ( n + 1) / m T r = return period in years n = number of years of record m = order number 2) Return period represents the avg no. of years within which a given event will be equalled or exceeded. Probability of Exceedance, p = 1 / Tr 3) If the probability of occurrence of an event is p, then the probability of its no-occurrence is q = 1- p 4) Probability of an event not occurring at all in n successive years would be equal to q n q n = (1- p) n Probability of an event occurring at least once in n successive years, = 1 q n = 1- (1 - p) n This probability is called risk.
23 A flood of a certain magnitude has a return period of 20 years. What is the probability that a flood of this magnitude may occurs in next 15 years. Return period represents the avg no. of years within which a given event will be equalled or exceeded. Probability of Exceedance, p = 1 / Tr p = 1 / 20 = % Probability of an event not occurring at all in n successive years would be equal to q n q n = (1- p) n = (1 0.05) 15 = % Probability of an event occurring at least once in n successive years, Risk = 1 q n = 1- (1 - p) n Risk = = %
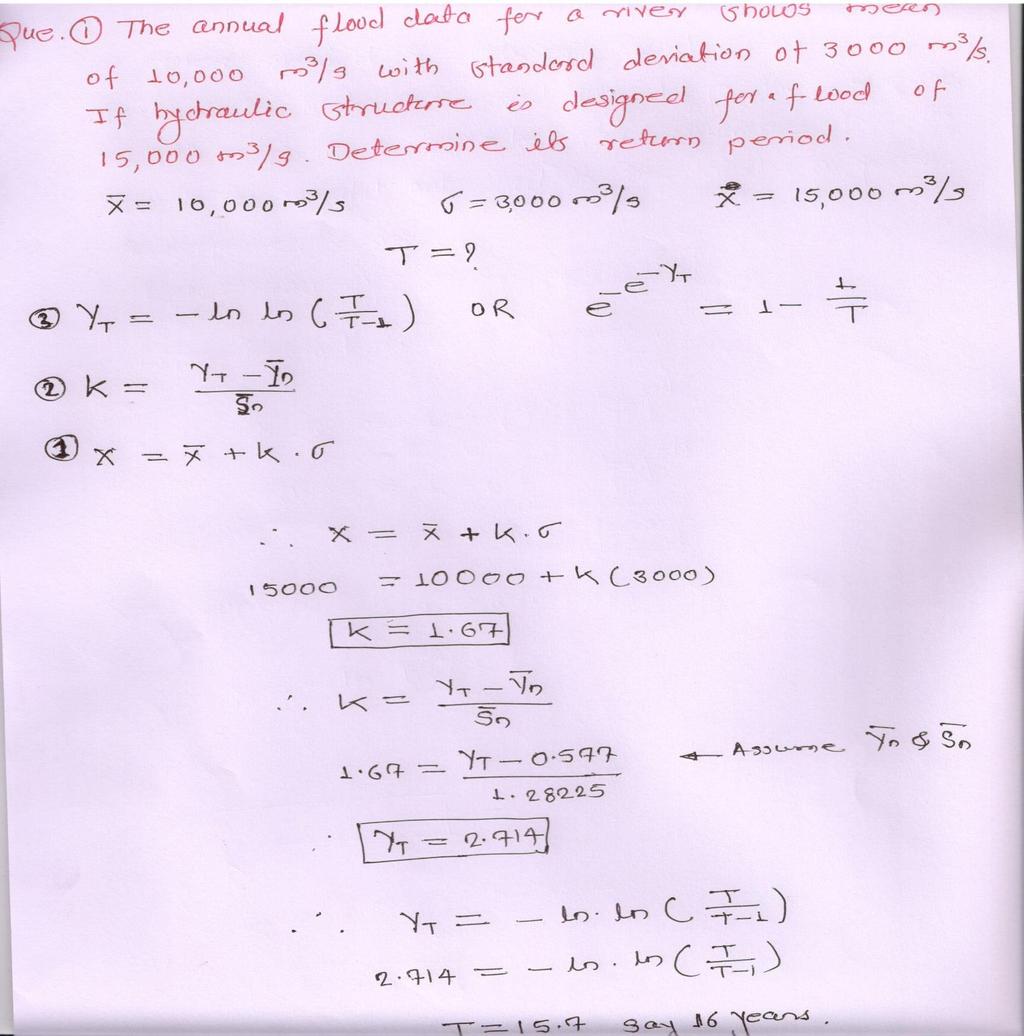
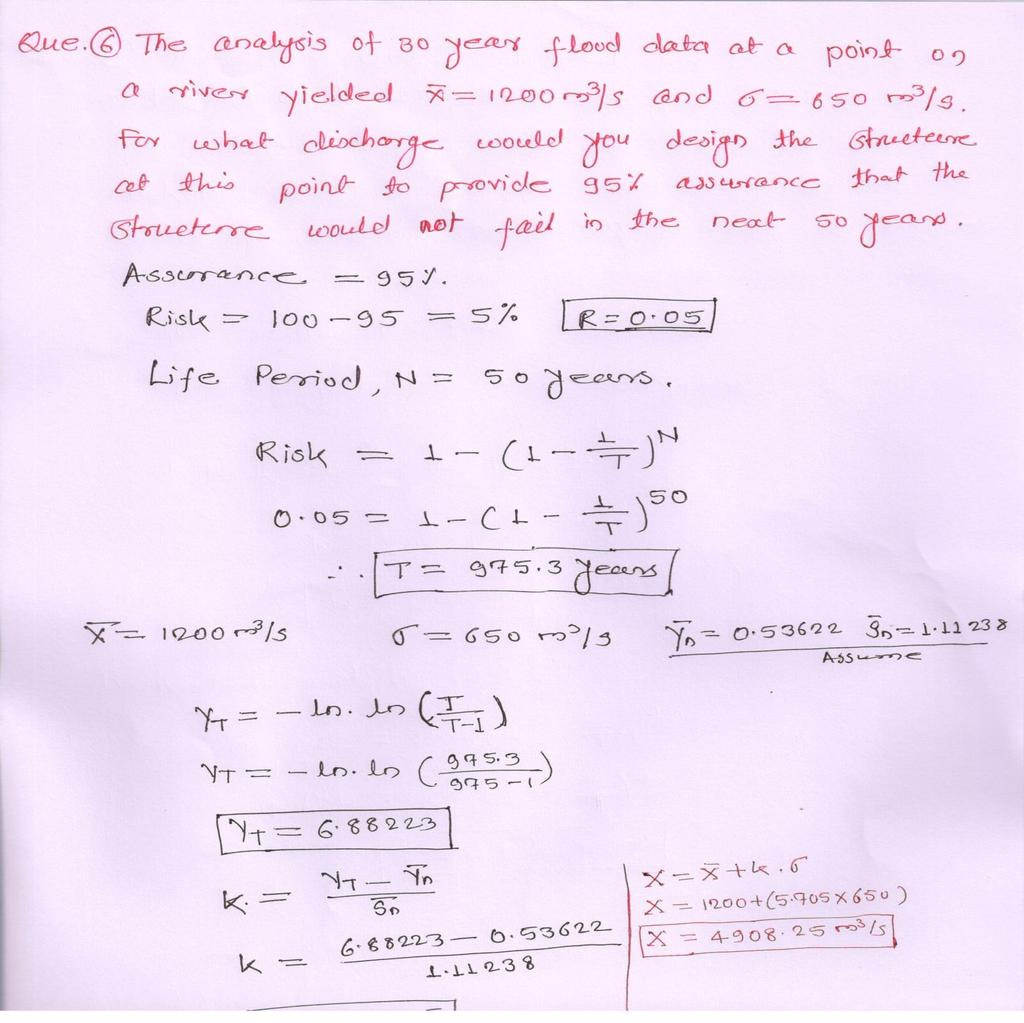
24 The flood data analysis at river site yielded mean of m 3 /s & standard deviation of 650 m3/s for what discharge the structure should be designed so as to provide 95% assurance that the structure will not fail in next 50 years. Percentage of assurance = 95 % Percentage risk = 5% Risk = 1 q n = 1- (1 - p) n Probability of Exceedance, p = 1 / Tr 0.05 = 1- (1-1 / Tr) 50 Tr = years Y T = - ln ln (T / (T - 1)) = - ln ln ( / ( )) =6.88 X T = X + K. σ = K. 650 K = Frequency factor = (y T y n ) / S n = = ( ) / X T = X + K. σ = K. 650 X T = m3/s
25 Estimation of Design Flood For A Particular Return Period: 1) The return period is calculated by using Weibull s formula: T r = ( n + 1) / m T r = return period in years n = number of years of record m = order number 2) Return period represents the avg no. Of years within which a given event will be equalled or exceeded. Probability of Exceedance = 1 / Tr = P 3) If a graph plotted between flood magnitude and its return period in simple plane coordinates, the plot is called probability or empirical distribution. Extrapolation for large return period may yield more result hence following method are used: A. Gumble s method B. Log Pearson Type III Method
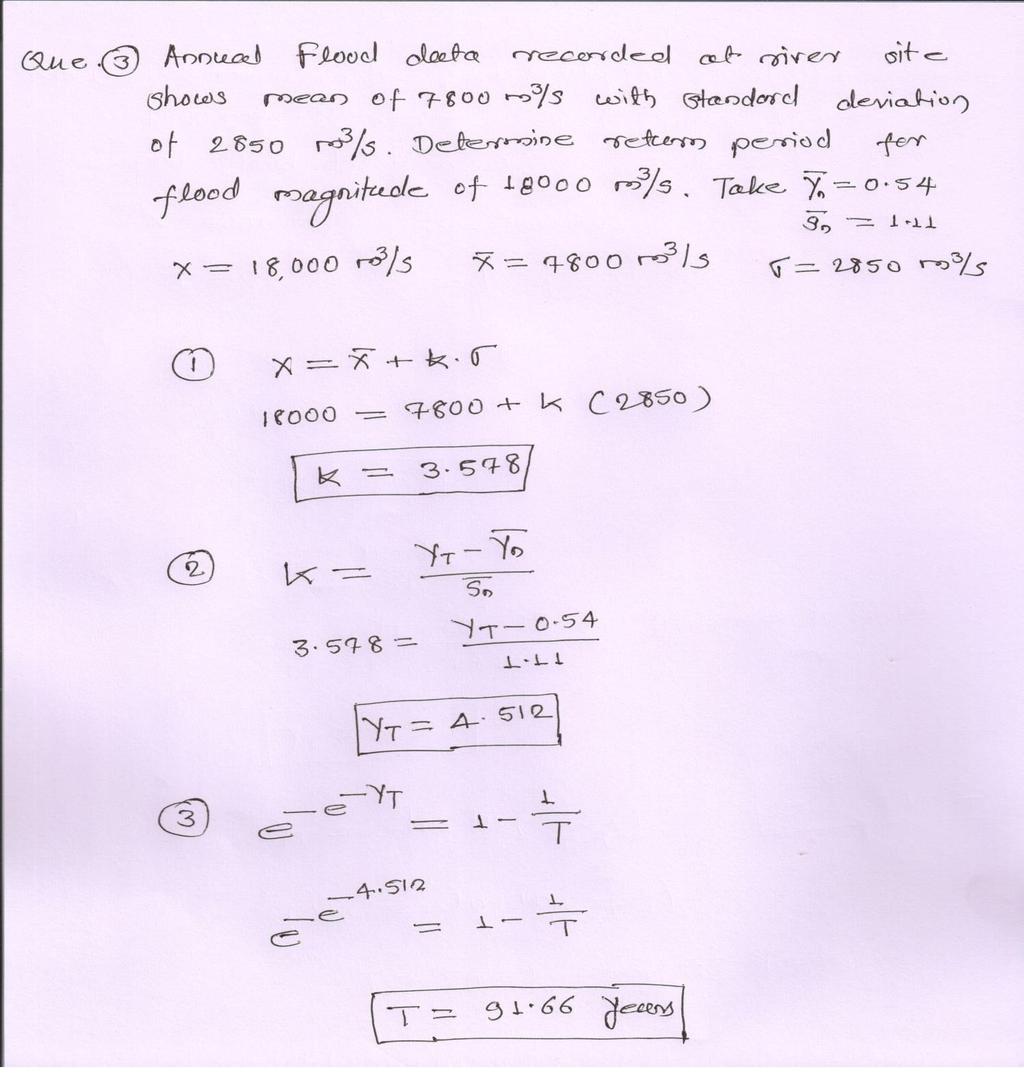
26 Gumble s Method: X = X + K. σ X = Flood Magnitude of Return Period T years X = Mean Value of Past Flood Record = ( X) / n K = Frequency Factor = (y T y n ) / s n y T = - ln ln (T / (T - 1)) y n = Reduced Mean Variable = S n = Reduced Standard Deviation Variable = No. of years of records, n > 50 we use y n = & s n = σ or σ n-1 = Standard deviation for previous data = ( ( ( Xi X ) 2 ) / ( n 1 ) )
27 Gumble s Probability Distribution Method for Prediction of Flood Peak: 1) This method of estimating the flood peak was given by Gumbel and is known as Gumbel s Distribution method. 2) This is a flood frequency method which is most widely used in hydrological analysis & meteorological studies.
28 Procedure for Estimating Peak Flood: 1) From the given discharge data & for sample size n, X & Sn are to be computed. σ or σ n-1 = Standard deviation = ( ( ( Xi X ) 2 ) / ( n 1 ) ) 1) y n & S n are to be computed for given sample size, n. (assumed if not given & ) 1) For given T, y T is to be calculated by y T = - ln ln (T / (T - 1)) 2) Frequency factor (K ) is calculated by K = (y T y n ) / S n 3) Now the magnitude of flood X can be obtained from X = X + K. σ
29 Gumble s Method: X = X + K. σ X = Flood Magnitude of Return Period T years X = Mean Value of Past Flood Record = ( X) / n K = Frequency Factor = (y T y n ) / s n y T = - ln ln (T / (T - 1)) y n = Reduced Mean Variable = S n = Reduced Standard Deviation Variable = No. of years of records, n > 50 we use y n = & s n = σ or σ n-1 = Standard deviation for previous data = ( ( ( Xi X ) 2 ) / ( n 1 ) )
30 Flood frequency computation for the river Chambal at Gandhisagar Dam by using Gumble s Method, yielded the following results: Return Period, T (Years) Peak Flood, m 3 /s Estimates the flood magnitude in this river with a return period of 500 years. Sol: X T = X + K. σ X 100 = X + K 100. σ & X 50 = X + K 50. σ X 100 X 50 = (K K 50 ) σ = (K K 50 ) σ 5491 = (K K 50 ) σ
31 Flood frequency computation for the river Chambal at Gandhisagar Dam by using Gumble s Method, yielded the following results: Return Period, T (Years) Peak Flood, m3/s Estimates the flood magnitude in this river with a return period of 500 years. Sol: X T = X + K. σ X 100 = X + K 100. σ & X 50 = X + K 50. σ (K K 50 ) σ = X 100 X 50 = = 5491 K T = (y T y n ) / S n K 100 = (y 100 y n ) / S n & K 50 = (y 50 y n ) / S n (y y 50 ) (σ / S n )= 5491 Eq n - 1 No. Of years of records, n > 50 we use y n = & S n = y T = - ln ln (T / (T - 1)) y 100 = - ln ln (100 / (100-1)) & y 50 = - ln ln (50 / (50-1)) y 100 = & y 50 =
32 (y y 50 ) (σ / S n )= 5491 Eq n - 1 (σ / S n )= 5491 / (y y 50 ) (σ / S n )= 5491 / ( ) = 7864 For T = 500 years y T = - ln ln (T / (T - 1)) y 500 = - ln ln (500/ (500 1)) = (y y 100 ) (σ / S n ) = X Eq n - 2 ( ) (7864) = X X 500 = say m3/s
33 Flood Routing:- 1) It is the technique of determining the flood hydrograph at a section of a river by utilising the data of flood flow at one or more upstream sections. 2) It is also used in analysis of a flood forecasting, flood protection, reservoir design, spillway design etc. 3) The broad categories of flood routing are reservoir routing and channel routing. 4) In reservoir routing the effect of reservoir storage on a flood hydrograph is analysed. This is used in design, location and sizing of the capacity of reservoir. 5) In channel routing the effect of storage of a specified channel reach on the flood hydrograph is studied. It is used in flood forecasting and flood protection.
34 34
35 35
36 36
37 37
38 38
ENGINEERING HYDROLOGY
 ENGINEERING HYDROLOGY Prof. Rajesh Bhagat Asst. Professor Civil Engineering Department Yeshwantrao Chavan College Of Engineering Nagpur B. E. (Civil Engg.) M. Tech. (Enviro. Engg.) GCOE, Amravati VNIT,
UGRC 144 Science and Technology in Our Lives/Geohazards
 UGRC 144 Science and Technology in Our Lives/Geohazards Flood and Flood Hazards Dr. Patrick Asamoah Sakyi Department of Earth Science, UG, Legon College of Education School of Continuing and Distance Education
Haiti and Dominican Republic Flash Flood Initial Planning Meeting
 Dr Rochelle Graham Climate Scientist Haiti and Dominican Republic Flash Flood Initial Planning Meeting September 7 th to 9 th, 2016 Hydrologic Research Center http://www.hrcwater.org Haiti and Dominican
Rainfall Analysis. Prof. M.M.M. Najim
 Rainfall Analysis Prof. M.M.M. Najim Learning Outcome At the end of this section students will be able to Estimate long term mean rainfall for a new station Describe the usage of a hyetograph Define recurrence
INDIAN INSTITUTE OF SCIENCE STOCHASTIC HYDROLOGY. Lecture -29 Course Instructor : Prof. P. P. MUJUMDAR Department of Civil Engg., IISc.
 INDIAN INSTITUTE OF SCIENCE STOCHASTIC HYDROLOGY Lecture -29 Course Instructor : Prof. P. P. MUJUMDAR Department of Civil Engg., IISc. Summary of the previous lecture Goodness of fit Chi-square test χ
GEOL 1121 Earth Processes and Environments
 GEOL 1121 Earth Processes and Environments Wondwosen Seyoum Department of Geology University of Georgia e-mail: seyoum@uga.edu G/G Bldg., Rm. No. 122 Seyoum, 2015 Chapter 6 Streams and Flooding Seyoum,
Floods Lecture #21 20
 Floods 20 Lecture #21 What Is a Flood? Def: high discharge event along a river! Due to heavy rain or snow-melt During a flood, a river:! Erodes channel o Deeper & wider! Overflows channel o Deposits sediment
9. Flood Routing. chapter Two
 9. Flood Routing Flow routing is a mathematical procedure for predicting the changing magnitude, speed, and shape of a flood wave as a function of time at one or more points along a watercourse (waterway
CLIMATE READY BOSTON. Climate Projections Consensus ADAPTED FROM THE BOSTON RESEARCH ADVISORY GROUP REPORT MAY 2016
 CLIMATE READY BOSTON Sasaki Steering Committee Meeting, March 28 nd, 2016 Climate Projections Consensus ADAPTED FROM THE BOSTON RESEARCH ADVISORY GROUP REPORT MAY 2016 WHAT S IN STORE FOR BOSTON S CLIMATE?
Flash Flood Guidance System On-going Enhancements
 Flash Flood Guidance System On-going Enhancements Hydrologic Research Center, USA Technical Developer SAOFFG Steering Committee Meeting 1 10-12 July 2017 Jakarta, INDONESIA Theresa M. Modrick Hansen, PhD
3/3/2013. The hydro cycle water returns from the sea. All "toilet to tap." Introduction to Environmental Geology, 5e
 Introduction to Environmental Geology, 5e Running Water: summary in haiku form Edward A. Keller Chapter 9 Rivers and Flooding Lecture Presentation prepared by X. Mara Chen, Salisbury University The hydro
Engineering Hydrology
 Engineering Hydrology Prof. Rajesh Bhagat Asst. Professor Civil Engineering Department Yeshwantrao Chavan College Of Engineering Nagpur B. E. (Civil Engg.) M. Tech. (Enviro. Engg.) GCOE, Amravati VNIT,
Modeling Great Britain s Flood Defenses. Flood Defense in Great Britain. By Dr. Yizhong Qu
 Modeling Great Britain s Flood Defenses AIRCurrents Editor s note: AIR launched its Inland Flood Model for Great Britain in December 2008. The hazard module captures the physical processes of rainfall-runoff
Which map shows the stream drainage pattern that most likely formed on the surface of this volcano? A) B)
 B)") 1. When snow cover on the land melts, the water will most likely become surface runoff if the land surface is A) frozen B) porous C) grass covered D) unconsolidated gravel Base your answers to questions
1. When snow cover on the land melts, the water will most likely become surface runoff if the land surface is A) frozen B) porous C) grass covered D) unconsolidated gravel Base your answers to questions
STREAM SYSTEMS and FLOODS
 STREAM SYSTEMS and FLOODS The Hydrologic Cycle Precipitation Evaporation Infiltration Runoff Transpiration Earth s Water and the Hydrologic Cycle The Hydrologic Cycle The Hydrologic Cycle Oceans not filling
Precipitation Evaporation Infiltration Earth s Water and the Hydrologic Cycle. Runoff Transpiration
 STREAM SYSTEMS and FLOODS The Hydrologic Cycle Precipitation Evaporation Infiltration Earth s Water and the Hydrologic Cycle Runoff Transpiration The Hydrologic Cycle The Hydrologic Cycle Oceans not filling
STUDY GUIDE FOR CONTENT MASTERY. Surface Water Movement
 Surface Water SECTION 9.1 Surface Water Movement In your textbook, read about surface water and the way in which it moves sediment. Complete each statement. 1. An excessive amount of water flowing downslope
WATER ON AND UNDER GROUND. Objectives. The Hydrologic Cycle
 WATER ON AND UNDER GROUND Objectives Define and describe the hydrologic cycle. Identify the basic characteristics of streams. Define drainage basin. Describe how floods occur and what factors may make
Appendix E Guidance for Shallow Flooding Analyses and Mapping
 Appendix E Guidance for Shallow Flooding Analyses and Mapping E.1 Introduction Different types of shallow flooding commonly occur throughout the United States. Types of flows that result in shallow flooding
12 SWAT USER S MANUAL, VERSION 98.1
 12 SWAT USER S MANUAL, VERSION 98.1 CANOPY STORAGE. Canopy storage is the water intercepted by vegetative surfaces (the canopy) where it is held and made available for evaporation. When using the curve
Ground Water Protection Council 2017 Annual Forum Boston, Massachusetts. Ben Binder (303)
") Ground Water Protection Council 2017 Annual Forum Boston, Massachusetts Protecting Groundwater Sources from Flood Borne Contamination Ben Binder (303) 860-0600 Digital Design Group, Inc. The Problem Houston
Ground Water Protection Council 2017 Annual Forum Boston, Massachusetts Protecting Groundwater Sources from Flood Borne Contamination Ben Binder (303) 860-0600 Digital Design Group, Inc. The Problem Houston
Erosion Surface Water. moving, transporting, and depositing sediment.
 + Erosion Surface Water moving, transporting, and depositing sediment. + Surface Water 2 Water from rainfall can hit Earth s surface and do a number of things: Slowly soak into the ground: Infiltration
TABLE OF CONTENTS LIST OF TABLES. Page
 TABLE OF CONTENTS Page 11.0 EFFECTS OF THE ENVIRONMENT ON THE PROJECT... 11-1 11.1 Weather Conditions... 11-1 11.2 Flooding... 11-2 11.3 Forest Fires... 11-2 11.4 Permafrost and Subsidence Risk... 11-3
Catastrophic Events Impact on Ecosystems
 Catastrophic Events Impact on Ecosystems Hurricanes Hurricanes An intense, rotating oceanic weather system with sustained winds of at least 74 mph and a welldefined eye Conditions for formation: Warm water
Lecture 14: Floods. Key Questions
 Lecture 14: Floods Key Questions 1. What is an upstream flood? 2. What is a downstream flood? 3. What were the setup conditions that cause floods? 4. What is a 100-year flood? 5. How are 100-year flood
A Public Guide to Storm and Flood Hydrology. Version 2, August 2017
 Version 2, 2017 A Public Guide to Storm and Flood Hydrology Version 2, August 2017 Prepared by: Published by: Diagrams by: Photos by: Grant Witheridge, Catchments & Creeks Pty Ltd Catchments & Creeks Pty
SEVERE WEATHER 101. Flood Basics
 SEVERE WEATHER 101 Flood Basics What is flooding? Flooding is an overflowing of water onto land that is normally dry. Floods can happen during heavy rains, when ocean waves come on shore, when snow melts
Using Weather and Climate Information for Landslide Prevention and Mitigation
 Using Weather and Climate Information for Landslide Prevention and Mitigation Professor Roy C. Sidle Disaster Prevention Research Institute Kyoto University, Japan International Workshop on Climate and
Section 4: Model Development and Application
 Section 4: Model Development and Application The hydrologic model for the Wissahickon Act 167 study was built using GIS layers of land use, hydrologic soil groups, terrain and orthophotography. Within
Continuing Education Associated with Maintaining CPESC and CESSWI Certification
 Continuing Education Associated with Maintaining CPESC and CESSWI Certification Module 2: Stormwater Management Principles for Earth Disturbing Activities Sponsors: ODOTs Local Technical Assistance Program
SECTION II Hydrological risk
 Chapter 3 Understanding disaster risk: hazard related risk issues SECTION II Hydrological risk Peter Salamon Coordinating lead author Hannah Cloke Lead author 3.4 Giuliano di Baldassarre Owen Landeg Florian
Severe Weather Watches, Advisories & Warnings
 Severe Weather Watches, Advisories & Warnings Tornado Watch Issued by the Storm Prediction Center when conditions are favorable for the development of severe thunderstorms and tornadoes over a larger-scale
Gully Erosion Part 1 GULLY EROSION AND ITS CAUSES. Introduction. The mechanics of gully erosion
 Gully Erosion Part 1 GULLY EROSION AND ITS CAUSES Gully erosion A complex of processes whereby the removal of soil is characterised by incised channels in the landscape. NSW Soil Conservation Service,
Flash flood disaster in Bayangol district, Ulaanbaatar
 Flash flood disaster in Bayangol district, Ulaanbaatar Advanced Training Workshop on Reservoir Sedimentation Management 10-16 October 2007. IRTCES, Beijing China Janchivdorj.L, Institute of Geoecology,MAS
Geog Lecture 19
 Geog 1000 - Lecture 19 Fluvial Geomorphology and River Systems http://scholar.ulethbridge.ca/chasmer/classes/ Today s Lecture (Pgs 346 355) 1. What is Fluvial Geomorphology? 2. Hydrology and the Water
MEGACITIES AND DISASTER RISK - THE CASE OF MUMBAI
 Municipal Corporation of Greater Mumbai, India MEGACITIES AND DISASTER RISK - THE CASE OF MUMBAI Presentation by S S KSHATRIYA Municipal Commissioner MUMBAI Largest city in India 6 th Largest metropolis
Determination of Urban Runoff Using ILLUDAS and GIS
 Texas A&M University Department of Civil Engineering Instructor: Dr. Francisco Olivera CVEN689 Applications of GIS to Civil Engineering Determination of Urban Runoff Using ILLUDAS and GIS Tae Jin Kim 03.
Advanced /Surface Hydrology Dr. Jagadish Torlapati Fall 2017 MODULE 2 - ROUTING METHODS
 Routing MODULE - ROUTING METHODS Routing is the process of find the distribution of flow rate and depth in space and time along a river or storm sewer. Routing is also called Flow routing or flood routing.
Need of Proper Development in Hilly Urban Areas to Avoid
 Need of Proper Development in Hilly Urban Areas to Avoid Landslide Hazard Dr. Arvind Phukan, P.E. Cosultant/Former Professor of Civil Engineering University of Alaska, Anchorage, USA RI District Governor
INDIAN INSTITUTE OF SCIENCE STOCHASTIC HYDROLOGY. Course Instructor : Prof. P. P. MUJUMDAR Department of Civil Engg., IISc.
 INDIAN INSTITUTE OF SCIENCE STOCHASTIC HYDROLOGY Course Instructor : Prof. P. P. MUJUMDAR Department of Civil Engg., IISc. Course Contents Introduction to Random Variables (RVs) Probability Distributions
[1] Performance of the sediment trap depends on the type of outlet structure and the settling pond surface area.
![[1] Performance of the sediment trap depends on the type of outlet structure and the settling pond surface area.](/thumbs/76/74245181.jpg "[1] Performance of the sediment trap depends on the type of outlet structure and the settling pond surface area.") Sediment Trench SEDIMENT CONTROL TECHNIQUE Type 1 System Sheet Flow Sandy Soils Type 2 System [1] Concentrated Flow Clayey Soils Type 3 System [1] Supplementary Trap Dispersive Soils [1] Performance of
Sediment Trench SEDIMENT CONTROL TECHNIQUE Type 1 System Sheet Flow Sandy Soils Type 2 System [1] Concentrated Flow Clayey Soils Type 3 System [1] Supplementary Trap Dispersive Soils [1] Performance of
INTRODUCTION TO HEC-HMS
 INTRODUCTION TO HEC-HMS Hydrologic Engineering Center- Hydrologic Modeling System US Army Corps of Engineers Hydrologic Engineering Center HEC-HMS Uses Schematics Enter properties: watershed, rivers (reaches),
 12 10 8 6 4 2 0 40-50 50-60 60-70 70-80 80-90 90-100 Fresh Water What we will cover The Hydrologic Cycle River systems Floods Groundwater Caves and Karst Topography Hot springs Distribution of water in
SPECIFIC DEGRADATION AND RESERVOIR SEDIMENTATION. By Renee Vandermause & Chun-Yao Yang
 SPECIFIC DEGRADATION AND RESERVOIR SEDIMENTATION By Renee Vandermause & Chun-Yao Yang Outline Sediment Degradation - Erosion vs Sediment Yield - Sediment Yield - Methods for estimation - Defining Sediment
Subject Name: SOIL AND WATER CONSERVATION ENGINEERING 3(2+1) COURSE OUTLINE
 COURSE OUTLINE") Subject Name: SOIL AND WATER CONSERVATION ENGINEERING 3(2+1) COURSE OUTLINE (Name of Course Developer: Prof. Ashok Mishra, AgFE Department, IIT Kharagpur, Kharagpur 721 302) Module 1: Introduction and
Subject Name: SOIL AND WATER CONSERVATION ENGINEERING 3(2+1) COURSE OUTLINE (Name of Course Developer: Prof. Ashok Mishra, AgFE Department, IIT Kharagpur, Kharagpur 721 302) Module 1: Introduction and
Monte Carlo Simulations for Probabilistic Flood Hazard Assessment
 Monte Carlo Simulations for Probabilistic Flood Hazard Assessment Jemie Dababneh, Ph.D., P.E., 1 and Mark Schwartz, P.E. 1 1 RIZZO Associates, Monroeville, Pennsylvania Presentation to PSA 2017 International
Impact assessment on disasters
 The 5th International Coordination Group (ICG) Meeting GEOSS Asian Water Cycle Initiative (AWCI), Dec. 16, 2009. Impact assessment on disasters Eiichi Nakakita Disaster Prevention Research Institute Kyoto
CIVIL ENGINEERING. Engineering Hydrology RIB-R T11 RIB. Detailed Explanations. Rank Improvement Batch ANSWERS. RIB(R)-18 CE Engineering Hydrology
-18 CE Engineering Hydrology") RIB-R T11 RIB Rank Improvement Batch Session 18-1 S.No. : 118_SK CIVIL ENGINEERING Engineering Hydrology ANSWERS 1. (b) 7. (c) 1. (c) 1. (b). (d). (c) 8. (a) 1. (a). (b). (c). (a). (d) 1. (c) 1. (a) 7.
RIB-R T11 RIB Rank Improvement Batch Session 18-1 S.No. : 118_SK CIVIL ENGINEERING Engineering Hydrology ANSWERS 1. (b) 7. (c) 1. (c) 1. (b). (d). (c) 8. (a) 1. (a). (b). (c). (a). (d) 1. (c) 1. (a) 7.
INFLOW DESIGN FLOOD CONTROL SYSTEM PLAN 40 C.F.R. PART PLANT YATES ASH POND 2 (AP-2) GEORGIA POWER COMPANY
 GEORGIA POWER COMPANY") INFLOW DESIGN FLOOD CONTROL SYSTEM PLAN 40 C.F.R. PART 257.82 PLANT YATES ASH POND 2 (AP-2) GEORGIA POWER COMPANY EPA s Disposal of Coal Combustion Residuals from Electric Utilities Final Rule (40 C.F.R.
INFLOW DESIGN FLOOD CONTROL SYSTEM PLAN 40 C.F.R. PART 257.82 PLANT YATES ASH POND 2 (AP-2) GEORGIA POWER COMPANY EPA s Disposal of Coal Combustion Residuals from Electric Utilities Final Rule (40 C.F.R.
In the space provided, write the letter of the description that best matches the term or phrase. a. any form of water that falls to Earth s
 Skills Worksheet Concept Review In the space provided, write the letter of the description that best matches the term or phrase. 1. condensation 2. floodplain 3. watershed 4. tributary 5. evapotranspiration
Tarbela Dam in Pakistan. Case study of reservoir sedimentation
 Tarbela Dam in Pakistan. HR Wallingford, Wallingford, UK Published in the proceedings of River Flow 2012, 5-7 September 2012 Abstract Reservoir sedimentation is a main concern in the Tarbela reservoir
FLOODING. Flood any relatively high stream flow overtopping the natural or artificial banks in a water system.
 CATASTROPHIC EVENTS FLOODING Flood any relatively high stream flow overtopping the natural or artificial banks in a water system. Common Causes: Long-lasting rainfall over a broad area Locally intense
Hydrologic Overview & Quantities
 Hydrologic Overview & Quantities It is important to understand the big picture when attempting to forecast. This includes the interactive components and hydrologic quantities. Hydrologic Cycle The complexity
Appendix D. Model Setup, Calibration, and Validation
 . Model Setup, Calibration, and Validation Lower Grand River Watershed TMDL January 1 1. Model Selection and Setup The Loading Simulation Program in C++ (LSPC) was selected to address the modeling needs
Running Water Earth - Chapter 16 Stan Hatfield Southwestern Illinois College
 Running Water Earth - Chapter 16 Stan Hatfield Southwestern Illinois College Hydrologic Cycle The hydrologic cycle is a summary of the circulation of Earth s water supply. Processes involved in the hydrologic
River/Stream Erosion Notes
 Name Date ES per Mr. Williams River/Stream Erosion Notes Erosion: the of weathered material. FACT: Running water moves more sediment than ANY other type of erosion. 1. The Water Cycle What happens when
EFFECTIVE DAM OPERATION METHOD BASED ON INFLOW FORECASTING FOR SENANAYAKA SAMUDRA RESERVOIR, SRI LANKA
 EFFECTIVE DAM OPERATION METHOD BASED ON INFLOW FORECASTING FOR SENANAYAKA SAMUDRA RESERVOIR, SRI LANKA Muthubanda Appuhamige Sanath Susila GUNASENA (MEE13632) Supervisors: Dr. Mamoru Miyamoto, Dr. Duminda
H Y D R O L O G Y I R R I G A T I O N C E
 H Y D R O L O G Y & I R R I G A T I O N C E Chapter 1: HYDROLOGICAL CYCLE AND PRECIPITATION 7 HYDROLOGIC CYCLE... 7 PRECIPITATION... 8 MEASUREMENT OF PRECIPITATION... 9 ESTIMATION OF MISSING DATA... 15
An overview of the applications for early warning and mapping of the flood events in New Brunswick
 Flood Recovery, Innovation and Reponse IV 239 An overview of the applications for early warning and mapping of the flood events in New Brunswick D. Mioc 1, E. McGillivray 2, F. Anton 1, M. Mezouaghi 2,
NRC Workshop Probabilistic Flood Hazard Assessment (PFHA) Jan 29-31, Mel Schaefer Ph.D. P.E. MGS Engineering Consultants, Inc.
 Jan 29-31, Mel Schaefer Ph.D. P.E. MGS Engineering Consultants, Inc.") Stochastic Event Flood Model (SEFM) Stochastic Modeling of Extreme Floods A Hydrological Tool for Analysis of Extreme Floods Mel Schaefer Ph.D. P.E. MGS Engineering Consultants, Inc. Olympia, WA NRC Workshop
Stochastic Event Flood Model (SEFM) Stochastic Modeling of Extreme Floods A Hydrological Tool for Analysis of Extreme Floods Mel Schaefer Ph.D. P.E. MGS Engineering Consultants, Inc. Olympia, WA NRC Workshop
Surface Processes Focus on Mass Wasting (Chapter 10)
") Surface Processes Focus on Mass Wasting (Chapter 10) 1. What is the distinction between weathering, mass wasting, and erosion? 2. What is the controlling force in mass wasting? What force provides resistance?
Surface Processes Focus on Mass Wasting (Chapter 10) 1. What is the distinction between weathering, mass wasting, and erosion? 2. What is the controlling force in mass wasting? What force provides resistance?
APPROACH TO THE SPANISH WATER ORGANISATION IMPROVING FLOOD HAZARD MAPPING, LAWS AND AUTHORITIES COORDINATION
 "Workshop On Land Use Planning And Water Management, With Focus On Flood Risk Management Oslo, Norway. Wednesday 31 January and Thursday 1 February 2007 APPROACH TO THE SPANISH WATER ORGANISATION IMPROVING
Science EOG Review: Landforms
 Mathematician Science EOG Review: Landforms Vocabulary Definition Term canyon deep, large, V- shaped valley formed by a river over millions of years of erosion; sometimes called gorges (example: Linville
Estimating Probable Maximum Precipitation for Linau River Basin in Sarawak
 Estimating Probable Maximum Precipitation for Linau River Basin in Sarawak M. Hussain, S. Nadya and F.J. Chia Hydropower Development Division, Sarawak Energy Berhad, 93050, Kuching, Sarawak, Malaysia Date
INDIAN INSTITUTE OF SCIENCE STOCHASTIC HYDROLOGY. Lecture -27 Course Instructor : Prof. P. P. MUJUMDAR Department of Civil Engg., IISc.
 INDIAN INSTITUTE OF SCIENCE STOCHASTIC HYDROLOGY Lecture -27 Course Instructor : Prof. P. P. MUJUMDAR Department of Civil Engg., IISc. Summary of the previous lecture Frequency factors Normal distribution
INTERNATIONAL JOURNAL OF PURE AND APPLIED RESEARCH IN ENGINEERING AND TECHNOLOGY
 INTERNATIONAL JOURNAL OF PURE AND APPLIED RESEARCH IN ENGINEERING AND TECHNOLOGY A PATH FOR HORIZING YOUR INNOVATIVE WORK ASSESSMENT OF RESERVOIR SEDIMENTATION IN PANSHET RESERVOIR BY HYBRID METHOD N.
Assessing Hazards and Risk
 Page 1 of 6 EENS 204 Tulane University Natural Disasters Prof. Stephen A. Nelson Assessing Hazards and Risk This page last updated on 07-Jan-2004 As discussed before, natural disasters are produced by
Title: Concepts of Flood Risk
 Title: Concepts of Flood Risk Title Prepared by: Dr. Mohammed Abdulkadir and Dr. Micha Werner Outline of presentation Hazards Flood Event Flood losses Classification of floods Flood management Concepts
Caribbean Early Warning System Workshop
 Caribbean Early Warning System Workshop Hamonization in Existing EWS April 14-16, 2016 Presenter: Shawn Boyce Caribbean Institute for Meteorology and Hydrology Husbands, St. James Barbados Background Between
CARFFG System Development and Theoretical Background
 CARFFG Steering Committee Meeting 15 SEPTEMBER 2015 Astana, KAZAKHSTAN CARFFG System Development and Theoretical Background Theresa M. Modrick, PhD Hydrologic Research Center Key Technical Components -
Hydrologic Forecast Centre Manitoba Infrastructure, Winnipeg, Manitoba. FEBRUARY OUTLOOK REPORT FOR MANITOBA February 23, 2018
 Page 1 of 17 Hydrologic Forecast Centre Manitoba Infrastructure, Winnipeg, Manitoba FEBRUARY OUTLOOK REPORT FOR MANITOBA February 23, 2018 Overview The February Outlook Report prepared by the Hydrologic
Environmental Geology Chapter 9 Rivers and Flooding
 Environmental Geology Chapter 9 Rivers and Flooding Flooding in Pakistan 2010-1600 killed/20000 affected The hydrologic cycle is powered by the Sun The cycle includes evaporation, precipitation, infiltration,
Hydrologic Forecast Centre Manitoba Infrastructure, Winnipeg, Manitoba. MARCH OUTLOOK REPORT FOR MANITOBA March 23, 2018
 Page 1 of 21 Hydrologic Forecast Centre Manitoba Infrastructure, Winnipeg, Manitoba MARCH OUTLOOK REPORT FOR MANITOBA March 23, 2018 Overview The March Outlook Report prepared by the Hydrologic Forecast
COMMUNITY EMERGENCY RESPONSE TEAM FLOODS INTRODUCTION
 INTRODUCTION Floods are one of the most common hazards in the United States. A flood occurs any time a body of water rises to cover what is usually dry land. Flood effects can be local, impacting a neighborhood
Science of Natural Disasters: RIVERS& FLOODS! 27 April 2016
 Science of Natural Disasters: RIVERS& FLOODS! 27 April 2016 Rebecca Clotts Department of Geology, University of St Thomas Flood in St Paul, 2014, Star Tribune 1 2 What is a watershed? 3 4 5 6 7 What is
MODELLING FROST RISK IN APPLE TREE, IRAN. Mohammad Rahimi
 WMO Regional Seminar on strategic Capacity Development of National Meteorological and Hydrological Services in RA II (Opportunity and Challenges in 21th century) Tashkent, Uzbekistan, 3-4 December 2008
Outline. Remote Sensing, GIS and DEM Applications for Flood Monitoring. Introduction. Satellites and their Sensors used for Flood Mapping
 Outline Remote Sensing, GIS and DEM Applications for Flood Monitoring Prof. D. Nagesh Kumar Chairman, Centre for Earth Sciences Professor, Dept. of Civil Engg. Indian Institute of Science Bangalore 560
CASE STUDY NATHPA JHAKRI, INDIA
 SEDIMENT MANAGEMENT CASE STUDY NATHPA JHAKRI, INDIA Key project features Name: Nathpa Jhakri Country: India Category: reduce sediment production (watershed management); upstream sediment trapping; bypass
Design Storms for Hydrologic Analysis
 Design Storms for Hydrologic Analysis Course Description This course is designed to fulfill two hours of continuing education credit for Professional Engineers. Its objective is to provide students with
Sediment Trap. A temporary runoff containment area, which promotes sedimentation prior to discharge of the runoff through a stabilized spillway.
 Sediment Trap SC-15 Source: Caltrans Construction Site Best Management Practices Manual, 2003. Description A temporary runoff containment area, which promotes sedimentation prior to discharge of the runoff
Rock Sizing for Batter Chutes
 Rock Sizing for Batter Chutes STORMWATER MANAGEMENT PRACTICES Photo 1 Rock-lined batter chute Photo 2 Rock-lined batter chute 1. Introduction In the stormwater industry a chute is a steep drainage channel,
FOREST RESEARCH INSTITUTE, DEHRADUN
 PROJECT REPORT DRAINAGE AND REPLENISHMENT STUDY OF MINED AREA OF GANGA SHYAMPUR RIVER HARIDWAR Submitted to UTTARAKHAND FOREST DEVELOPMENT CORPORATION (UFDC) 73, Nehru Road, Deharadun Prepared&Submitted
David R. Vallee Hydrologist-in-Charge NOAA/NWS Northeast River Forecast Center
 David R. Vallee Hydrologist-in-Charge NOAA/NWS Northeast River Forecast Center Record flooding along the Shawsheen River during the 2006 Mother s Day Floods Calibrate and implement a variety of hydrologic
FHWA - HIGHWAY HYDROLOGY
 The unit peak discharge is computed with Equation 5.6 by interpolating c 0, c, and c Table 5.5 using a type II distribution. The peak discharge is also calculated as follows. from Variable SI Unit U Unit.5444
Land and Water Summative Assessment. Name Date
 Land and Water Summative Assessment Name Date Read each question carefully and select the best answer. 1. Abby built a model to study how rain changes the land. She shaped the land into single, smooth
Stream Geomorphology. Leslie A. Morrissey UVM July 25, 2012
 Stream Geomorphology Leslie A. Morrissey UVM July 25, 2012 What Functions do Healthy Streams Provide? Flood mitigation Water supply Water quality Sediment storage and transport Habitat Recreation Transportation
SNOW AND GLACIER HYDROLOGY
 SNOW AND GLACIER HYDROLOGY by PRATAP SINGH National Institute of Hydrology, Roorkee, India and VIJAY P. SINGH Department of Civil and Environmental Engineering, Louisiana State University, Baton Rouge,
ISSN Vol.03,Issue.10 May-2014, Pages:
 www.semargroup.org, www.ijsetr.com ISSN 2319-8885 Vol.03,Issue.10 May-2014, Pages:2187-2191 YIN YIN HTWE 1, AYE AYE THANT 2 1 Dept of Civil Engineering, Mandalay Technological University, Mandalay, Myanmar,
CASE STUDY NATHPA JHAKRI, INDIA
 SEDIMENT MANAGEMENT CASE STUDY NATHPA JHAKRI, INDIA Key project features Name: Nathpa Jhakri Country: India Category: reforestation/revegetation; upstream sediment trapping; bypass channel/tunnel; reservoir
Laboratory Exercise #3 The Hydrologic Cycle and Running Water Processes
 Laboratory Exercise #3 The Hydrologic Cycle and Running Water Processes page - 1 Section A - The Hydrologic Cycle Figure 1 illustrates the hydrologic cycle which quantifies how water is cycled throughout
Sediment Trap. At multiple locations within the project site where sediment control is needed.
 Sediment Trap SE-3 Objectives EC Erosion Control SE Sediment Control TR Tracking Control WE Wind Erosion Control Non-Stormwater NS Management Control Waste Management and WM Materials Pollution Control
Assessment of the catastrophic events originated in the river Vere basin
 Assessment of the catastrophic events originated in the river Vere basin Tbilisi, Georgia Presenter: Irakli Megrelidze Deputy Head of Hydrometeorological Department (National Environmental Agency) Hydrology
Regional Flash Flood Guidance and Early Warning System
 WMO Training for Trainers Workshop on Integrated approach to flash flood and flood risk management 24-28 October 2010 Kathmandu, Nepal Regional Flash Flood Guidance and Early Warning System Dr. W. E. Grabs
OIKOS > landslide > mechanism >predisposing causes
 predisposing causes and trigger OIKOS > landslide > mechanism >predisposing causes Landslides are events that occur in space and time. As such, it is usually possible to identify both one or more landslide
STREUVER FIDELCO CAPPELLI, LLC YONKERS DOWNTOWN DEVELOPMENT PHASE 1. DRAFT ENVIRONMENTAL IMPACT STATEMENT For: PALISADES POINT
 STREUVER FIDELCO CAPPELLI, LLC YONKERS DOWNTOWN DEVELOPMENT PHASE 1 DRAFT ENVIRONMENTAL IMPACT STATEMENT For: PALISADES POINT Prepared by: PAULUS, SOKOLOWSKI & SARTOR STORMWATER MANAGEMENT 1. Methodology
Year 6. Geography. Revision
 Year 6 Geography Revision November 2017 Rivers and World knowledge How the water cycle works and the meaning of the terms evaporation, condensation, precipitation, transpiration, surface run-off, groundwater
HW #2 Landscape Travel from A to B 12,
 HW #2 Landscape 2016 Section: Name: ate: 1. ase your answer(s) to the following question(s) on the map below, which represents two bridges that cross the Green River. Letters,, and represent locations
Integrating Hydrologic and Storm Surge Models for Improved Flood Warning
 Integ Hydrologic and Storm Surge Models for Improved Flood Warning Leahy, C.P, Entel, M, Sooriyakumaran, S, and Warren, G Flood Warning Program Office, Bureau of Meteorology, Docklands, Victoria National
Thermal / Solar. When air is warmed it... Rises. Solar Energy. Evaporation. Condensation Forms Clouds
 Thermal / Solar Light from the Sun is transformed into what type of energy when it hits Earth's surface? Rises When air is warmed it... Solar Energy Water moves through the water cycle using what type
FLORA: FLood estimation and forecast in complex Orographic areas for Risk mitigation in the Alpine space
 Natural Risk Management in a changing climate: Experiences in Adaptation Strategies from some European Projekts Milano - December 14 th, 2011 FLORA: FLood estimation and forecast in complex Orographic