TESTING AND MEASUREMENT IN PSYCHOLOGY. Merve Denizci Nazlıgül, M.S.
|
|
|
- Brooke Norman
- 5 years ago
- Views:
Transcription
1 TESTING AND MEASUREMENT IN PSYCHOLOGY Merve Denizci Nazlıgül, M.S.
2 PREPARING THE DATA FOR ANALYSIS 1. ACCURACY OF DATA FILE 1st step SPSS FREQUENCIES For continuous variables, are all the values within range? Are means and standard deviations plausible? If you have discrete variables (such as categories of religious affiliation), are there any out-of-range numbers? Have you accurately programmed your codes for missing values?
3 PREPARING THE DATA FOR ANALYSIS 2. MISSING DATA 1st step The pattern of missing data is more important than the amount missing. Missing values scattered randomly through a data matrix pose less serious problems. Nonrandomly missing values, on the other hand, are serious no matter how few of them there are because they affect the generalizability of results. Suppose that in a questionnaire with both attitudinal and demographic questions several respondents refuse to answer questions about income. It is likely that refusal to answer questions about income is related to attitude.

4 PREPARING THE DATA FOR ANALYSIS


5 PREPARING THE DATA FOR ANALYSIS
.")
6 PREPARING THE DATA FOR ANALYSIS According to Little s MCAR test; he data were missing completely at random since the p-value is not significant (χ 2 = 3.64, df = 4, p =.46).
7 PREPARING THE DATA FOR ANALYSIS 2. MISSING DATA 2nd step Use Analyze > Descriptive Statistics > Frequencies Look at the frequency tables to see how much missing If the amount is more than 5%, there is too much. Need analyze further.

8 2. MISSING DATA 3rd step Replace with mean Mean replacement only for continuous variables PREPARING THE DATA FOR ANALYSIS

9 2. MISSING DATA 3rd step Replace with mean PREPARING THE DATA FOR ANALYSIS

10 PREPARING THE DATA FOR ANALYSIS
11 Scale for Measuring Attitudes Towards Mathematics or Science Strongly agree Agree Undecided Disagree Strongly disagree REVERSE SCORING 1. I want to develop my mathematical (science) skills and study this subject more. 2. Mathematics (science) is not a very interesting subject. 3. Mathematics (science) is a very worthwhile and necessary subject. 4. Mathematics (Science) makes me feel nervous and uncomfortable. 5. I have usually enjoyed studying mathematics (science) in school. 6. I don t want to take any more mathematics (science) than I absolutely have to Other subjects are more important to people than mathematics (science). 8. I am very calm and unafraid when studying mathematics (Science). 9. I have seldom liked studying mathematics (Science) I am interested in acquiring further knowledge of mathematics (science)
12 REVERSE SCORING BUT FIRST; REVERSE SCORING E.g; item 2 (Mathematics (science) is not a very interesting subject.) was phrased the opposite way. Therefore, if you have reverse phrased items then you have to also reverse the way in which they re scored before you conduct reliability analysis. Positively worded items from the questionnaire: 1, 3, 5, 8, 10 Negatively worded items from the questionnaire: 2, 4, 6, 7, 9
13 REVERSE SCORING REVERSE SCORING 1 = strongly disagree 2 = disagree 3 = undecided 4 = agree 5 = strongly agree We need to reverse scale! 1 = strongly agree 2 = agree To reverse the scoring find the max value of your response scale (in this case 5) and add one to it. Then, for each person you take this value and substract from it the score they actually got. s/o who scored originally 5, now gets 6-1=5

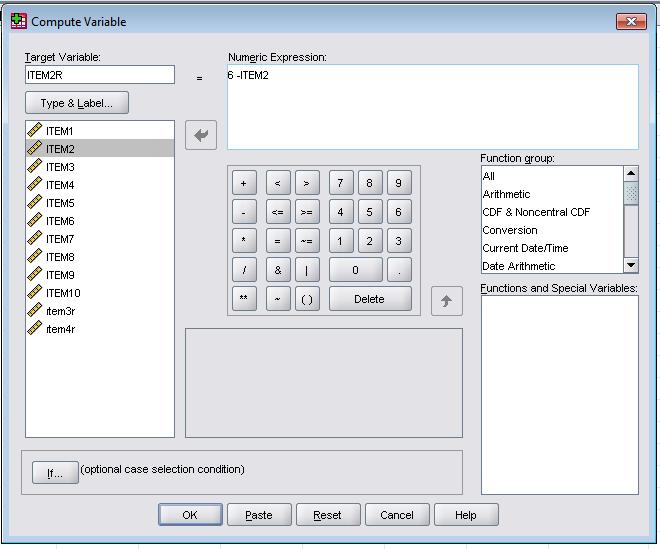
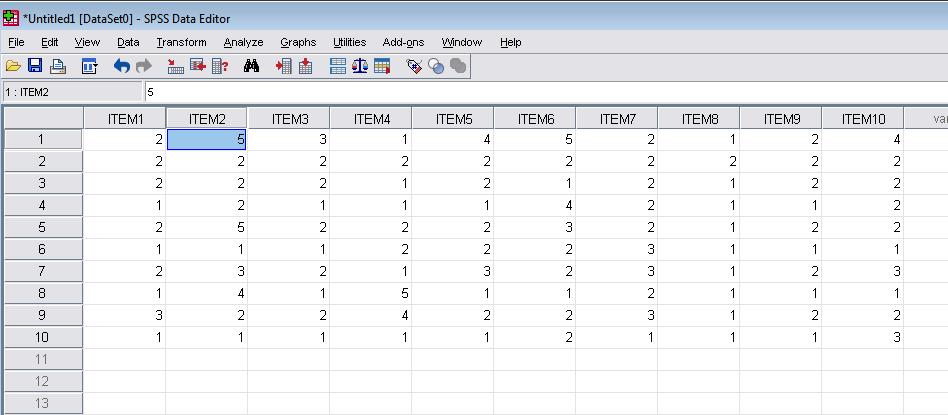
14 TRANSFORM COMPUTE...

15 REVERSE SCORING- 2ND ALTERNATIVE

16 REVERSE SCORING- 2ND ALTERNATIVE

17 REVERSE SCORING-3RD ALTERNATIVE

18 REVERSE SCORING-3RD ALTERNATIVE

19 TOTAL SCORE OF A SCALE

20 TOTAL SCORE OF A SCALE

21 RELIABILITY ANALYSIS Cronbach's alpha ANALYZE SCALE RELIABILITY ANALYSIS

22 MODEL ALPHA RELIABILITY ANALYSIS Cronbach's alpha STATISTICS SCALE SCALE IF ITEM CORRELATIONS
23 RELIABILITY ANALYSIS Cronbach's alpha Cronbach Alpha Results: Alpha = If deleting item 7, the Alpha will raise to Corrected item-total correlation should not be <.3
24 SD = Strongly disagree, D = Disagree, N = Neither, A = Agree, SA = Strongly Agree S D D N A S A 1 Statistics makes me cry O O O O O 2 My friends will think I'm stupid for not being able to cope with SPSS. O O O O O 3 Standard deviations excite me. O O O O O 4 I dream that Pearson is attacking me with correlation coefficients. O O O O O 5 I don't understand statistics. O O O O O 6 I have little experience of computers. O O O O O 7 All computers hate me. O O O O O 8 I have never been good at mathematics. O O O O O 9 My friends are better at statistics than me. O O O O O 10 Computers are useful only for playing games O O O O O 11 I did badly at mathematics at school. O O O O O People try to tell you that SPSS makes statistics easier to understand 12 but it doesn't. O O O O O I worry that I will cause irreparable damage because of my incomptence 13 with computers. O O O O O Computers have minds of their own and deliberately go wrong 14 whenever I use them. O O O O O 15 Computers are out to get me. O O O O O 16 I weep openly at the mention of central tendency. O O O O O 17 I slip into a coma whenever I see an equation. O O O O O 18 SPSS always crashes when I try to use it. O O O O O 19 Everybody looks at me when I use SPSS. O O O O O 20 I can't sleep for thoughts of eigenvectors. O O O O O I wake up under my duvet thinking that I am trapped under a normal 21 distribution. O O O O O 22 My friends are better a SPSS than I am. O O O O O 23 If I am good at statistics people will think I am a nerd. O O O O O The SAQ
25 We will determine reliability for each of the 4 subscales separately: RELIABILITY ANALYSIS Cronbach's alpha Subscale of SAQ Items Fear of computers 6,7,10,13,14,15,18 Fear of statistics 1,3,4,5,12,14,10,21 Fear of mathematics 8,11,17 Fear of negative peer evaluation 2,9,19,22,23
26 Subscale 1: Fear of computers ANALYZE SCALE RELIABILITY ANALYSIS Transfer all items of 1 factor to the Item's window, here: Subscale 1 (Items 6,7,10,13,14,15,18). Proceed alike with the other 3 subscales
 if an item is delete.")
27 Reliability analysis on SPSS 'Scale if item deleted' tests whether alpha decreases if one item is deleted. In a reliable test, this should not matter much. We therefore expect still a high alpha (>.8) if an item is delete. Click OK
28 Subscale 1: 'fear of math' Item-total Statistics The individual values should not be greater than the overall since then their deletion would improve reliability! None of the items here affect reliability substantially The Corrected Item-total correlation give us the correlations between each item and the total score from the questionnare. In a reliable scale, all items should correlate with the total. Values should not be <.3. Average =.8234 (=Cronbach's ) Subscale 1 is reliable.
29 Subscale 4: Fear of negative peer evaluation Subscale 4, however, has a poor Cronbach's =.5699 Individual 's are not higher than the overall. Subscale 4 is not reliable. Q23 has low item-total correlation What's wrong with this subscale? It might have too heterogeneous questions which decreases internal consistency. This subscale should be rethought!
30 RELIABILITY ANALYSIS Split-half Reliability 2. split-half reliability: Split the scale in half and administer it to one subject Only need one administration. o The test items are divided into two halves, with the items of the two halves matched on content and difficulty. o If the scale is consistent, the subject should obtain 2 similar scores.
31

32 RELIABILITY ANALYSIS Split-half Reliability ANALYZE SCALE RELIABILITY ANALYSIS

33 MODEL SPLIT-HALF RELIABILITY ANALYSIS Split-half Reliability STATISTICS SCALE SCALE IF ITEM CORRELATIONS
34 RELIABILITY ANALYSIS Split-half Reliability Guttman Split-half = If deleting item it4, the Alpha will raise to
Factor Analysis Using SPSS
 Factor Analysis Using SPSS For an overview of the theory of factor analysis please read Field (2000) Chapter 11 or refer to your lecture. Factor analysis is frequently used to develop questionnaires: after
2/26/2017. This is similar to canonical correlation in some ways. PSY 512: Advanced Statistics for Psychological and Behavioral Research 2
 PSY 512: Advanced Statistics for Psychological and Behavioral Research 2 What is factor analysis? What are factors? Representing factors Graphs and equations Extracting factors Methods and criteria Interpreting
Classical Test Theory. Basics of Classical Test Theory. Cal State Northridge Psy 320 Andrew Ainsworth, PhD
 Cal State Northridge Psy 30 Andrew Ainsworth, PhD Basics of Classical Test Theory Theory and Assumptions Types of Reliability Example Classical Test Theory Classical Test Theory (CTT) often called the
Using SPSS for One Way Analysis of Variance
 Using SPSS for One Way Analysis of Variance This tutorial will show you how to use SPSS version 12 to perform a one-way, between- subjects analysis of variance and related post-hoc tests. This tutorial
Review of Multiple Regression
 Ronald H. Heck 1 Let s begin with a little review of multiple regression this week. Linear models [e.g., correlation, t-tests, analysis of variance (ANOVA), multiple regression, path analysis, multivariate
An Overview of Item Response Theory. Michael C. Edwards, PhD
 An Overview of Item Response Theory Michael C. Edwards, PhD Overview General overview of psychometrics Reliability and validity Different models and approaches Item response theory (IRT) Conceptual framework
Upon completion of this chapter, you should be able to:
 1 Chaptter 7:: CORRELATIION Upon completion of this chapter, you should be able to: Explain the concept of relationship between variables Discuss the use of the statistical tests to determine correlation
Analysis of students self-efficacy, interest, and effort beliefs in general chemistry
 Electronic Supplementary Material (ESI) for Chemistry Education Research and Practice. This journal is The Royal Society of Chemistry 2015 Appendix Analysis of students self-efficacy, interest, and effort
THE TEMPERAMENTS SERIES: KNOW YOUR TEMPERAMENTAL GROUP
 THE TEMPERAMENTS SERIES: KNOW YOUR TEMPERAMENTAL GROUP This August, Pastor Wiseborn Agyare Acquah is taking to the pulpit for a special series of sermons on human temperaments. The following questionnaire
Measures of Agreement
 Measures of Agreement An interesting application is to measure how closely two individuals agree on a series of assessments. A common application for this is to compare the consistency of judgments of
Inter-Rater Agreement
 Engineering Statistics (EGC 630) Dec., 008 http://core.ecu.edu/psyc/wuenschk/spss.htm Degree of agreement/disagreement among raters Inter-Rater Agreement Psychologists commonly measure various characteristics
Measurement Theory. Reliability. Error Sources. = XY r XX. r XY. r YY
 Y -3 - -1 0 1 3 X Y -10-5 0 5 10 X Measurement Theory t & X 1 X X 3 X k Reliability e 1 e e 3 e k 1 The Big Picture Measurement error makes it difficult to identify the true patterns of relationships between
Ch. 16: Correlation and Regression
 Ch. 1: Correlation and Regression With the shift to correlational analyses, we change the very nature of the question we are asking of our data. Heretofore, we were asking if a difference was likely to
Classical Test Theory (CTT) for Assessing Reliability and Validity
 for Assessing Reliability and Validity") Classical Test Theory (CTT) for Assessing Reliability and Validity Today s Class: Hand-waving at CTT-based assessments of validity CTT-based assessments of reliability Why alpha doesn t really matter CLP
Classical Test Theory (CTT) for Assessing Reliability and Validity Today s Class: Hand-waving at CTT-based assessments of validity CTT-based assessments of reliability Why alpha doesn t really matter CLP
Outline. Reliability. Reliability. PSY Oswald
 PSY 395 - Oswald Outline Concept of What are Constructs? Construct Contamination and Construct Deficiency in General Classical Test Theory Concept of Cars (engines, brakes!) Friends (on time, secrets)
Keppel, G. & Wickens, T. D. Design and Analysis Chapter 4: Analytical Comparisons Among Treatment Means
 Keppel, G. & Wickens, T. D. Design and Analysis Chapter 4: Analytical Comparisons Among Treatment Means 4.1 The Need for Analytical Comparisons...the between-groups sum of squares averages the differences
Conflict Tactics Scales Kindergarten/Year 1 Fast Track Project Technical Report Cynthia Rains November 15, 2004
 Conflict Tactics Scales Kindergarten/Year 1 Fast Track Project Technical Report Cynthia Rains November 15, 2004 Table of Contents I. Scale Description II. Report Sample III. Scaling IV. Differences Between
Sociology Exam 1 Answer Key Revised February 26, 2007
 Sociology 63993 Exam 1 Answer Key Revised February 26, 2007 I. True-False. (20 points) Indicate whether the following statements are true or false. If false, briefly explain why. 1. An outlier on Y will
PS2: Two Variable Statistics
 PS2: Two Variable Statistics LT2: Measuring Correlation and Line of best fit by eye. LT3: Linear regression LT4: The χ 2 test of independence. 1 Pearson's Correlation Coefficient In examinations you are
Dynamics of Ocean Structures Prof. Dr. Srinivasan Chandrasekaran Department of Ocean Engineering Indian Institute of Technology, Madras
 Dynamics of Ocean Structures Prof. Dr. Srinivasan Chandrasekaran Department of Ocean Engineering Indian Institute of Technology, Madras Module - 1 Lecture - 13 Undamped and Damped Systems II (Refer Slide
1 Descriptive statistics. 2 Scores and probability distributions. 3 Hypothesis testing and one-sample t-test. 4 More on t-tests
 Overall Overview INFOWO Statistics lecture S3: Hypothesis testing Peter de Waal Department of Information and Computing Sciences Faculty of Science, Universiteit Utrecht 1 Descriptive statistics 2 Scores
F O R E W O R D. by Mane Lakic. My name is Mane Lakic and you re probably asking yourself who I am, what I do and what is the goal of this ebook?
 MINDSET FOR SUCCESS H O W Y O U R T H O U G H T S C R E A T E Y O U R F U T U R E A N D H O W T O C H A N G E Y O U R M I N D S E T I N 3 S I M P L E S T E P S F O R E W O R D by Mane Lakic Dear future
Teenager Experience of Racial Socialization Grade 8/ Year 9 Fast Track Project Technical Report Melba Nicholson September 26, 2002
 Table of Contents I. Scale Description II. Report Sample III. Scaling IV. Differences Between Groups V. Recommendations for Use VI. Item and Scale Means and SDs VII. Item and Scale s Teenager Experience
Given a sample of n observations measured on k IVs and one DV, we obtain the equation
 Psychology 8 Lecture #13 Outline Prediction and Cross-Validation One of the primary uses of MLR is for prediction of the value of a dependent variable for future observations, or observations that were
( )( b + c) = ab + ac, but it can also be ( )( a) = ba + ca. Let s use the distributive property on a couple of
( b + c) = ab + ac, but it can also be ( )( a) = ba + ca. Let s use the distributive property on a couple of") Factoring Review for Algebra II The saddest thing about not doing well in Algebra II is that almost any math teacher can tell you going into it what s going to trip you up. One of the first things they
Factoring Review for Algebra II The saddest thing about not doing well in Algebra II is that almost any math teacher can tell you going into it what s going to trip you up. One of the first things they
Principal Components Analysis
 Principal Components Analysis Lecture 9 August 2, 2011 Advanced Multivariate Statistical Methods ICPSR Summer Session #2 Lecture #9-8/2/2011 Slide 1 of 54 Today s Lecture Principal Components Analysis
KCP e-learning. test user - ability basic maths revision. During your training, we will need to cover some ground using statistics.
 During your training, we will need to cover some ground using statistics. The very mention of this word can sometimes alarm delegates who may not have done any maths or statistics since leaving school.
SPIRITUAL GIFTS. ( ) ( ) 1. Would you describe yourself as an effective public speaker?
 ( ) 1. Would you describe yourself as an effective public speaker?") SPIRITUAL GIFTS QUESTIONNAIRE: SPIRITUAL GIFTS ( ) ( ) 1. Would you describe yourself as an effective public speaker? ( ) ( ) 2. Do you find it easy and enjoyable to spend time in intense study and research
SPIRITUAL GIFTS QUESTIONNAIRE: SPIRITUAL GIFTS ( ) ( ) 1. Would you describe yourself as an effective public speaker? ( ) ( ) 2. Do you find it easy and enjoyable to spend time in intense study and research
value of the sum standard units
 Stat 1001 Winter 1998 Geyer Homework 7 Problem 18.1 20 and 25. Problem 18.2 (a) Average of the box. (1+3+5+7)=4=4. SD of the box. The deviations from the average are,3,,1, 1, 3. The squared deviations
By the time the children are four they can identify and debate many of the issues hidden in these age-old plots.
 Goldilocks and the Three Bears Traditional fairy tales can be a great way to develop the skills needed for P4C with young children, 4-7. Vivian Paley (2004), a kindergarten teacher of 38 years in the US
Sociology Research Statistics I Final Exam Answer Key December 15, 1993
 Sociology 592 - Research Statistics I Final Exam Answer Key December 15, 1993 Where appropriate, show your work - partial credit may be given. (On the other hand, don't waste a lot of time on excess verbiage.)
COMP310 MultiAgent Systems. Chapter 16 - Argumentation
 COMP310 MultiAgent Systems Chapter 16 - Argumentation Argumentation Argumentation is the process of attempting to agree about what to believe. Only a question when information or beliefs are contradictory.
Lecture 2. Estimating Single Population Parameters 8-1
 Lecture 2 Estimating Single Population Parameters 8-1 8.1 Point and Confidence Interval Estimates for a Population Mean Point Estimate A single statistic, determined from a sample, that is used to estimate
Retrieve and Open the Data
 Retrieve and Open the Data 1. To download the data, click on the link on the class website for the SPSS syntax file for lab 1. 2. Open the file that you downloaded. 3. In the SPSS Syntax Editor, click
The Inductive Proof Template
 CS103 Handout 24 Winter 2016 February 5, 2016 Guide to Inductive Proofs Induction gives a new way to prove results about natural numbers and discrete structures like games, puzzles, and graphs. All of
MALLOY PSYCH 3000 MEAN & VARIANCE PAGE 1 STATISTICS MEASURES OF CENTRAL TENDENCY. In an experiment, these are applied to the dependent variable (DV)
") MALLOY PSYCH 3000 MEAN & VARIANCE PAGE 1 STATISTICS Descriptive statistics Inferential statistics MEASURES OF CENTRAL TENDENCY In an experiment, these are applied to the dependent variable (DV) E.g., MEASURES
MALLOY PSYCH 3000 MEAN & VARIANCE PAGE 1 STATISTICS Descriptive statistics Inferential statistics MEASURES OF CENTRAL TENDENCY In an experiment, these are applied to the dependent variable (DV) E.g., MEASURES
THE PEARSON CORRELATION COEFFICIENT
 CORRELATION Two variables are said to have a relation if knowing the value of one variable gives you information about the likely value of the second variable this is known as a bivariate relation There
The Reliability of a Homogeneous Test. Measurement Methods Lecture 12
 The Reliability of a Homogeneous Test Measurement Methods Lecture 12 Today s Class Estimating the reliability of a homogeneous test. McDonald s Omega. Guttman-Chronbach Alpha. Spearman-Brown. What to do
Introduction To Confirmatory Factor Analysis and Item Response Theory
 Introduction To Confirmatory Factor Analysis and Item Response Theory Lecture 23 May 3, 2005 Applied Regression Analysis Lecture #23-5/3/2005 Slide 1 of 21 Today s Lecture Confirmatory Factor Analysis.
GOOD RESISTANCE TO MANIPULATION AND THE COMPETENCE OF APPLYING ETHICS IN MANAGEMENT
 GOOD RESISTANCE TO MANIPULATION AND THE COMPETENCE OF APPLYING ETHICS IN MANAGEMENT Daniela BELU Henri Coanda Air Force Academy, Brasov, Romania Abstract: This paper has the purpose of transmitting information
Class Introduction and Overview; Review of ANOVA, Regression, and Psychological Measurement
 Class Introduction and Overview; Review of ANOVA, Regression, and Psychological Measurement Introduction to Structural Equation Modeling Lecture #1 January 11, 2012 ERSH 8750: Lecture 1 Today s Class Introduction
Section 4. Test-Level Analyses
 Section 4. Test-Level Analyses Test-level analyses include demographic distributions, reliability analyses, summary statistics, and decision consistency and accuracy. Demographic Distributions All eligible
Summer School in Applied Psychometric Principles. Peterhouse College 13 th to 17 th September 2010
 Summer School in Applied Psychometric Principles Peterhouse College 13 th to 17 th September 2010 1 Two- and three-parameter IRT models. Introducing models for polytomous data. Test information in IRT
Probability and Samples. Sampling. Point Estimates
 Probability and Samples Sampling We want the results from our sample to be true for the population and not just the sample But our sample may or may not be representative of the population Sampling error
Algebra Terminology Part 1
 Grade 8 1 Algebra Terminology Part 1 Constant term or constant Variable Numerical coefficient Algebraic term Like terms/unlike Terms Algebraic expression Algebraic equation Simplifying Solving TRANSLATION
Bridging the gap between GCSE and A level mathematics
 Bridging the gap between GCSE and A level mathematics This booklet is designed to help you revise important algebra topics from GCSE and make the transition from GCSE to A level a smooth one. You are advised
Copyright, Nick E. Nolfi MPM1D9 Unit 6 Statistics (Data Analysis) STA-1
 STA-1") UNIT 6 STATISTICS (DATA ANALYSIS) UNIT 6 STATISTICS (DATA ANALYSIS)... 1 INTRODUCTION TO STATISTICS... 2 UNDERSTANDING STATISTICS REQUIRES A CHANGE IN MINDSET... 2 UNDERSTANDING SCATTER PLOTS #1... 3 UNDERSTANDING
UNIT 6 STATISTICS (DATA ANALYSIS) UNIT 6 STATISTICS (DATA ANALYSIS)... 1 INTRODUCTION TO STATISTICS... 2 UNDERSTANDING STATISTICS REQUIRES A CHANGE IN MINDSET... 2 UNDERSTANDING SCATTER PLOTS #1... 3 UNDERSTANDING
Do Now 18 Balance Point. Directions: Use the data table to answer the questions. 2. Explain whether it is reasonable to fit a line to the data.
 Do Now 18 Do Now 18 Balance Point Directions: Use the data table to answer the questions. 1. Calculate the balance point.. Explain whether it is reasonable to fit a line to the data.. The data is plotted
Chs. 16 & 17: Correlation & Regression
 Chs. 16 & 17: Correlation & Regression With the shift to correlational analyses, we change the very nature of the question we are asking of our data. Heretofore, we were asking if a difference was likely
T-TEST FOR HYPOTHESIS ABOUT
 T-TEST FOR HYPOTHESIS ABOUT Previously we tested the hypothesis that a sample comes from a population with a specified using the normal distribution and a z-test. But the z-test required the population
Activity 4. Life (and Death) before Seat Belts. What Do You Think? For You To Do GOALS
 before Seat Belts. What Do You Think? For You To Do GOALS") Activity 4 Life (and Death) before Seat Belts Activity 4 Life (and Death) before Seat Belts GOALS In this activity you will: Understand Newton s First Law of Motion. Understand the role of safety belts.
Activity 4 Life (and Death) before Seat Belts Activity 4 Life (and Death) before Seat Belts GOALS In this activity you will: Understand Newton s First Law of Motion. Understand the role of safety belts.
Latent Trait Reliability
 Latent Trait Reliability Lecture #7 ICPSR Item Response Theory Workshop Lecture #7: 1of 66 Lecture Overview Classical Notions of Reliability Reliability with IRT Item and Test Information Functions Concepts
California State Science Fair
 California State Science Fair How to Estimate the Experimental Uncertainty in Your Science Fair Project Part 2 -- The Gaussian Distribution: What the Heck is it Good For Anyway? Edward Ruth drruth6617@aol.com
Appendix A. Review of Basic Mathematical Operations. 22Introduction
 Appendix A Review of Basic Mathematical Operations I never did very well in math I could never seem to persuade the teacher that I hadn t meant my answers literally. Introduction Calvin Trillin Many of
Lesson 6: Algebra. Chapter 2, Video 1: "Variables"
 Lesson 6: Algebra Chapter 2, Video 1: "Variables" Algebra 1, variables. In math, when the value of a number isn't known, a letter is used to represent the unknown number. This letter is called a variable.
Math Released Item Algebra 1. System of Inequalities VF648815
 Math Released Item 2016 Algebra 1 System of Inequalities VF648815 Prompt Rubric Task is worth a total of 3 points. VF648815 Rubric Part A Score Description 1 Student response includes the following element.
Manipulating Radicals
 Lesson 40 Mathematics Assessment Project Formative Assessment Lesson Materials Manipulating Radicals MARS Shell Center University of Nottingham & UC Berkeley Alpha Version Please Note: These materials
PRACTICES AND CHALLENGES OF IMPLEMENTING LOCALLY AVAILABLE EQUIPMENT FOR TEACHING CHEMISTRY IN PRIMARY SCHOOLS OF NORTH SHEWA ZONE IN AMHARA REGION
 PRACTICES AND CHALLENGES OF IMPLEMENTING LOCALLY AVAILABLE EQUIPMENT FOR TEACHING CHEMISTRY IN PRIMARY SCHOOLS OF NORTH SHEWA ZONE IN AMHARA REGION Demisachew Shitaw Debre Birhan College of Teacher Education,
A Pilot Study on Functional Processing: Inferences of Pairwise Relationships in Systems of Three Variables. Kent L. Norman and Benjamin K.
 A Pilot Study on : Inferences of Pairwise Relationships in Systems of Three Variables Kent L. Norman and Benjamin K. Smith Laboratory for Automation Psychology and Decision Processes Department of Psychology
Rama Nada. -Ensherah Mokheemer. 1 P a g e
 - 9 - Rama Nada -Ensherah Mokheemer - 1 P a g e Quick revision: Remember from the last lecture that chi square is an example of nonparametric test, other examples include Kruskal Wallis, Mann Whitney and
Contingency Tables. Contingency tables are used when we want to looking at two (or more) factors. Each factor might have two more or levels.
 factors. Each factor might have two more or levels.") Contingency Tables Definition & Examples. Contingency tables are used when we want to looking at two (or more) factors. Each factor might have two more or levels. (Using more than two factors gets complicated,
Contingency Tables Definition & Examples. Contingency tables are used when we want to looking at two (or more) factors. Each factor might have two more or levels. (Using more than two factors gets complicated,
Multiple Regression Introduction to Statistics Using R (Psychology 9041B)
") Multiple Regression Introduction to Statistics Using R (Psychology 9041B) Paul Gribble Winter, 2016 1 Correlation, Regression & Multiple Regression 1.1 Bivariate correlation The Pearson product-moment
Multiple Regression Introduction to Statistics Using R (Psychology 9041B) Paul Gribble Winter, 2016 1 Correlation, Regression & Multiple Regression 1.1 Bivariate correlation The Pearson product-moment
Assessment Plan Pre-Assessment: Survey to gage what information students already know, what skills we need to build on, and which concepts when need
 Assessment Plan Pre-Assessment: Survey to gage what information students already know, what skills we need to build on, and which concepts when need to spend the most time on. (One the following page)
Chs. 15 & 16: Correlation & Regression
 Chs. 15 & 16: Correlation & Regression With the shift to correlational analyses, we change the very nature of the question we are asking of our data. Heretofore, we were asking if a difference was likely
Data set Science&Environment (ISSP,1993) Multiple categorical variables. Burt matrix. Indicator matrix V4a(A) Multiple Correspondence Analysis
 Multiple categorical variables. Burt matrix. Indicator matrix V4a(A) Multiple Correspondence Analysis") Data set Science&Environment (ISSP,1993) Q. SCIENCE AND ENVIRONMENT Multiple categorical variables Multiple Correspondence Analysis How much do you agree or disagree with each of these statements? Q.a
Data set Science&Environment (ISSP,1993) Q. SCIENCE AND ENVIRONMENT Multiple categorical variables Multiple Correspondence Analysis How much do you agree or disagree with each of these statements? Q.a
Instrumentation (cont.) Statistics vs. Parameters. Descriptive Statistics. Types of Numerical Data
 Statistics vs. Parameters. Descriptive Statistics. Types of Numerical Data") Norm-Referenced vs. Criterion- Referenced Instruments Instrumentation (cont.) October 1, 2007 Note: Measurement Plan Due Next Week All derived scores give meaning to individual scores by comparing them
Norm-Referenced vs. Criterion- Referenced Instruments Instrumentation (cont.) October 1, 2007 Note: Measurement Plan Due Next Week All derived scores give meaning to individual scores by comparing them
When any two whole numbers are added we always get another whole number
 UNIT 5 INTEGERS IES CASTILBLANCO DE LOS ARROYOS 1. MENTAL CALCULATION INTRODUCING INTEGERS 2. HOW MANY DIFFERENTS NUMBERS CAN I REMEMBER? Please listen these ten different situations and decide with your
Regression, part II. I. What does it all mean? A) Notice that so far all we ve done is math.
 Notice that so far all we ve done is math.") Regression, part II I. What does it all mean? A) Notice that so far all we ve done is math. 1) One can calculate the Least Squares Regression Line for anything, regardless of any assumptions. 2) But, if
Regression, part II I. What does it all mean? A) Notice that so far all we ve done is math. 1) One can calculate the Least Squares Regression Line for anything, regardless of any assumptions. 2) But, if
610 - R1A "Make friends" with your data Psychology 610, University of Wisconsin-Madison
 610 - R1A "Make friends" with your data Psychology 610, University of Wisconsin-Madison Prof Colleen F. Moore Note: The metaphor of making friends with your data was used by Tukey in some of his writings.
UNIT 3 CONCEPT OF DISPERSION
 UNIT 3 CONCEPT OF DISPERSION Structure 3.0 Introduction 3.1 Objectives 3.2 Concept of Dispersion 3.2.1 Functions of Dispersion 3.2.2 Measures of Dispersion 3.2.3 Meaning of Dispersion 3.2.4 Absolute Dispersion
CHAPTER 3. THE IMPERFECT CUMULATIVE SCALE
 CHAPTER 3. THE IMPERFECT CUMULATIVE SCALE 3.1 Model Violations If a set of items does not form a perfect Guttman scale but contains a few wrong responses, we do not necessarily need to discard it. A wrong
Sampling Distribution Models. Central Limit Theorem
 Sampling Distribution Models Central Limit Theorem Thought Questions 1. 40% of large population disagree with new law. In parts a and b, think about role of sample size. a. If randomly sample 10 people,
Item Sampler. Tennessee End of Course Assessment Biology I Form 6. Reporting Category 6: Biodiversity and Change. Student Name. Teacher Name.
 Student Name Teacher Name School System Item Sampler Tennessee End of Course Assessment Biology I Form 6 Reporting Category 6: Biodiversity and Change PEARSON Developed and published under contract with
SPR Satisfaction Survey BC Surgical Patient Registry (SPR) Satisfaction Survey 2012
 Satisfaction Survey 2012") BC Surgical Patient Registry (SPR) Satisfaction Survey 2012 July 16, 2012 Table of Contents BACKGROUND...1 RESULTS...2 1. Demographics... 2 2. Usage of the SPR... 3 3. Access to the SPR... 6 4. Value of
BC Surgical Patient Registry (SPR) Satisfaction Survey 2012 July 16, 2012 Table of Contents BACKGROUND...1 RESULTS...2 1. Demographics... 2 2. Usage of the SPR... 3 3. Access to the SPR... 6 4. Value of
Extending the Number System
 Analytical Geometry Extending the Number System Extending the Number System Remember how you learned numbers? You probably started counting objects in your house as a toddler. You learned to count to ten
ACTIVITY 2: Motion with a Continuous Force
 CHAPTER 2 Developing Ideas ACTIVITY 2: Motion with a Continuous Force Purpose In Activity 1 you saw the effect that quick pushes had on the motion of a cart. This is like the situation in many sports,
Predicates, Quantifiers and Nested Quantifiers
 Predicates, Quantifiers and Nested Quantifiers Predicates Recall the example of a non-proposition in our first presentation: 2x=1. Let us call this expression P(x). P(x) is not a proposition because x
Three Factor Completely Randomized Design with One Continuous Factor: Using SPSS GLM UNIVARIATE R. C. Gardner Department of Psychology
 Data_Analysis.calm Three Factor Completely Randomized Design with One Continuous Factor: Using SPSS GLM UNIVARIATE R. C. Gardner Department of Psychology This article considers a three factor completely
Using Microsoft Excel
 Using Microsoft Excel Objective: Students will gain familiarity with using Excel to record data, display data properly, use built-in formulae to do calculations, and plot and fit data with linear functions.
WELCOME! Lecture 13 Thommy Perlinger
 Quantitative Methods II WELCOME! Lecture 13 Thommy Perlinger Parametrical tests (tests for the mean) Nature and number of variables One-way vs. two-way ANOVA One-way ANOVA Y X 1 1 One dependent variable
ACCESS TO SCIENCE, ENGINEERING AND AGRICULTURE: MATHEMATICS 1 MATH00030 SEMESTER / Lines and Their Equations
 ACCESS TO SCIENCE, ENGINEERING AND AGRICULTURE: MATHEMATICS 1 MATH00030 SEMESTER 1 017/018 DR. ANTHONY BROWN. Lines and Their Equations.1. Slope of a Line and its y-intercept. In Euclidean geometry (where
Correlation. We don't consider one variable independent and the other dependent. Does x go up as y goes up? Does x go down as y goes up?
 Comment: notes are adapted from BIOL 214/312. I. Correlation. Correlation A) Correlation is used when we want to examine the relationship of two continuous variables. We are not interested in prediction.
Item Sampler. Tennessee End of Course Assessment Biology I Form 6. Reporting Category 6: Biodiversity and Change. Student Name. Teacher Name.
 Student Name Teacher Name School System Item Sampler Tennessee End of Course Assessment Biology I Form 6 Reporting Category 6: Biodiversity and Change PEARSON Developed and published under contract with
Uni- and Bivariate Power
 Uni- and Bivariate Power Copyright 2002, 2014, J. Toby Mordkoff Note that the relationship between risk and power is unidirectional. Power depends on risk, but risk is completely independent of power.
Black White Total Observed Expected χ 2 = (f observed f expected ) 2 f expected (83 126) 2 ( )2 126
 2 f expected (83 126) 2 ( )2 126") Psychology 60 Fall 2013 Practice Final Actual Exam: This Wednesday. Good luck! Name: To view the solutions, check the link at the end of the document. This practice final should supplement your studying;
Psychology 60 Fall 2013 Practice Final Actual Exam: This Wednesday. Good luck! Name: To view the solutions, check the link at the end of the document. This practice final should supplement your studying;
Time-Invariant Predictors in Longitudinal Models
 Time-Invariant Predictors in Longitudinal Models Today s Topics: What happens to missing predictors Effects of time-invariant predictors Fixed vs. systematically varying vs. random effects Model building
Interpreting and using heterogeneous choice & generalized ordered logit models
 Interpreting and using heterogeneous choice & generalized ordered logit models Richard Williams Department of Sociology University of Notre Dame July 2006 http://www.nd.edu/~rwilliam/ The gologit/gologit2
Sociology 593 Exam 1 February 17, 1995
 Sociology 593 Exam 1 February 17, 1995 I. True-False. (25 points) Indicate whether the following statements are true or false. If false, briefly explain why. 1. A researcher regressed Y on. When he plotted
IT 403 Practice Problems (2-2) Answers
 Answers") IT 403 Practice Problems (2-2) Answers #1. Which of the following is correct with respect to the correlation coefficient (r) and the slope of the leastsquares regression line (Choose one)? a. They will
IT 403 Practice Problems (2-2) Answers #1. Which of the following is correct with respect to the correlation coefficient (r) and the slope of the leastsquares regression line (Choose one)? a. They will
Assessing Studies Based on Multiple Regression
 Assessing Studies Based on Multiple Regression Outline 1. Internal and External Validity 2. Threats to Internal Validity a. Omitted variable bias b. Functional form misspecification c. Errors-in-variables
Newton s Laws of Motion
 Newton s Laws of Motion Background If you are driving your car at a constant speed when you put it in neutral and turn off the engine, it does not maintain a constant speed. If you stop pushing an object
Understanding Inference: Confidence Intervals I. Questions about the Assignment. The Big Picture. Statistic vs. Parameter. Statistic vs.
 Questions about the Assignment If your answer is wrong, but you show your work you can get more partial credit. Understanding Inference: Confidence Intervals I parameter versus sample statistic Uncertainty
1) How deep is the ocean, on average? a) 100 yards b) 1 mile c) 4000 meters e) 20,000 leagues f) 6000 kilometers
 How deep is the ocean, on average? a) 100 yards b) 1 mile c) 4000 meters e) 20,000 leagues f) 6000 kilometers") Ocean Literacy Survey Pre-Class, Spring, 2008 Please respond to all questions. The attitude questions have no correct answers, and you will not be penalized for incorrect answers on the science questions.
Ocean Literacy Survey Pre-Class, Spring, 2008 Please respond to all questions. The attitude questions have no correct answers, and you will not be penalized for incorrect answers on the science questions.
Orientation and New Student Program Survey with Benchmark
 Orientation and New Student Program Survey with Benchmark Which best describes your status at this institution? First-year student 0.00% 45.60% Transfer student 0.00% 54.40% Total Respondents 0 307 Did
Physics Attitudes, Skills, & Knowledge Survey (PASKS) Form 3
 Form 3") Physics Attitudes, Skills, & Knowledge Survey (PASKS) Form 3 Directions to Students: Do not open this booklet until you are told to do so. Please respond to the following items by marking the best answer
Physics Attitudes, Skills, & Knowledge Survey (PASKS) Form 3 Directions to Students: Do not open this booklet until you are told to do so. Please respond to the following items by marking the best answer
18 : ( ( ( ( ( ( ( ( ( ( ( (3-4. (1. (2. (3. (4-5» «. (4 (3 (2
 1 1389-18 25 1 25 20 50 26 25 17 75 51 25 20 100 76 25 75 : 100 : 135 : 175 : 18 : - - - (2 - - - (4 - - - (2 - - - (4 - - - (2 - - - (4 - - - (1 - - - (3-2 - - - (1 - - - (3-3 - - - (1 - - - (3-4. (1.
Chapter 18: Categorical data
 Chapter 18: Categorical data Smart Alex s Solutions Task 1 Research suggests that people who can switch off from work (Detachment) during off- hours are more satisfied with life and have fewer symptoms
EZ Play Today Richard Clayderman Music of Love, 201
 EZ Play Today Richard Clayderman Music of Love, 201 Richard Clayderman Click here if your download doesn"t start automatically EZ Play Today Richard Clayderman Music of Love, 201 Richard Clayderman EZ
The Purpose of Hypothesis Testing
 Section 8 1A:! An Introduction to Hypothesis Testing The Purpose of Hypothesis Testing See s Candy states that a box of it s candy weighs 16 oz. They do not mean that every single box weights exactly 16
Lab 1. EXCEL plus some basic concepts such as scientific notation, order of magnitude, logarithms, and unit conversions
 COMPUTER LAB 1 EARTH SYSTEMS SCIENCE I PG250 Fall 2010 Hunter College Lab 1. EXCEL plus some basic concepts such as scientific notation, order of magnitude, logarithms, and unit conversions Low Impact