Governing Rules of Water Movement
|
|
|
- Christopher Rice
- 5 years ago
- Views:
Transcription
1 Governing Rules of Water Movement Like all physical processes, the flow of water always occurs across some form of energy gradient from high to low e.g., a topographic (slope) gradient from high to low elevation Or a concentration gradient, pressure gradient, etc. All other things being equal, in a fluvial landscape that has some relief, water movement near the surface is going to follow the topographic gradient downhill Thus, by modeling terrain using a continuous surface, we can learn some useful things about the movement of water through a landscape
2 Watershed (a.k.a. Drainage Basin, Catchment) A geomorphically distinct landscape unit defined by topographic boundaries, or drainage divides that acts as a spatially discrete hydrological system

3 Water Budget Equations This leaves us with the following equation: dv = 0 = p -so-et or dt p = so + et Hornsberger, G.M., Raffensberger, J.P., Wiberg, P.L. and K.N. Eshleman Elements of Physical Hydrology, Johns Hopkins Press, U.S.A.
4 TOPMODEL Background Adapted from Ch.9 of Elements of Physical Hydrology Let s begin with the idea that the topography of the landscape exerts an enormous influence on the movement of water in the subsurface and likewise should control the movement of surface water. Therefore, we can base a model of catchment dynamics on the idea that topography is the most important landscape feature controlling water flow. Next, let's extend the idea of catchment "reservoirs" to elements of the landscape. If we could break the catchment up into blocks of a given size, we might be able to route water through each block as we move down a hillslope.
5 TOPMODEL Background Adapted from Ch.9 of Elements of Physical Hydrology Each block would differ in its position along the hillslope and in the slope of the land surface (and probably the water table) through the block. If the water table is relatively flat within a given block, the hydraulic gradient is small and we might expect an increase in water storage through time within that block. The increase in storage is even greater if the block is at the base of a convergent hillslope, such that a great deal of upslope flow into the block occurs (Figure 9.6). Figure 9.6 Local slope and contributing area control the water balance for a catchment "block." The inflow rate is proportional to the contributing area A, which depends on how long the hillslope is as well as whether it is convergent, divergent, or planar (a). The local slope controls the outflow from the blocks (b). If inflow is smaller than outflow (upper left in b), the water table declines. Conversely, if inflow is greater than outflow (lower right in b), the water table will rise and surface saturation may occur. (Hornsberger, G.M., Raffensberger, J.P., Wiberg, P.L. and K.N. Eshleman Elements of Physical Hydrology, Johns Hopkins Press, U.S.A.)
6 TOPMODEL Background Adapted from Ch.9 of Elements of Physical Hydrology One catchment model that is based on the idea that topography exerts a dominant control on flow routing through upland catchments is called TOPMODEL (Beven and Kirkby, 1979). TOPMODEL uses the equation for conservation of mass ("inflow rate minus outflow rate equals rate of change of storage") for several "reservoirs" in a catchment. By linking together the water balance equations for all of the hypothetical reservoirs in the catchment, a routing computation can be completed. Figure 9.7 Schematic diagram of the TOPMODEL concept. (Hornsberger, G.M., Raffensberger, J.P., Wiberg, P.L. and K.N. Eshleman Elements of Physical Hydrology, Johns Hopkins Press, U.S.A.)
7 TOPMODEL Background Adapted from Ch.9 of Elements of Physical Hydrology TOPMODEL performs the bookkeeping for the water balance computations in the framework of topographically defined elements and uses Darcy's law to calculate flow rates through the soil. Consider a segment of a catchment defined by a cut along an elevation contour line at the bottom, and "sides" running perpendicular to contours up to the catchment divide. Recall our assumption that flow is driven by topography; hence, the flow of subsurface water is conditioned strongly by the local topography. The degree of convergence of "flow lines" (lines perpendicular to the contours) determines how much upslope area drains to a unit length of contour at any given point.
8 TOPMODEL Background Adapted from Ch.9 of Elements of Physical Hydrology The local slope, the thickness of the soil, and the hydraulic conductivity of the soil determine the "ability" of the soil to move water farther down the slope once it has arrived at the given point. Source areas for surface runoff occur where subsurface water accumulates-points to which large upslope areas drain (such as convergent hillslopes or "hollows") and where the capacity to drain the water downslope is limited (where slopes flatten at the base of hollows). Conservation of mass can be applied to the segment depicted in Figure 9.8 to determine the fluxes. Figure 9.8 The water balance for a catchment hillslope segment. Throughfall at rate p falls on the segment of area A and thickness D. A portion, R, of this recharges the subsurface. Subsurface flow from the segment occurs at rate q subsurface. Surface flow, q overland, occurs from saturated areas (saturation-excess overland flow). The local slope at the outflow point, b, is considered to be equal to the slope of the water table. Hornsberger, G.M., Raffensberger, J.P., Wiberg, P.L. and K.N. Eshleman Elements of Physical Hydrology, Johns Hopkins Press, U.S.A.
9 TOPMODEL Background Adapted from Ch.9 of Elements of Physical Hydrology For our purposes here, we are not going to develop the TOPMODEL equations (you can always refer to Beven and Kirkby, 1979 for the full details) However, we are interested in the means by which TOPMODEL characterizes the important characteristics of a hillslope that influence the likelihood of areas of saturation developing as a function of the upslope "contributing area" and the slope of the block: TMI = ln(a/tanβ) where a is the upslope contributing area per unit contour length (A/c) and tanβ is the local slope, quantitatively captures the effect of topography. The upslope contributing area is determined by finding flow paths through the catchment, based only on the catchment topography. The contributing area is related to the accumulation of the flow paths above each point
10 Topographic Moisture Index TMI = ln(a/tanβ) Hornsberger, G.M., Raffensberger, J.P., Wiberg, P.L. and K.N. Eshleman Elements of Physical Hydrology, Johns Hopkins Press, U.S.A., p. 210 & p. 216.
11 Slope and Aspect These are measurements of terrain attributes, usually calculated from a digital elevation model Slope and aspect are calculated for each cell in the grid, by comparing a cell s elevation to that of its neighbors Usually eight neighbors are used and the result is expressed as an angle, but the exact method varies It is important to know exactly what method is used when calculating slope, and exactly how slope is defined, because different methods can give different results
12 Slope and Aspect We can calculate these topographic attributes directly from the grid-elevation values using a second-order finite difference scheme applied over a 3x3 neighborhood From ArcView 3.2 Help Slope Aspect

13 Flow Direction and Accumulation Slope and aspect are needed to produce flow direction, which assigns each cell a direction of steepest descent Flow accumulation uses flow direction to find the number of cells that drain to each cell Taking the log of accumulation makes the pattern much easier to see
14 Flow Direction Flow Direction evaluates the direction of steepest decent for each cell in the grid by comparing a cell with its eight neighbors in the following fashion: drop = change in z value / distance * 100 Note that diagonal neighbors are times as far away as 4-connected orthogonal neighbors ArcGIS encodes the resulting direction of steepest decent in the grid using the following scheme: For example: From ArcView 3.2 Help 16 X
15 Flow Accumulation Flow accumulation find the number of cells that drain to any cell in the grid, taking the flow direction grid as input: Output cells with a high flow accumulation are areas of concentrated flow and may be used to identify stream channels. Output cells with a flow accumulation of 0 are local topographic highs and may be used to identify ridges. For example: From ArcView 3.2 Help

16 Fine Scale Topographic Effects on Near Surface Soil Moisture Patterns The urbanizing landscape s greater heterogeneity impacts land cover and modifies flowpaths: Soil moisture is a key, observable hydrologic store that can be used to characterize the spatial distribution of changes in patterns and processes
17 Differences in Soil Moisture Pattern Dynamics Does the presence of urbanizing infrastructure on the landscape modify the soil moisture regime? To what extent is topography a controlling influence on soil moisture pattern dynamics in urbanizing catchments? To what extent is TMI an effective descriptor of relative wetness at different locations at the same time? Will the relationship between TMI and sampled soil moisture be different in urbanizing and control catchments?
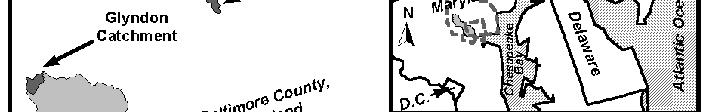
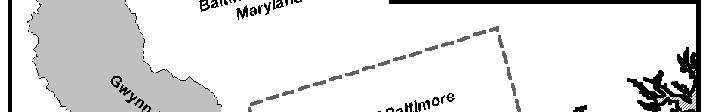
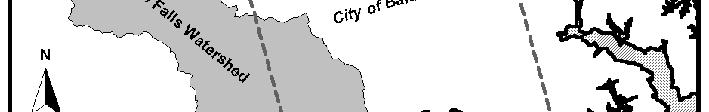
18 Study Catchments in Suburban Maryland
19 Study Catchments Catchment Land Use Area (ha) Sampling Dates Pond Branch (control) Forested /12/02, 2/21/02, 2/28/02, 3/7/02, 3/15/02, 3/29/02, 4/4/02, 4/11/02, 4/18/02, 4/24/02, 5/3/02, 5/8/02, 5/14/02, 5/20/02, 5/30/02, 6/7/02, 6/12/02, 6/19/02, 6/26/02, 7/11/02, 7/24/02, 8/15/02, 8/22/02 Glyndon (urbanizing) Low and medium density residential /1/02, 2/8/02, 2/15/02, 2/22/02, 3/1/02, 3/8/02, 3/29/02, 4/4/02, 4/11/02, 4/17/02, 4/25/02, 5/9/02, 5/16/02, 5/21/02, 5/29/02, 6/6/02, 6/12/02, 6/19/02, 6/28/02, 7/11/02, 7/19/02, 8/1/02, 8/15/02, 8/22/02
20 Pond Branch Catchment Control Color Infrared Digital Orthophotography

21 Stream Gauge at Pond Branch

22 Glyndon Catchment Urbanizing Color Infrared Digital Orthophotography

23 Incised Right Fork at Glyndon
24 Precipitation and Soil Moisture Records /1/2002 2/15/2002 3/1/2002 3/15/2002 3/29/2002 4/12/2002 4/26/2002 5/10/2002 5/24/2002 6/7/2002 6/21/2002 7/5/2002 7/19/2002 8/2/2002 8/16/2002 Date 0.00 Theta Precipitation (mm) (5.00) (10.00) (15.00) (20.00) (25.00) (30.00) (35.00) Precipitation Glyndon Pond Branch
25 Soil Moisture Sampling Method 25 samples taken using a random walk within a 5 meter circle ThetaProbe Soil Moisture Sensor - measures the impedance of the sensing rod array, a f(x) of the soil s moisture content 5 meter diameter


26 Topographic Moisture Index TMI = ln(a/tanβ) Hornsberger, G.M., Raffensberger, J.P., Wiberg, P.L. and K.N. Eshleman Elements of Physical Hydrology, Johns Hopkins Press, U.S.A., p. 210 & p. 216.

27 Pond Branch Catchment Control Topographic Index Example

28 Sources of Digital Elevation Data Catchment Area (ha) Pond Branch (control) Glyndon (urbanizing) Data Source Number of Points Points per m2 Photogrammetric LIDAR Photogrammetric LIDAR
29 Digital Elevation Models Resolutions Interpolate DEMS from photogrammetric and LIDAR spot elevations at a range of resolutions: 0.5 m to 5 m DEMs in 0.5 m increments (e.g. 0.5m, 1m, 1.5m, 2m, 2.5m, 3m, 3.5m, 4m etc.) 5 m to 30 m DEMs in 1.25 m increments (e.g. 5m, 6.25m, 7.5m, 8.75m, 10m, 11.25m etc.) For DEMs with cells smaller the field sampling size, use kernel averaging to adjust the scale (e.g. 0.5m DEM using 3x3, 5x5, 7x7, 9x9, 11x11 etc.)

30 Comparing Soil Moisture and TMI Sites Theta TMI Compare Vol. Soil Moisture (V/V) Pond Branch - 6/26/02 - Average TMI
31 A Subset of Results From the sampling period, I have selected three representative days for wet, average and dry conditions: Wet May 29/30 Avg. June 26/28 Dry August 22 LIDAR and Photogrammetric DEMs Cell Sizes and a range of Kernel Sizes for 0.5 m DEMs
32 Cell Size Glyndon Pond Branch LIDAR Photogram. Correlation Correlation Cell Size (metres) Correlation Correlation Cell Size (metres) Cell Size (metres) Cell Size (metres)
33 Kernel Size Glyndon Pond Branch LIDAR Photogram. Correlation Correlation Kernel Size Kernel Size Correlation Correlation Kernel Size Kernel Size
34 Pond Branch - PG 11.25m DEM Wet May 29/30 Avg. June 26/28 Dry August 22 Theta R 2 = TMI Theta R 2 = TMI Theta R 2 = TMI Glyndon LIDAR 0.5m DEM 11x11 Theta R 2 = TMI Theta R 2 = TMI Theta R 2 = TMI
35 Glyndon Average Theta vs. Theta-TMI Correlation (derived from Theta vs. TMI from 0.5m LIDAR, 11x11 Kernel) Correlation R 2 = Average Theta
36 Pond Branch Average Theta vs Theta-TMI Correlation (derived from Theta vs. TMI from 11.25m Photogram.) Correlation R 2 = Average Theta
Simple Linear Regression
 Simple Linear Regression Up until this point, the quantitative methods we have been studying have been designed to help us understand a single random variable In many cases, we are interested in examining
Wet May 29/30 Avg. June 26/28 Dry August 22 R 2 =0.79 R 2 =0.24
 GEOG 090 Quantitative Methods in Geography Wet May 29/30 Avg. June 26/28 Dry August 22 0.6 0.6 0.6 Pond Branch - PG 11.25m DEM Theta 0.5 0.4 0.3 0.2 0.1 0.0 R 2 =0.71 4 5 6 7 8 9 10 11 12 13 TMI Theta
David Tenenbaum GEOG 090 UNC-CH Spring 2005
 Statistical Thinking, Data Types, and Geographical Primitives The scientific method in geography, two kinds of approaches, and the sorts of statistics used to support those approaches Some characteristics
David Tenenbaum GEOG 070 UNC-CH Spring 2005
 GEOG 070 Introduction to Geographic Information GEOG 070 Introduction to Geographic Information Course Description: There is a spatial component to all that occurs on our planet. Everything happens somewhere
MODULE 7 LECTURE NOTES 5 DRAINAGE PATTERN AND CATCHMENT AREA DELINEATION
 MODULE 7 LECTURE NOTES 5 DRAINAGE PATTERN AND CATCHMENT AREA DELINEATION 1. Introduction Topography of the river basin plays an important role in hydrologic modelling, by providing information on different
Digital Elevation Models. Using elevation data in raster format in a GIS
 Digital Elevation Models Using elevation data in raster format in a GIS What is a Digital Elevation Model (DEM)? Digital representation of topography Model based on scale of original data Commonly a raster
ENGRG Introduction to GIS
 ENGRG 59910 Introduction to GIS Michael Piasecki March 17, 2014 Lecture 08: Terrain Analysis Outline: Terrain Analysis Earth Surface Representation Contour TIN Mass Points Digital Elevation Models Slope
12 SWAT USER S MANUAL, VERSION 98.1
 12 SWAT USER S MANUAL, VERSION 98.1 CANOPY STORAGE. Canopy storage is the water intercepted by vegetative surfaces (the canopy) where it is held and made available for evaporation. When using the curve
Impact of DEM Resolution on Topographic Indices and Hydrological Modelling Results
 Impact of DEM Resolution on Topographic Indices and Hydrological Modelling Results J. Vaze 1, 2 and J. Teng 1, 2 1 Department of Water and Energy, NSW, Australia 2 ewater Cooperative Research Centre, Australia
Amitava Saha Research scholar IIT, Roorkee India
 Amitava Saha Research scholar IIT, Roorkee India amitava6@gmail.com Abstract Ponds are important sources of fresh water in the world. Ponds store surface runoff produced by the storms. Demarcation of the
ENGRG Introduction to GIS
 ENGRG 59910 Introduction to GIS Michael Piasecki November 17, 2017 Lecture 11: Terrain Analysis Outline: Terrain Analysis Earth Surface Representation Contour TIN Mass Points Digital Elevation Models Slope
13 Watershed Delineation & Modeling
 Module 4 (L12 - L18): Watershed Modeling Standard modeling approaches and classifications, system concept for watershed modeling, overall description of different hydrologic processes, modeling of rainfall,
Remote Sensing and GIS Applications for Hilly Watersheds SUBASHISA DUTTA DEPARTMENT OF CIVIL ENGINEERING IIT GUWAHATI
 Remote Sensing and GIS Applications for Hilly Watersheds SUBASHISA DUTTA DEPARTMENT OF CIVIL ENGINEERING IIT GUWAHATI Deciding Alternative Land Use Options in a Watershed Using GIS Source: Anita Prakash
Surface Processes Focus on Mass Wasting (Chapter 10)
") Surface Processes Focus on Mass Wasting (Chapter 10) 1. What is the distinction between weathering, mass wasting, and erosion? 2. What is the controlling force in mass wasting? What force provides resistance?
Surface Processes Focus on Mass Wasting (Chapter 10) 1. What is the distinction between weathering, mass wasting, and erosion? 2. What is the controlling force in mass wasting? What force provides resistance?
Topographic Wetness Index Urban Flooding Awareness Act Action Support Will and DuPage Counties, Illinois
 Contract Report 2017-02 April 2017 Topographic Wetness Index Urban Flooding Awareness Act Action Support Will and DuPage Counties, Illinois Clayton Ballerine Illinois State Water Survey Prairie Research
2 Development of a Physically Based Hydrologic Model of the Upper Cosumnes Basin
 2 Development of a Physically Based Hydrologic Model of the Upper Cosumnes Basin 2.1 Introduction The physically based watershed hydrologic model, WEHY (watershed environmental hydrology) model (Kavvas
Spatial Survey of Surface Soil Moisture in a Sub-alpine Watershed Colloquium Presentation, University of Denver, Department of Geography
 Thank you all for coming today. I will be talking about my thesis work concerning the spatial distribution of soil moisture in an alpine catchment. But first we need some background in soil moisture. Why
THE PREDICTION OF HILLSLOPE FLOW PATHS FOR DISTRIBUTED HYDROLOGICAL MODELLING USING DIGITAL TERRAIN MODELS
 *, Q HYDROLOGICAL PROCESSES, VOL. 5,59-79 (1991),3 THE PREDICTION OF HILLSLOPE FLOW PATHS FOR DISTRIBUTED HYDROLOGICAL MODELLING USING DIGITAL TERRAIN MODELS P. QUINN, K. BEVEN, Centre for Research oit
Terrain Analysis Using Digital Elevation Models in Hydrology
 Terrain Analysis Using Digital Elevation Models in Hydrology David Tarboton, Utah State University This paper describes methods that use digital elevation models (DEMs) in hydrology, implemented as an
KINEROS2/AGWA. Fig. 1. Schematic view (Woolhiser et al., 1990).
.") KINEROS2/AGWA Introduction Kineros2 (KINematic runoff and EROSion) (K2) model was originated at the USDA-ARS in late 1960s and released until 1990 (Smith et al., 1995; Woolhiser et al., 1990). The spatial
KINEROS2/AGWA Introduction Kineros2 (KINematic runoff and EROSion) (K2) model was originated at the USDA-ARS in late 1960s and released until 1990 (Smith et al., 1995; Woolhiser et al., 1990). The spatial
THE ROLE OF GEOCOMPUTATION IN THE HYDROLOGICAL SCIENCES
 INTERNATIONAL SYMPOSIUM ON GEOCOMPUTATION AND ANALYSIS THE ROLE OF GEOCOMPUTATION IN THE HYDROLOGICAL SCIENCES JOHN P. WILSON UNIVERSITY OF SOUTHERN CALIFORNIA GIS RESEARCH LABORATORY Outline Background
GRAPEVINE LAKE MODELING & WATERSHED CHARACTERISTICS
 GRAPEVINE LAKE MODELING & WATERSHED CHARACTERISTICS Photo Credit: Lake Grapevine Boat Ramps Nash Mock GIS in Water Resources Fall 2016 Table of Contents Figures and Tables... 2 Introduction... 3 Objectives...
Advanced Hydrology Prof. Dr. Ashu Jain Department of Civil Engineering Indian Institute of Technology, Kanpur. Lecture 6
 Advanced Hydrology Prof. Dr. Ashu Jain Department of Civil Engineering Indian Institute of Technology, Kanpur Lecture 6 Good morning and welcome to the next lecture of this video course on Advanced Hydrology.
Towards a process-oriented HRU-concept in SWAT: Catchment-related control on baseflow and storage of landscape units in medium to large river basins.
 Towards a process-oriented HRU-concept in SWAT: Catchment-related control on baseflow and storage of landscape units in medium to large river basins. Martin Volk 1), J.G. Arnold 2), P.M. Allen 3), Pei-Yu
Hydrologic Modelling of the Upper Malaprabha Catchment using ArcView SWAT
 Hydrologic Modelling of the Upper Malaprabha Catchment using ArcView SWAT Technical briefs are short summaries of the models used in the project aimed at nontechnical readers. The aim of the PES India
Floodplain modeling. Ovidius University of Constanta (P4) Romania & Technological Educational Institute of Serres, Greece
 Romania & Technological Educational Institute of Serres, Greece") Floodplain modeling Ovidius University of Constanta (P4) Romania & Technological Educational Institute of Serres, Greece Scientific Staff: Dr Carmen Maftei, Professor, Civil Engineering Dept. Dr Konstantinos
Floodplain modeling Ovidius University of Constanta (P4) Romania & Technological Educational Institute of Serres, Greece Scientific Staff: Dr Carmen Maftei, Professor, Civil Engineering Dept. Dr Konstantinos
The Sandbox Project 1 cm 10 m
 The Sandbox Project 1 cm 10 m SETUP: 5 lbs of fine sand Funnel 1 measuring grid (22 by 22) adjustable hinterland height outflow pipe trash barrel ½ foam + plastic liner 63-μm sieve (sediment trap) Modeling
7 Flood Prediction in Japan and the Need for Guidelines for Flood Runoff Modelling
 7 Flood Prediction in Japan and the Need for Guidelines for Flood Runoff Modelling YASUTO TACHIKAWA, ROSHAN K. SHRESTHA & TAKAHIRO SAYAMA FLOOD DISASTER AND FLOOD RUNOFF MODELLING IN JAPAN About 5% of
Forest Hydrology: Lect. 9. Contents. Runoff, soil water and infiltration
 Forest Hydrology: Lect. 9 Contents Runoff, soil water and infiltration Learning objectives:. - Hillslope runoff generation processes; - Dynamics of runoff generation processes; - Hortonian and Dunnian
FRACTAL RIVER BASINS
 FRACTAL RIVER BASINS CHANCE AND SELF-ORGANIZATION Ignacio Rodriguez-Iturbe Texas A & M University Andrea Rinaldo University of Padua, Italy CAMBRIDGE UNIVERSITY PRESS Contents Foreword Preface page xiii
Geog Lecture 19
 Geog 1000 - Lecture 19 Fluvial Geomorphology and River Systems http://scholar.ulethbridge.ca/chasmer/classes/ Today s Lecture (Pgs 346 355) 1. What is Fluvial Geomorphology? 2. Hydrology and the Water
GIS Topographic Wetness Index (TWI) Exercise Steps
 Exercise Steps") GIS Topographic Wetness Index (TWI) Exercise Steps October 2016 Jeffrey L. Zimmerman, Jr. GIS Analyst James P. Shallenberger Manager, Monitoring & Protection Susquehanna River Basin Commission Table of
GIS Topographic Wetness Index (TWI) Exercise Steps October 2016 Jeffrey L. Zimmerman, Jr. GIS Analyst James P. Shallenberger Manager, Monitoring & Protection Susquehanna River Basin Commission Table of
Distinct landscape features with important biologic, hydrologic, geomorphic, and biogeochemical functions.
 1 Distinct landscape features with important biologic, hydrologic, geomorphic, and biogeochemical functions. Have distinguishing characteristics that include low slopes, well drained soils, intermittent
Drainage Basin Geomorphology. Nick Odoni s Slope Profile Model
 Drainage Basin Geomorphology Nick Odoni s Slope Profile Model Odoni s Slope Profile Model This model is based on solving the mass balance (sediment budget) equation for a hillslope profile This is achieved
Sampling Populations limited in the scope enumerate
 Sampling Populations Typically, when we collect data, we are somewhat limited in the scope of what information we can reasonably collect Ideally, we would enumerate each and every member of a population
Basin characteristics
 Basin characteristics From hydrological processes at the point scale to hydrological processes throughout the space continuum: point scale à river basin The watershed characteristics (shape, length, topography,
Rainfall-runoff modeling in humid shallow water table environments
 University of South Florida Scholar Commons Graduate Theses and Dissertations Graduate School 2001 Rainfall-runoff modeling in humid shallow water table environments Tatiana X. Hernandez University of
A distributed runoff model for flood prediction in ungauged basins
 Predictions in Ungauged Basins: PUB Kick-off (Proceedings of the PUB Kick-off meeting held in Brasilia, 2 22 November 22). IAHS Publ. 39, 27. 267 A distributed runoff model for flood prediction in ungauged
Model Integration - How WEPP inputs are calculated from GIS data. ( ArcGIS,TOPAZ, Topwepp)
") Model Integration - How WEPP inputs are calculated from GIS data. ( ArcGIS,TOPAZ, Topwepp) ArcGIS 9.1-9.3 Allows user to locate area of interest, assemble grids, visualize outputs. TOPAZ Performs DEM
Model Integration - How WEPP inputs are calculated from GIS data. ( ArcGIS,TOPAZ, Topwepp) ArcGIS 9.1-9.3 Allows user to locate area of interest, assemble grids, visualize outputs. TOPAZ Performs DEM
CATCHMENT AND OVERLAND FLOW PATHWAY DELINEATION USING LIDAR AND GIS GRID BASED APPROACH IN URBAN STORMWATER AND SEWER NETWORK MODELS
 CATCHMENT AND OVERLAND FLOW PATHWAY DELINEATION USING LIDAR AND GIS GRID BASED APPROACH IN URBAN STORMWATER AND SEWER NETWORK MODELS Thomas Joseph (AWT) ABSTRACT This paper presents specific examples comparing
Spatial Survey of Surface Soil Moisture in a Sub-alpine Watershed
 Spatial Survey of Surface Soil Moisture in a Sub-alpine Watershed Katherine E. Williams M.S. GISc Candidate Department of Geography, University of Denver October 7, 2010 Purpose 2 Introduction to Soil
Creating Watersheds and Stream Networks. Steve Kopp
 Creating Watersheds and Stream Networks Steve Kopp Workshop Overview Demo Data Understanding the tools Elevation Data Types DEM : Digital Elevation Model bare Earth DSM : Digital Surface Model Data Structure
Recent Advances in Continuum Mechanics, Hydrology and Ecology
 Effect of DEM Type and Resolution in Extraction of Hydro- Geomorphologic Parameters Vahid Nourani 1, Safa Mokhtarian Asl 2 and Maryam Khosravi Sorkhkolaee 3, Elnaz Sharghi 4 1 Associate Prof., 2,3 M.Sc.
Error Quantification of Topographic Index in Relation to Terrain Condition and Grid Spacing
 Error Quantification of Topographic Index in Relation to Terrain Condition and Grid Spacing Samadrita Adhikari January, 2008 i Error Quantification of Topographic Index in Relation to Terrain Condition
Data Repository. Spatiotemporal trends in erosion rates across a pronounced rainfall gradient: examples from the south central Andes
 Data Repository Spatiotemporal trends in erosion rates across a pronounced rainfall gradient: examples from the south central Andes Bodo Bookhagen 1 and Manfred R. Strecker 2 1 Geography Department, Ellison
Dan Miller + Kelly Burnett, Kelly Christiansen, Sharon Clarke, Lee Benda. GOAL Predict Channel Characteristics in Space and Time
 Broad-Scale Models Dan Miller + Kelly Burnett, Kelly Christiansen, Sharon Clarke, Lee Benda GOAL Predict Channel Characteristics in Space and Time Assess Potential for Fish Use and Productivity Assess
Landform Classification in Raster Geo-images
 Landform Classification in Raster Geo-images Marco Moreno, Serguei Levachkine, Miguel Torres, and Rolando Quintero Geoprocessing Laboratory-Centre for Computing Research-National Polytechnic Institute,
EFFICIENCY OF THE INTEGRATED RESERVOIR OPERATION FOR FLOOD CONTROL IN THE UPPER TONE RIVER OF JAPAN CONSIDERING SPATIAL DISTRIBUTION OF RAINFALL
 EFFICIENCY OF THE INTEGRATED RESERVOIR OPERATION FOR FLOOD CONTROL IN THE UPPER TONE RIVER OF JAPAN CONSIDERING SPATIAL DISTRIBUTION OF RAINFALL Dawen YANG, Eik Chay LOW and Toshio KOIKE Department of
Using Earthscope and B4 LiDAR data to analyze Southern California s active faults
 Using Earthscope and B4 LiDAR data to analyze Southern California s active faults Exercise 8: Simple landscape morphometry and stream network delineation Introduction This exercise covers sample activities
Waterborne Environmental, Inc., Leesburg, VA, USA 2. Syngenta Crop Protection, LLC, North America 3. Syngenta Crop Protection, Int.
 Application of High Resolution Elevation Data (LiDAR) to Assess Natural and Anthropogenic Agricultural Features Affecting the Transport of Pesticides at Multiple Spatial Scales Josh Amos 1, Chris Holmes
Lab 1: Landuse and Hydrology, learning ArcGIS II. MANIPULATING DATA
 Lab 1: Landuse and Hydrology, learning ArcGIS II. MANIPULATING DATA As you experienced in the first lab session when you created a hillshade, high resolution data can be unwieldy if you are trying to perform
Appendix D. Model Setup, Calibration, and Validation
 . Model Setup, Calibration, and Validation Lower Grand River Watershed TMDL January 1 1. Model Selection and Setup The Loading Simulation Program in C++ (LSPC) was selected to address the modeling needs
Geomorphology. Minimizing the grid-resolution dependence of flow-routing algorithms for geomorphic applications. Jon D. Pelletier
 Geomorphology 122 (2010) 91 98 Contents lists available at ScienceDirect Geomorphology journal homepage: www.elsevier.com/locate/geomorph Minimizing the grid-resolution dependence of flow-routing algorithms
Advanced /Surface Hydrology Dr. Jagadish Torlapati Fall 2017 MODULE 2 - ROUTING METHODS
 Routing MODULE - ROUTING METHODS Routing is the process of find the distribution of flow rate and depth in space and time along a river or storm sewer. Routing is also called Flow routing or flood routing.
A Simple Method for Watershed Delineation in Ayer Hitam Forest Reserve using GIS
 Article submitted to BULETIN GEOSPA TIAL SEKTOR AWAM, ISSN 1823 7762, Mac 2010 A Simple Method for Watershed Delineation in Ayer Hitam Forest Reserve using GIS lmas Sukaesih S1tanggang 1 and Mohd Hasmadi
Digital elevation model grid size, landscape representation, and hydrologic simulations
 WATER RESOURCES RESEARCH, VOL. 30, NO. 4, PAGES 1019-1028, APRIL 1994 Digital elevation model grid size, landscape representation, and hydrologic simulations Weihua Zhang and David R. Montgomery Department
MAPPING POTENTIAL LAND DEGRADATION IN BHUTAN
 MAPPING POTENTIAL LAND DEGRADATION IN BHUTAN Moe Myint, Geoinformatics Consultant Rue du Midi-8, CH-1196, Gland, Switzerland moemyint@bluewin.ch Pema Thinley, GIS Analyst Renewable Natural Resources Research
INTRODUCTION TO HEC-HMS
 INTRODUCTION TO HEC-HMS Hydrologic Engineering Center- Hydrologic Modeling System US Army Corps of Engineers Hydrologic Engineering Center HEC-HMS Uses Schematics Enter properties: watershed, rivers (reaches),
A new topographic index to quantify downslope controls on local drainage
 WATER RESOURCES RESEARCH, VOL. 40, W05602, doi:10.1029/2004wr003130, 2004 A new topographic index to quantify downslope controls on local drainage K. N. Hjerdt, 1 J. J. McDonnell, 2 J. Seibert, 3 and A.
GIS feature extraction tools in diverse landscapes
 CE 394K.3 GIS in Water Resources GIS feature extraction tools in diverse landscapes Final Project Anna G. Kladzyk M.S. Candidate, Expected 2015 Department of Environmental and Water Resources Engineering
Digital Elevation Model
 Digital Elevation Model DEM, DSM, DTM? DSM: digital surface model. Height of the earth s surface, including houses, trees, boulders...etc. DTM: digital terrain model. Bare-earth earth surface model. Filtered
Darcy s Law, Richards Equation, and Green-Ampt Equation
 Darcy s Law, Richards Equation, and Green-Ampt Equation 1. Darcy s Law Fluid potential: in classic hydraulics, the fluid potential M is stated in terms of Bernoulli Equation (1.1) P, pressure, [F L!2 ]
***When doing the lab report write-up, be sure to follow the guidelines.***
 Topographic Maps Lab Vocabulary: topography - study of the shapes and features of the earth's surface elevation - height above sea level bench mark - a point that has been accurately measured for its position
The role of near-stream riparian zones in the hydrology of steep upland catchments
 Hydrology, Water Resources and Ecology in Headwaters (Proceedings of the HeadWater'98 Conference held at Meran/Merano, Italy, April 1998). IAHS Publ. no. 248, 1998. 17^ The role of near-stream riparian
The Effect of DEM Resolution on the Computation of Hydrologically Significant Topographic Attributes
 University of South Florida Scholar Commons Graduate Theses and Dissertations Graduate School 4-6-2006 The Effect of DEM Resolution on the Computation of Hydrologically Significant Topographic Attributes
Rick Faber CE 513 Watershed and Streamwork Delineation Lab # 3 4/24/2006
 Rick Faber CE 513 Watershed and Streamwork Delineation Lab # 3 4/24/2006 1. Objective & Discussion: 2 To learn to use the ArcHydro tools to produce hydrologically descriptive data sets starting from a
Rivers T. Perron
 1 Rivers T. Perron 12.001 After our discussions of large-scale topography, how we represent topography in maps, and how topography interacts with geologic structures, you should be frothing at the mouth
Coupling TRIGRS and TOPMODEL in shallow landslide prediction. 1 Presenter: 王俊皓 Advisor: 李錫堤老師 Date: 2016/10/13
 Coupling TRIGRS and TOPMODEL in shallow landslide prediction 1 Presenter: 王俊皓 Advisor: 李錫堤老師 Date: 016/10/13 Outline Introduction Literature review Methodology Pre-result Future work Introduction 3 Motivation
MODULE 8 LECTURE NOTES 2 REMOTE SENSING APPLICATIONS IN RAINFALL-RUNOFF MODELLING
 MODULE 8 LECTURE NOTES 2 REMOTE SENSING APPLICATIONS IN RAINFALL-RUNOFF MODELLING 1. Introduction The most common application of the remote sensing techniques in the rainfall-runoff studies is the estimation
Objectives: After completing this assignment, you should be able to:
 Data Analysis Assignment #1 Evaluating the effects of watershed land use on storm runoff Assignment due: 21 February 2013, 5 pm Objectives: After completing this assignment, you should be able to: 1) Calculate
GIS Geographic Information System
 GIS Geographic Information System Andrea Petroselli Tuscia University, Italy petro@unitus.it SUMMARY Part 1: Part 2: Part 3: Part 4: What is a GIS? Why do we need a GIS? Which are the possibilities of
CHAPTER VII FULLY DISTRIBUTED RAINFALL-RUNOFF MODEL USING GIS
 80 CHAPTER VII FULLY DISTRIBUTED RAINFALL-RUNOFF MODEL USING GIS 7.1GENERAL This chapter is discussed in six parts. Introduction to Runoff estimation using fully Distributed model is discussed in first
Characterisation of valleys from DEMs
 18 th World IMACS / MODSIM Congress, Cairns, Australia 13-17 July 2009 http://mssanz.org.au/modsim09 Characterisation of valleys from DEMs Wang, D. 1,2 and Laffan, S.W. 1 1. School of Biological, Earth
Development of Water Management Modeling by Using GIS in Chirchik River Basin, Uzbekistan
 Available online at www.sciencedirect.com Procedia Earth and Planetary Science 6 ( 2013 ) 169 176 Development of Water Management Modeling by Using GIS in Chirchik River Basin, Uzbekistan Hendra PACHRI
Digital Elevation Model Based Hydro-processing
 Digital Elevation Model Based Hydro-processing B.H.P. Maathuis Department of Water Resources International Institute for Geo-information Science and Earth Observation (ITC) PO Box 6, 7500 AA Enschede,
UGRC 144 Science and Technology in Our Lives/Geohazards
 UGRC 144 Science and Technology in Our Lives/Geohazards Flood and Flood Hazards Dr. Patrick Asamoah Sakyi Department of Earth Science, UG, Legon College of Education School of Continuing and Distance Education
Each basin is surrounded & defined by a drainage divide (high point from which water flows away) Channel initiation
 Channel initiation") DRAINAGE BASINS A drainage basin or watershed is defined from a downstream point, working upstream, to include all of the hillslope & channel areas which drain to that point Each basin is surrounded &
DRAINAGE BASINS A drainage basin or watershed is defined from a downstream point, working upstream, to include all of the hillslope & channel areas which drain to that point Each basin is surrounded &
HYDROLOGIC AND WATER RESOURCES EVALUATIONS FOR SG. LUI WATERSHED
 HYDROLOGIC AND WATER RESOURCES EVALUATIONS FOR SG. LUI WATERSHED 1.0 Introduction The Sg. Lui watershed is the upper part of Langat River Basin, in the state of Selangor which located approximately 20
How Do Human Impacts and Geomorphological Responses Vary with Spatial Scale in the Streams and Rivers of the Illinois Basin?
 How Do Human Impacts and Geomorphological Responses Vary with Spatial Scale in the Streams and Rivers of the Illinois Basin? Bruce Rhoads Department of Geography University of Illinois at Urbana-Champaign
UCGE Reports Number 20163
 UCGE Reports Number 20163 Department of Geomatics Engineering The Effect of Error in Gridded Digital Elevation Models on Topographic Analysis and on the Distributed Hydrological Model TOPMODEL (URL: http://www.geomatics.ucalgary.ca/links/gradtheses.html)
Evaluating the Effects of DEM Properties on the Spatial and Statistical Distribution of Hydrological Surface Attributes.
 Evaluating the Effects of DEM Properties on the Spatial and Statistical Distribution of Hydrological Surface Attributes by Kathryn Woodrow A Thesis presented to The University of Guelph In partial fulfillment
RiparianZone = buffer( River, 100 Feet )
") GIS Analysts perform spatial analysis when they need to derive new data from existing data. In GIS I, for example, you used the vector approach to derive a riparian buffer feature (output polygon) around
GIS Analysts perform spatial analysis when they need to derive new data from existing data. In GIS I, for example, you used the vector approach to derive a riparian buffer feature (output polygon) around
GIS APPLICATIONS IN SOIL SURVEY UPDATES
 GIS APPLICATIONS IN SOIL SURVEY UPDATES ABSTRACT Recent computer hardware and GIS software developments provide new methods that can be used to update existing digital soil surveys. Multi-perspective visualization
Appendix E Guidance for Shallow Flooding Analyses and Mapping
 Appendix E Guidance for Shallow Flooding Analyses and Mapping E.1 Introduction Different types of shallow flooding commonly occur throughout the United States. Types of flows that result in shallow flooding
Laboratory Exercise #3 The Hydrologic Cycle and Running Water Processes
 Laboratory Exercise #3 The Hydrologic Cycle and Running Water Processes page - 1 Section A - The Hydrologic Cycle Figure 1 illustrates the hydrologic cycle which quantifies how water is cycled throughout
Monitoring Headwater Streams for Landscape Response to
 Monitoring Headwater Streams for Landscape Response to Climate Change Matthew Connor, PhD Connor nvironmental, nc. www.oe-i.com icom Healdsburg, California verview Headwater stream geomorphology Response
Susquehanna River Basin A Research Community Hydrologic Observatory. NSF-Funded Infrastructure Proposal in Support of River Basin Hydrologic Sciences
 Susquehanna River Basin A Research Community Hydrologic Observatory NSF-Funded Infrastructure Proposal in Support of River Basin Hydrologic Sciences Fundamental Problem: How Do Humans and Climate Impact
ψ ae is equal to the height of the capillary rise in the soil. Ranges from about 10mm for gravel to 1.5m for silt to several meters for clay.
 Contents 1 Infiltration 1 1a Hydrologic soil horizons...................... 1 1b Infiltration Process......................... 2 1c Measurement............................ 2 1d Richard s Equation.........................
Extracting Drainage Network from High Resolution DEM. in Toowoomba, Queensland
 Extracting Drainage Network from High Resolution DEM in Toowoomba, Queensland Xiaoye Liu and Zhenyu Zhang Keywords: digital elevation model, drainage network, stream order, Toowoomba, Condamine catchment,
Application of Geographical Information System (GIS) tools in watershed analysis
 tools in watershed analysis") Application of Geographical Information System (GIS) tools in watershed analysis Paritosh Gupta 1, Damanjit S Minhas 2, Rajendra M Tamhane 1, A K Mookerjee 2 1.ESRI India New Delhi 2. LEA Associates South
Application of Geographical Information System (GIS) tools in watershed analysis Paritosh Gupta 1, Damanjit S Minhas 2, Rajendra M Tamhane 1, A K Mookerjee 2 1.ESRI India New Delhi 2. LEA Associates South
Wetland occurrence in relation to topography: a test of topographic indices as moisture indicators
 Agricultural and Forest Meteorology 98±99 (1999) 325±340 Wetland occurrence in relation to topography: a test of topographic indices as moisture indicators A. Rodhe *, J. Seibert Uppsala University, Department
Chapter 6 Mapping and Online Tools
 Chapter 6 Mapping and Online Tools The stream site you monitor is just part of a much larger system. When analyzing stream health, it is important to take a holistic view by considering the entire watershed.
Welcome to NetMap Portal Tutorial
 Welcome to NetMap Portal Tutorial Potential Applications What Can you do with the Portal? At least 25 things! 1) Locate the best potential fish habitats. 2) Identify biological hotspots. 3) Map floodplain
INTERNATIONAL JOURNAL OF GEOMATICS AND GEOSCIENCES Volume 1, No 4, 2011
 Detection of seafloor channels using Bathymetry data in Geographical Information Systems Kundu.S.N, Pattnaik.D.S Department of Geology, Utkal University, Vanivihar, Bhubaneswar. Orissa. snkundu@gmail.com
Curvature distribution within hillslopes and catchments and its effect on the hydrological response
 Curvature distribution within hillslopes and catchments and its effect on the hydrological response P. W. Bogaart, P. A. Troch To cite this version: P. W. Bogaart, P. A. Troch. Curvature distribution within
CHAPTER 2 LITERATURE REVIEW
 7 CHAPTER 2 LITERATURE REVIEW A broad understanding of various topics in environmental science and modeling technology was required to complete the studies presented in this thesis, and it is important
Simulating interactions between saturated and unsaturated storage in a conceptual runoff model
 HYDROLOGICAL PROCESSES Hydrol. Process. 17, 379 390 (2003) Published online in Wiley InterScience (www.interscience.wiley.com). DOI: 10.1002/hyp.1130 Simulating interactions between saturated and unsaturated
4. GIS Implementation of the TxDOT Hydrology Extensions
 4. GIS Implementation of the TxDOT Hydrology Extensions A Geographic Information System (GIS) is a computer-assisted system for the capture, storage, retrieval, analysis and display of spatial data. It
SUB CATCHMENT AREA DELINEATION BY POUR POINT IN BATU PAHAT DISTRICT
 SUB CATCHMENT AREA DELINEATION BY POUR POINT IN BATU PAHAT DISTRICT Saifullizan Mohd Bukari, Tan Lai Wai &Mustaffa Anjang Ahmad Faculty of Civil Engineering & Environmental University Tun Hussein Onn Malaysia
Haiti and Dominican Republic Flash Flood Initial Planning Meeting
 Dr Rochelle Graham Climate Scientist Haiti and Dominican Republic Flash Flood Initial Planning Meeting September 7 th to 9 th, 2016 Hydrologic Research Center http://www.hrcwater.org Haiti and Dominican