The WEPP online GIS interface uses the OpenLayers ( software to assist in setting
|
|
|
- Madeleine Harrison
- 6 years ago
- Views:
Transcription
 software to assist in setting up WEPP watershed simulations. In addition to the WEPP model the TOPAZ model (http://ars.usda.gov/main/docs.htm?")
1 WEPP Online GIS OpenLayers/Google Maps Interface February 15,2011 Website: The WEPP online GIS interface uses the OpenLayers ( software to assist in setting up WEPP watershed simulations. In addition to the WEPP model the TOPAZ model ( is used to determine the channel network, delineate the watershed and determine the flowpaths within the watershed. To translate the GIS data into WEPP inputs custom software is used. The model outputs show soil loss and runoff from watershed. Getting Started The first step is to zoom to an area of interest. This can be done by typing in a zip code or the nearest city and state to where your watershed is located. Holding down the SHIFT key and dragging the mouse with the left button held down can be used to draw an area to zoom to. The zoom level bar on the left can be used to zoom in/out from the current location. The arrows at the top can be used to pan. Holding the left mouse button down can also be used to pan.

2 The layers available on the map can be seen by clicking the +sign towards the upper left of the map to display the layer switcher. The Google images can be used as a base layer. Other GIS layers can be used as overlayers. In the image below the PRISM gridded precipitation data is shown. The NRCS SSURGO soils data is very detailed and is only shown when zoomed in at one of the higher zoom levels. Building the Channel Network After zooming to the area of interest click the Build Channel Network button. The channel network can only be determined for a relatively small area about 0.2 degrees by 0.2 degrees (need to get this into miles or km s). There are two parameters that be set when defining the channel network: Minimum Source Channel Length (MSCL) The MSCL parameter represents the shortest channel length in meters that can support other channels. Increasing the value will generate less channels in the watershed. Critical Source Area (CSA) The CSA parameter represents the threshold drainage area in ha below which a channel is assumed to form. Increasing the value of CSA will cause less channels to be delineated.


3 The default setting for MSCL and CSA can be used to make an initial run with TOPAZ to define the channel network. If the channel network does not match the topography the MSCL and CSA values can be adjusted and the channel network rebuilt. When the TOPAZ model is running to define the channels information will be sent to browser. When the simulation is complete click on the View Channel Network button.

4 After clicking on the View Channel Network button the main map window will be displayed with the channels shown. If the channel network looks reasonable the next step is select the outlet point for the watershed. If the channel network is too detailed adjust the CSA and MSCL parameters the click the Build Channel Network button to generate a different channel network. Delineating the Watershed This is done by first clicking the Set Outlet Point button and then clicking on a channel cell. After setting the watershed outlet point on a channel the Build Subcatchments button is available to do a watershed delineation from the selected outlet.


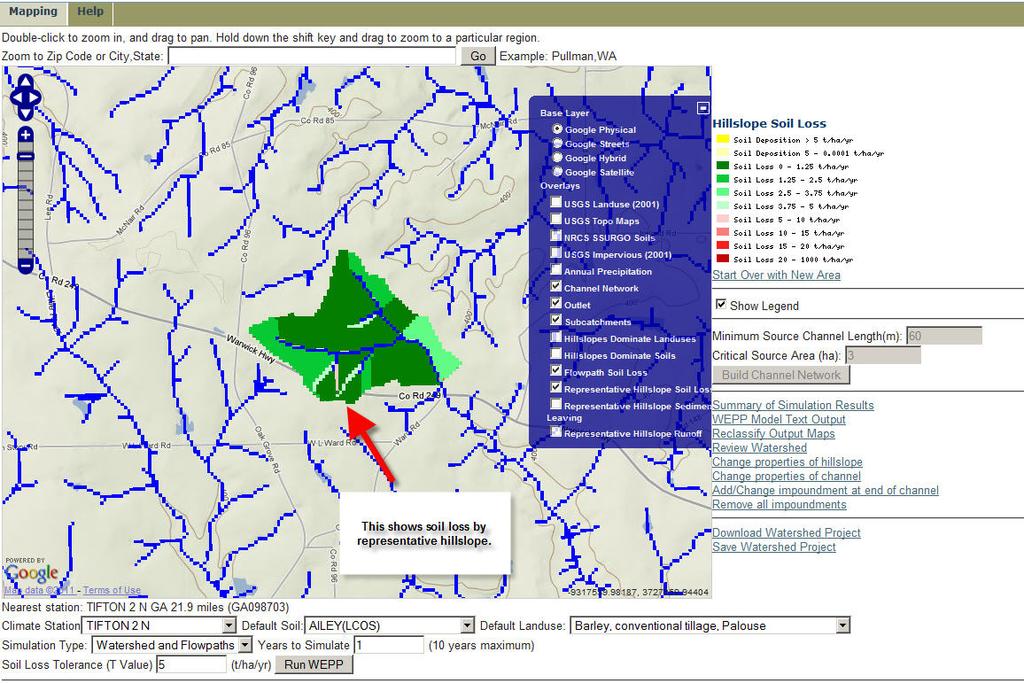
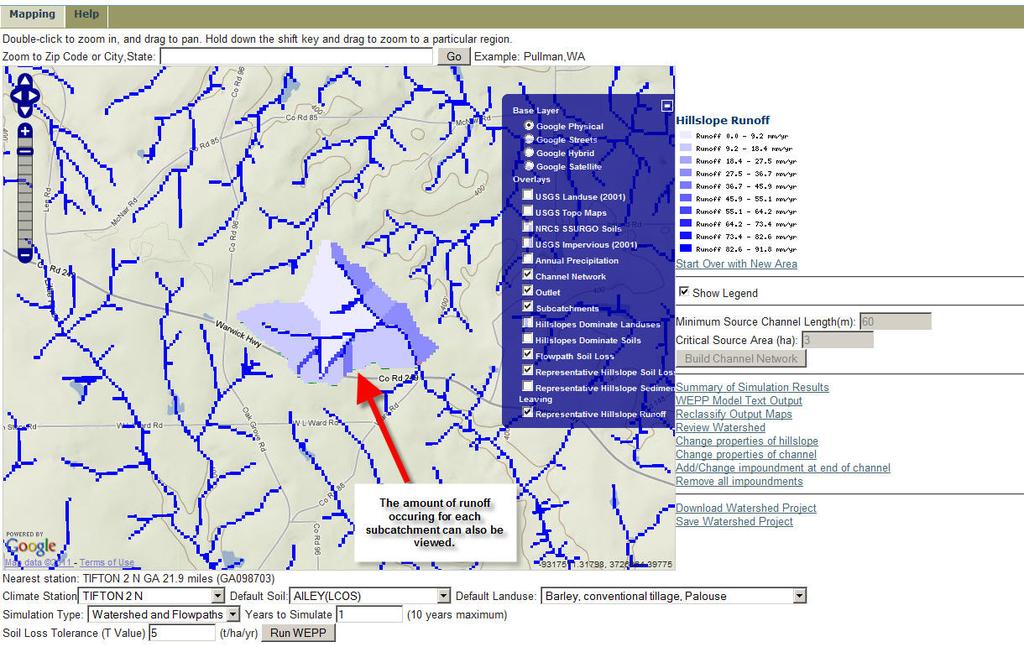
5 As the TOPAZ model is running to determine the watershed boundary, subcatchments and flowpaths information will be sent to the browser. In addition, the online SSURGO database is queried to determine the different soils in the watershed. When the processing is complete click on the View Watershed Subcatchments button to return to the map window After the watershed has been defined the outlet and subcatchment layers will be shown in the map window. Each different colored subcatchment will be used as WEPP hilllslope in a watershed simulation.

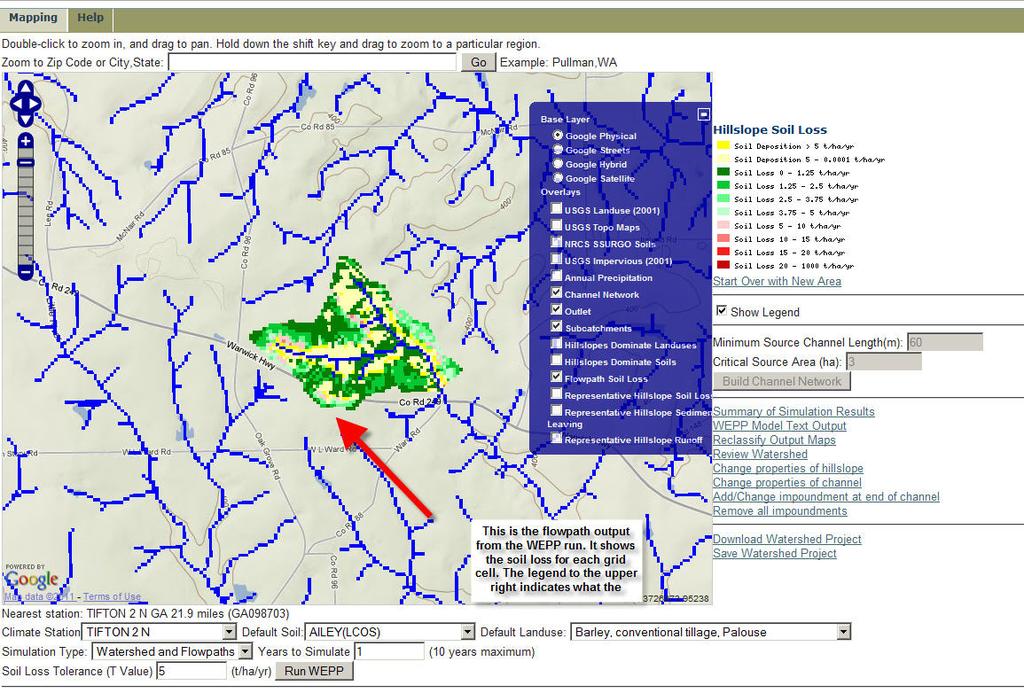
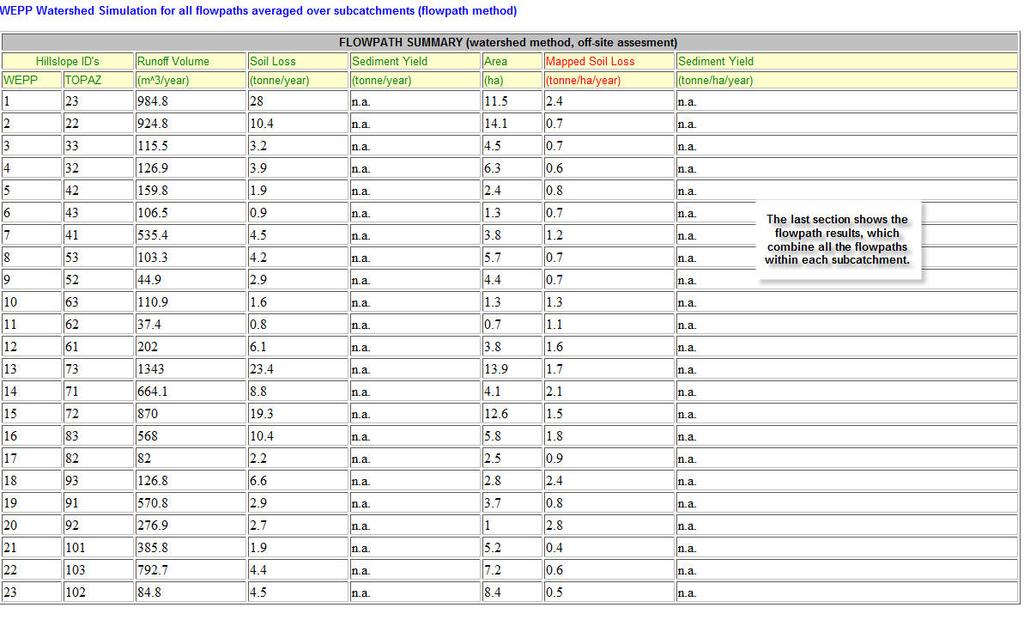
6 In addition, all the flowpaths within the watershed will be simulated with WEPP to estimate spatial soil loss.

7 Review Watershed Characteristics This step will summarize the channels, landuse and soils that will be used in the simulation. This information can be changed. After building the subcatchments click on the Review Watershed Summary button. The button is only available after the subcatchments have been defined.

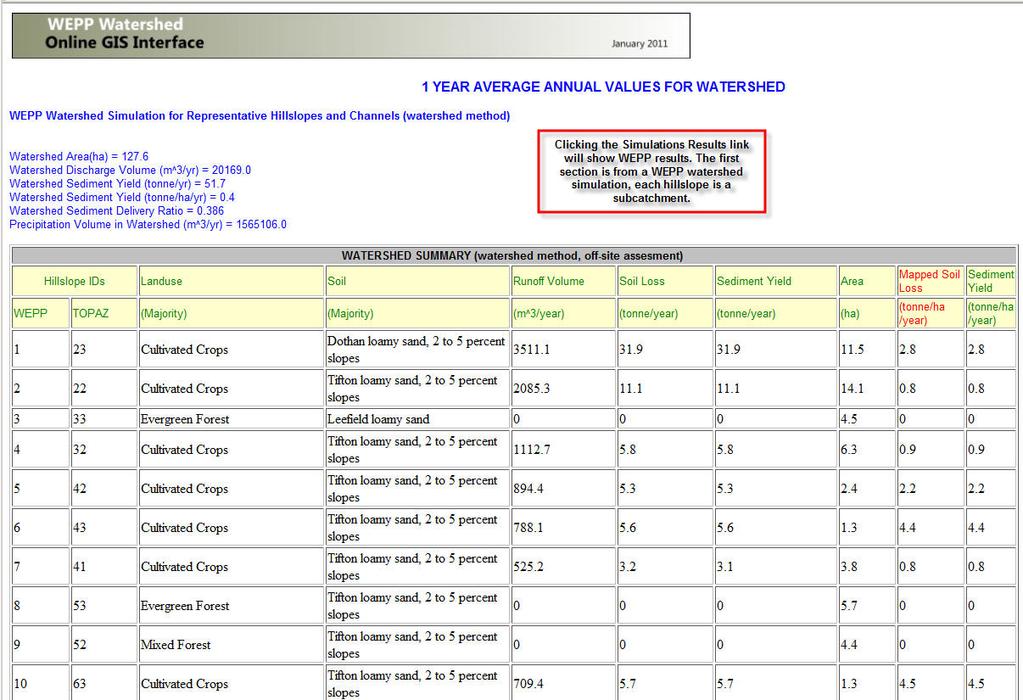
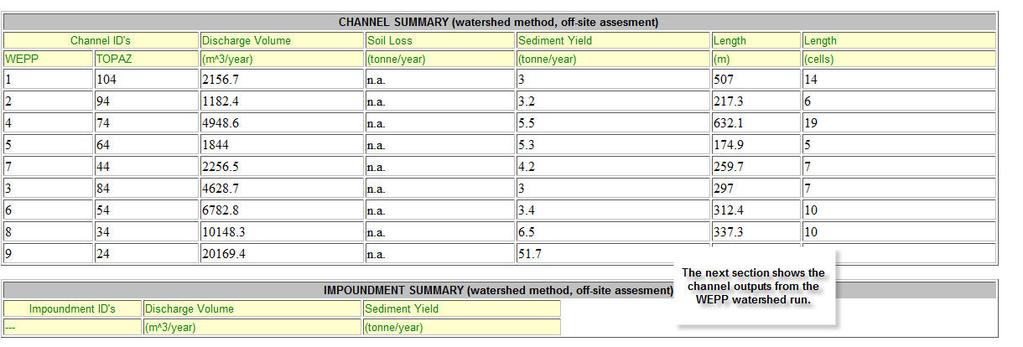
8 The first section of the page gives some general information about the watershed. This needs to be expanded a bit so that watersheds can be easily recreated by other users and reproduce the WEPP results. The reference point field is not currently used it is intended to be the center location on the map window when zoomed in. The zoom level needs to be added. The next section lists the channels defined within the watershed. Impoundments may be added to the ends of channels. The next section shows the representative hillslopes. Each WEPP representative hillslope is the area defined by a subcatchment within TOPAZ. Within each representative hillslope there are many flowpaths. Each of the flowpaths slope data are combined to arrive at a single representative hillslope profile that is used in WEPP watershed runs. The major soils and landuses are determined by looking at the landuse grid and SSURGO soil grid over the subcatchment area. When a WEPP watershed simulation is run the dominate landuse and soil on each representative hillslope is used.

![[This needs to be fixed note large NoData area that should not be included because it is outside the watershed] The](/docs-images/72/66379286/images/9-1.jpg "last section of the watershed review summary lists the WEPP soil files that were generated from the SSURGO data.")
9 The landuse and soils summary that follow show all the landuse classes present and soil types. This information is used in detailed WEPP flowpath simulations. [This needs to be fixed note large NoData area that should not be included because it is outside the watershed] The last section of the watershed review summary lists the WEPP soil files that were generated from the SSURGO data. [Need to fill in more details about this or provide link to another page]

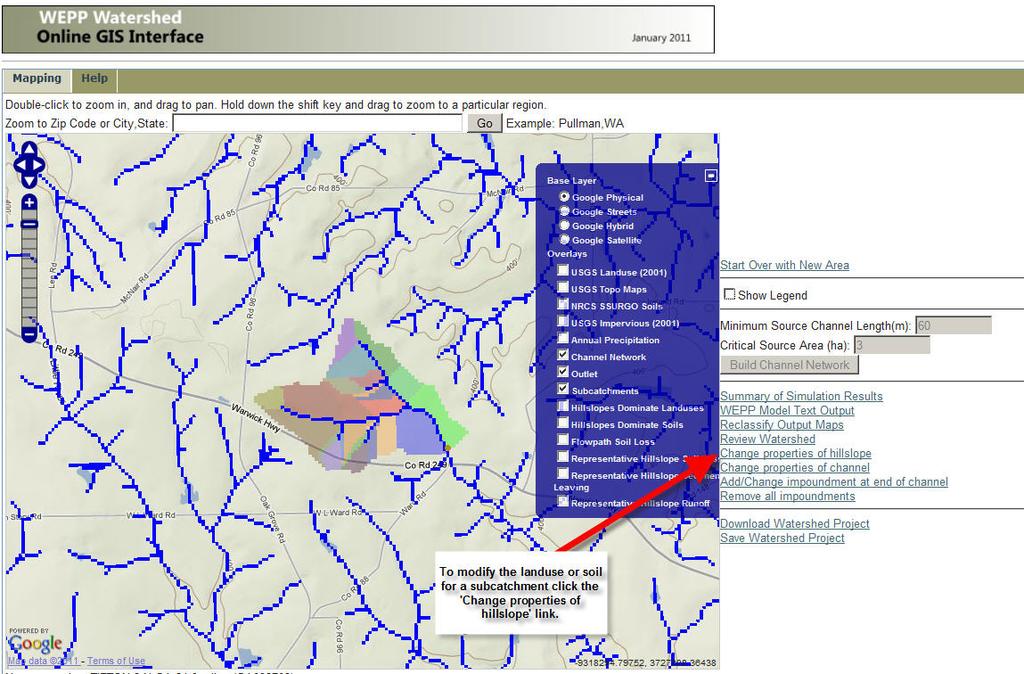
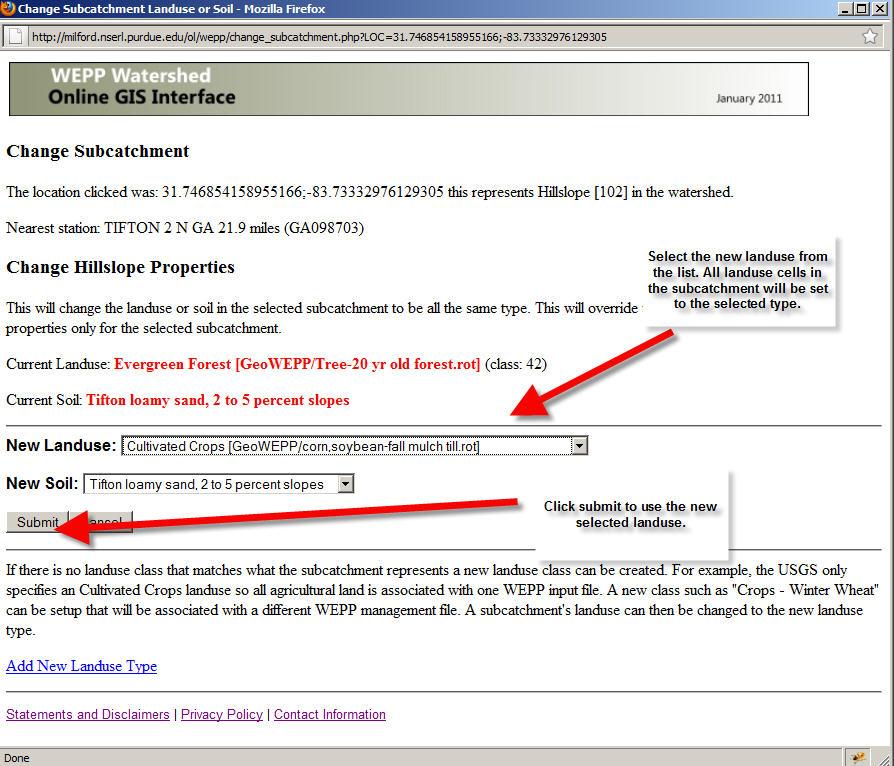
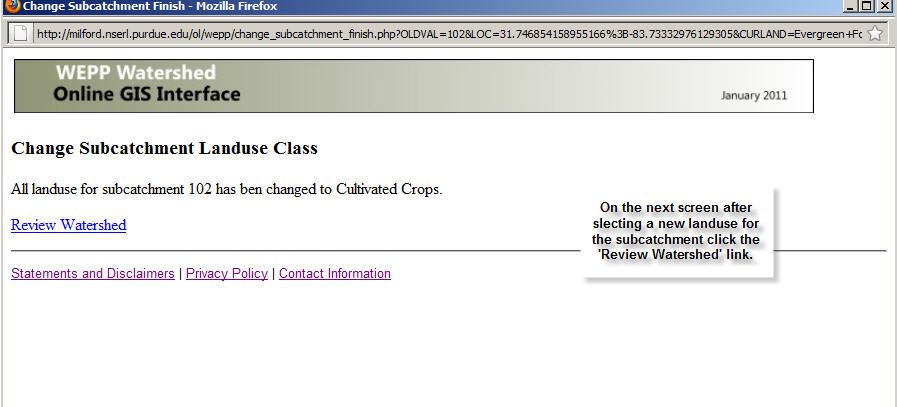
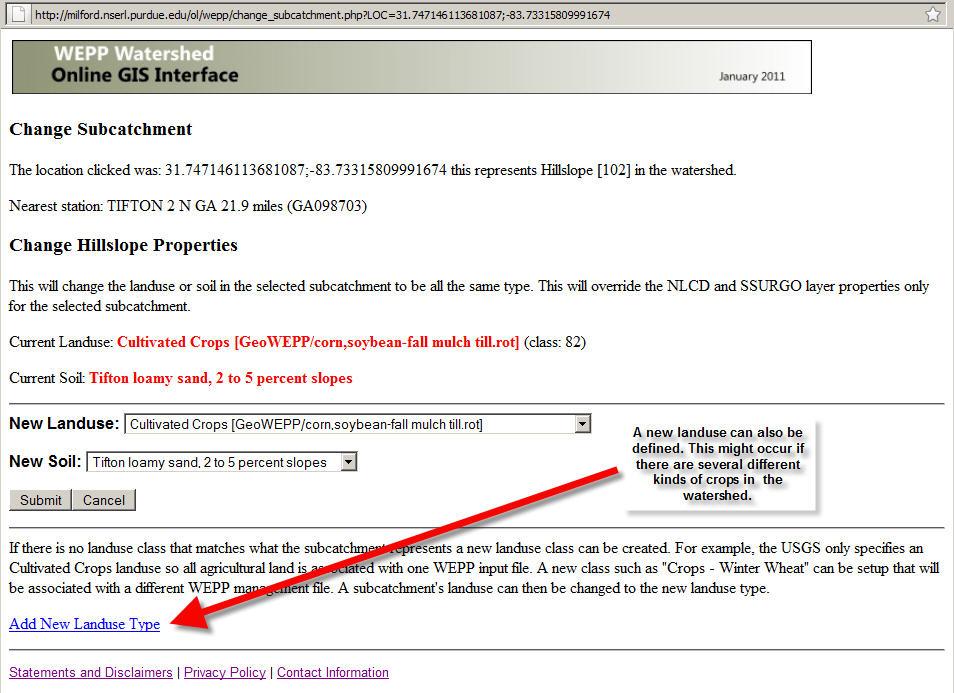
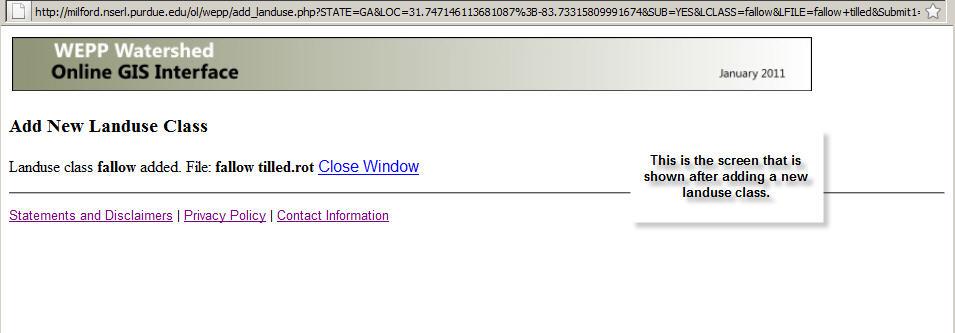
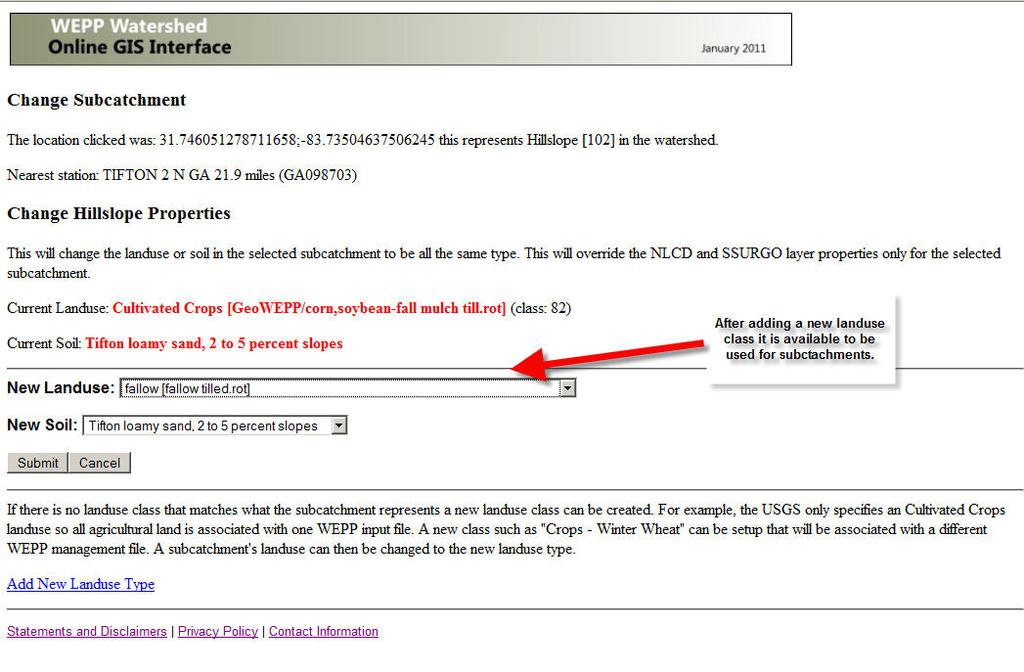
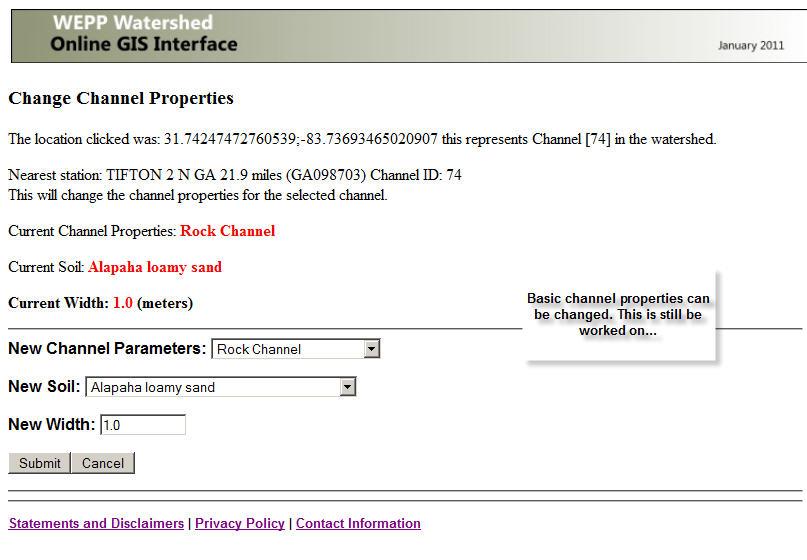
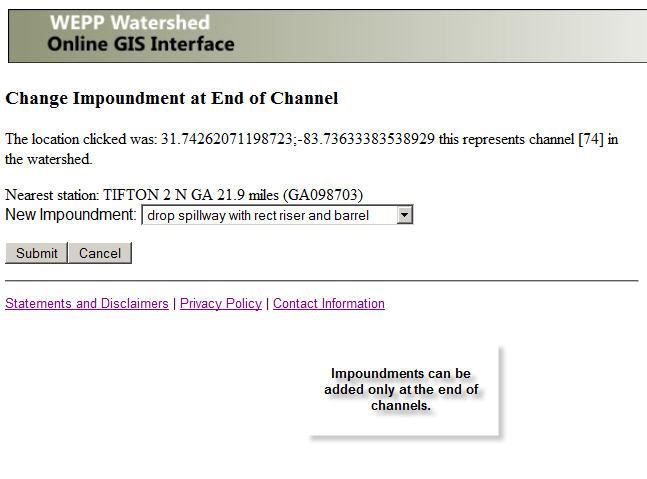
10 Accepting Watershed for WEPP After reviewing the watershed for the first time there are some links available to make changes. These include: Change Properties of Hillslopes For a representative hillslope override the default settings and select a new dominate landuse or soil. The hillslope to change is selected by clicking the area on the map. Change Properties of Channel Select a different channel parameter set or change the width. The channel is selected by clicking the area on the map. Add/Change Impoundment at end of channel WEPP watershed impoundments can be placed in the watershed only at the ends of channels. These structures will be used in the WEPP watershed simulation but not in the flowpath runs. Remove All Impoundments Removes any added impoundments. These options will be covered later.
 defined by TOPAZ is finalized and cannot be changed.")
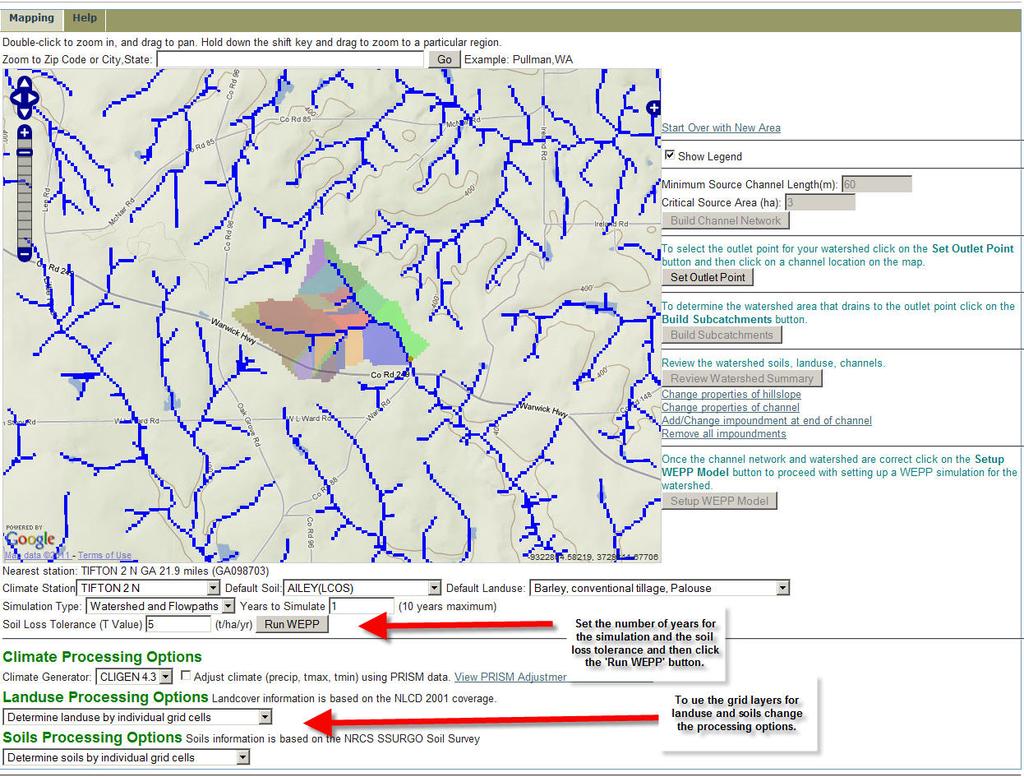
11 Click on the Setup Wepp Model button to proceed to run WEPP with the defined watershed. Once this button is clicked the general watershed structure (size, number of channels, representative hillslopes, flowpaths) defined by TOPAZ is finalized and cannot be changed. Landuse and soils inside the watershed can still be changed between WEPP, just not the overall watershed structure.
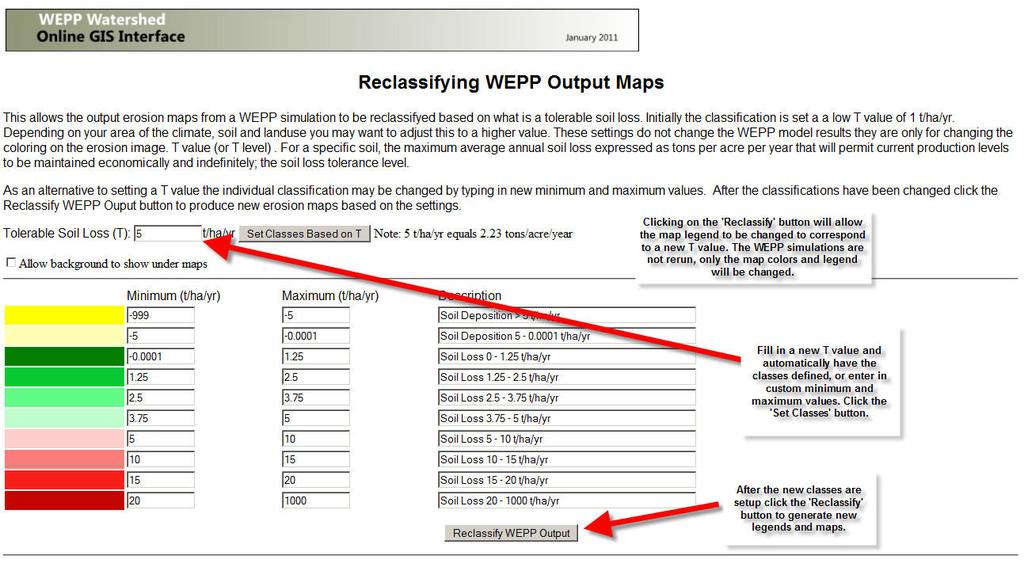
12 Below the map window some fields are displayed that can be used to customize a WEPP run. The following are the fields: Climate Station The nearest CLIGEN station to the watershed outlet. Default Soil If the soil grid is not used this defines the soil that is used for the whole watershed. [This needs to be clearer, disabled when grid selected below] Default Landuse If the landuse grid is not used this defines the landuse that is used for the whole watershed. [This needs to be clearer, disabled when grid selected below] Simulation Type Can be both Watershed and Flowpaths. This will run a WEPP watershed simulation using the representative hillslopes and also run WEPP simulations for each of the flowpaths in the watershed. This may result in hundreds or thousands of WEPP runs. To get the detail cell by cell soil loss results the flowpaths simulations must be run. Years to Simulate How long the WEPP simulations are, 1 to 10 years. This is limited by computer processing power on the several, to do much longer runs use the desktop versions of the software. Soil Loss Tolerance This defines how the output soil loss maps colors will be set in. Shades of red are soil loss values greater than T while shades of green are soil loss values below T. Climate Generator This defines the CLIGEN program version to use when producing the synthetic climate data. Version 5.2 [need to describe this] Adjust for PRISM [need to describe this] Landuse Processing Options Use either landuse layer or manually set landuse. Soil Processing Options Use either soil layer or manually set landuse.
13
14
15
16
17
18
19
20
21
22
23
24
25
26
27
Development of a GIS Interface for WEPP Model Application to Great Lakes Forested Watersheds
 Development of a GIS Interface for WEPP Model Application to Great Lakes Forested Watersheds J.R. Frankenberger 1, S. Dun 2, D.C. Flanagan 1, J.Q. Wu 2, W.J. Elliot 3 1 USDA-ARS, West Lafayette, IN 2 Washington
Watershed Application of WEPP and Geospatial Interfaces. Dennis C. Flanagan
 Watershed Application of WEPP and Geospatial Interfaces Dennis C. Flanagan Research Agricultural Engineer USDA-Agricultural Research Service Adjunct Professor Purdue Univ., Dept. of Agric. & Biol. Eng.
Model Integration - How WEPP inputs are calculated from GIS data. ( ArcGIS,TOPAZ, Topwepp)
") Model Integration - How WEPP inputs are calculated from GIS data. ( ArcGIS,TOPAZ, Topwepp) ArcGIS 9.1-9.3 Allows user to locate area of interest, assemble grids, visualize outputs. TOPAZ Performs DEM
Model Integration - How WEPP inputs are calculated from GIS data. ( ArcGIS,TOPAZ, Topwepp) ArcGIS 9.1-9.3 Allows user to locate area of interest, assemble grids, visualize outputs. TOPAZ Performs DEM
Great Lakes Online Watershed Interface W. Elliot, Research Engineer USDA Forest Service Rocky Mountain Research Station, Moscow, ID March, 2016
 Great Lakes Online Watershed Interface W. Elliot, Research Engineer USDA Forest Service Rocky Mountain Research Station, Moscow, ID March, 2016 Guidelines for using the Web WEPP Watershed Tool to Support
GeoWEPP Tutorial Appendix
 GeoWEPP Tutorial Appendix Chris S. Renschler University at Buffalo - The State University of New York Department of Geography, 116 Wilkeson Quad Buffalo, New York 14261, USA Prepared for use at the WEPP/GeoWEPP
 W. Elliot, PE, PhD USDA Forest Service, Rocky Mountain Research Station Moscow, Idaho Version: April, 2017 WEPP PEP The Water Erosion Prediction Project (WEPP) Post Fire Erosion Predictor (PEP) is an online
Automatic Watershed Delineation using ArcSWAT/Arc GIS
 Automatic Watershed Delineation using ArcSWAT/Arc GIS By: - Endager G. and Yalelet.F 1. Watershed Delineation This tool allows the user to delineate sub watersheds based on an automatic procedure using
Conservation Planning evaluate land management alternatives to reduce soil erosion to acceptable levels. Resource Inventories estimate current and
 Conservation Planning evaluate land management alternatives to reduce soil erosion to acceptable levels. Resource Inventories estimate current and projected erosion levels and their impact on natural resource
Watershed Modeling Orange County Hydrology Using GIS Data
 v. 10.0 WMS 10.0 Tutorial Watershed Modeling Orange County Hydrology Using GIS Data Learn how to delineate sub-basins and compute soil losses for Orange County (California) hydrologic modeling Objectives
Catchment Delineation Workflow
 Catchment Delineation Workflow Slide 1 Given is a GPS point (Lat./Long.) for an outlet location. The outlet could be a proposed Dam site, a storm water drainage culvert on a rural highway, or any other
How to Create Stream Networks using DEM and TauDEM
 How to Create Stream Networks using DEM and TauDEM Take note: These procedures do not describe all steps. Knowledge of ArcGIS, DEMs, and TauDEM is required. TauDEM software ( http://hydrology.neng.usu.edu/taudem/
Map My Property User Guide
 Map My Property User Guide Map My Property Table of Contents About Map My Property... 2 Accessing Map My Property... 2 Links... 3 Navigating the Map... 3 Navigating to a Specific Location... 3 Zooming
v Prerequisite Tutorials GSSHA WMS Basics Watershed Delineation using DEMs and 2D Grid Generation Time minutes
 v. 10.1 WMS 10.1 Tutorial GSSHA WMS Basics Creating Feature Objects and Mapping Attributes to the 2D Grid Populate hydrologic parameters in a GSSHA model using land use and soil data Objectives This tutorial
WMS 9.0 Tutorial GSSHA Modeling Basics Infiltration Learn how to add infiltration to your GSSHA model
 v. 9.0 WMS 9.0 Tutorial GSSHA Modeling Basics Infiltration Learn how to add infiltration to your GSSHA model Objectives This workshop builds on the model developed in the previous workshop and shows you
User Guide for Source-Pathway-Receptor Modelling Tool for Estimating Flood Impact of Upland Land Use and Management Change
 User Guide for Source-Pathway-Receptor Modelling Tool for Estimating Flood Impact of Upland Land Use and Management Change Dr Greg O Donnell Professor John Ewen Professor Enda O Connell Newcastle University
EXECUTIVE SUMMARY MANAGEMENT OF NONPOINT SOURCE POLLUTION AN INTEGRATIVE GIS-ANNAGNPS MODEL SEPTEMBER 2003
 EXECUTIVE SUMMARY MANAGEMENT OF NONPOINT SOURCE POLLUTION AN INTEGRATIVE GIS-ANNAGNPS MODEL SEPTEMBER 2003 CENTRAL PLAINS CENTER FOR BIOASSESSMENT KANSAS BIOLOGICAL SURVEY AND KANSAS GEOLOGICAL SURVEY
A GIS-based Approach to Watershed Analysis in Texas Author: Allison Guettner
 Texas A&M University Zachry Department of Civil Engineering CVEN 658 Civil Engineering Applications of GIS Instructor: Dr. Francisco Olivera A GIS-based Approach to Watershed Analysis in Texas Author:
StreamStats: Delivering Streamflow Information to the Public. By Kernell Ries
 StreamStats: Delivering Streamflow Information to the Public By Kernell Ries U.S. Department of the Interior U.S. Geological Survey MD-DE-DC District 410-238-4317 kries@usgs.gov StreamStats Web Application
Create A Watershed Profile
 Name Date Follow the steps below with Chesapeake Bay FieldScope to create a watershed profile for your location. Part 1. Take a trip down your tributaries. Create A Watershed Profile 1. Find your field
GeoWEPP The Geo-spatial interface for the Water Erosion Prediction Project
 This is not a peer-reviewed article Paper Number: 022171 An ASAE Meeting Presentation GeoWEPP The Geo-spatial interface for the Water Erosion Prediction Project Chris S. Renschler University at Buffalo
GIS Workshop UCLS_Fall Forum 2014 Sowmya Selvarajan, PhD TABLE OF CONTENTS
 TABLE OF CONTENTS TITLE PAGE NO. 1. ArcGIS Basics I 2 a. Open and Save a Map Document 2 b. Work with Map Layers 2 c. Navigate in a Map Document 4 d. Measure Distances 4 2. ArcGIS Basics II 5 a. Work with
Water Information Portal User Guide. Updated July 2014
 Water Information Portal User Guide Updated July 2014 1. ENTER THE WATER INFORMATION PORTAL Launch the Water Information Portal in your internet browser via http://www.bcogc.ca/public-zone/water-information
OCEAN/ESS 410 Lab 4. Earthquake location
 Lab 4. Earthquake location To complete this exercise you will need to (a) Complete the table on page 2. (b) Identify phases on the seismograms on pages 3-6 as requested on page 11. (c) Locate the earthquake
Using the Stock Hydrology Tools in ArcGIS
 Using the Stock Hydrology Tools in ArcGIS This lab exercise contains a homework assignment, detailed at the bottom, which is due Wednesday, October 6th. Several hydrology tools are part of the basic ArcGIS
An Instructional Module. FieldScope Unit 1. Introduction to National Geographic Society s FieldScope Program.
 An Instructional Module FieldScope Unit 1 www.budburst.org/fieldscope Introduction to National Geographic Society s FieldScope Program Unit Contents Overview 3 Learning Objectives Time Commitment Technical
You w i ll f ol l ow these st eps : Before opening files, the S c e n e panel is active.
 You w i ll f ol l ow these st eps : A. O pen a n i m a g e s t a c k. B. Tr a c e t h e d e n d r i t e w i t h t h e user-guided m ode. C. D e t e c t t h e s p i n e s a u t o m a t i c a l l y. D. C
Workshop: Build a Basic HEC-HMS Model from Scratch
 Workshop: Build a Basic HEC-HMS Model from Scratch This workshop is designed to help new users of HEC-HMS learn how to apply the software. Not all the capabilities in HEC-HMS are demonstrated in the workshop
4. GIS Implementation of the TxDOT Hydrology Extensions
 4. GIS Implementation of the TxDOT Hydrology Extensions A Geographic Information System (GIS) is a computer-assisted system for the capture, storage, retrieval, analysis and display of spatial data. It
Gridded Ambient Air Pollutant Concentrations for Southern California, User Notes authored by Beau MacDonald, 11/28/2017
 Gridded Ambient Air Pollutant Concentrations for Southern California, 1995-2014 User Notes authored by Beau, 11/28/2017 METADATA: Each raster file contains data for one pollutant (NO2, O3, PM2.5, and PM10)
v WMS Tutorials GIS Module Importing, displaying, and converting shapefiles Required Components Time minutes
 v. 11.0 WMS 11.0 Tutorial Importing, displaying, and converting shapefiles Objectives This tutorial demonstrates how to import GIS data, visualize it, and convert it into WMS coverage data that could be
OneStop Map Viewer Navigation
 OneStop Map Viewer Navigation» Intended User: Industry Map Viewer users Overview The OneStop Map Viewer is an interactive map tool that helps you find and view information associated with energy development,
WMS 10.1 Tutorial GSSHA Applications Precipitation Methods in GSSHA Learn how to use different precipitation sources in GSSHA models
 v. 10.1 WMS 10.1 Tutorial GSSHA Applications Precipitation Methods in GSSHA Learn how to use different precipitation sources in GSSHA models Objectives Learn how to use several precipitation sources and
Using WEPP Technology to Predict Erosion and Runoff Following Wildfire
 An ASABE Meeting Presentation Paper Number: 068011 Using WEPP Technology to Predict Erosion and Runoff Following Wildfire William J. Elliot, PE, PhD, Project Leader (welliot@fs.fed.us) Ina Sue Miller,
SMALL WATERSHED MODELING WITH WEPP USING GRID-BASED DEMS AND GIS
 Paper No. 993089 An ASAE Meeting Presentation SMALL WATERSHED MODELING WITH WEPP USING GRID-BASED DEMS AND GIS by T. A. Cochrane and D.C. Flanagan Agricultural and Biological Engineering Department and
Ontario Flow Assessment Tool III
 Ontario Flow Assessment Tool III Quick Start Guide Ontario Flow Assessment Tools, version III (OFAT III) is an online, spatially-based application to automate a series of labourintensive technical hydrology
Student Activity Sheet- Denali Topo Map
 Student Activity Sheet- Denali Topo Map Directions: Follow the steps in order and answer the associated questions as you proceed through the activity. The first part of the activity will be guided by your
City of Roswell, GA GIS VIEWER USER GUIDE
 City of Roswell, GA GIS VIEWER USER GUIDE Version 1.0 06/27/2018 GIS VIEWER USER GUIDE This user guide will introduce and outline the various tools available through the City of Roswell s Public GIS Viewer.
Desktop GIS for Geotechnical Engineering
 Desktop GIS for Geotechnical Engineering Satya Priya Deputy General Manager (Software) RMSI, A-7, Sector 16 NOIDA 201 301, UP, INDIA Tel: +91-120-2511102 Fax: +91-120-2510963 Email: Satya.Priya@rmsi.com
Exercise 6: Using Burn Severity Data to Model Erosion Risk
 Exercise 6: Using Burn Severity Data to Model Erosion Risk Document Updated: November 2009 Software Versions: ERDAS Imagine 9.3 and ArcGIS 9.3, Microsoft Office 2007 Introduction A common use of burn severity
HOW TO GUIDE. Loading climate data from online database
 HOW TO GUIDE Loading climate data from online database Copyright and publisher: EMD International A/S Niels Jernes vej 10 9220 Aalborg Ø Denmark Phone: +45 9635 44444 e-mail: emd@emd.dk web: www.emd.dk
Web (Java, ArcGIS Server [WebADF, flex, silverlight]) Mobile (ArcGIS Mobile, ArcPad, Windows Mobile) Deskt
![Web (Java, ArcGIS Server [WebADF, flex, silverlight]) Mobile (ArcGIS Mobile, ArcPad, Windows Mobile) Deskt](/thumbs/96/129284052.jpg "Web (Java, ArcGIS Server [WebADF, flex, silverlight]) Mobile (ArcGIS Mobile, ArcPad, Windows Mobile) Deskt") GIS Services company in Lincoln, NE Custom GIS database design and build (for local, county, state and private corporations) Custom (ESRI and non-esri) application design and build in Java, C++, C#,.Net
GIS Services company in Lincoln, NE Custom GIS database design and build (for local, county, state and private corporations) Custom (ESRI and non-esri) application design and build in Java, C++, C#,.Net
Gis Unit TropMed Mahidol U.
 Gis Unit TropMed Mahidol U. Database Information System Database Concepts 1. Non-Spatial Database table, document.. 2. Spatial Database locational databases (geographic) + attribute databases Gis Unit
Transactions on Information and Communications Technologies vol 18, 1998 WIT Press, ISSN
 STREAM, spatial tools for river basins, environment and analysis of management options Menno Schepel Resource Analysis, Zuiderstraat 110, 2611 SJDelft, the Netherlands; e-mail: menno.schepel@resource.nl
Among various open-source GIS programs, QGIS can be the best suitable option which can be used across partners for reasons outlined below.
 Comparison of Geographic Information Systems (GIS) software As of January 2018, WHO has reached an agreement with ESRI (an international supplier of GIS software) for an unlimited use of ArcGIS Desktop
Watershed Modeling With DEMs
 Watershed Modeling With DEMs Lesson 6 6-1 Objectives Use DEMs for watershed delineation. Explain the relationship between DEMs and feature objects. Use WMS to compute geometric basin data from a delineated
Name: Block: Date: Electrical Potentials and Electrical Fields: Potentially Dangerous Situations
 Name: Block: Date: Electrical Potentials and Electrical Fields: Potentially Dangerous Situations Part A: Introduction 1. Open the Charges and Fields application. 2. On the right-hand-side, activate the
Child Opportunity Index Mapping
 Child Opportunity Index Mapping A partnership project of How to Use and Interpret the Child Opportunity Index Maps How to Use the Child Opportunity Index Maps Getting Started: How to Find and Open a Child
Two problems to be solved. Example Use of SITATION. Here is the main menu. First step. Now. To load the data.
 Two problems to be solved Example Use of SITATION Mark S. Daskin Department of IE/MS Northwestern U. Evanston, IL 1. Minimize the demand weighted total distance (or average distance) Using 10 facilities
Watershed Delineation
 Watershed Delineation Jessica L. Watkins, University of Georgia 2 April 2009 Updated by KC Love February 25, 2011 PURPOSE For this project, I delineated watersheds for the Coweeta synoptic sampling area
Electric Fields and Potential
 General Physics Lab 2 Siena College Object Electric Fields and Potential This experiment further explores the electrostatic interaction between charged objects. The concepts of electric field and potential
DGS Digital Geologic Information Resource (DGIR) User Guide
 User Guide") DGS Digital Geologic Information Resource (DGIR) User Guide Developed by the Delaware Geological Survey. Revised January 2012. TABLE OF CONTENTS I. INTRODUCTION II. DGIR LAYOUT III. TOOLBARS IV. USING
DGS Digital Geologic Information Resource (DGIR) User Guide Developed by the Delaware Geological Survey. Revised January 2012. TABLE OF CONTENTS I. INTRODUCTION II. DGIR LAYOUT III. TOOLBARS IV. USING
SoilView: Development of a Custom GIS Application for Publishing Soil Surveys
 SoilView: Development of a Custom GIS Application for Publishing Soil Surveys Allan Johnson and Mike Wigginton Abstract Currently, digital soils information can be obtained from many sources. Numerous
Development of Webbased. Tool for Tennessee
 Development of Webbased Farm Mapping Tool for Tennessee Southern Region Water Quality Conference, Oct. 24 2005 Forbes Walker and Alan Jolly Biosystems Engineering and SOIL SCIENCE Nutrient Management Planning
Delineation of Watersheds
 Delineation of Watersheds Adirondack Park, New York by Introduction Problem Watershed boundaries are increasingly being used in land and water management, separating the direction of water flow such that
The Geodatabase Working with Spatial Analyst. Calculating Elevation and Slope Values for Forested Roads, Streams, and Stands.
 GIS LAB 7 The Geodatabase Working with Spatial Analyst. Calculating Elevation and Slope Values for Forested Roads, Streams, and Stands. This lab will ask you to work with the Spatial Analyst extension.
REPRESENTATIVE HILLSLOPE METHODS FOR APPLYING
 REPRESENTATIVE HILLSLOPE METHODS FOR APPLYING THE WEPP MODEL WITH DEMS AND GIS T. A. Cochrane, D. C. Flanagan ABSTRACT. In watershed modeling with WEPP, the process of manually identifying hillslopes and
The TexasET Network and Website User s Manual
 The TexasET Network and Website http://texaset.tamu.edu User s Manual By Charles Swanson and Guy Fipps 1 September 2013 Texas AgriLIFE Extension Service Texas A&M System 1 Extension Program Specialist;
Near Real-Time Runoff Estimation Using Spatially Distributed Radar Rainfall Data. Jennifer Hadley 22 April 2003
 Near Real-Time Runoff Estimation Using Spatially Distributed Radar Rainfall Data Jennifer Hadley 22 April 2003 Introduction Water availability has become a major issue in Texas in the last several years,
The GHG Reservoir Tool (G-res)
") UNESCO/IHA research project on the GHG status of freshwater reservoirs The GHG Reservoir Tool (G-res) User guidelines for the Earth Engine functionality United Nations Educational, Scientific and Cultural
UNESCO/IHA research project on the GHG status of freshwater reservoirs The GHG Reservoir Tool (G-res) User guidelines for the Earth Engine functionality United Nations Educational, Scientific and Cultural
Introducing IMS. v) Select the Zoom to Full Extent tool. Did you return to the original view?
 Select the Zoom to Full Extent tool. Did you return to the original view?") Ocean/ENVIR 260, Winter 2006 Lab 1, Get to Know the Puget Sound Watershed Name Introducing IMS 1) Open your web browser and navigate to http://128.208.23.127/website/lab1. (This link can be found on the
Ocean/ENVIR 260, Winter 2006 Lab 1, Get to Know the Puget Sound Watershed Name Introducing IMS 1) Open your web browser and navigate to http://128.208.23.127/website/lab1. (This link can be found on the
BOUNDARY MAP USER GUIDE
 BOUNDARY MAP USER GUIDE Get Exploring. Boundaries. The Northern Ontario Boundary Map provides users with the ability to explore the many community, administrative and service provider boundaries in the
MODULE 7 LECTURE NOTES 5 DRAINAGE PATTERN AND CATCHMENT AREA DELINEATION
 MODULE 7 LECTURE NOTES 5 DRAINAGE PATTERN AND CATCHMENT AREA DELINEATION 1. Introduction Topography of the river basin plays an important role in hydrologic modelling, by providing information on different
Lecture 2. Introduction to ESRI s ArcGIS Desktop and ArcMap
 Lecture 2 Introduction to ESRI s ArcGIS Desktop and ArcMap Outline ESRI What is ArcGIS? ArcGIS Desktop ArcMap Overview Views Layers Attribute Tables Help! Scale Tips and Tricks ESRI Environmental Systems
Introducing GIS analysis
 1 Introducing GIS analysis GIS analysis lets you see patterns and relationships in your geographic data. The results of your analysis will give you insight into a place, help you focus your actions, or
Activity 8b - Electric Field Exploration
 Name Date Activity 8b - Electric Field Exploration Pd Go to the following website: http://phet.colorado.edu Find the heading Run our Simulations and click On Line. Under the Simulations heading, select
Leveraging the GIS Capability within FlexiCadastre
 Managing Local Land Concerns, Maintaining Corporate Governance Leveraging the GIS Capability within FlexiCadastre Regional User Conference, North America May 6 th May 9 th, 2013 Cameron McKellar, Technical
HOW TO ANALYZE SYNCHROTRON DATA
 HOW TO ANALYZE SYNCHROTRON DATA 1 SYNCHROTRON APPLICATIONS - WHAT Diffraction data are collected on diffractometer lines at the world s synchrotron sources. Most synchrotrons have one or more user facilities
This tutorial is intended to familiarize you with the Geomatica Toolbar and describe the basics of viewing data using Geomatica Focus.
 PCI GEOMATICS GEOMATICA QUICKSTART 1. Introduction This tutorial is intended to familiarize you with the Geomatica Toolbar and describe the basics of viewing data using Geomatica Focus. All data used in
Digital Elevation Models. Using elevation data in raster format in a GIS
 Digital Elevation Models Using elevation data in raster format in a GIS What is a Digital Elevation Model (DEM)? Digital representation of topography Model based on scale of original data Commonly a raster
![)UDQFR54XHQWLQ(DQG'tD]'HOJDGR&](/thumbs/95/125846872.jpg ")UDQFR54XHQWLQ(DQG'tD]'HOJDGR&") &21&(37,21$1',03/(0(17$7,212)$1+
&21&(37,21$1',03/(0(17$7,212)$1+ MERGING (MERGE / MOSAIC) GEOSPATIAL DATA
 GEOSPATIAL DATA") This help guide describes how to merge two or more feature classes (vector) or rasters into one single feature class or raster dataset. The Merge Tool The Merge Tool combines input features from input
This help guide describes how to merge two or more feature classes (vector) or rasters into one single feature class or raster dataset. The Merge Tool The Merge Tool combines input features from input
George Mason University Department of Civil, Environmental and Infrastructure Engineering. Dr. Celso Ferreira Prepared by Lora Baumgartner
 George Mason University Department of Civil, Environmental and Infrastructure Engineering Dr. Celso Ferreira Prepared by Lora Baumgartner Exercise Topic: Downloading Spatial Data Objectives: a) Become
Eurostat Business Cycle Clock (BCC): A user's guide
: A user's guide") EUROPEAN COMMISSION EUROSTAT Directorate C: National Accounts, Prices and Key Indicators Unit C-1: National accounts methodology. Indicators ESTAT.C.1 - National accounts methodology/indicators Eurostat
EUROPEAN COMMISSION EUROSTAT Directorate C: National Accounts, Prices and Key Indicators Unit C-1: National accounts methodology. Indicators ESTAT.C.1 - National accounts methodology/indicators Eurostat
K D A A M P L I F I E R S F I R M W A R E U S E R G U I D E
 K D A A M P L I F I E R S F I R M W A R E U S E R G U I D E T A B L E O F C O N T E N T S S E C T I O N 1 : P R E PA R I N G Y O U R F I L E S Via Network Router 3 S E C T I O N 2 : A C C E S S I N G T
MOHID Land Basics Walkthrough Walkthrough for MOHID Land Basic Samples using MOHID Studio
 ACTION MODULERS MOHID Land Basics Walkthrough Walkthrough for MOHID Land Basic Samples using MOHID Studio Frank Braunschweig Luis Fernandes Filipe Lourenço October 2011 This document is the MOHID Land
Investigating Weather and Climate with Google Earth Teacher Guide
 Google Earth Weather and Climate Teacher Guide In this activity, students will use Google Earth to explore global temperature changes. They will: 1. Use Google Earth to determine how the temperature of
User Guide. Affirmatively Furthering Fair Housing Data and Mapping Tool. U.S. Department of Housing and Urban Development
 User Guide Affirmatively Furthering Fair Housing Data and Mapping Tool U.S. Department of Housing and Urban Development December, 2015 1 Table of Contents 1. Getting Started... 5 1.1 Software Version...
Students will be able, using GIS, to locate the largest and most destructive earthquakes;
 Exploring Earthquake Hazards with GIS Laboratory for Introduction to Geophysics, Spring 2007 Prof. Constantin Cranganu Brooklyn College of the City University of New York Learning Objectives: Students
Preparing Spatial Data
 13 CHAPTER 2 Preparing Spatial Data Assessing Your Spatial Data Needs 13 Assessing Your Attribute Data 13 Determining Your Spatial Data Requirements 14 Locating a Source of Spatial Data 14 Performing Common
Buffer Data Capture. Exercise 4:
 Buffer Data Capture Exercise 4: This example demonstrates some available navigation tools to locate an area of interest and apply some analysis tools to the area. The area of interest is the Baldy Batholith
NC DWQ Stormwater Permitting Interactive Map
 P a g e 1 NC DWQ Stormwater Permitting Interactive Map Using This Map This interactive map viewer uses Google Fusion Tables to show North Carolina permitting information in a Google Maps Interface. Finding
Exercise 4. Watershed and Stream Network Delineation
 Exercise 4. Watershed and Stream Network Delineation GIS in Water Resources, Fall 2017 Prepared by David G Tarboton and David R. Maidment Updated to ArcGIS Pro by Paul Ruess Purpose The purpose of this
Students will be able, using GIS, to locate the largest and most destructive earthquakes;
 Exploring Earthquake Hazards with GIS Laboratory for Introduction to Geophysics, Spring 2007 Prof. Constantin Cranganu Brooklyn College of the City University of New York Learning Objectives: Students
Gas Pressure and Temperature Relationships *
 Gas Pressure and Temperature Relationships * MoLE Activities To begin this assignment you must be able to log on to the Internet (the software requires OSX for mac users). Type the following address into
New SPOT Program. Customer Tutorial. Tim Barry Fire Weather Program Leader National Weather Service Tallahassee
 New SPOT Program Customer Tutorial Tim Barry Fire Weather Program Leader National Weather Service Tallahassee tim.barry@noaa.gov Live Demonstration http://www.weather.gov/spot/ Live Demonstration http://www.weather.gov/spot/
Using Earthscope and B4 LiDAR data to analyze Southern California s active faults
 Using Earthscope and B4 LiDAR data to analyze Southern California s active faults Exercise 8: Simple landscape morphometry and stream network delineation Introduction This exercise covers sample activities
Investigating Weather with Google Earth Student Guide
 Investigating Weather with Google Earth Student Guide In this activity, you will use Google Earth to explore some factors that affect weather. You will: 1. Determine how different factors affect a location
Lab 1 Uniform Motion - Graphing and Analyzing Motion
 Lab 1 Uniform Motion - Graphing and Analyzing Motion Objectives: < To observe the distance-time relation for motion at constant velocity. < To make a straight line fit to the distance-time data. < To interpret
NMR Predictor. Introduction
 NMR Predictor This manual gives a walk-through on how to use the NMR Predictor: Introduction NMR Predictor QuickHelp NMR Predictor Overview Chemical features GUI features Usage Menu system File menu Edit
Arboretum Explorer: Using GIS to map the Arnold Arboretum
 Arboretum Explorer: Using GIS to map the Arnold Arboretum Donna Tremonte, Arnold Arboretum of Harvard University 2015 Esri User Conference (UC), July 22, 2015 http://arboretum.harvard.edu/explorer Mission
Nobeltec TimeZero V2.0.2
 Nobeltec TimeZero V2.0.2 New Features: Windows 8 Compatibility Nobeltec TimeZero v2 is now compatible with Windows 8 for Intel Compatible PC and will work as a Windows desktop app. IMPORTANT NOTICE: Nobeltec
3D Molecule Viewer of MOGADOC (JavaScript)
") 3D Molecule Viewer of MOGADOC (JavaScript) Movement of the Molecule Rotation of the molecule: Use left mouse button to drag. Translation of the molecule: Use right mouse button to drag. Resize the molecule:
3D Molecule Viewer of MOGADOC (JavaScript) Movement of the Molecule Rotation of the molecule: Use left mouse button to drag. Translation of the molecule: Use right mouse button to drag. Resize the molecule:
Synteny Portal Documentation
 Synteny Portal Documentation Synteny Portal is a web application portal for visualizing, browsing, searching and building synteny blocks. Synteny Portal provides four main web applications: SynCircos,
How to create a new geodatabase using the extract data wizard. 1. How to Extract the Schema to create a Geodatabase using an existing design.
 How to create a new geodatabase using the extract data wizard The Extract Data Wizard can be used to create a new database based on an existing geodatabase. This tool may be used in the following cases:
13 Watershed Delineation & Modeling
 Module 4 (L12 - L18): Watershed Modeling Standard modeling approaches and classifications, system concept for watershed modeling, overall description of different hydrologic processes, modeling of rainfall,
A Review: Geographic Information Systems & ArcGIS Basics
 A Review: Geographic Information Systems & ArcGIS Basics Geographic Information Systems Geographic Information Science Why is GIS important and what drives it? Applications of GIS ESRI s ArcGIS: A Review
Stoichiometric Reactor Simulation Robert P. Hesketh and Concetta LaMarca Chemical Engineering, Rowan University (Revised 4/8/09)
") Stoichiometric Reactor Simulation Robert P. Hesketh and Concetta LaMarca Chemical Engineering, Rowan University (Revised 4/8/09) In this session you will learn how to create a stoichiometric reactor model
Stoichiometric Reactor Simulation Robert P. Hesketh and Concetta LaMarca Chemical Engineering, Rowan University (Revised 4/8/09) In this session you will learn how to create a stoichiometric reactor model
Comparing whole genomes
 BioNumerics Tutorial: Comparing whole genomes 1 Aim The Chromosome Comparison window in BioNumerics has been designed for large-scale comparison of sequences of unlimited length. In this tutorial you will
Exercise 4. Watershed and Stream Network Delineation
 Exercise 4. Watershed and Stream Network Delineation GIS in Water Resources, Fall 2014 Prepared by David G Tarboton and David R. Maidment Purpose The purpose of this exercise is to illustrate watershed
Implementing a process-based decision support tool for natural resource management - the GeoWEPP example
 Implementing a process-based decision support tool for natural resource management - the GeoWEPP example Chris S. Renschler a and Dennis C. Flanagan b a Dept. of Geography, University at Buffalo - The