A Post Processing Tool to Assess Sediment and Nutrient Source Allocations from SWAT Simulations
|
|
|
- Evan Harrington
- 5 years ago
- Views:
Transcription


1 A Post Processing Tool to Assess Sediment and Nutrient Source Allocations from SWAT Simulations Michael Van Liew William Puknat Montana Department of Environmental Quality Helena, Montana, USA
2 PROBLEM: Development of Pollutant Load Allocations with SWAT Multiple simulations with SWAT required from a baseline period Retrieval of output files associated with non-point, point, and bank constituent sources Labor intensive post processing of retrieved data is required to compute average monthly or seasonal source allocations


3 SOLUTION: Creation of a set of programs to extract data from SWAT output and perform the necessary computations to develop average and monthly pollutant load allocations mixed crops 31% bank erosion 22% point sources 9% range forest 7% grass 31%
4 Major Assumption in Developing the Post Processing Tool The relative proportions of water quality constituents simulated from the landscape for each land cover and management type are assumed to be the same as those present in the most downstream reach of a delineated watershed

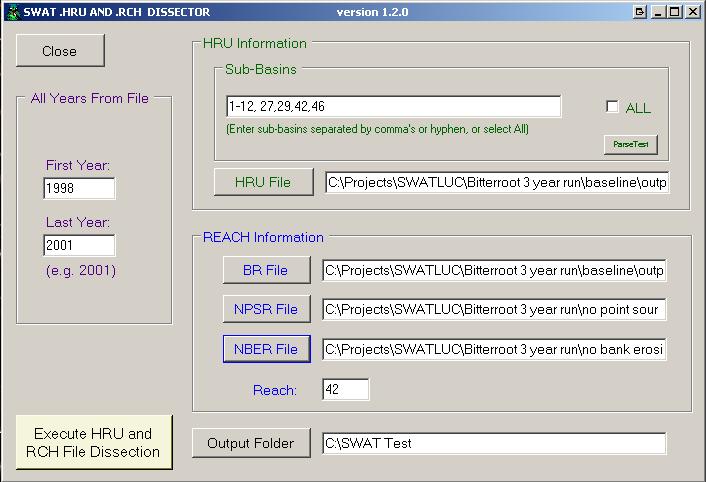
5 Procedure Output the reach and hru files from SWAT for a baseline condition that represents existing water quality conditions in an impaired stream system Rerun SWAT without simulating the effect of bank erosion and retrieve that reach file Rerun SWAT again without simulating the effect of point sources and retrieve this third reach file


6 Post Processing Tool (1) SWAT- HARD - reads the three output.rch files and retrieves sediment and constituents for nitrogen and phosphorus from the most downstream reach in the watershed - reads the output.hru file and retrieves sediment and nutrient constituents for each land cover type
7
8 Column Extraction
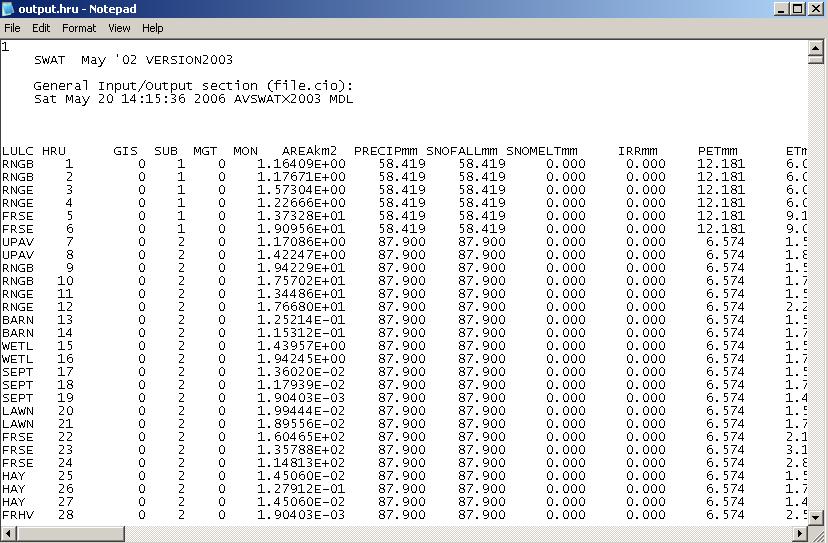
9 Column Extraction

10 Output HRU Text File

11 Output RCH Text File (x3)

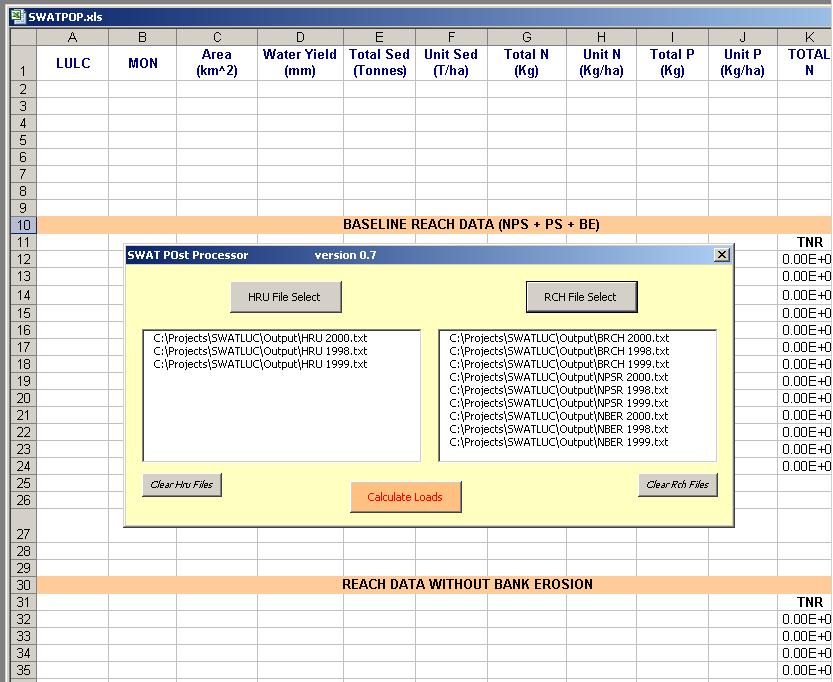
12 Post Processing Tool (2) SWAT PoP - a Microsoft Excel program with of VBA code to automate all calculations - reads text files created by SWATHARD - sorts files by land cover type, month, and watershed area - tabulates sediment, total N, and total P by bank, point, and non-point sources
13

14 1 3 2 Sort and Sum Constituents

15 Sum Land Cover Elements

16 Compute Averages

17 Application of Tool: The Bitterroot Watershed 7300 sq km drainage in Western Montana Numerous tributaries impaired for either sediment, N or P Four Waste Water Treatment Plants SWAT project consists of 85 subbasins and 1808 HRUs Watershed delineated with 15 land cover and 38 soil types Model simulations run for 11 year period of record from 1993 to 2003
18 Lolo Gage earlier record Florence Gage Missoula Airport Missoula Gage Location of Climate Stations Streamgages Stevensville Blodgett Gage earlier record Hamilton Twelve Mi. Cr Daly Cr Skalkaho Gage Darby Darby Gage East Fork Gage Laird Gage Nez Perce Camp Saddle Mt. Sula 33 Subbasin Number Climate Station Stream Gage

19 Seven Subbasin Groupings used for Calibrating Parameters that govern the Hydrologic Response on the Bitterroot Watershed
20 Modeled Sources of Sediment Yield for the Bitterroot River at Missoula based on an 11 year average 50.0% 45.0% 44.2% 40.0% 35.0% 30.0% 25.0% 22.7% 20.0% 15.0% 10.0% 16.2% 11.3% 5.0% 0.0% Bank erosion Range grass Range brush Forest Mixed crops 3.4% 0.9% 0.8% 0.2% 0.1% 0.0% 0.0% 0.0% 0.0% 0.0% 0.0% 0.0% 0.0% Hobby livestock Pasture Point sources Med urban dev Alfalfa Forest harvest Low urban dev Hobby lawn Wetlands Septic systems Barren/Ice Unpaved roads
21 Modeled Sources of Total Nitrogen Yield for the Bitterroot River at Missoula based on an 11 year average 25.0% 21.1%21.0% 20.0% 18.1% 15.0% 10.0% 10.1% 7.7% 6.1% 5.0% 4.2% 3.2% 3.1% 2.8% 2.2% 0.0% 0.3% 0.1% 0.1% 0.0% 0.0% 0.0% Bank erosion Pasture Mixed crops Forest Septic systems Range grass Alfalfa Point sources Hobby lawn Range brush Hobby livestock Med urban dev Low urban dev Forest harvest Wetlands Barren/Ice Unpaved roads
22 Modeled Sources of Total Phosphorus Yield for the Bitterroot River at Missoula based on an 11 year average 35.0% 30.0% 29.6% 25.0% 20.0% 19.8% 15.0% 10.0% 14.6% 11.6% 10.3% 7.1% 5.0% 0.0% 2.5% 1.8% 1.6% 0.7% 0.1% 0.1% 0.1% 0.1% 0.0% 0.0% 0.0% Bank erosion Mixed crops Range grass Range brush Forest Point sources Pasture Alfalfa Hobby livestock Med urban dev Low urban dev Septic systems Hobby lawn Forest harvest Wetlands Barren/Ice Unpaved roads
23 Modeled Monthly Sources of Sediment Yield for the Bitterroot River at Missoula 100.0% 90.0% 80.0% Point Source Bank Erosion Non Point Source 70.0% 60.0% 50.0% 40.0% 30.0% 20.0% 10.0% 0.0% jan feb mar apr may jun jul aug sep oct nov dec
24 Modeled Monthly Sources of Total Nitrogen Yield for the Bitterroot River at Missoula 100.0% 90.0% 80.0% Point Source Bank Erosion Non Point Source 70.0% 60.0% 50.0% 40.0% 30.0% 20.0% 10.0% 0.0% jan feb mar apr may jun jul aug sep oct nov dec
25 Modeled Monthly Sources of Total Phosphorus Yield for the Bitterroot River at Missoula 100.0% 90.0% 80.0% Point Source Bank Erosion Non Point Source 70.0% 60.0% 50.0% 40.0% 30.0% 20.0% 10.0% 0.0% jan feb mar apr may jun jul aug sep oct nov dec
26 Conclusions A post processing tool has been developed by Montana DEQ to facilitate the computation of sediment and nutrient load allocations simulated by SWAT for 303d listed streams The tool computes average monthly or seasonal allocations associated with bank erosion, point sources, and non-point sources This newly developed tool has been shown to substantially reduce the time required to develop pollutant load allocations for specific stream systems within large, complex watersheds


27 Future Development Combine into one VB.NET application using a SQL Server back-end Provide users with a variety of output formats
28 THANK YOU
Streamflow, Sediment, and Nutrient Simulation of the Bitterroot Watershed using SWAT
 Streamflow, Sediment, and Nutrient Simulation of the Bitterroot Watershed using SWAT by Dr. Michael Van Liew Montana Department of Environmental Quality Helena, Montana, USA Site Map of SWAT Watersheds
Illinois State Water Survey Division
 Illinois State Water Survey Division SURFACE WATER SECTION SWS Miscellaneous Publication 108 SEDIMENT YIELD AND ACCUMULATION IN THE LOWER CACHE RIVER by Misganaw Demissie Champaign, Illinois June 1989
GAMINGRE 8/1/ of 7
 FYE 09/30/92 JULY 92 0.00 254,550.00 0.00 0 0 0 0 0 0 0 0 0 254,550.00 0.00 0.00 0.00 0.00 254,550.00 AUG 10,616,710.31 5,299.95 845,656.83 84,565.68 61,084.86 23,480.82 339,734.73 135,893.89 67,946.95
Modeling the Effects of Climate and Land Cover Change in the Stoney Brook Subbasin of the St. Louis River Watershed
 Modeling the Effects of Climate and Land Cover Change in the Stoney Brook Subbasin of the St. Louis River Watershed Joe Johnson and Jesse Pruette 214 NASA Research Internship Geospatial Technologies Program
HYDROLOGIC AND WATER RESOURCES EVALUATIONS FOR SG. LUI WATERSHED
 HYDROLOGIC AND WATER RESOURCES EVALUATIONS FOR SG. LUI WATERSHED 1.0 Introduction The Sg. Lui watershed is the upper part of Langat River Basin, in the state of Selangor which located approximately 20
Modeling of a River Basin Using SWAT Model and SUFI-2
 Modeling of a River Basin Using SWAT Model and SUFI-2 NINA OMANI MASOUD TAJRISHY AHMAD ABRISHAMCHI Sharif University of Technology, Tehran, Iran Karkheh Dam, Iran 1 Area of Gharasu Sub-basin : 5793 km2
Climate Change Impact Assessment on Long Term Water Budget for Maitland Catchment in Southern Ontario
 215 SWAT CONFERENCE, PURDUE Climate Change Impact Assessment on Long Term Water Budget for Maitland Catchment in Southern Ontario By Vinod Chilkoti Aakash Bagchi Tirupati Bolisetti Ram Balachandar Contents
GLACIER AND SNOWMELT MODELLING USING SWAT: GANGA BASIN CASE STUDY. INRM Consultants Pvt. Ltd.
 GLACIER AND SNOWMELT MODELLING USING SWAT: GANGA BASIN CASE STUDY INRM Consultants Pvt. Ltd. Introduction Snowmelt Runoff contribution in the Himalayan Rivers Estimation of Average contribution of Snowmelt
Analyzing spatial and temporal variation of water balance components in La Vi catchment, Binh Dinh province, Vietnam
 Analyzing spatial and temporal variation of water balance components in La Vi catchment, Binh Dinh province, Vietnam Nguyen Duy Liem, Vo Ngoc Quynh Tram, Nguyen Le Tan Dat, Nguyen Kim Loi Nong Lam University-
Disentangling Impacts of Climate & Land Use Changes on the Quantity & Quality of River Flows in Southern Ontario
 Disentangling Impacts of Climate & Land Use Changes on the Quantity & Quality of River Flows in Southern Ontario by Trevor Dickinson & Ramesh Rudra, Water Resources Engineering University of Guelph Acknowledgements
Hydrologic and Water Quality Modeling for the Missouri River Basin (MORB)
") 2016 International SWAT Conference in Beijing, China Hydrologic and Water Quality Modeling for the Missouri River Basin (MORB) Zhonglong Zhang, PhD, PE, May Wu, PhD Courtesy of USACE Outline Missouri River
2016 International SWAT Conference in Beijing, China Hydrologic and Water Quality Modeling for the Missouri River Basin (MORB) Zhonglong Zhang, PhD, PE, May Wu, PhD Courtesy of USACE Outline Missouri River
Changing Hydrology under a Changing Climate for a Coastal Plain Watershed
 Changing Hydrology under a Changing Climate for a Coastal Plain Watershed David Bosch USDA-ARS, Tifton, GA Jeff Arnold ARS Temple, TX and Peter Allen Baylor University, TX SEWRU Objectives 1. Project changes
REDWOOD VALLEY SUBAREA
 Independent Science Review Panel Conceptual Model of Watershed Hydrology, Surface Water and Groundwater Interactions and Stream Ecology for the Russian River Watershed Appendices A-1 APPENDIX A A-2 REDWOOD
Hydrologic Response of SWAT to Single Site and Multi- Site Daily Rainfall Generation Models
 Hydrologic Response of SWAT to Single Site and Multi- Site Daily Rainfall Generation Models 1 Watson, B.M., 2 R. Srikanthan, 1 S. Selvalingam, and 1 M. Ghafouri 1 School of Engineering and Technology,
MARMOT CREEK BASIN: MANAGING FORESTS FOR WATER
 MARMOT CREEK BASIN: MANAGING FORESTS FOR WATER CABIN AND TWIN CREEK EXPERIMENTS 1962-1987 MARMOT CREEK SUBBASINS Subbasin Drainage Treatment Area (ha) (completion date) Cabin Creek 212 (50%)* Commercial
Lake Tahoe Watershed Model. Lessons Learned through the Model Development Process
 Lake Tahoe Watershed Model Lessons Learned through the Model Development Process Presentation Outline Discussion of Project Objectives Model Configuration/Special Considerations Data and Research Integration
Nina Omani, Raghavan Srinivasan, and Taesoo Lee. Spatial Sciences Laboratory, Texas A&M University
 Nina Omani, Raghavan Srinivasan, and Taesoo Lee Spatial Sciences Laboratory, Texas A&M University This project was initiated to develop and apply the SWAT model to two Texas estuaries in order to estimate
Application of an Enhanced, Fine-Scale SWAT Model to Target Land Management Practices for Maximizing Pollutant Reduction and Conservation Benefits
 Application of an Enhanced, Fine-Scale SWAT Model to Target Land Management Practices for Maximizing Pollutant Reduction and Conservation Benefits Amanda Flynn, Todd Redder, Joe DePinto, Derek Schlea Brian
Assessing Spatial and Temporal Distribution of Sediment, Nitrogen and Phosphorous Loading in the Missouri River Basin (MORB)
") Assessing Spatial and Temporal Distribution of Sediment, Nitrogen and Phosphorous Loading in the Missouri River Basin (MORB) Zhonglong Zhang, PhD, PE, May Wu, PhD LimnoTech, Environmental Laboratory, ERDC,
Assessing Spatial and Temporal Distribution of Sediment, Nitrogen and Phosphorous Loading in the Missouri River Basin (MORB) Zhonglong Zhang, PhD, PE, May Wu, PhD LimnoTech, Environmental Laboratory, ERDC,
a) Name the features marked P,Q, and R b) Differentiate between a normal faulty and a reverse fault. 2. Use the diagram below to answer question (a)
 Name the features marked P,Q, and R b) Differentiate between a normal faulty and a reverse fault. 2. Use the diagram below to answer question (a)") GEOGRAPHY PAPER 312 / 1 K.C.S.E 2002 SECTION A Answer all the questions in this section 1. The diagram below represents features produced by faulting. Use it to answer questions that follow. a) Name the
GEOGRAPHY PAPER 312 / 1 K.C.S.E 2002 SECTION A Answer all the questions in this section 1. The diagram below represents features produced by faulting. Use it to answer questions that follow. a) Name the
Promoting Rainwater Harvesting in Caribbean Small Island Developing States Water Availability Mapping for Grenada Preliminary findings
 Promoting Rainwater Harvesting in Caribbean Small Island Developing States Water Availability Mapping for Grenada Preliminary findings National Workshop Pilot Project funded by The United Nations Environment
Webinar and Weekly Summary February 15th, 2011
 Webinar and Weekly Summary February 15th, 2011 -Assessment of current water conditions - Precipitation Forecast - Recommendations for Drought Monitor Upper Colorado Normal Precipitation Upper Colorado
Chiang Rai Province CC Threat overview AAS1109 Mekong ARCC
 Chiang Rai Province CC Threat overview AAS1109 Mekong ARCC This threat overview relies on projections of future climate change in the Mekong Basin for the period 2045-2069 compared to a baseline of 1980-2005.
3.0 TECHNICAL FEASIBILITY
 3.0 TECHNICAL FEASIBILITY 3.1 INTRODUCTION To enable seasonal storage and release of water from Lake Wenatchee, an impoundment structure would need to be constructed on the lake outlet channel. The structure
Stream Discharge and the Water Budget
 Regents Earth Science Unit 6: Water Cycle & Climate Name: Lab # Stream Discharge and the Water Budget Introduction: The United States Geological Survey (USGS) measures and publishes values for the daily
The Climate of Oregon Climate Zone 5 High Plateau
 105 E55 Unbound issue i". 9 13oes not circulate CZe Special Report 917 May 1993 The Climate of Oregon Climate Zone 5 Property of OREGON STATE UNIVERSITY Library Serials Corvallis, OR 97331-4503 Agricultural
July, International SWAT Conference & Workshops
 July, 212 212 International SWAT Conference & Workshops Hydrological Modelling of Kosi and Gandak Basins using SWAT Model S. Dutta, Pritam Biswas, Sangita Devi, Suresh A Karth and Bimlesh kumar, Ganga
Unconventional Wisdom and the Effects of Dams on Downstream Coarse Sediment Supply. Byron Amerson, Jay Stallman, John Wooster, and Derek Booth
 Unconventional Wisdom and the Effects of Dams on Downstream Coarse Sediment Supply 3 February 2009 Byron Amerson, Jay Stallman, John Wooster, and Derek Booth Sultan River, WA OBJECTIVE Consider the landscape
THE STATE OF SURFACE WATER GAUGING IN THE NAVAJO NATION
 THE STATE OF SURFACE WATER GAUGING IN THE NAVAJO NATION Aregai Tecle Professor of Hydrology Northern Arizona University Flagstaff, AZ Acknowledgement Many thanks to my research team mates and Elisabeth
Climate also has a large influence on how local ecosystems have evolved and how we interact with them.
 The Mississippi River in a Changing Climate By Paul Lehman, P.Eng., General Manager Mississippi Valley Conservation (This article originally appeared in the Mississippi Lakes Association s 212 Mississippi
Evaluation of the two stage ditch as a best management practice. A. Hodaj, L.C. Bowling, C. Raj, I. Chaubey
 Evaluation of the two stage ditch as a best management practice A. Hodaj, L.C. Bowling, C. Raj, I. Chaubey Two-stage ditch: Stage 1 : main channel Stage 2 : flood plain bench Traditional ditch Twostage
WHEN IS IT EVER GOING TO RAIN? Table of Average Annual Rainfall and Rainfall For Selected Arizona Cities
 WHEN IS IT EVER GOING TO RAIN? Table of Average Annual Rainfall and 2001-2002 Rainfall For Selected Arizona Cities Phoenix Tucson Flagstaff Avg. 2001-2002 Avg. 2001-2002 Avg. 2001-2002 October 0.7 0.0
HYDROLOGICAL MODELING OF HIGHLY GLACIERIZED RIVER BASINS. Nina Omani, Raghavan Srinivasan, Patricia Smith, Raghupathy Karthikeyan, Gerald North
 HYDROLOGICAL MODELING OF HIGHLY GLACIERIZED RIVER BASINS Nina Omani, Raghavan Srinivasan, Patricia Smith, Raghupathy Karthikeyan, Gerald North Problem statement Glaciers help to keep the earth cool High
Long-term Water Quality Monitoring in Estero Bay
 Long-term Water Quality Monitoring in Estero Bay Keith Kibbey Laboratory Director Lee County Environmental Laboratory Division of Natural Resource Management Estero Bay Monitoring Programs Three significant
Jackson County 2018 Weather Data 67 Years of Weather Data Recorded at the UF/IFAS Marianna North Florida Research and Education Center
 Jackson County 2018 Weather Data 67 Years of Weather Data Recorded at the UF/IFAS Marianna North Florida Research and Education Center Doug Mayo Jackson County Extension Director 1952-2008 Rainfall Data
EXAMPLE WATERSHED CONFIGURATIONS
 APPENDIX B EXAMPLE WATERSHED CONFIGURATIONS The watershed configuration file defines the spatial relationship of objects within the watershed. The three techniques used to subdivide a watershed are the
Algae and Dissolved Oxygen Dynamics of Landa Lake and the Upper Spring Run
 Algae and Dissolved Oxygen Dynamics of Landa Lake and the Upper Spring Run Why study algae and dissolved oxygen dynamics of Landa Lake and the Upper Spring Run? During low-flow conditions, extensive algal
SWAT 2015 International Conference:
 SWAT 2015 International Conference: Comparative Analysis of Spatial Resolution Effects on Standard and Grid-based SWAT Models Presented by: Garett Pignotti Co-authors: Dr. Hendrik Rathjens, Dr. Cibin Raj,
Raktim Haldar Research Scholar Department of Civil Engineering Indian Institute of Technology, Delhi
 Raktim Haldar Research Scholar Department of Civil Engineering Indian Institute of Technology, Delhi Issues to be addressed Introduction to the Vembanad Lake and surrounding scenario of development Anthropogenic
The Climate of Oregon Climate Zone 4 Northern Cascades
 /05 E55 Unbound issue No. 9/ is Does not circulate Special Report 916 May 1993 The Climate of Oregon Climate Zone 4 Property of OREGON STATE UNIVERSITY Library Serials Corvallis, OR 97331-4503 Agricultural
Time Series Analysis
 Time Series Analysis A time series is a sequence of observations made: 1) over a continuous time interval, 2) of successive measurements across that interval, 3) using equal spacing between consecutive
Jackson County 2013 Weather Data
 Jackson County 2013 Weather Data 61 Years of Weather Data Recorded at the UF/IFAS Marianna North Florida Research and Education Center Doug Mayo Jackson County Extension Director 1952-2008 Rainfall Data
Eagle Mountain Watershed: Calibration, Validation, and Best Management
 COLLEGE OF AGRICULTURE AND LIFE SCIENCES TR-408 2011 Eagle Mountain Watershed: Calibration, Validation, and Best Management By Taesoo Lee, Balaji Narasimhan, and Raghavan Srinivasan Spatial Science Laboratory,
Squaw Creek. General Information
 General Information is a tributary to the Salmon River. It enters the north side of the river about 0 miles downstream of North Fork, Idaho. The study reach is about a 30 ft length of stream about 2 miles
2003 Water Year Wrap-Up and Look Ahead
 2003 Water Year Wrap-Up and Look Ahead Nolan Doesken Colorado Climate Center Prepared by Odie Bliss http://ccc.atmos.colostate.edu Colorado Average Annual Precipitation Map South Platte Average Precipitation
A large scale and fine resolution SWAT model for an assessment of isolated climate change impact on unaltered flow regimes in Central Eastern Europe
 A large scale and fine resolution SWAT model for an assessment of isolated climate change impact on unaltered flow regimes in Central Eastern Europe Mikołaj Piniewski 1,2, Mateusz Szcześniak 2, Tomasz
APPLICATIONS OF DOWNSCALING: HYDROLOGY AND WATER RESOURCES EXAMPLES
 APPLICATIONS OF DOWNSCALING: HYDROLOGY AND WATER RESOURCES EXAMPLES Dennis P. Lettenmaier Department of Civil and Environmental Engineering For presentation at Workshop on Regional Climate Research NCAR
CoCoRaHS Monitoring Colorado s s Water Resources through Community Collaborations
 CoCoRaHS Monitoring Colorado s s Water Resources through Community Collaborations Nolan Doesken Colorado Climate Center Atmospheric Science Department Colorado State University Presented at Sustaining
Planning Wetland Restoration in Agricultural Watersheds to improve water quality
 Planning Wetland Restoration in Agricultural Watersheds to improve water quality Francisco A. Comín 1, Ricardo Sorando 1, Alfonso Calvo 2, Victor Guirado 3, Nadia Darwiche 1 1 Instituto Pirenaico Ecologia-CSIC,
Table 1 - Infiltration Rates
 Stantec Consulting Ltd. 100-300 Hagey Boulevard, Waterloo ON N2L 0A4 November 14, 2017 File: 161413228/10 Attention: Mr. Michael Witmer, BES, MPA, MCIP, RPP City of Guelph 1 Carden Street Guelph ON N1H
Variability of Reference Evapotranspiration Across Nebraska
 Know how. Know now. EC733 Variability of Reference Evapotranspiration Across Nebraska Suat Irmak, Extension Soil and Water Resources and Irrigation Specialist Kari E. Skaggs, Research Associate, Biological
Appendix E Plots from the Evaluation of the CNRFC Operational Hydrologic Model
 Appendix E Plots from the Evaluation of the CNRFC Operational Hydrologic Model APE-1 2 Trinity Lake Inflow 2 1 Simulated 1 1 1 2 2 Observed Figure APE-1. Simulated daily flow versus observed (FNF) flow
Terrestrial pyrogenic carbon export to fluvial ecosystems: lessons learned from the White Nile watershed of East Africa
 Global Biogeochemical Cycles Supporting Information for Terrestrial pyrogenic carbon export to fluvial ecosystems: lessons learned from the White ile watershed of East Africa David T. Güereña, Johannes
Use of SWAT to Scale Sediment Delivery from Field to Watershed in an Agricultural Landscape with Depressions
 Use of SWAT to Scale Sediment Delivery from Field to Watershed in an Agricultural Landscape with Depressions James E. Almendinger St. Croix Watershed Research Station, Science Museum of Minnesota Marylee
ENGINE SERIAL NUMBERS
 ENGINE SERIAL NUMBERS The engine number was also the serial number of the car. Engines were numbered when they were completed, and for the most part went into a chassis within a day or so. However, some
Validation of the Weather Generator CLIGEN with Precipitation Data from Uganda. W. J. Elliot C. D. Arnold 1
 Validation of the Weather Generator CLIGEN with Precipitation Data from Uganda W. J. Elliot C. D. Arnold 1 9/19/00 ABSTRACT. Precipitation records from highland and central plains sites in Uganda were
WOLF CREEK GARRARD DITCH DIVESION GRINNELL DITCH DIVERSION ON WOLF CREEK
 WOLF CREEK GARRARD DITCH DIVESION GRINNELL DITCH DIVERSION ON WOLF CREEK WOLF CREEK DRAINAGE INTRODUCTION BIG PICTURE Wolf Creek flows out of the east slope of the Bighorn Mountains, between the tributaries
Climatic and Ecological Conditions in the Klamath Basin of Southern Oregon and Northern California: Projections for the Future
 Climatic and Ecological Conditions in the Klamath Basin of Southern Oregon and Northern California: Projections for the Future A Collaborative Effort by: CLIMATE LEADERSHIP INITIATIVE INSTITUTE FOR A SUSTAINABLE
Water Management for Environmental Restoration Flows In the Big Bend reach, Rio Grande Rio Bravo
 University of California, Davis Department of Land, Air and Water Resources Water Management for Environmental Restoration Flows In the Big Bend reach, Rio Grande Rio Bravo 46 th Annual Meeting 8 9 March,
Weather and Climate of the Rogue Valley By Gregory V. Jones, Ph.D., Southern Oregon University
 Weather and Climate of the Rogue Valley By Gregory V. Jones, Ph.D., Southern Oregon University The Rogue Valley region is one of many intermountain valley areas along the west coast of the United States.
SWAT2009_LUC: A TOOL TO ACTIVATE LAND USE CHANGE MODULE IN SWAT 2009
 SWAT2009_LUC: A TOOL TO ACTIVATE LAND USE CHANGE MODULE IN SWAT 2009 Naresh Pai Dharmendra Saraswat Department of Biological & Agricultural Engineering Presented at: BACKGROUND Simulate impact of soil,
Chapter-3 GEOGRAPHICAL LOCATION, CLIMATE AND SOIL CHARACTERISTICS OF THE STUDY SITE
 Chapter-3 GEOGRAPHICAL LOCATION, CLIMATE AND SOIL CHARACTERISTICS OF THE STUDY SITE Chapter-3 GEOGRAPHICAL LOCATION, CLIMATE AND SOIL CHARACTERISTICS OF THE STUDY SITE Assam, the eastern most state of
Appendix C. AMEC Evaluation of Zuni PPIW. Appendix C. Page C-1 of 34
 AMEC s Independent Estimate of PPIW Crop Water Use Using the ASCE Standardized Reference Evapotranspiration via Gridded Meteorological Data, and Estimation of Crop Coefficients, and Net Annual Diversions
Climate Variability in South Asia
 Climate Variability in South Asia V. Niranjan, M. Dinesh Kumar, and Nitin Bassi Institute for Resource Analysis and Policy Contents Introduction Rainfall variability in South Asia Temporal variability
Climate Change and Water Supply Research. Drought Response Workshop October 8, 2013
 Climate Change and Water Supply Research Drought Response Workshop October 8, 2013 DWR Photo Oroville Reservoir, 2009 Talk Overview Expectations History Atmospheric Rivers and Water Supply Current Research
Climatography of the United States No
 Month (1) Min (2) Month(1) Extremes Lowest (2) Temperature ( F) Lowest Month(1) Degree s (1) Base Temp 65 Heating Cooling 100 Number of s (3) Jan 63.9 39.3 51.6 86 1976 16 56.6 1986 20 1976 2 47.5 1973
Climatography of the United States No
 Temperature ( F) Month (1) Min (2) Month(1) Extremes Lowest (2) Lowest Month(1) Degree s (1) Base Temp 65 Heating Cooling 100 Number of s (3) Jan 32.8 21.7 27.3 62 1918 1 35.8 1983-24 1950 29 10.5 1979
Flood Inundation Mapping under different climate change scenarios in the upper Indus River Basin, Pakistan
 Flood Inundation Mapping under different climate change scenarios in the upper Indus River Basin, Pakistan Sohaib Baig (doctoral student) 16 November 2017 Disaster Prevention Research Institute 1 Kyoto
PRELIMINARY DRAFT FOR DISCUSSION PURPOSES
 Memorandum To: David Thompson From: John Haapala CC: Dan McDonald Bob Montgomery Date: February 24, 2003 File #: 1003551 Re: Lake Wenatchee Historic Water Levels, Operation Model, and Flood Operation This
Typical Hydrologic Period Report (Final)
") (DELCORA) (Final) November 2015 (Updated April 2016) CSO Long-Term Control Plant Update REVISION CONTROL REV. NO. DATE ISSUED PREPARED BY DESCRIPTION OF CHANGES 1 4/26/16 Greeley and Hansen Pg. 1-3,
(DELCORA) (Final) November 2015 (Updated April 2016) CSO Long-Term Control Plant Update REVISION CONTROL REV. NO. DATE ISSUED PREPARED BY DESCRIPTION OF CHANGES 1 4/26/16 Greeley and Hansen Pg. 1-3,
Sedimentation in the Nile River
 Advanced Training Workshop on Reservoir Sedimentation Sedimentation in the Nile River Prof. Dr. Abdalla Abdelsalam Ahmed 10-16 Oct. 2007, IRTCES, Beijing, China CWR,Sudan 1 Water is essential for mankind
Climatography of the United States No
 Climate Division: AK 5 NWS Call Sign: ANC Month (1) Min (2) Month(1) Extremes Lowest (2) Temperature ( F) Lowest Month(1) Degree s (1) Base Temp 65 Heating Cooling 90 Number of s (3) Jan 22.2 9.3 15.8
Jackson County 2014 Weather Data
 Jackson County 2014 Weather Data 62 Years of Weather Data Recorded at the UF/IFAS Marianna North Florida Research and Education Center Doug Mayo Jackson County Extension Director 1952-2008 Rainfall Data
Communicating Climate Change Consequences for Land Use
 Communicating Climate Change Consequences for Land Use Site: Prabost, Skye. Event: Kyle of Lochalsh, 28 th February 28 Further information: http://www.macaulay.ac.uk/ladss/comm_cc_consequences.html Who
Winter Season Resource Adequacy Analysis Status Report
 Winter Season Resource Adequacy Analysis Status Report Tom Falin Director Resource Adequacy Planning Markets & Reliability Committee October 26, 2017 Winter Risk Winter Season Resource Adequacy and Capacity
StreamStats: Delivering Streamflow Information to the Public. By Kernell Ries
 StreamStats: Delivering Streamflow Information to the Public By Kernell Ries U.S. Department of the Interior U.S. Geological Survey MD-DE-DC District 410-238-4317 kries@usgs.gov StreamStats Web Application
FORM A GEOGRAPHY 1114 LABORATORY FINAL EXAM Teaching Assistant SAMPLE Lab Meeting. Place all answers on the answer sheet; 2 points per question
 FORM A GEOGRAPHY 1114 NAME LABORATORY FINAL EXAM Teaching Assistant SAMPLE Lab Meeting Place all answers on the answer sheet; 2 points per question FORMULAS PPT = (PET-D) + S ± = Δ SOIL G = V H Q = V A
4. THE HBV MODEL APPLICATION TO THE KASARI CATCHMENT
 Application of HBV model to the Kasari River, 1994 Page 1 of 6 Application of the HBV model to the Kasari river for flow modulation of catchments characterised by specific underlying features by R. Vedom,
Global Climates. Name Date
 Global Climates Name Date No investigation of the atmosphere is complete without examining the global distribution of the major atmospheric elements and the impact that humans have on weather and climate.
Climatography of the United States No
 Climate Division: CA 4 NWS Call Sign: Month (1) Min (2) Month(1) Extremes Lowest (2) Temperature ( F) Lowest Month(1) Degree s (1) Base Temp 65 Heating Cooling 100 Number of s (3) Jan 55.6 39.3 47.5 77
Climatography of the United States No
 Climate Division: CA 5 NWS Call Sign: Month (1) Min (2) Month(1) Extremes Lowest (2) Temperature ( F) Lowest Month(1) Degree s (1) Base Temp 65 Heating Cooling 100 Number of s (3) Jan 56.6 36.5 46.6 81
Climatography of the United States No
 Climate Division: CA 1 NWS Call Sign: Month (1) Min (2) Month(1) Extremes Lowest (2) Temperature ( F) Lowest Month(1) Degree s (1) Base Temp 65 Heating Cooling 100 Number of s (3) Jan 57.9 38.9 48.4 85
Climatography of the United States No
 Climate Division: CA 5 NWS Call Sign: Month (1) Min (2) Month(1) Extremes Lowest (2) Temperature ( F) Lowest Month(1) Degree s (1) Base Temp 65 Heating Cooling 100 Number of s (3) Jan 44.8 25.4 35.1 72
Climatography of the United States No
 Climate Division: CA 4 NWS Call Sign: Month (1) Min (2) Month(1) Extremes Lowest (2) Temperature ( F) Lowest Month(1) Degree s (1) Base Temp 65 Heating Cooling 100 Number of s (3) Jan 49.4 37.5 43.5 73
Climatography of the United States No
 Climate Division: CA 6 NWS Call Sign: Month (1) Min (2) Month(1) Extremes Lowest (2) Temperature ( F) Lowest Month(1) Degree s (1) Base Temp 65 Heating Cooling 100 Number of s (3) Jan 69.4 46.6 58.0 92
Climatography of the United States No
 Climate Division: CA 4 NWS Call Sign: Month (1) Min (2) Month(1) Extremes Lowest (2) Temperature ( F) Lowest Month(1) Degree s (1) Base Temp 65 Heating Cooling 1 Number of s (3) Jan 58.5 38.8 48.7 79 1962
Climatography of the United States No
 Climate Division: CA 6 NWS Call Sign: Month (1) Min (2) Month(1) Extremes Lowest (2) Temperature ( F) Lowest Month(1) Degree s (1) Base Temp 65 Heating Cooling 1 Number of s (3) Jan 67.5 42. 54.8 92 1971
Climatography of the United States No
 Climate Division: CA 1 NWS Call Sign: Month (1) Min (2) Month(1) Extremes Lowest (2) Temperature ( F) Lowest Month(1) Degree s (1) Base Temp 65 Heating Cooling 1 Number of s (3) Jan 57.8 39.5 48.7 85 1962
The Climate of Oregon Climate Zone 3 Southwest Interior
 .k) 105 Unbound issue " " 1 4oes not circulate C4P. Special Report 915 May 1993 The Climate of Oregon Climate Zone 3 Southwest Interior Property of OREGON STATE UNIVERSITY Library Serials Corvallis, OR
El Nino 2015 in South Sudan: Impacts and Perspectives. Raul Cumba
 El Nino 2015 in South Sudan: Impacts and Perspectives Raul Cumba El Nino 2015-2016 The El Nino Event of 2015-2016 The 2015/16 El Nino Event Officially declared in March 2015 Now approaching peak intensity
Long-term Precipitation Trends in Colorado. Nolan Doesken Colorado State Climatologist Presented: Friday, December 12, 2008
 Long-term Precipitation Trends in Colorado Nolan Doesken Colorado State Climatologist Presented: Friday, December 12, 28 Colorado Mean Annual Precipitation (1971-2) Of All Our Climate Observing Stations
Memo. I. Executive Summary. II. ALERT Data Source. III. General System-Wide Reporting Summary. Date: January 26, 2009 To: From: Subject:
 Memo Date: January 26, 2009 To: From: Subject: Kevin Stewart Markus Ritsch 2010 Annual Legacy ALERT Data Analysis Summary Report I. Executive Summary The Urban Drainage and Flood Control District (District)
A Report on a Statistical Model to Forecast Seasonal Inflows to Cowichan Lake
 A Report on a Statistical Model to Forecast Seasonal Inflows to Cowichan Lake Prepared by: Allan Chapman, MSc, PGeo Hydrologist, Chapman Geoscience Ltd., and Former Head, BC River Forecast Centre Victoria
Climatography of the United States No
 Climate Division: ND 8 NWS Call Sign: BIS Month (1) Min (2) Month(1) Extremes Lowest (2) Temperature ( F) Lowest Month(1) Degree s (1) Base Temp 65 Heating Cooling 100 Number of s (3) Jan 21.1 -.6 10.2
Climatography of the United States No
 Climate Division: TN 1 NWS Call Sign: Month (1) Min (2) Month(1) Extremes Lowest (2) Temperature ( F) Lowest Month(1) Degree s (1) Base Temp 65 Heating Cooling 100 Number of s (3) Jan 47.6 24.9 36.3 81
Climatography of the United States No
 Climate Division: CA 5 NWS Call Sign: FAT Month (1) Min (2) Month(1) Extremes Lowest (2) Temperature ( F) Lowest Month(1) Degree s (1) Base Temp 65 Heating Cooling 1 Number of s (3) Jan 53.6 38.4 46. 78
Climatography of the United States No
 Climate Division: CA 6 NWS Call Sign: 1L2 N Lon: 118 3W Month (1) Min (2) Month(1) Extremes Lowest (2) Temperature ( F) Lowest Month(1) Degree s (1) Base Temp 65 Heating Cooling 1 Number of s (3) Jan 63.7
Climatography of the United States No
 Climate Division: CA 5 NWS Call Sign: BFL Month (1) Min (2) Month(1) Extremes Lowest (2) Temperature ( F) Lowest Month(1) Degree s (1) Base Temp 65 Heating Cooling 1 Number of s (3) Jan 56.3 39.3 47.8
Chapter 4 French Broad River Subbasin Including the: French Broad River, Little Ivy Creek (River), Ivy Creek, California Creek and Bull Creek
, Ivy Creek, California Creek and Bull Creek") Chapter 4 French Broad River Subbasin 04-03-04 Including the: French Broad River, Little Ivy Creek (River), Ivy Creek, California Creek and Bull Creek 4.1 Subbasin Overview Subbasin 04-03-04 at a Glance
Chapter 4 French Broad River Subbasin 04-03-04 Including the: French Broad River, Little Ivy Creek (River), Ivy Creek, California Creek and Bull Creek 4.1 Subbasin Overview Subbasin 04-03-04 at a Glance
Technical Note: Hydrology of the Lukanga Swamp, Zambia
 Technical Note: Hydrology of the Lukanga Swamp, Zambia Matthew McCartney July 7 Description The Lukanga swamp is located approximately 5km west of the city of Kabwe, in the Central province of Zambia,