Examination of Direct Discharge Measurement Data and Historic Daily Data for Selected Gages on the Middle Mississippi River,
|
|
|
- Lora Wright
- 5 years ago
- Views:
Transcription

1 Examination of Direct Discharge Measurement Data and Historic Daily Data for Selected Gages on the Middle Mississippi River, Richard J. Huizinga, P.E. U.S. Geological Survey Missouri Water Science Center U.S. Department of the Interior U.S. Geological Survey


2 Background US Geological Survey has assisted US Army Corps of Engineers with stage and discharge data collection on the Middle Mississippi River since 1930s In recent years, some researchers have found what appear to be trends of rising stage for a given discharge USACE AREC asked USGS to examine measurement data for possible trends, and discuss cause-and-effect mechanisms
3 Factors Affecting Stage & Discharge In-channel structures Dikes, bendway weirs, chevrons Floodplain structures Levees, floodwalls, roadways Water Temperature Cold water-> higher Q for given stage Seasonal variations in vegetation thickness Thicker vegetation at end of growing season-> lower Q for given stage Timing of measurement Rising limb of hydrograph-> higher Q for given stage Errors in measurement All must be considered when evaluating changes in stage or discharge with time Small changes might just as likely be caused by natural phenomena as by human impacts
")

4 Location Middle Mississippi River (MMR) Primarily examined data from gages at St. Louis & Chester

5 Mississippi River at St. Louis, Missouri Daily stage and discharge values from 1861 at St. Louis staff gage in database USGS began operating in 1933, continuous stagedischarge data, Eads Bridge Measurement methods Price AA transition 1998-> ADCP Measurement location Municipal/ MacArthur Bridge Poplar Street

6 Mississippi River at Chester, Illinois Daily stage values from 1891 in database USGS began operating in 1942, continuous stage-discharge data Measurement methods Price AA transition 1997-> ADCP Measurement location Chester Bridge boat

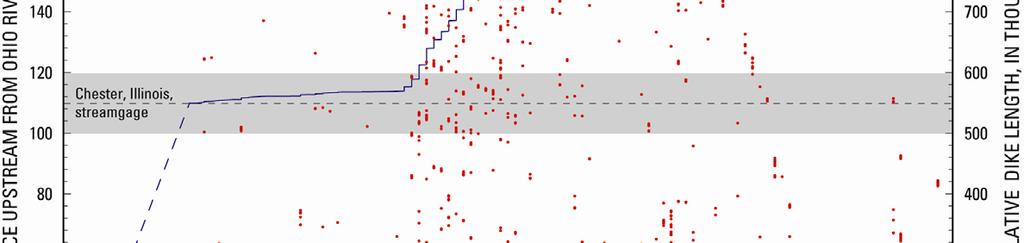
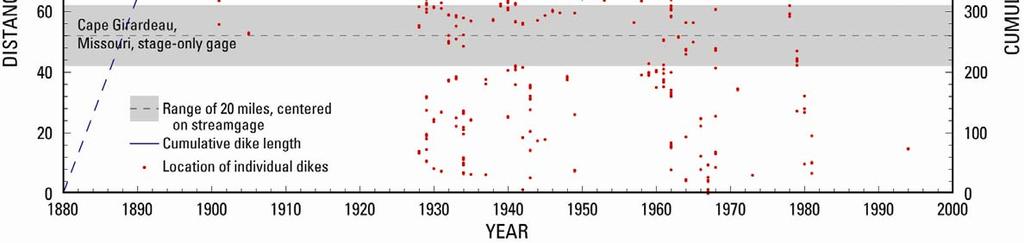
7 History of Dikes on MMR
8 History of Floods on MMR (from St. Louis gage) Historic Peak: June 1844, ft stage Estimated Discharge: 1,000,000 cfs Before USGS Operation Since USGS Operation Date Stage Discharge Date Stage Discharge May ,000 May ,000 June ,000 April ,000 May ,000 July ,000 June ,020,000 July ,000 June ,000 April ,000 July ,000 Aug ,070,000 April ,000 May ,000 April ,300
9 Data Examined for Period of USGS Operation Stage-Discharge Relation (Rating) for Measurements Stage from Rating Curves Measured Top-Width from Measurements Average Velocity from Measurements Average Bed Elevation Cross Sections from Measurements Data Examined for Historic Period of Record Difference in Water-Surface Elevation Daily Data at St. Louis, Missouri, since 1861
10 Data Examined for Period of USGS Operation Stage-Discharge Relation (Rating) for Measurements Stage from Rating Curves Measured Top-Width from Measurements Average Velocity from Measurements Average Bed Elevation Cross Sections from Measurements Data Examined for Historic Period of Record Difference in Water-Surface Elevation Daily Data at St. Louis, Missouri, since 1861
11 Stage-Discharge Relation (Rating) St. Louis, Missouri
12 Stage-Discharge Relation (Rating) St. Louis, Missouri 3,356 measurements
13 Stage-Discharge Relation (Rating) Chester, Illinois 2,594 measurements
14 Stage-Discharge Relation (Rating) St. Louis, Missouri
15 Stage-Discharge Relation (Rating) Chester, Illinois
16 Stage from Rating St. Louis, Missouri Because the rating is a best-fit curve, minor fluctuations are smoothed out
17 Stage from Ratings St. Louis, Missouri Chester, Illinois
18 Stage from Ratings St. Louis, Missouri
19 Stage from Ratings Chester, Illinois
20 Stage from Measurements and Ratings St. Louis Below flood stage, appears to be decreasing with time Above flood stage, shows some increase with time Chester Below 2/3 flood stage, appears to be decreasing with time Above 2/3 flood stage, appears to be increasing with time Decreases below flood stage likely are caused by effects of wing dikes (as designed) and reduced sediment flux Increases above flood stage likely are caused by construction or raising of levees Large floods (such as in 70 s and 90 s) caused temporary fluctuations in rating Highest flows STL stages decreasing with time Chester stages increasing with time

21 Average Bed Elevation from Measurements St. Louis, Missouri
22 Average Bed Elevation from Measurements Chester, Illinois
23 Average Bed Elevation from Measurements Value determined from Total Measured Area divided by Top Width, subtracted from gage height For flows higher than bank-full, average bed is strongly influenced by flood plain
24 Average Bed Elevation from Measurements
25 Examination of Measurement Data Top widths STL Indicates change in measurement location Chester Indicates infilling of overflow channel Average Velocity STL No substantial changes with time Chester Slight increase with time Average Bed Elevation STL When measurement location change considered, indicates lowering of bed with time Chester Slight raising of bed with time Profoundly affected by and responsive to floods
26 Data Examined for Period of USGS Operation Stage-Discharge Relation (Rating) for Measurements Stage from Rating Curves Measured Top-Width from Measurements Average Velocity from Measurements Average Bed Elevation Cross Sections from Measurements Data Examined for Historic Period of Record Difference in Water-Surface Elevation Daily Data at St. Louis, Missouri, since 1861

27 Daily Data at St. Louis, Missouri, since 1861 USGS
28 Daily Data at St. Louis, Missouri, since 1861
29 Daily Data at St. Louis, Missouri, since 1861
30 Daily Data at St. Louis, Missouri, since 1861 Before USGS began operation in 1933, USACE used: Different measurement equipment (floats & rods, meters) Different measurement techniques (boat measurements) Comparison studies in 1940s and 1970s showed the earlier equipment and methods used by USACE measured as much as 17 percent more than USGS Price AA current meter (higher Q for a given stage) Physical model tests of historic floods (using historic floodplain conditions) by USACE (Dyhouse, 1995) Suggested nearly 33 percent reduction of 1844 peak to 870,000 cfs Suggested reducing 1903 peak to 780,000 cfs (23% reduction) However, offered no systematic adjustment of remainder of data record
31 Daily Data at St. Louis, Missouri, since 1861 Historic peak in 1844 was an isolated point Peak in 1903 was part of a systematic period of record Cannot adjust peak without adjusting entire record - Neighboring daily values - Other flood peaks Ultimately 1844 peak reduced to 1,000,000 cfs (23%) No change made to 1903 peak of 1,020,000 cfs If a proportional reduction of entire historic record were to occur to bring 1844 and 1903 peaks to suggested levels
32 Daily Data at St. Louis, Missouri, since 1861
33 Daily Data at St. Louis, Missouri, since 1861
34 Summary Since USGS began operation of gages: Stage is decreasing for a given discharge at St. Louis for flows less than bank-full, due to wing dikes and reduced sediment flux Stage is decreasing for a given discharge at Chester for flows less than 2/3 bank-full, due to combined action of wing dikes and reduced sediment flux, and in-filling of Horse Island Chute overflow Stage has increased for a given discharge for flows greater than bank-full at both streamgages, primarily due to levees on flood plains Measurement methods, equipment, and location must be consistent for a valid comparison of data with time Floods have a substantial effect on trends in measurements and daily data There may be justification to adjust the historic systematic period of record prior to USGS operation
35 Future Research Needs Need to examine other stations with period of record extending through the transition from USACE to USGS operation to find similar step changes MoWSC has archived USCOE Mississippi River Commission documents containing daily stage (back to 1887 at least) and daily discharge (back to 1928) for other stations on MMR (Chester, Thebes) need to be digitized (paper copies only) Other stations not on MMR Re-examine comparison measurements done in 40 s and 70 s Not to validate measurements using different methods Isolate and quantify the differences for potential corrections Use other archived USCOE MRC documents containing measurement information (back to 1866) to examine measurement techniques and how ratings were developed

36 Final Report Examination of Direct Discharge Measurement Data and Historic Daily Data for Selected Gages on the Middle Mississippi River, by Richard J. Huizinga USGS Scientific Investigations Report /5232/
 http://water.usgs.gov/waterwatch/ Stream Flow Measurement: Velocity-Area method Stream discharge = Q = U * A Q = volumetric flow rate in [L 3 T -1 ] U= average stream velocity [L 2 T -1 ] A = cross sectional
YELLOWSTONE RIVER FLOOD STUDY REPORT TEXT
 YELLOWSTONE RIVER FLOOD STUDY REPORT TEXT TECHNICAL REPORT Prepared for: City of Livingston 411 East Callender Livingston, MT 59047 Prepared by: Clear Creek Hydrology, Inc. 1627 West Main Street, #294
LOMR SUBMITTAL LOWER NEHALEM RIVER TILLAMOOK COUNTY, OREGON
 LOMR SUBMITTAL LOWER NEHALEM RIVER TILLAMOOK COUNTY, OREGON Prepared for: TILLAMOOK COUNTY DEPARTMENT OF COMMUNITY DEVELOPMENT 1510-B THIRD STREET TILLAMOOK, OR 97141 Prepared by: 10300 SW GREENBURG ROAD,
To: Olivia Dorothy March 9, 2018 Associate Director Upper Mississippi River Basin American Rivers
 To: Olivia Dorothy March 9, 2018 Associate Director Upper Mississippi River Basin American Rivers From: Jonathan W.F. Remo Ph.D. Big Muddy Consulting Re: Assessment of flood surcharge related to differences
Technical Memorandum No
 Pajaro River Watershed Study in association with Technical Memorandum No. 1.2.10 Task: Evaluation of Four Watershed Conditions - Sediment To: PRWFPA Staff Working Group Prepared by: Gregory Morris and
 Red River Flooding June 2015 Caddo and Bossier Parishes Presented by: Flood Technical Committee Where the Rain Falls Matters I-30 versus I-20 I-20 Backwater and Tributary Floods (Localized) 2016 Flood
Bird s Point HSR MODEL River Miles HYDRAULIC SEDIMENT RESPONSE MODEL INVESTIGATION
 Technical Report M61 Bird s Point HSR MODEL River Miles 5.8 0.0 HYDRAULIC SEDIMENT RESPONSE MODEL INVESTIGATION By Ashley N. Cox Adam M. Rockwell Jasen L. Brown, P.E. Robert D. Davinroy, P.E. Eddie J.
Physical modeling to guide river restoration projects: An Overview
 Physical modeling to guide river restoration projects: An Overview Scott Dusterhoff¹, Leonard Sklar², William Dietrich³, Frank Ligon¹, Yantao Cui¹, and Peter Downs¹ ¹Stillwater Sciences, 2855 Telegraph
Large-scale Geomorphic Change in the Mississippi River from St. Louis, MO, to Donaldsonville, LA, as Revealed by Specific Gage Records
 Mississippi Valley Division Engineer Research and Development Center Large-scale Geomorphic Change in the Mississippi River from St. Louis, MO, to Donaldsonville, LA, as Revealed by Specific Gage Records
ENVG/SC 10110L-20110L PLANET EARTH LABORATORY. Laboratory #9: Surface Hydrology & Map Scale
 Name: Lab day: Tuesday Wednesday ENVG/SC 10110L-20110L PLANET EARTH LABORATORY Laboratory #9: Surface Hydrology & Map Scale Readings: Chapter 9. http://www.nd.edu/~cneal/physicalgeo/lab-surfacehydrology/index.html
Squaw Creek. General Information
 General Information is a tributary to the Salmon River. It enters the north side of the river about 0 miles downstream of North Fork, Idaho. The study reach is about a 30 ft length of stream about 2 miles
EAGLES NEST AND PIASA ISLANDS
 EAGLES NEST AND PIASA ISLANDS HABITAT REHABILITATION AND ENHANCEMENT PROJECT MADISON AND JERSEY COUNTIES, ILLINOIS ENVIRONMENTAL MANAGEMENT PROGRAM ST. LOUIS DISTRICT FACT SHEET I. LOCATION The proposed
SEDIMENTATION STUDY OF THE MIDDLE MISSISSIPPI RIVER AT SALT LAKE CHUTE, RIVER MILES 141 TO 133 HYDRAULIC MICRO MODEL INVESTIGATION
 Technical Report M16 SEDIMENTATION STUDY OF THE MIDDLE MISSISSIPPI RIVER AT SALT LAKE CHUTE, RIVER MILES 141 TO 133 HYDRAULIC MICRO MODEL INVESTIGATION By David C. Gordon Robert D. Davinroy Peter M. Russell
L OWER N OOKSACK R IVER P ROJECT: A LTERNATIVES A NALYSIS A PPENDIX A: H YDRAULIC M ODELING. PREPARED BY: LandC, etc, LLC
 L OWER N OOKSACK R IVER P ROJECT: A LTERNATIVES A NALYSIS A PPENDIX A: H YDRAULIC M ODELING PREPARED BY: LandC, etc, LLC TABLE OF CONTENTS 1 Introduction... 1 2 Methods... 1 2.1 Hydraulic Model... 1 2.2
Discharge. Discharge (Streamflow) is: Q = Velocity (L T -1 ) x Area (L 2 ) Units: L 3 T -1 e.g., m 3 s -1. Velocity. Area
 is: Q = Velocity (L T -1 ) x Area (L 2 ) Units: L 3 T -1 e.g., m 3 s -1. Velocity. Area") Discharge Discharge (Streamflow) is: Q = Velocity (L T -1 ) x Area (L 2 ) Units: L 3 T -1 e.g., m 3 s -1 Velocity Area Where is the average velocity?? 3 Source: Brooks et al., Hydrology and the Management
Discharge Discharge (Streamflow) is: Q = Velocity (L T -1 ) x Area (L 2 ) Units: L 3 T -1 e.g., m 3 s -1 Velocity Area Where is the average velocity?? 3 Source: Brooks et al., Hydrology and the Management
Implementing a Project with 319 Funds: The Spring Brook Meander Project. Leslie A. Berns
 Implementing a Project with 319 Funds: The Spring Brook Meander Project Leslie A. Berns "...to acquire... and hold lands... for the purpose of protecting and preserving the flora, fauna and scenic beauties...
SEDIMENTATION STUDY OF THE MIDDLE MISSISSIPPI RIVER AT BUFFALO ISLAND RIVER MILES 28.0 TO 22.0 HYDRAULIC MICRO MODEL INVESTIGATION
 Technical Report M29 SEDIMENTATION STUDY OF THE MIDDLE MISSISSIPPI RIVER AT BUFFALO ISLAND RIVER MILES 28.0 TO 22.0 HYDRAULIC MICRO MODEL INVESTIGATION By Jasen L. Brown Michael T. Rodgers Dawn M.Lamm
Local Flood Hazards. Click here for Real-time River Information
 Local Flood Hazards Floods of the White River and Killbuck Creek are caused by runoff from general, and/or intense rainfall. Other areas of flooding concern are from the Boland Ditch and Pittsford Ditch.
USGS Flood Inundation Mapping of the Suncook River in Chichester, Epsom, Pembroke and Allenstown, New Hampshire
 USGS Flood Inundation Mapping of the Suncook River in Chichester, Epsom, Pembroke and Allenstown, New Hampshire NH Water & Watershed Conference Robert Flynn, USGS NH-VT Water Science Center March 23, 2012
!"#$%&&'()*+#$%(,-./0*)%(!
*+#$%(,-./0*)%(!") 8:30 Sign in Hoosic River Revival Coalition!"#$%&&'()*+#$%(,-./0*)%(! 12-#30+4/#"5-(60 9:00 Welcome and Introductions 9:15 Goals for Today s Program: A Description of the Planning Process 9:30 First Session:
8:30 Sign in Hoosic River Revival Coalition!"#$%&&'()*+#$%(,-./0*)%(! 12-#30+4/#"5-(60 9:00 Welcome and Introductions 9:15 Goals for Today s Program: A Description of the Planning Process 9:30 First Session:
Canal Velocity Indexing at Colorado River Indian Tribes (CRIT) Irrigation Project in Parker, Arizona using the SonTek Argonaut SL
 Irrigation Project in Parker, Arizona using the SonTek Argonaut SL") Canal Velocity Indexing at Colorado River Indian Tribes (CRIT) Irrigation Project in Parker, Arizona using the SonTek Argonaut SL Authors: Dr. Stuart Styles P.E., Mark Niblack, Beau Freeman Abstract An
Canal Velocity Indexing at Colorado River Indian Tribes (CRIT) Irrigation Project in Parker, Arizona using the SonTek Argonaut SL Authors: Dr. Stuart Styles P.E., Mark Niblack, Beau Freeman Abstract An
Tom Ballestero University of New Hampshire. 1 May 2013
 Tom Ballestero University of New Hampshire 1 May 2013 1 Hydrology 2 Basic Hydrology Low flows most common Flows that fill the stream to the banks and higher are much less common Filling the stream to the
Technical Memorandum No Sediment Model
 Pajaro River Watershed Study in association with Technical Memorandum No. 1.2.9 Sediment Model Task: Development of Sediment Model To: PRWFPA Staff Working Group Prepared by: Gregory Morris and Elsie Parrilla
LOMR SUBMITTAL LOWER NESTUCCA RIVER TILLAMOOK COUNTY, OREGON
 LOMR SUBMITTAL LOWER NESTUCCA RIVER TILLAMOOK COUNTY, OREGON Prepared for: TILLAMOOK COUNTY DEPARTMENT OF COMMUNITY DEVELOPMENT 1510-B THIRD STREET TILLAMOOK, OR 97141 Prepared by: 10300 SW GREENBURG ROAD,
Development and application of demonstration MIKE 21C morphological model for a bend in Mekong River
 Development and application of demonstration MIKE 21C morphological model for a bend in Mekong River September 2015 0 Table of Contents 1. Introduction... 2 2. Data collection... 3 2.1 Additional data...
Summary of Hydraulic and Sediment-transport. Analysis of Residual Sediment: Alternatives for the San Clemente Dam Removal/Retrofit Project,
 Appendix N SUMMARY OF HYDRAULIC AND SEDIMENT-TRANSPORT ANALYSIS OF RESIDUAL SEDIMENT: ALTERNATIVES FOR THE SAN CLEMENTE DAM REMOVAL/RETROFIT PROJECT, CALIFORNIA the San Clemente Dam Removal/Retrofit Project,
THE STATE OF SURFACE WATER GAUGING IN THE NAVAJO NATION
 THE STATE OF SURFACE WATER GAUGING IN THE NAVAJO NATION Aregai Tecle Professor of Hydrology Northern Arizona University Flagstaff, AZ Acknowledgement Many thanks to my research team mates and Elisabeth
U.S. ARMY CORPS OF ENGINEERS
 CORPS FACTS Regulating Mississippi River Navigation Pools U.S. ARMY CORPS OF ENGINEERS BUILDING STRONG Historical Background Federal improvements in the interest of navigation on the Mississippi River
Low Low Water in Puget Sound vs. Mean Sea Level. What do the flood event gauge readings at Sedro Woolley really mean?
 Low Low Water in Puget Sound vs. Mean Sea Level What do the flood event gauge readings at Sedro Woolley really mean? When you make the adjustment of 8.93 feet to the published values and then subtract
Red River Levee Panel
 Red River Levee Panel Mississippi River Commission Monday, August 9, 2017 Red River Levees in LA & AR NONE along TX & OK Boarder Red River Levee Issues Caddo Levee Cherokee Park Authorization Bossier Levee
UPPER COSUMNES RIVER FLOOD MAPPING
 UPPER COSUMNES RIVER FLOOD MAPPING DRAFT BASIC DATA NARRATIVE FLOOD INSURANCE STUDY SACRAMENTO COUTY, CALIFORNIA Community No. 060262 November 2008 Prepared By: CIVIL ENGINEERING SOLUTIONS, INC. 1325 Howe
VICTORIA BEND HYDRAULIC SEDIMENT RESPONSE MODEL INVESTIGATION LOWER MISSISSIPPI RIVER MILES
 Technical Report M48 VICTORIA BEND HYDRAULIC SEDIMENT RESPONSE MODEL INVESTIGATION LOWER MISSISSIPPI RIVER MILES 600-590 By Peter M. Russell, P.E. Jasen L. Brown, P.E Edward J. Brauer, P.E. Robert D. Davinroy,
Coastal and Hydraulics Laboratory
 ERDC/CHL TR-15-12 Numerical Sedimentation Study of Shoaling on the Ohio River near Mound City, Illinois David Abraham, PhD., P.E., Nate Clifton, and Barry Vessels August 2015 Coastal and Hydraulics Laboratory
Four Mile Run Levee Corridor Stream Restoration
 Four Mile Run Levee Corridor Stream Restoration 30% Design Summary U.S. Army Corps of Engineers, Baltimore District Presentation Outline Four Mile Run 1.) Historic Perspective 2.) Existing Conditions 3.)
State Water Survey Division SURFACE WATER SECTION
 State Water Survey Division SURFACE WATER SECTION AT THE UNIVERSITY OF ILLINOIS Illinois Department of Energy and Natural Resources SWS Miscellaneous Publication 88 SEDIMENTATION OF POOL 19 ON THE MISSISSIPPI
REDWOOD VALLEY SUBAREA
 Independent Science Review Panel Conceptual Model of Watershed Hydrology, Surface Water and Groundwater Interactions and Stream Ecology for the Russian River Watershed Appendices A-1 APPENDIX A A-2 REDWOOD
What discharge (cfs) is required to entrain the D 84 (84 th percentile of sediment size distribution) in Red Canyon Wash?
 is required to entrain the D 84 (84 th percentile of sediment size distribution) in Red Canyon Wash?") Gregory Indivero 31 October 2011 What discharge (cfs) is required to entrain the D 84 (84 th percentile of sediment size distribution) in Red Canyon Wash? What discharge was required to deposit observed
Gregory Indivero 31 October 2011 What discharge (cfs) is required to entrain the D 84 (84 th percentile of sediment size distribution) in Red Canyon Wash? What discharge was required to deposit observed
Applications of a GIS Floodplain Mapping Model valley identification, connectivity indexing, and emergency management.
 Applications of a GIS Floodplain Mapping Model valley identification, connectivity indexing, and emergency management. Jude H. Kastens, Debra S. Baker, Donald G. Huggins, and Kevin E. Dobbs University
Island Design. UMRS EMP Regional Workshop. Presentation for the
 Island Design Presentation for the UMRS EMP Regional Workshop by Jon Hendrickson Hydraulic Engineer Regional Technical Specialist, Water Quality and Habitat Restoration August 17 19, 2005 Project Delivery
Stream Restoration and Environmental River Mechanics. Objectives. Pierre Y. Julien. 1. Peligre Dam in Haiti (deforestation)
") Stream Restoration and Environmental River Mechanics Pierre Y. Julien Malaysia 2004 Objectives Brief overview of environmental river mechanics and stream restoration: 1. Typical problems in environmental
Stream Restoration and Environmental River Mechanics Pierre Y. Julien Malaysia 2004 Objectives Brief overview of environmental river mechanics and stream restoration: 1. Typical problems in environmental
3.0 TECHNICAL FEASIBILITY
 3.0 TECHNICAL FEASIBILITY 3.1 INTRODUCTION To enable seasonal storage and release of water from Lake Wenatchee, an impoundment structure would need to be constructed on the lake outlet channel. The structure
Stop 1: Marmot Dam Stop 1: Marmot Dam
 Stop 1: Marmot Dam Stop 1: Marmot Dam Following the removal of Marmot Dam in 2007, the fate of the reservoir sediments has been monitored through a series of surveys and sediment transport measurements.
Geomorphology Studies
 Geomorphology Studies Technical Workgroup Meeting February 14, 2012 Prepared by: Tetra Tech Prepared for: Alaska Energy Authority Overall Goal Geomorphology Studies Two studies Geomorphology Study (RSP
Upper Mississippi River Basin Environmental Management Program Workshop
 Presentation to the Upper Mississippi River Basin Environmental Management Program Workshop by Michael Rodgers River Engineer US Army Corps of Engineers, St. Louis District August 17, 2007 Engineering
Great Lakes Update. Great Lakes Winter and Spring Summary January June Vol. 187 Great Lakes Update August 2012
 Great Lakes Update Great Lakes Winter and Spring Summary January June 2012 The US Army Corps of Engineers (USACE) Detroit District monitors hydraulic and hydrologic conditions of the Great Lakes. This
Mississippi River and Tributaries Project Mississippi River Geomorphology and Potamology Program
 Mississippi River and Tributaries Project Mississippi River Geomorphology and Potamology Program Barb Kleiss, Mississippi Valley Division Freddie Pinkard, Vicksburg District June, 2016 Program Objectives
Great Lakes Update. Volume 193: 2015 January through June Summary. Vol. 193 Great Lakes Update August 2015
 Great Lakes Update Volume 193: 2015 January through June Summary The U.S. Army Corps of Engineers (USACE) monitors the water levels of each of the Great Lakes. This report provides a summary of the Great
Appendix B. Mobile-bed model Calibration Report
 Appendix B Mobile-bed model Calibration Report This page is intentionally left blank. Missouri River Bed Degradation Study Mobile Bed Model Calibration Report March 2017 Introduction Bed Degradation on
PHYSICAL PROPERTIES TAHOE.UCDAVIS.EDU 8
 PHYSICAL PROPERTIES 8 Lake surface level Daily since 1900 Lake surface level varies throughout the year. Lake level rises due to high stream inflow, groundwater inflow, and precipitation directly onto
2012 USACE Drought Actions
 2012 USACE Drought Actions for Inland Waterway Users Board 68 Jim Walker Navigation Branch Chief 19 December 2012 US US Army Corps of of Engineers US Drought Monitor 1 2 3 4 6 5 Impacts: 1. The area in
Big Wood River. General Information
 General Information The flows out of the southern portion of the Sawtooth National Recreation Area in central Idaho. The study reach is about a,200 ft length of river about.5 miles upstream from the discontinued
Sediment Transport in the Lower Mississippi River. Final Report
 Sediment Transport in the Lower Mississippi River Final Report Principal Investigator: Colin R Thorne Research Associates: Oliver P Harmar and Nicholas Wallerstein School of Geography, University of Nottingham
Analysis of Hydraulic Impacts on the Schuylkill River
 Analysis of Hydraulic Impacts on the Schuylkill River Manayunk Sewer Basin Construction Project and the Venice Island Recreation Center Reconstruction Project Venice Island, Manayunk, Philadelphia, PA
Mount St. Helens Project Cowlitz River Levee Systems 2009 Level of Flood Protection Update Summary
 Mount St. Helens Project Cowlitz River Levee Systems 2009 Level of Flood Protection Update Summary Cowlitz River at Longview/Kelso, Washington February 4, 2010 Executive Summary USACE periodically updates
Analysis of the Effects of Bendway Weir Construction on Channel Cross Sectional Geometry
 Mississippi River Miles 275.2 1.7 Analysis of the Effects of Bendway Weir Construction on Channel Cross Sectional Geometry By Timothy Lauth David Gordon, P.E. Katherine Clancey Adam Rockwell Brad Krischel
Assessment of the Hood River Delta Hood River, Oregon
 Assessment of the Hood River Delta Hood River, Oregon Pacific Northwest Waterways Association Annual Meeting October 13, 2010 Michael McElwee, Executive Director Port of Hood River Overview U.S. Army Corps
Folsom Dam Water Control Manual Update Joint Federal Project, Folsom Dam
 Folsom Dam Water Control Manual Update Joint Federal Project, Folsom Dam Public Workshop May 25, 2016 Sacramento Library Galleria 828 I Street, Sacramento, CA US Army Corps of Engineers BUILDING STRONG
PH YSIC A L PROPERT IE S TERC.UCDAVIS.EDU
 PH YSIC A L PROPERT IE S 8 Lake surface level Daily since 1900 Lake surface level varies throughout the year. Lake level rises due to high stream inflow, groundwater inflow and precipitation directly onto
High-Gradient Streams
 Chapter 4 Surface Processes Section 4 High-Gradient Streams What Do You See? Learning Outcomes In this section, you will Use models and real-time streamflow data to understand the characteristics of highgradient
PENNSYLVANIA DEPARTMENT OF TRANSPORTATION ENGINEERING DISTRICT 3-0
 PENNSYLVANIA DEPARTMENT OF TRANSPORTATION ENGINEERING DISTRICT 3-0 LYCOMING COUNTY S.R.15, SECTION C41 FINAL HYDROLOGIC AND HYDRAULIC REPORT STEAM VALLEY RUN STREAM RELOCATION DATE: June, 2006 REVISED:
HAW CREEK, PIKE COUNTY, MISSOURI-TRIB TO SALT RIVER ERODING STREAM THREATHENING COUNTY ROAD #107, FOURTEEN FT TALL ERODING BANK WITHIN 4 FT OF THE
 HAW CREEK, PIKE COUNTY, MISSOURI-TRIB TO SALT RIVER ERODING STREAM THREATHENING COUNTY ROAD #107, FOURTEEN FT TALL ERODING BANK WITHIN 4 FT OF THE ROAD, PROJECT CONSTRUCTED IN 1 DAY, MARCH 10, 2009 BY
How Do Human Impacts and Geomorphological Responses Vary with Spatial Scale in the Streams and Rivers of the Illinois Basin?
 How Do Human Impacts and Geomorphological Responses Vary with Spatial Scale in the Streams and Rivers of the Illinois Basin? Bruce Rhoads Department of Geography University of Illinois at Urbana-Champaign
Final Exam. Running Water Erosion and Deposition. Willamette Discharge. Running Water
 Final Exam Running Water Erosion and Deposition Earth Science Chapter 5 Pages 120-135 Scheduled for 8 AM, March 21, 2006 Bring A scantron form A calculator Your 3 x 5 paper card of formulas Review questions
Chapter 3 Erosion in the Las Vegas Wash
 Chapter 3 Erosion in the Las Vegas Wash Introduction As described in Chapter 1, the Las Vegas Wash (Wash) has experienced considerable change as a result of development of the Las Vegas Valley (Valley).
Bushkill Creek 3 rd Street Dam Removal Analysis
 Bushkill Creek 3 rd Street Dam Removal Analysis HEC HMS Runoff and Routing Model Stephen Beavan, Melanie DeFazio, David Gold, Peter Mara and Dan Moran CE 421: Hydrology Fall 2010 December 15, 2010 Contents
Evaluation of the Potential for Hysteresis in Index-Velocity Ratings for the Chicago Sanitary and Ship Canal near Lemont, Illinois
 Prepared in cooperation with the Chicago District of the U.S. Army Corps of Engineers Evaluation of the Potential for Hysteresis in Index-Velocity Ratings for the Chicago Sanitary and Ship Canal near Lemont,
Appendix G.19 Hatch Report Pacific NorthWest LNG Lelu Island LNG Maintenance Dredging at the Materials Offloading Facility
 Appendix G.19 Hatch Report Pacific NorthWest LNG Lelu Island LNG Maintenance Dredging at the Materials Offloading Facility Project Memo H345670 To: Capt. David Kyle From: O. Sayao/L. Absalonsen December
Sediment Acoustics Real-Time Continuous Suspended Sediment Data in the Lower Columbia River
 Sediment Acoustics Real-Time Continuous Suspended Sediment Data in the Lower Columbia River U.S. Department of the Interior U.S. Geological Survey Paul Diaz Jr Oregon Water Science Center Sediment Acoustics
KEY CONTROLS ON SEDIMENT BUDGETING IN THE MISSISSIPPI RIVER FROM SOURCE TO SINK
 KEY CONTROLS ON SEDIMENT BUDGETING IN THE MISSISSIPPI RIVER FROM SOURCE TO SINK Mead Allison The Water Institute of the Gulf & Tulane University What Controls the Availability of Sediment in the Restoration
Influence of the Major Drainages to the Mississippi River and Implications for System Level Management
 Influence of the Major Drainages to the Mississippi River and Implications for System Level Management Brian M. Vosburg Geologist Louisiana Coastal Protection and Restoration Authority brian.vosburg@la.gov
Great Lakes Update. Volume 199: 2017 Annual Summary. Background
 Great Lakes Update Volume 199: 2017 Annual Summary Background The U.S. Army Corps of Engineers (USACE) tracks and forecasts the water levels of each of the Great Lakes. This report is primarily focused
The Use of Synthetic Floods for Defining the Regulated Volume Duration Frequency Curves for the Red River at Fargo, ND
 The Use of Synthetic Floods for Defining the Regulated Volume Duration Frequency Curves for the Red River at Fargo, ND Prepared by the USACE - St. Paul District Hydrology & Water Management Section June
JOURNAL OF ENVIRONMENTAL HYDROLOGY The Electronic Journal of the International Association for Environmental Hydrology VOLUME
 JOURNAL OF ENVIRONMENTAL HYDROLOGY The Electronic Journal of the International Association for Environmental Hydrology VOLUME 18 2010 REDUCED CHANNEL CONVEYANCE ON THE WICHITA RIVER AT WICHITA FALLS, TEXAS,
Streams. Stream Water Flow
 CHAPTER 14 OUTLINE Streams: Transport to the Oceans Does not contain complete lecture notes. To be used to help organize lecture notes and home/test studies. Streams Streams are the major geological agents
PRELIMINARY DRAFT FOR DISCUSSION PURPOSES
 Memorandum To: David Thompson From: John Haapala CC: Dan McDonald Bob Montgomery Date: February 24, 2003 File #: 1003551 Re: Lake Wenatchee Historic Water Levels, Operation Model, and Flood Operation This
Colorado River sediment transport 1. Natural sediment supply limitation and the influence of Glen Canyon Dam
 WATER RESOURCES RESEARCH, VOL. 36, NO. 2, PAGES 515 542, FEBRUARY 2000 Colorado River sediment transport 1. Natural sediment supply limitation and the influence of Glen Canyon Dam David J. Topping U.S.
MODELING OF LOCAL SCOUR AROUND AL-KUFA BRIDGE PIERS Saleh I. Khassaf, Saja Sadeq Shakir
 ISSN 2320-9100 11 International Journal of Advance Research, IJOAR.org Volume 1, Issue 8,August 2013, Online: ISSN 2320-9100 MODELING OF LOCAL SCOUR AROUND AL-KUFA BRIDGE PIERS Saleh I. Khassaf, Saja Sadeq
Hydraulic Processes Analysis System (HyPAS)
") Hydraulic Processes Analysis System (HyPAS) by Thad C. Pratt and Daryl S. Cook PURPOSE: This Coastal Engineering Technical Note (CETN) describes a PC-Windows-based system for analyzing, visualizing, and
Hydraulic Processes Analysis System (HyPAS) by Thad C. Pratt and Daryl S. Cook PURPOSE: This Coastal Engineering Technical Note (CETN) describes a PC-Windows-based system for analyzing, visualizing, and
Sea Level Rise and Hurricane Florence storm surge research methodology
 Sea Level Rise and Hurricane Florence storm surge research methodology Hurricane Florence storm surge analysis was conducted using a variety of input sources. In order to determine the maximum storm surge
Dam Break Analysis Using HEC-RAS and HEC-GeoRAS A Case Study of Ajwa Reservoir
 Journal of Water Resources and Ocean Science 2016; 5(6): 108-113 http://www.sciencepublishinggroup.com/j/wros doi: 10.11648/j.wros.20160506.15 ISSN: 2328-7969 (Print); ISSN: 2328-7993 (Online) Case Report
Remote Sensing of River Discharge to Expand the USGS Streamgaging Network
 Remote Sensing of River Discharge to Expand the USGS Streamgaging Network Dave Bjerklie, John Fulton, Robert Mason, John Jones United States Geological Survey Charon Birkett, University of Maryland ESSIC
Savannah Harbor Expansion Project
 Savannah Harbor Expansion Project Evaluation of Hurricane Surge Impacts with Proposed Mitigation Plan December 2007 Introduction This report summarizes the results of hurricane surge impacts with implementation
Great Lakes Update. Volume 194: 2015 Annual Summary
 Great Lakes Update Volume 194: 2015 Annual Summary Background The U.S. Army Corps of Engineers (USACE) tracks and forecasts the water levels of each of the Great Lakes. This report summarizes the hydrologic
River Meandering and Braiding. Pierre Y. Julien. Department of Civil and Environmental Engineering Colorado State University Fort Collins, Colorado
 River Meandering and Braiding Pierre Y. Julien Department of Civil and Environmental Engineering Colorado State University Fort Collins, Colorado River Mechanics and Sediment Transport Lima Peru January
Groundwater dynamics and surface water-groundwater interaction in a prograding delta island, Louisiana, USA
 Supplementary Information Groundwater dynamics and surface water-groundwater interaction in a prograding delta island, Louisiana, USA Michael T. O Connor 1* and Kevan B. Moffett 1,2 1 Department of Geological
ERDC/LAB TR-0X-X 100. Figure 7-3 Maximum velocity magnitudes for existing conditions for 100-year flood event
 ERDC/LAB TR-0X-X 100 Figure 7-3 Maximum velocity magnitudes for existing conditions for 100-year flood event ERDC/LAB TR-0X-X 101 Figure 7-4 Model schematization of Option 1 Figure 7-5 Bed displacement
Earth Science Chapter 6 Section 2 Review
 Name: Class: Date: Earth Science Chapter 6 Section Review Multiple Choice Identify the choice that best completes the statement or answers the question. 1. Most streams carry the largest part of their
Running Water Earth - Chapter 16 Stan Hatfield Southwestern Illinois College
 Running Water Earth - Chapter 16 Stan Hatfield Southwestern Illinois College Hydrologic Cycle The hydrologic cycle is a summary of the circulation of Earth s water supply. Processes involved in the hydrologic
Flooding Performance Indicator Summary. Performance indicator: Flooding impacts on riparian property for Lake Ontario and the Upper St.
 Flooding Performance Indicator Summary Performance indicator: Flooding impacts on riparian property for Lake Ontario and the Upper St. Lawrence River Technical Workgroup: Coastal TWG Research by: Baird
River Model (Delft3D)
") A Short River Model (Delft3D) & DIVERSION ANALYSIS presented by Nina J. Reins, PE, PhD, PMP State of the Coast May 30-June 1, 2018 Overview of Presentation Problem Statement & Background Analysis Key Findings
A Short River Model (Delft3D) & DIVERSION ANALYSIS presented by Nina J. Reins, PE, PhD, PMP State of the Coast May 30-June 1, 2018 Overview of Presentation Problem Statement & Background Analysis Key Findings
3Chapter Three: Rescue and Response
 17 16 Report Science Title and the Storms: the USGS Response to the Hurricanes of 2005 3Chapter Three: Rescue and Response This chapter documents the U.S. Geological Survey s (USGS) humanitarian rescue
APPLICATION OF HEC-RAS MODEL FOR ESTIMATING CHANGES IN WATERCOURSE GEOMETRY DURING FLOODS
 Studia Geotechnica et Mechanica, Vol. XXXIV, No. 2, 2012 DOI: 105277/sgm021206 APPLICATION OF HEC-RAS MODEL FOR ESTIMATING CHANGES IN WATERCOURSE GEOMETRY DURING FLOODS JOANNA MARKOWSKA Department of Environmental
Natural Variability in Annual Maximum Water Level and Outflow of Yellowstone Lake
 Natural Variability in Annual Maximum Water Level and Outflow of Yellowstone Lake Phillip E. Farnes Abstract The water level in Yellowstone Lake varies each year in response to differences in the winter
Pequabuck River Flooding Study and Flood Mitigation Plan The City of Bristol and Towns of Plainville and Plymouth, CT
 Pequabuck River Flooding Study and Flood Mitigation Plan The City of Bristol and Towns of Plainville and Plymouth, CT Raymond Rogozinski and Maged Aboelata The City of Bristol and Towns of Plainville and
Applying GIS to Hydraulic Analysis
 Texas A&M University Department of Civil Engineering CVEN689 Applications of GIS to Civil Engineering Instructor: Francisco Olivera, Ph.D., P.E. Applying GIS to Hydraulic Analysis Lim, Chae Kwan April
3D Elevation Program, Lidar in Missouri. West Central Regional Advanced LiDAR Workshop Ray Fox
 3D Elevation Program, Lidar in Missouri West Central Regional Advanced LiDAR Workshop Ray Fox National Enhanced Elevation Assessment (Dewberry, 2011) Sponsored by the National Digital Elevation Program
ESTIMATING JOINT FLOW PROBABILITIES AT STREAM CONFLUENCES USING COPULAS
 ESTIMATING JOINT FLOW PROBABILITIES AT STREAM CONFLUENCES USING COPULAS Roger T. Kilgore, P.E., D. WRE* Principal Kilgore Consulting and Management 2963 Ash Street Denver, CO 80207 303-333-1408 David B.
Mississippi River (Pool 2) 2-D ADH Model Development
 2-D ADH Model Development") Appendix E: Mississippi River (Pool 2) 2-D ADH Model Development (PREPARED BY WEST CONSULTANTS, 2011) Lower Pool 2 Channel Management Study: Boulanger Bend to Lock and Dam No. 2 US Army Corps of Engineers
Appendix E: Mississippi River (Pool 2) 2-D ADH Model Development (PREPARED BY WEST CONSULTANTS, 2011) Lower Pool 2 Channel Management Study: Boulanger Bend to Lock and Dam No. 2 US Army Corps of Engineers
BANK EROSION AND HISTORICAL MORPHOLOGY STUDY OF THE MIDDLE KASKASKIA RIVER. Building Strong
 BANK EROSION AND HISTORICAL MORPHOLOGY STUDY OF THE MIDDLE KASKASKIA RIVER Building Strong Study Conducted Jun 2001-Dec 2002 Last Presented in 2004 2002 United States and Great Britain Invade Afghanistan
Historical Bathymetric Data for the Lower Passaic River
 Historical Bathymetric Data for the Lower Passaic River 4th Passaic River Symposium June 22nd, 2010 Dr. William Hansen Jeffrey Cranson Worcester State College Project Supported by The Hudson River Foundation