DefinitionofAlternatives
|
|
|
- Brendan Hawkins
- 5 years ago
- Views:
Transcription

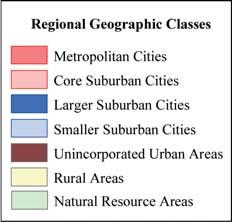
1 4. DefinitionofAlternatives After approximately two years of outreach and public input, PSRC has identified four alternatives for evaluation in this Draft Environmental Impact Statement: Growth Targets Extended, Metropolitan Cities, Larger Cities, and Smaller Cities. None of these is defined as a preferred alternative. This chapter provides descriptions of the alternatives in text, map and tabular formats. The alternatives are conceptual in nature and are designed to support environmental analysis on a range of growth management approaches that the region may take. As the update process continues, these alternatives could be modified or combined to select a preferred alternative for managing the region s future growth. Approaches to Allocating Growth in the Region To create four regional growth alternatives for analysis in the Draft Environmental Impact Statement, PSRC distributed the year 2040 forecasts for regional population and employment growth 1.7 million people and 1.2 million jobs 1 into seven separate geographic categories within the region. These categories were based on current city boundaries, and reflect how existing population and employment occurs in these areas, how growth is anticipated in current plans, as well as current thinking about the roles these areas might play in the region s future. The seven geographic categories are: Metropolitan Cities, Core Suburban Cities, Larger Suburban Cities, Smaller Suburban Cities, Unincorporated Urban Growth Areas, Rural Areas, and Natural Resource Areas (containing Forest, Agriculture, Mineral Resources). These categories are regional and cross county boundaries. The following table classifies the region s cities and other areas according to these geographic categories. 1 The figures 1.7 million new people and 1.2 million new jobs refer to growth from the base year 2000 (which is needed for modeling and analysis purposes) and the year When discussing growth from the present (2005), the figures 1.6 million new people and 1.1 million new jobs are used. Throughout the Draft Environmental Impact Statement, the different chapters note which set of figures is being used. Puget Sound Regional Council 4. Definition of Alternatives 4. 1
2 FIGURE 4-1: REGIONAL GEOGRAPHIES TABLE Geography Metropolitan Cities (5 cities, 216 square miles) Core Suburban Cities (14 cities, 197 square miles) Larger Suburban Cities (13 cities, 131 square miles) Smaller Suburban Cities (52 cities, 159 square miles) Unincorporated Urban Growth Areas (289 square miles) Rural Areas (1528 square miles) Natural Resource Areas (3807 square miles) Description Jurisdictions The region s largest core cities containing Bellevue, Bremerton, Everett, Seattle, designated Regional Growth Centers. Tacoma. Regional Growth Centers serve as a key framework for the region s adopted longrange multimodal transportation system. The region s core suburban cities containing designated Regional Growth Centers. Kent, Kirkland, Lakewood, Lynnwood, Auburn, Bothell, Burien, Federal Way, Regional Growth Centers serve as a key Puyallup, Redmond, Renton, SeaTac, framework for the region s adopted longrange multimodal transportation system. Silverdale (Kitsap County), Tukwila. The region s larger inner-ring suburban Bainbridge Island, Des Moines, cities with combined population and employment over 22,500. Many of these cit- Marysville, Mercer Island, Mountlake Edmonds, Issaquah, Kenmore, ies contain important local and regional Terrace, Mukilteo, Sammamish, transit stations, ferry terminals, park and Shoreline, University Place, and ride facilities, and other transportation Woodinville. connections. The region s smaller cities and towns. Type A Smaller Cities and Towns (inside These jurisdictions represent a wide variety of communities, from historic towns Black Diamond, Bonney Lake, Brier, Contiguous UGA): Algona, Arlington, and growing new suburban cities, bedroom communities with limited retail and Fircrest, Gig Harbor, Lake Forest Park, Covington, Du Pont, Edgewood, Fife, commercial activity and growth potential, Lake Stevens, Maple Valley, Medina, to freestanding cities and towns separated from the region s contiguous urban Normandy Park, Orting, Pacific, Mill Creek, Milton, Newcastle, growth area. As such, they have been Port Orchard, Poulsbo, Ruston, divided into three sub-categories: Steilacoom, Sumner. Type A Smaller Cities and Towns (inside Contiguous UGA): These are cities and towns often surrounded by larger suburban jurisdictions, often with greater Type B Small Residential Towns (inside potential to absorb both population and Contiguous UGA): Beaux Arts, Clyde Hill, employment growth than purely residential communities. Hunts Point, Woodway, Yarrow Point. Type B Small Residential Towns (inside Contiguous UGA): Small residential enclaves with little capacity to accommodate a great deal of future growth. Buckley, Carbonado, Carnation, Type C Free-Standing Cities and Towns: Type C Free-Standing Cities and Towns: Darrington, Duvall, Eatonville, Enumclaw, Cities located outside the contiguous UGA. Gold Bar, Granite Falls, Index, Monroe, North Bend, Roy, Skykomish, Snohomish, In the Alternatives, Type A cities receive Snoqualmie, South Prairie, Stanwood, a larger share of the geographic class Sultan, Wilkeson. allocation of population and employment growth than Types B and C. Areas within designated UGAs that are King, Snohomish, Pierce and Kitsap not within the boundaries of incorporated County unincorporated UGAs. cities and towns. Lands outside of urban growth areas that King, Snohomish, Pierce and Kitsap are not designated as resource areas County rural areas. under the Growth Management Act. As designated under Growth Management Act, resource areas forests, agricul- County designated natural resource King, Snohomish, Pierce and Kitsap tural lands, mining lands, and shorelines. areas. Note: The alternatives did not place additional population and employment in designated resource areas VISION 2020 Update Draft Environmental Impact Statement Puget Sound Regional Council


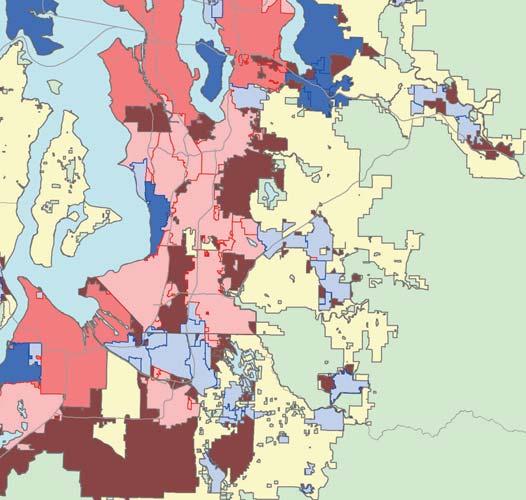
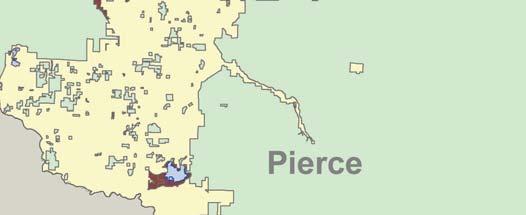
3 FIGURE 4-2: REGIONAL GEOGRAPHIES MAP Puget Sound Regional Council 4. Definition of Alternatives 4. 3
4 The alternatives provide a range of further future population and employment growth patterns based on the regional geographies. Each alternative reflects a different set of choices for accommodating growth in cities, rural areas and unincorporated urban areas on a regional scale. The alternatives remain conceptual, but for the purposes of analysis, PSRC has detailed forecast growth for individual areas, reflecting the regional geography, as well as traditional city and county boundaries. The share of growth was based on the proportion of the city s or area s current adopted growth targets compared to the sum of all of the growth targets in the geographic category. For alternatives where the overall amount of growth in a geographic category was larger than current plan growth rates, the amount of growth allocated to individual cities or areas also increased. If the category were allocated less growth than current plans, the city or area individual share would be reduced proportionally. Where current city or county growth targets are aggressive, PSRC assumed that these jurisdictions would receive proportionally larger shares of the population and employment growth within their categories. Cities and counties with less aggressive current targets had lower shares of growth assigned to them. Some of the alternatives also limit the added growth in some geographic categories to reflect the presence of natural resource areas and rural areas. Overall, the distribution of population and employment in the alternatives was intended to produce an array of regional urban forms with different character. Chapter 5.1 Population, Employment, and Housing and 5.2 Land Use, discuss the implications of these differences on the character, shape, and form of the region s neighborhoods and communities. Since they remain conceptual, PSRC anticipates that the alternatives can be rearranged or combined, or that individual area growth projections could differ, while still maintaining a regional approach to managing growth. DefinitionofAlternatives Each of the alternatives are described separately on the following pages, and then compared to each other at the end of this chapter. GROWTH TARGETS EXTENDED ALTERNATIVE This alternative continues the growth patterns anticipated in current adopted growth targets, extended to match PSRC s 2040 regional growth forecasts. Future land use designations in local comprehensive plan maps provided a guide for the distribution of growth within regional geographies. Since these targets represent adopted public policy, which would presumably continue if no action were taken to alter the current regional growth vision, this is the No Action Alternative. Under this Alternative, cities and counties would continue to encourage growth to focus in Metropolitan and Core Suburban Cities around the region. Unincorporated urban growth areas and rural areas also would accommodate significant growth. Nearly three quarters of the region s new jobs would be concentrated in the region s largest cities, while medium-sized communities would also become larger employment centers. As currently planned, many new apartments, condominiums and townhouses would likely be built in downtown areas near employment centers. Extensive residential growth would continue in the region s unincorporated urban and, to a lesser extent, rural areas. Recent growth trends have resulted in King County assuming a larger share of regional growth than is envisioned in current plans. This alternative assumes that in the future the distribution of growth among the regional geographies will correspond more closely with currently adopted local comprehensive plans. The assumption of the No Action Alternative is that current policies are adequate, and there is little need to revise and revisit them. Activity Units Allocated Growth % Share Growth Metropolitan Cities , % Core Suburban Cities...633, % Larger Suburban Cities , % Smaller Suburban Cities...288, % Unincorporated Urban Areas...511, % Rural Areas...270, % 4. 4 VISION 2020 Update Draft Environmental Impact Statement Puget Sound Regional Council


5 FIGURE 4-3: GROWTH TARG ETS EXTENDED ALT ERNATIVE MAP SHARE OF ADDITIONAL POPULATION AND EMPLOYMENT GROWTH, BY REGIONAL GEOGRAPHY ( ) Notes: The percent share of additional growth combines population and employment growth percentages. This combination means that the percentages shown on the legend is an average of the population and employment growth percentages shown in Figure 4-4. For all alternatives conceptual maps: Regional Council staff used INDEX, a software analysis tool (see Appendix D for additional information), to paint or assign population and employment growth jurisdiction-by-jurisdiction at the 5.5-acre grid cell level. The painting of all alternatives was based on the future land use designations drawn form current local comprehensive plans. Activity Units are calculated by simply adding a jurisdiction s population and employment numbers together. Activity units represent the total amount of activity present in an area, and do not distinguish by the mix, or proportion, of the activity that is residential versus commercial. The Regional Council has used activity units for other projects; for example, an activity unit threshold has been established as one of the criteria for designating new regional growth centers. Note: For the purpose of comparison, Figure 4-14 at the end of this chapter shows all of the definition of the alternative s maps side-by-side. Source: PSRC, Puget Sound Regional Council 4. Definition of Alternatives 4. 5
6 FIGURE 4-4: GROWTH TARGETS EXTENDED ALTERNATIVE DISTRIBUTION OF GROWTH BY REGIONAL GEOGRAPHY AND BY COUNTY ( ) Share of Reg l Growth Smaller Suburban Cities By Class Metropolitan Cities Core Suburban Cities Larger Suburban Cities Small Cities Type A Small Cities Type B Small Cities Type C Pop 26% 17% 9% 7.2% 0.1% 3.2% Emp 45% 28% 7% 6.3% 0.0% 2.6% % Share of % Share of % Share of % Share of % Share of % Share of Geography Actual Geography Actual Geography Actual Geography Actual Geography Actual Geography Actual Change Change Change Change Change Change Change Change Change Change Change Change King Pop 58% 263,500 70% 200,900 53% 81, % 27, % % 21,100 Emp 71% 384,800 81% 280,600 67% 53, % 12, % % 11,400 Kitsap Pop 5% 23,300 4% 11,900 9% 13, % 10, % 0 0.0% 0 Emp 4% 19,100 3% 10,200 8% 6, % 6, % 0 0.0% 0 Pierce Pop 25% 113,500 18% 51,000 7% 10, % 63, % 0 9.6% 5,200 Emp 12% 62,700 10% 34,400 5% 3, % 47, % % 3,900 Snohomish Pop 11% 51,800 8% 22,700 31% 47, % 21, % % 27,800 Emp 14% 78,600 6% 21,700 21% 16, % 11, % % 15,800 Region Total Pop 100% 452, % 286, % 151, % 124, % 1, % 54,100 Emp 100% 545, % 346, % 79, % 77, % % 31,100 Note: Due to rounding, totals may not sum consistently. This alternative is based on extending adopted growth targets to the year VISION 2020 Update Draft Environmental Impact Statement Puget Sound Regional Council
7 FIGURE 4-4: GROWTH TARGETS EXTENDED ALTERNATIVE DISTRIBUTION OF GROWTH BY REGIONAL GEOGRAPHY AND BY COUNTY ( ) continued Share of Reg l Growth Smaller Sub. Cities (Total) Unincorporated UGAs Rural Areas TOTAL Pop 10% 24% 13% 100% Emp 9% 8% 3% 100% % Share of % Share of % Share of % Share of Geography Actual Geography Actual Geography Actual Geography Actual Change Change Change Change Change Change Change Change King Pop 28% 49,600 17% 70,400 17% 38,000 41% 703,500 Emp 22% 24,000 19% 18,500 12% 4,700 63% 765,700 Kitsap Pop 6% 10,900 12% 50,900 19% 44,000 9% 154,200 Emp 6% 6,600 5% 4,500 54% 21,800 6% 68,300 Pierce Pop 38% 69,000 26% 108,100 19% 44,000 23% 395,800 Emp 47% 50,900 44% 43,000 14% 5,900 16% 200,700 Snohomish Pop 28% 49,800 45% 184,000 45% 103,400 27% 458,700 Emp 25% 27,300 33% 32,100 20% 8,300 15% 184,700 Region Total Pop 100% 179, % 413, % 229, % 1,712,300 Emp 100% 108, % 98, % 40, % 1,219,300 Puget Sound Regional Council 4. Definition of Alternatives 4. 7
8 METROPOLITAN CITIES ALTERNATIVE This alternative represents the most densely focused regional growth pattern among the alternatives. The largest shares of the region s future growth would occur in the region s five major Metropolitan Cities: Seattle, Bellevue, Everett, Bremerton and Tacoma. Growth would also be focused into the region s Core Suburban Cities those larger suburban municipalities that are already envisioned as important locations for regional growth. In this alternative, considerable redevelopment would occur in the region s largest cities, with most new jobs reinforcing them as major regional employment centers as is currently planned along with a significant concentration of new apartments, condominiums and townhouses built near job centers and in areas close to high capacity transit systems. Significantly less growth would occur in the region s Rural and Unincorporated Urban Areas than is currently planned. Growth that is currently planned for these areas would shift to Metropolitan and Core Suburban Cities. Activity Units Allocated Growth % Share Growth Metropolitan Cities... 1,234, % Core Suburban Cities...794, % Larger Suburban Cities...379, % Smaller Suburban Cities...232, % Unincorporated Urban Areas , % Rural Areas , % 4. 8 VISION 2020 Update Draft Environmental Impact Statement Puget Sound Regional Council
")


9 FIGURE 4-5: METROPOLITAN CITIES ALT ERNATIVE MAP SHARE OF ADDITIONAL POPULATION AND EMPLOYMENT GROWTH, BY REGIONAL GEOGRAPHY ( ) Notes: See the footnote with Figure 4-3. This combination means that the percentages shown on the legend is an average of the population and employment growth percentages shown in Figure 4-6. Source: PSRC, Puget Sound Regional Council 4. Definition of Alternatives 4. 9
10 FIGURE 4-6: METROPOLITAN CITIES ALTERNATIVE DISTRIBUTION OF GROWTH BY REGIONAL GEOGRAPHY AND BY COUNTY ( ) Share of Reg l Growth Smaller Suburban Cities By Class Metropolitan Cities Core Suburban Cities Larger Suburban Cities Small Cities Type A Small Cities Type B Small Cities Type C Pop 40% 25% 15% 6.7% 0.2% 3.2% Emp 45% 30% 10% 3.3% 0.0% 1.6% % Share of % Share of % Share of % Share of % Share of % Share of Geography Actual Geography Actual Geography Actual Geography Actual Geography Actual Geography Actual Change Change Change Change Change Change Change Change Change Change Change Change King Pop 65% 443,200 73% 310,700 54% 137, % 36, % 2, % 21,500 Emp 74% 405,600 82% 300,200 63% 76, % 6, % % 6,900 Kitsap Pop 4% 28,700 3% 13,300 7% 17, % 9, % 0 0.0% 0 Emp 3% 18,300 2% 6,500 6% 7, % 4, % 0 0.0% 0 Pierce Pop 21% 145,300 16% 69,600 8% 21, % 47, % % 5,800 Emp 12% 65,800 9% 34,400 5% 5, % 22, % % 2,300 Snohomish Pop 10% 67,800 8% 34,500 31% 80, % 21, % % 26,900 Emp 11% 59,100 7% 24,700 26% 32, % 6, % % 10,800 Region Total Pop 100% 685, % 428, % 256, % 114, % 2, % 54,200 Emp 100% 548, % 365, % 122, % 40, % % 20,000 Note:Duetorounding,totalsmaynotsumconsistently VISION 2020 Update Draft Environmental Impact Statement Puget Sound Regional Council
11 FIGURE 4-6: METROPOLITAN CITIES ALTERNATIVE DISTRIBUTION OF GROWTH BY REGIONAL GEOGRAPHY AND BY COUNTY ( ) continued Share of Reg l Growth Smaller Sub. Cities (Total) Unincorporated UGAs Rural Areas TOTAL Pop 10% 5% 5% 100% Emp 5% 5% 5% 100% % Share of % Share of % Share of % Share of Geography Actual Geography Actual Geography Actual Geography Actual Change Change Change Change Change Change Change Change King Pop 35% 60,200 28% 23,800 24% 20,500 58% 996,000 Emp 23% 14,000 23% 14,200 22% 13,600 68% 824,400 Pierce Pop 5% 9,400 10% 8,200 20% 16,900 6% 94,200 Emp 8% 4,700 9% 5,200 33% 20,300 5% 62,300 Pierce Pop 31% 52,800 27% 23,400 26% 22,300 20% 334,800 Emp 40% 24,600 37% 22,600 25% 15,000 14% 168,300 Snohomish Pop 29% 48,800 35% 30,300 30% 25,900 17% 287,300 Emp 29% 17,700 31% 19,000 20% 12,100 13% 164,600 Region Total Pop 100% 171, % 85, % 85, % 1,712,300 Emp 100% 61, % 61, % 61, % 1,219,300 Puget Sound Regional Council 4. Definition of Alternatives 4. 11
12 LARGER CITIES ALTERNATIVE This alternative assumes suburban cities in the region would accommodate the bulk of future population and employment growth. Suburban cities with designated regional growth centers Core Suburban Cities and other Larger Suburban Cities would be the primary locations for new development. Larger Suburban Cities, in particular, would be the locations of job growth, more so than the region s Metropolitan Cities. Considerable redevelopment would occur in current town center and neighborhood shopping areas, and suburban cities would become major regional job centers. Many new apartments, condominiums and townhouses would also be built in these areas. Less growth would occur in the downtown areas of the region s largest Metropolitan Cities, Unincorporated Urban Areas, and Rural Areas than is currently planned. Activity Units Allocated Growth % Share Growth Metropolitan Cities...586, % Core Suburban Cities...880, % Larger Suburban Cities...880, % Smaller Suburban Cities , % Unincorporated Urban Areas...293, % Rural Areas , % VISION 2020 Update Draft Environmental Impact Statement Puget Sound Regional Council
 Notes: See the footnote with Figure 4-3.")

13 FIGURE 4-7: LARGER CITIES ALT ERNATIVE MAP SHARE OF ADDITIONAL POPULATION AND EMPLOYMENT GROWTH, BY REGIONAL GEOGRAPHY ( ) Notes: See the footnote with Figure 4-3. This combination means that the percentages shown on the legend is an average of the population and employment growth percentages shown in Figure 4-8. Source: PSRC, Puget Sound Regional Council 4. Definition of Alternatives 4. 13
14 FIGURE 4-8: LARGER CITIES ALTERNATIVE DISTRIBUTION OF GROWTH BY REGIONAL GEOGRAPHY AND BY COUNTY ( ) Share of Reg l Growth Smaller Suburban Cities By Class Metropolitan Cities Core Suburban Cities Larger Suburban Cities Small Cities Type A Small Cities Type B Small Cities Type C Pop 20.00% 30.00% 30.00% 3.3% 0.1% 1.6% Emp 20.00% 30.00% 30.00% 3.3% 0.0% 1.6% % Share of % Share of % Share of % Share of % Share of % Share of Geography Actual Geography Actual Geography Actual Geography Actual Geography Actual Geography Actual Change Change Change Change Change Change Change Change Change Change Change Change King Pop 65% 221,600 73% 372,800 54% 275, % 18, % 1, % 10,700 Emp 74% 180,300 82% 300,200 63% 230, % 6, % % 6,900 Kitsap Pop 4% 14,300 3% 16,000 7% 35, % 4, % 0 0.0% 0 Emp 3% 8,100 2% 6,500 6% 21, % 4, % 0 0.0% 0 Pierce Pop 21% 72,600 16% 83,600 8% 42, % 23, % % 2,900 Emp 12% 29,200 9% 34,400 5% 17, % 22, % % 2,300 Snohomish Pop 10% 33,900 8% 41,400 31% 160, % 10, % % 13,500 Emp 11% 26,300 7% 24,700 26% 95, % 6, % % 10,800 Region Total Pop 100% 342, % 513, % 513, % 57, % 1, % 27,100 Emp 100% 243, % 365, % 365, % 40, % % 20,000 Note:Duetorounding,totalsmaynotsumconsistently VISION 2020 Update Draft Environmental Impact Statement Puget Sound Regional Council
15 FIGURE 4-8: LARGER CITIES ALTERNATIVE DISTRIBUTION OF GROWTH BY REGIONAL GEOGRAPHY AND BY COUNTY ( ) continued Share of Reg l Growth Smaller Sub. Cities (Total) Unincorporated UGAs Rural Areas TOTAL Pop 5% 10% 5% 100% Emp 5% 10% 5% 100% % Share of % Share of % Share of % Share of Geography Actual Geography Actual Geography Actual Geography Actual Change Change Change Change Change Change Change Change King Pop 35% 30,100 28% 47,600 24% 20,500 57% 967,800 Emp 23% 14,000 23% 28,400 22% 13,600 63% 766,800 Kitsap Pop 5% 4,700 10% 16,300 20% 16,900 6% 103,800 Emp 8% 4,700 9% 10,400 33% 20,300 6% 71,900 Pierce Pop 31% 26,400 27% 46,800 26% 22,300 17% 294,500 Emp 40% 24,600 37% 45,200 25% 15,000 14% 166,000 Snohomish Pop 28% 24,400 35% 60,600 30% 25,900 20% 346,200 Emp 29% 17,700 31% 38,000 20% 12,100 18% 214,800 Region Total Pop 100% 85, % 171, % 85, % 1,712,300 Emp 100% 61, % 122, % 61, % 1,219,300 Puget Sound Regional Council 4. Definition of Alternatives 4. 15
16 SMALLER CITIES ALTERNATIVE This alternative has the most dispersed regional growth pattern. It would disperse growth within the region s urban growth area with Smaller Suburban Cities and Unincorporated Urban Growth areas receiving a sizable amount of population and employment growth. Redevelopment in what are now small downtowns would produce many more significant, dispersed local employment centers throughout the region. These smaller downtown areas would also develop with new apartments, condominiums and townhouses. Unincorporated Urban Growth Areas currently the outskirts of small cities and towns would experience significant new commercial and residential development. There would also be a substantial amount of single-family housing built in currently undeveloped Rural Areas. Growth that is currently planned for Metropolitan Cities and Core Suburban Cities would shift to Smaller Suburban Cities and Unincorporated Urban Areas. For the purposes of analysis, this alternative also assumes that transportation systems in and around smaller cities would need to be improved. While all alternatives would require systemwide transportation improvements, PSRC found that the transportation systems connecting many of the smaller cities would fail without new or improved roadways. Activity Units Allocated Growth % Share Growth Metropolitan Cities...293, % Core Suburban Cities...293, % Larger Suburban Cities , % Smaller Suburban Cities...880, % Unincorporated Urban Areas... 1,026, % Rural Areas...293, % VISION 2020 Update Draft Environmental Impact Statement Puget Sound Regional Council
")


17 FIGURE 4-9: SMALLER CITIES ALT ERNATIVE MAP SHARE OF ADDITIONAL POPULATION AND EMPLOYMENT GROWTH, BY REGIONAL GEOGRAPHY ( ) Notes: See the footnote with Figure 4-3. This combination means that the percentages shown on the legend is an average of the population and employment growth percentages shown in Figure Source: PSRC, Puget Sound Regional Council 4. Definition of Alternatives 4. 17
18 FIGURE 4-10: SMALLER CITIES ALTERNATIVE DISTRIBUTION OF GROWTH BY REGIONAL GEOGRAPHY AND BY COUNTY ( ) Share of Reg l Growth Smaller Suburban Cities By Class Metropolitan Cities Core Suburban Cities Larger Suburban Cities Small Cities Type A Small Cities Type B Small Cities Type C Pop 10% 10% 5% 20.0% 0.5% 9.5% Emp 10% 10% 5% 20.0% 0.1% 9.9% % Share of % Share of % Share of % Share of % Share of % Share of Geography Actual Geography Actual Geography Actual Geography Actual Geography Actual Geography Actual Change Change Change Change Change Change Change Change Change Change Change Change King Pop 65% 110,800 73% 124,300 54% 45, % 109, % 7, % 64,500 Emp 74% 90,100 82% 100,100 63% 38, % 40, % 1, % 41,600 Kitsap Pop 4% 7,200 3% 5,300 7% 5, % 28, % 0 0.0% 0 Emp 3% 4,100 2% 2,200 6% 3, % 28, % 0 0.0% 0 Pierce Pop 21% 36,300 16% 27,900 8% 7, % 141, % % 17,300 Emp 12% 14,600 9% 11,500 5% 2, % 134, % % 13,600 Snohomish Pop 10% 17,000 8% 13,800 31% 26, % 64, % 1, % 80,700 Emp 11% 13,100 7% 8,200 26% 16, % 41, % % 65,000 Region Total Pop 100% 171, % 171, % 85, % 342, % 8, % 162,500 Emp 100% 121, % 122, % 60, % 243, % 1, % 120,200 Note:Duetorounding,totalsmaynotsumconsistently VISION 2020 Update Draft Environmental Impact Statement Puget Sound Regional Council
19 FIGURE 4-10: SMALLER CITIES ALTERNATIVE DISTRIBUTION OF GROWTH BY REGIONAL GEOGRAPHY AND BY COUNTY ( ) continued Share of Reg l Growth Smaller Sub. Cities (Total) Unincorporated UGAs Rural Areas TOTAL Pop 30% 35% 10% 100% Emp 30% 35% 10% 100% % Share of % Share of % Share of % Share of Geography Actual Geography Actual Geography Actual Geography Actual Change Change Change Change Change Change Change Change King Pop 35% 180,700 28% 166,400 24% 41,000 39% 669,100 Emp 23% 83,800 23% 99,300 22% 27,100 36% 438,800 Kitsap Pop 5% 28,200 10% 57,200 20% 33,800 8% 137,600 Emp 8% 28,000 9% 36,300 33% 40,500 9% 114,700 Pierce Pop 31% 158,400 27% 163,600 26% 44,600 26% 438,000 Emp 40% 147,700 37% 158,100 25% 30,000 30% 364,900 Snohomish Pop 28% 146,400 35% 212,000 30% 51,800 27% 467,700 Emp 29% 106,300 31% 133,100 20% 24,300 25% 301,000 Region Total Pop 100% 513, % 599, % 171, % 1,712,300 Emp 100% 365, % 426, % 121, % 1,219,300 Puget Sound Regional Council 4. Definition of Alternatives 4. 19
20 Summary Comparison of Alternatives The following tables summarize and compare the four alternatives, which represent a wide, but realistic range of regional growth options for examination in the Draft Environmental Impact Statement. This range will provide flexibility for decision makers to select a Preferred Alternative and includes the potential for developing a Preferred Alternative that is a hybrid of any of the four alternatives analyzed in this Draft Environmental Impact Statement. FIGURE 4-11: REGIONAL GROWTH ALTERNATIVES COMPARISON SHARE OF POPULATION AND EMPLOYMENT GROWTH, BY REGIONAL GEOGRAPHY ( ) Metropolitan Core Suburban Larger Suburban Smaller Suburban Unincorporated Rural Cities Cities Cities Cities UGA Area Pop/Emp Pop/Emp Pop/Emp Pop/Emp Pop/Emp Pop/Emp Growth Targets Extended Alt. 26%/45% 17%/28% 9%/7% 11%/9% 24%/8% 13%/3% Metropolitan Cities Alternative 40% 45% 25%/30% 15%/10% 10%/5% 5%/5% 5%/5% Larger Cities Alternative 20%/20% 30%/30% 30%/30% 5%/5% 10%/10% 5%/5% Smaller Cities Alternative 10%/10% 10%/10% 5%/5% 30%/30% 35%/35% 10%/10% FIGURE 4-12: REGIONAL GROWTH ALTERNATIVES COMPARISON SHARE OF POPULATION GROWTH BY COUNTY ( ) Growth Targets Metropolitan Cities Larger Cities Smaller Cities Extended Alternative Alternative Alternative Alternative 2040 Change 2040 Change 2040 Change 2040 Change Population Population Population Population King 2,440, ,000 2,733, ,000 2,705, ,000 2,406, ,000 Kitsap 386, , ,000 94, , , , ,000 Pierce 1,097, ,000 1,036, , , ,000 1,139, ,000 Snohomish 1,065, , , , , ,000 1,074, ,000 Region 4,988,000 1,713,000 4,988,000 1,712,000 4,988,000 1,713,000 4,989,000 1,713,000 Note:Duetorounding,totalsmaynotsumconsistently. FIGURE 4-13: REGIONAL GROWTH ALTERNATIVES COMPARISON SHARE OF EMPLOYMENT GROWTH BY COUNTY ( ) Growth Targets Metropolitan Cities Larger Cities Smaller Cities Extended Alternative Alternative Alternative Alternative 2040 Change 2040 Change 2040 Change 2040 Change Employment Employment Employment Employment King 2,045, ,700 2,061, ,400 2,046, ,800 1,718, ,800 Kitsap 147,100 68, ,200 62, ,600 71, , ,700 Pierce 463, , , , , , , ,900 Snohomish 416, , , , , , , ,000 Region 3,072,200 1,219,400 3,073,000 1,219,600 3,072,200 1,219,500 3,072,200 1,219,400 Note:Duetorounding,totalsmaynotsumconsistently. More detailed tables and figures depicting potential population and employment changes by city that were used for modeling purposes are provided in Appendix D, on the attached compact disk. Supporting Figures SIDE-BY-SIDE MAPS SHOWING DEFINITION OF THE ALTERNATIVES Figure 4-14 compares the definition of the alternatives, based on the VISION 2020 Update regional geographies VISION 2020 Update Draft Environmental Impact Statement Puget Sound Regional Council


21 FIGURE 4-14: SIDE-BY-SIDE COMPAR ISON OF DEFINITION OF ALT ERNATIVES MAPS GROWTH TARGETS EXTENDED METROPOLITAN CITIES LARGER CITIES SMALLER CITIES Puget Sound Regional Council 4. Definition of Alternatives 4. 21
22 4. 22 VISION 2020 Update Draft Environmental Impact Statement Puget Sound Regional Council
Chapter 5: Land Use, Population, Employment, and Housing
 Chapter 5: Land Use, Population, Employment, and Housing 1 How are land use, population, employment, and housing examined in this chapter? This chapter examines potential population, employment, housing,
2013 Land Use Baseline Validation Report: Maintenance Release 1 (MR1) Update
 Update") 2013 Land Use Baseline Validation Report: Maintenance Release 1 (MR1) Update April 2014 Introduction The purpose of model validation is to compare the performance of a model system or its components to
2013 Land Use Baseline Validation Report: Maintenance Release 1 (MR1) Update April 2014 Introduction The purpose of model validation is to compare the performance of a model system or its components to
Fireworks Ban or Restricted Sales/Use. State Fireworks Law RCW
 Fireworks Ban or Sales/Use Fireworks Ban or Sales/Use by County and City RCW 70.77.395 State Law Fireworks sales and discharge laws. Dates and times common fireworks may be sold or discharged. State Fireworks
Regional Growth Strategy Work Session Growth Management Policy Board
 Regional Growth Strategy Work Session Growth Management Policy Board September 6, 2018 1 Overview Recap June GMPB work session Objectives and outcomes Regional geographies Growth scenarios Breakout Discussion:
Kitsap County 2016 Comprehensive Plan Update. Appendix A: Growth Estimates
 Kitsap County 2016 Comprehensive Plan Update Appendix A: Growth Estimates Appendix A 1 April 2016 Kitsap County 2016 Comprehensive Plan Update Appendix A: Growth Estimates Land Capacity Land capacity
Regional Growth Strategy Regional TOD Advisory Committee
 Regional Strategy Regional TOD Advisory Committee September 21, 2018 Overview Regional Geographies Transit-Oriented Development Goal Scenarios Next Steps 2 Schedule + Process September 6 Management Policy
WASHINGTON DECA COMPETITIVE EVENT ALLOCATIONS 5:08 P.M.
 Area Students Advisors Alumni Professional Total Members Percentage of Total Members for: Individual Series and Team Decision Making 70 Total Rounded Up Min 2 for: EIP, ESB, ADC, FMP, SEPP, FCE, HTPS,
Washington DECA Voting Delegates
 2017-2018 Chapters earn one voting delegate for every 18 members registered by 5:00 p.m. November 15. If a chapter did not have any registered members at that time, the chapter has 0 voting delegates.
VISION 2040 people prosperity planet. Puget Sound Regional Council
 VISION 2040 people prosperity planet Puget Sound Regional Council PSRC December 2009 EXECUTIVE BOARD (as of VISION 2040 adoption April 24, 2008) Mayor Pro Tem Sue Singer, City of Auburn, Other Cities in
Regional Growth Strategy Regional Staff Committee
 Regional Growth Strategy Regional Staff Committee June 21, 2018 1 Overview Summary of June Growth Management Policy Board Regional Growth Strategy Objectives Regional Geographies Regional Growth Strategy
Too Close for Comfort
 Too Close for Comfort Overview South Carolina consists of urban, suburban, and rural communities. Students will utilize maps to label and describe the different land use classifications. Connection to
King City URA 6D Concept Plan
 King City URA 6D Concept Plan King City s Evolution Among the fastest growing cities 2000 Census 1,949 2010 Census 3,111 60% increase 2016 Census estimate 3,817 23% increase Average annual rate 4.3% Surpassing
Chapter 12 Earth. 1 What are the characteristics of the region s physical setting and geology?
 Chapter 12 Earth 1 What are the characteristics of the region s physical setting and geology? The physical form and geology of the central Puget Sound region has been shaped over millions of years by three
Forecasts for the Reston/Dulles Rail Corridor and Route 28 Corridor 2010 to 2050
 George Mason University Center for Regional Analysis Forecasts for the Reston/Dulles Rail Corridor and Route 28 Corridor 21 to 25 Prepared for the Fairfax County Department of Planning and Zoning Lisa
HORIZON 2030: Land Use & Transportation November 2005
 PROJECTS Land Use An important component of the Horizon transportation planning process involved reviewing the area s comprehensive land use plans to ensure consistency between them and the longrange transportation
A Method for Mapping Settlement Area Boundaries in the Greater Golden Horseshoe
 A Method for Mapping Settlement Area Boundaries in the Greater Golden Horseshoe Purpose This paper describes a method for mapping and measuring the lands designated for growth and urban expansion in the
Transit Market Index. Validating Local Potential for Transit Ridership
 Transit Market Index Validating Local Potential for Transit Ridership Transit Market Areas Characteristics 2010 TPP Characterized by different levels of transit service. Core Areas, 1 & 2: A variety of
APPENDIX I: Traffic Forecasting Model and Assumptions
 APPENDIX I: Traffic Forecasting Model and Assumptions Appendix I reports on the assumptions and traffic model specifications that were developed to support the Reaffirmation of the 2040 Long Range Plan.
Date: June 19, 2013 Meeting Date: July 5, Consideration of the City of Vancouver s Regional Context Statement
 Section E 1.5 To: From: Regional Planning and Agriculture Committee Lee-Ann Garnett, Senior Regional Planner Planning, Policy and Environment Department Date: June 19, 2013 Meeting Date: July 5, 2013 Subject:
DRAFT RURAL-URBAN POPULATION CHANGE IN PUERTO RICO, 1990 TO 2000
 DRAFT RURAL-URBAN POPULATION CHANGE IN PUERTO RICO, 1990 TO 2000 Mei-Ling Freeman Geographic Standards and Criteria Branch Geography Division US Census Bureau For presentation at the Western Regional Science
Aggregating Local GIS Inquiry for Regional Perspectives
 Aggregating Local GIS Inquiry for Regional Perspectives RYAN ULSBERGER CENTER FOR URBAN WATERS PUGET SOUND INSTITUTE SEPTEMBER 13, 2012 Acknowledgements I would like to thank the donors to the UWT Urban
Introduction and Project Overview
 Greater New Orleans Regional Land Use Modeling GIS Techniques in a P olitical C ontext Louisiana Remote Sensing and GIS Workshop Wednesday, April 24, 2013 Working Towards a Shared Regional Vision Introduction
COUNCIL MARKET ANALYSIS REPORT Chief Seattle 609
 2017 COUNCIL ANALYSIS REPORT Chief Seattle 609 The mission of the Boy Scouts of America is to prepare young people to make ethical and moral choices over their lifetimes by instilling in them the values
City of Chino Hills General Plan Update 13GPA02 Scoping Meeting. June 4, 2013
 13GPA02 Scoping Meeting June 4, 2013 Every California city must adopt a comprehensive, long-term general plan. The General Plan is the City s constitution or blueprint for its long-range physical development.
CLAREMONT MASTER PLAN 2017: LAND USE COMMUNITY INPUT
 Planning and Development Department 14 North Street Claremont, New Hampshire 03743 Ph: (603) 542-7008 Fax: (603) 542-7033 Email: cityplanner@claremontnh.com www.claremontnh.com CLAREMONT MASTER PLAN 2017:
Date: March 31, 2014 PATE; fyril 2.3,2 >H
 aj BRAMPTON fifs Rower City XH-l-f r.t "»* City Council The Corporation of the City of Brampton SRAMPTON CITY COUNCIL Date: March 31, 2014 PATE; fyril 2.3,2 >H File: POO GR VisWhtoJed ^t'th-meeh'^a Subject:
Public Transportation Infrastructure Study (PTIS) - 2 nd Technical Advisory Committee Meeting
 - 2 nd Technical Advisory Committee Meeting") Public Transportation Infrastructure Study (PTIS) - 2 nd Technical Advisory Committee Meeting Presentation to: Technical Advisory Committee (TAC) Presented by: and Team July 8th, 2009 Public Transportation
Public Transportation Infrastructure Study (PTIS) - 2 nd Technical Advisory Committee Meeting Presentation to: Technical Advisory Committee (TAC) Presented by: and Team July 8th, 2009 Public Transportation
3D - Boulder Valley Comprehensive Plan. Lesli Ellis Comprehensive Planning Manager City of Boulder
 3D - Boulder Valley Comprehensive Plan Lesli Ellis Comprehensive Planning Manager City of Boulder Presentation Boulder s use of 3D GIS and other tools in Comprehensive Planning (e.g., story maps, CityEngine,
Proposed Scope of Work Village of Farmingdale Downtown Farmingdale BOA Step 2 BOA Nomination Study / Draft Generic Environmental Impact Statement
 Proposed Scope of Work Village of Farmingdale Downtown Farmingdale BOA Step 2 BOA Nomination Study / Draft Generic Environmental Impact Statement The scope of work that follows incorporates and covers
2016 Housing Units Built
 Montgomery County Data: HOUSING 2016 Housing Units Built Montgomery County, Pennsylvania The total number of units built in 2016 increased by 16% Housing construction in Montgomery County continued to
PlaceTypes. How the built environment is measured. Variables Measures Levels. AREA TYPE + DEVELOPMENT TYPE = PlaceType
 PlaceTypes In order to better understand land use and transportation interactions and to make more informed policy decisions, neighborhood characteristics can be analyzed by the role that they play in
APPENDIX I - AREA PLANS
 ROUTE 37 WEST LAND USE PLAN ROUTE 37 WEST LAND USE PLAN Recent land use decisions and development trends have drawn attention to the land within the Route 37 western by-pass area between Route 50 and
METHODOLOGICAL ISSUES IN CREATING A REGIONAL NEIGHBORHOOD TYPOLOGY
 METHODOLOGICAL ISSUES IN CREATING A REGIONAL NEIGHBORHOOD TYPOLOGY Z. Asligul Gocmen Urban and Regional Planning Program, University of Michigan Ann Arbor, MI 48109 Tel: +1 734-904-2762 (c) Fax: +1 734-763-2322
Page 1 of 7 -- October 1, September 30, Service
 1 Oregon City Division 66 ` 2 Rockwood, Gresham Division 66 210.69 3 Everett, Golden K Division 22 208.80 4 West Valley, Willamina Division 68 175.64 5 Kamiakin, Yakima Division 50 173.53 6 Port Angeles-Olympic
Riocan Centre Study Area Frontenac Mall Study Area Kingston Centre Study Area
 OVERVIEW the biggest challenge of the next century (Dunham Jones, 2011). New books are continually adding methods and case studies to a growing body of literature focused on tackling this massive task.
APPENDIX D REGION 5 ALL HAZARD MITIGATION PLAN EDITION PIERCE COUNTY OVERVIEW. Inherent Errors
 APPENDIX D REGION 5 ALL HAZARD MITIGATION PLAN 2015-2020 EDITION PIERCE COUNTY OVERVIEW This appendix contains the spatial results from the Hazus Earthquake Scenario results showing the Essential Facilities
III. FORECASTED GROWTH
 III. FORECASTED GROWTH In order to properly identify potential improvement projects that will be required for the transportation system in Milliken, it is important to first understand the nature and volume
Kiwanis International
 Page 1 of Pacific Northwest 05 Division 5 K02569 Chewelah WA 25 25 25 0.00 K01917 Colville WA 24 24 24 0.00 K02785 Nelson BC 7 7 7 0.00 K02293 Republic WA 12 12 12 0.00 K02643 Trail BC 17 17 17 0.00 Division
Transport Planning in Large Scale Housing Developments. David Knight
 Transport Planning in Large Scale Housing Developments David Knight Large Scale Housing Developments No longer creating great urban spaces in the UK (Hall 2014) Transport Planning Transport planning processes
Wasatch Front Region Small Area Socioeconomic Forecasts: Technical Report #49
 Regional Transportation Plan: 2011-2040 Appendix A APPENDIX A Wasatch Front Region Small Area Socioeconomic Forecasts: 2007-2040 Technical Report #49 July, 2010 295 N. Jimmy Doolittle Road Salt Lake City,
Land Use Advisory Committee. Updating the Transit Market Areas
 Land Use Advisory Committee Updating the Transit Market Areas March 20, 2014 Agenda Transit Market Areas Purpose of Transit Market Areas Transit Market Index Current Market Area boundaries Updating the
Rural Pennsylvania: Where Is It Anyway? A Compendium of the Definitions of Rural and Rationale for Their Use
 Rural Pennsylvania: Where Is It Anyway? A Compendium of the Definitions of Rural and Rationale for Their Use Pennsylvania Office of Rural Health 310 Nursing Sciences Building University Park, PA 16802
3.0 ANALYSIS OF FUTURE TRANSPORTATION NEEDS
 3.0 ANALYSIS OF FUTURE TRANSPORTATION NEEDS In order to better determine future roadway expansion and connectivity needs, future population growth and land development patterns were analyzed as part of
Wasatch Front Region Small Area Socioeconomic Forecasts: Technical Report #49
 Wasatch Front Region Small Area Socioeconomic Forecasts: 2007-2040 Technical Report #49 July, 2010 Wasatch Front Regional Council 295 N. Jimmy Doolittle Road Salt Lake City, UT 84116 P (801) 363-4250 F
Draft. Butte County Long-Term Regional Growth Forecasts
 Draft Butte County Long-Term Regional Growth Forecasts 2014 2040 Prepared by: November 25 th, 2014 2580 Sierra Sunrise Terrace, Suite 100 Chico, CA 95928 Phone: 530-879-2468 FAX: 530-879-244 www.bcag.org
GIS in Community & Regional Planning
 GIS in Community & Regional Planning The The role role of of GIS GIS in in Re-writing the the Zoning Bylaw for for the the City City of of Vernon LandInfo Technologies Presentation Overview The GIS Initiative
ADDRESSING TITLE VI AND ENVIRONMENTAL JUSTICE IN LONG-RANGE TRANSPORTATION PLANS
 ADDRESSING TITLE VI AND ENVIRONMENTAL JUSTICE IN LONG-RANGE TRANSPORTATION PLANS Activities from the National Capital Region Transportation Planning Board Sergio Ritacco Transportation Planner 2017 Association
King County GIS Center 2018 Esri User Conference San Diego, California July 12, 2018
 Greg Babinski, MA, GISP Marketing & Business Development Manager URISA Past-President King County GIS Center 2018 Esri User Conference San Diego, California July 12, 2018 Geography has always been a major
Planning for Sea Level Rise in the Matanzas Basin
 Planning for Sea Level Rise in the Matanzas Basin Appendix E: Matanzas Future Development Scenarios June, 2015 Prepared by: Dr. Paul Zwick University of Florida Department of Urban and Regional Planning
Technical Report # 6 Land Use Data Development. March 2010
 Technical Report # 6 Land Use Data Development March 2010 Technical Report # 6 Land Use Data Development Envision 2035 Long Range Plan Update Prepared for North Florida Transportation Planning Organization
The Role of Transitways in Our Region s Economic Competitiveness. The 23rd CTS Annual Research Conference St. Paul, MN May 23, 2012
 The Role of Transitways in Our Region s Economic Competitiveness The 23rd CTS Annual Research Conference St. Paul, MN May 23, 2012 1 2 Twin Cities Competitive Clusters 3 Competitive Clusters interconnected
Local Area Key Issues Paper No. 13: Southern Hinterland townships growth opportunities
 Draft Sunshine Coast Planning Scheme Review of Submissions Local Area Key Issues Paper No. 13: Southern Hinterland townships growth opportunities Key Issue: Growth opportunities for Southern Hinterland
Council Workshop on Neighbourhoods Thursday, October 4 th, :00 to 4:00 p.m. Burlington Performing Arts Centre
 Council Workshop on Neighbourhoods Thursday, October 4 th, 2012 1:00 to 4:00 p.m. Burlington Performing Arts Centre Agenda Introductions Warm-Up Exercise Presentation Exercise Neighbourhood Planning Break
Albuquerque City-wide Zoning Remapping
 Albuquerque City-wide Zoning Remapping Michelle Gricius, City of Albuquerque Planning Department Albuquerque Geographic Information System (AGIS) Division City of Albuquerque Annexation History Albuquerque
Urban White Paper on Tokyo Metropolis 2002
 Urban White Paper on Tokyo Metropolis 2002 By Bureau of City Planning Tokyo Metropolitan Government Part I. "Progress in IT and City Building" Effects of computer networks on cities and cities' response
Application #: TEXT
 TOWN OF FORT MYERS BEACH 2008 PROPOSED COMPREHENSIVE PLAN AMENDMENTS Application #: 2008-13-TEXT Description: Modify the Coastal Management and Future Land Use Elements to reflect the state s new definition
City of Cambridge. HEMSON C o n s u l t i n g L t d.
 GROWTH MANAGEMENT STRATEGY LAND INVENTORY AND CAPACITY ANALYSIS City of Cambridge C o n s u l t i n g L t d. October 2009 EXECUTIVE SUMMARY This report examines the residential and employment land inventory
The Governance of Land Use
 The planning system The Governance of Land Use United Kingdom Levels of government and their responsibilities The United Kingdom is a unitary state with three devolved governments in Northern Ireland,
The effects of impact fees on urban form and congestion in Florida
 The effects of impact fees on urban form and congestion in Florida Principal Investigators: Andres G. Blanco Ruth Steiner Presenters: Hyungchul Chung Jeongseob Kim Urban and Regional Planning Contents
2013 Housing Units Built
 Montgomery County Data: Housing 2013 Housing Units Built Montgomery County, Pennsylvania New housing construction in Montgomery County increased in 2013 by 42% over the prior year, with growth in all three
Joint Planning Advisory Council July 19, 2011
 Joint Planning Advisory Council July 19, 2011 Global Cities Program Objectives Helping advance strategic thinking in a variety of critical areas. Facilitating informed decisionmaking on the part of public
Technical Memorandum #2 Future Conditions
 Technical Memorandum #2 Future Conditions To: Dan Farnsworth Transportation Planner Fargo-Moorhead Metro Council of Governments From: Rick Gunderson, PE Josh Hinds PE, PTOE Houston Engineering, Inc. Subject:
The Census, Urbanized Areas, and Your MPO/RPO
 The Census, Urbanized Areas, and Your MPO/RPO Alex Bond, AICP NADO Rural Transportation Peer Learning Conference August 25, 2011 1 Issues to Discuss Census background Definitions of Census geographies
Regional Transit Development Plan Strategic Corridors Analysis. Employment Access and Commuting Patterns Analysis. (Draft)
") Regional Transit Development Plan Strategic Corridors Analysis Employment Access and Commuting Patterns Analysis (Draft) April 2010 Contents 1.0 INTRODUCTION... 4 1.1 Overview and Data Sources... 4 1.2
Regional Transit Development Plan Strategic Corridors Analysis Employment Access and Commuting Patterns Analysis (Draft) April 2010 Contents 1.0 INTRODUCTION... 4 1.1 Overview and Data Sources... 4 1.2
StanCOG Transportation Model Program. General Summary
 StanCOG Transportation Model Program Adopted By the StanCOG Policy Board March 17, 2010 What are Transportation Models? General Summary Transportation Models are technical planning and decision support
THE FUTURE OF FORECASTING AT METROPOLITAN COUNCIL. CTS Research Conference May 23, 2012
 THE FUTURE OF FORECASTING AT METROPOLITAN COUNCIL CTS Research Conference May 23, 2012 Metropolitan Council forecasts Regional planning agency and MPO for Twin Cities metropolitan area Operates regional
The 3V Approach. Transforming the Urban Space through Transit Oriented Development. Gerald Ollivier Transport Cluster Leader World Bank Hub Singapore
 Transforming the Urban Space through Transit Oriented Development The 3V Approach Gerald Ollivier Transport Cluster Leader World Bank Hub Singapore MDTF on Sustainable Urbanization The China-World Bank
Facts and Findings. Exhibit A-1
 Exhibit A-1 Facts and Findings The county periodically prepares coordinated countywide forecasts for all the cities in the county and the unincorporated area. These forecasts can be used by cities as a
GIS for the Non-Expert
 GIS for the Non-Expert Ann Forsyth University of Minnesota February 2006 GIS for the Non-Expert 1. Definitions and problems 2. Measures being tested in Twin Cities Walking Study Basic approach, data, variables
MEMBERSHIP GROWTH
 Rank Club Name Division Percent (%) Change 1 South Whidbey, Whidbey Island Division 20 100.00 2 Sequim-Dungeness Division 19 72.72 3 West Spokane Division 46 46.15 4 Riverview, Wenatchee Division 52 38.89
Traffic Impact Study
 Traffic Impact Study Statham DRI One University Parkway Prepared for: Barrow County Prepared by: October 2012 Table of Contents Executive Summary i Section 1. Introduction 1 Project Description 1 Methodology
Population and Employment Forecast
 Population and Employment Forecast How Do We Get the Numbers? Thurston Regional Planning Council Technical Brief Updated July 2012 We plan for forecast growth in Population and Employment, but where do
Study Overview. the nassau hub study. The Nassau Hub
 Livable Communities through Sustainable Transportation the nassau hub study AlternativeS analysis / environmental impact statement The Nassau Hub Study Overview Nassau County has initiated the preparation
Regional Snapshot Series: Transportation and Transit. Commuting and Places of Work in the Fraser Valley Regional District
 Regional Snapshot Series: Transportation and Transit Commuting and Places of Work in the Fraser Valley Regional District TABLE OF CONTENTS Complete Communities Daily Trips Live/Work Ratio Commuting Local
Webinar Series for Comprehensive Plan Updates. School Districts: More than just an affected jurisdiction
 Webinar Series for Comprehensive Plan Updates School Districts: More than just an affected jurisdiction Presented by Tara Beard, AICP March 9, 2017 Goals for this webinar City planning staff are more aware
GIS Analysis of Crenshaw/LAX Line
 PDD 631 Geographic Information Systems for Public Policy, Planning & Development GIS Analysis of Crenshaw/LAX Line Biying Zhao 6679361256 Professor Barry Waite and Bonnie Shrewsbury May 12 th, 2015 Introduction
Employment Capacity in Transit Station Areas in Maryland
 Employment Capacity in Transit Station Areas in Maryland Prepared by: The National Center for Smart Growth Research and Education at the University of Maryland* Gerrit Knaap, PhD, Director Terry Moore,
c. What is the most distinctive above ground result of high land costs and intensive land use? i. Describe the vertical geography of a skyscraper?
 AP Human Geography Unit 7b Guided Reading: Urban Patterns and Social Issues Mr. Stepek Key Issue #1: Why Do Services Cluster Downtown? (Rubenstein p 404 410) 1. What is the CBD? What does it contain and
Transportation Statistical Data Development Report OKALOOSA-WALTON OUTLOOK 2035 LONG RANGE TRANSPORTATION PLAN
 Transportation Statistical Data Development Report OKALOOSA-WALTON OUTLOOK 2035 LONG RANGE TRANSPORTATION PLAN Prepared for the Okaloosa-Walton Transportation Planning Organization and The Florida Department
BROOKINGS May
 Appendix 1. Technical Methodology This study combines detailed data on transit systems, demographics, and employment to determine the accessibility of jobs via transit within and across the country s 100
Developed new methodologies for mapping and characterizing suburban sprawl in the Northeastern Forests
 Development of Functional Ecological Indicators of Suburban Sprawl for the Northeastern Forest Landscape Principal Investigator: Austin Troy UVM, Rubenstein School of Environment and Natural Resources
Operational Definitions of Urban, Rural and Urban Agglomeration for Monitoring Human Settlements
 Operational Definitions of Urban, Rural and Urban Agglomeration for Monitoring Human Settlements By Markandey Rai United Nations Human Settlements Programme PO Box-30030 Nairobi, Kenya Abstract The United
Los Alamos Planning Advisory Committee. Stephen Peterson March 19, 2007
 Los Alamos Planning Advisory Committee Stephen Peterson March 19, 2007 What makes Los Alamos so special? Very small, compact town surrounded by large parcel working agriculture and open space areas Old
Urban Geography. Unit 7 - Settlement and Urbanization
 Urban Geography Unit 7 - Settlement and Urbanization Unit 7 is a logical extension of the population theme. In their analysis of the distribution of people on the earth s surface, students became aware
Average Additnl Salary. Total FTE
 1 01109 Washtucna 1 0 1.00 32,393 4,029 260.0 25,531 01147 Othello 5 0 3.75 34,701 4,976 260.0 35,987 01158 Lind 1 0 0.36 20,609 5,261 260.0 21,925 01160 Ritzville 1 0 1.00 36,504 4,220 260.0 36,504 02250
GROWTH MANAGEMENT REPORT Wiarton South Settlement Area
 GROWTH MANAGEMENT REPORT Wiarton South Settlement Area Designations in the Town of Wiarton Prepared for: The Municipality of South Bruce Peninsula P.O. Box 310 315 George St. Wiarton, ON N0H 2T0 Prepared
Economic Activity Economic A ctivity
 5 Economic Economic Activity Activity ECONOMIC ACTIVITY 5.1 EMPLOYMENT... 5-7 5.1.1 OBJECTIVE... 5-7 5.1.2 POLICIES... 5-7 5.2 PROTECTING THE AREA OF EMPLOYMENT... 5-9 5.2.1 OBJECTIVE... 5-9 5.2.2 POLICIES...
California Urban Infill Trip Generation Study. Jim Daisa, P.E.
 California Urban Infill Trip Generation Study Jim Daisa, P.E. What We Did in the Study Develop trip generation rates for land uses in urban areas of California Establish a California urban land use trip
Urban-Rural spatial classification of Finland
 Urban-Rural spatial classification of Finland Finnish Environment Institute SYKE The geographical information-based area classification system has been created by the Finnish Environment Institute and
US Census Bureau Geographic Entities and Concepts. Geography Division
 US Census Bureau Geographic Entities and Concepts Geography Division Geographic Concepts Addresses vs. Geographic features and entities Legal/Administrative vs. Statistical Nesting relationships (or the
Risk Identification using Hazus
 Risk Identification using Hazus City of Boston, Suffolk County, MA Dave Shortman, GISP, CFM 6/21/2016 Agenda Objective Project Location Hazus Overview Hazus Level 2 Risk Assessment Comparison and Reporting
Global City Definition
 Regional Training Workshop on Human Settlement Indicators Global City Definition Dennis Mwaniki Global Urban Observatory, Research and Capacity Development Branch, UN-Habitat Bangkok, Thailand Outline
Appendix: Development Patterns and Design
 Appendix: Development Patterns and Design Development Patterns Figure 1 lists the amount of land converted from undeveloped to some other form of land for the 13 county and 20 county Atlanta Region. In
73% of the units constructed in 2017 were attached or multifamily housing types.
 Montgomery County Data: HOUSING 2017 Housing Units Built Montgomery County, Pennsylvania 73% of the units constructed in 2017 were attached or multifamily housing types. Housing construction in Montgomery
Overview of Methods. Terrestrial areas that are most important for conservation Conservation
 Overview of Methods The goal of the Western Lake Erie Coastal Conservation Vision project (WLECCV) is to define where we should be working locally to optimally achieve regional conservation impact. The
SxD STUDIO MAPPING THE SPIKES TEAM VANAGAIN.
 SxD STUDIO MAPPING THE SPIKES 10.21.05 TEAM VANAGAIN. Elise Menard + Lesya Fesiak + Mo Rouhi + Xenia Semenianuk SxD STUDIO MAPPING THE SPIKES 10.21.05 Transportation Transit Ridership Population Density
Most people used to live like this
 Urbanization Most people used to live like this Increasingly people live like this. For the first time in history, there are now more urban residents than rural residents. Land Cover & Land Use Land cover
MPOs SB 375 LAFCOs SCAG Practices/Experiences And Future Collaborations with LAFCOs
 Connecting LAFCOs and COGs for Mutual Benefits MPOs SB 375 LAFCOs SCAG Practices/Experiences And Future Collaborations with LAFCOs Frank Wen, Manager Research & Analysis Land Use & Environmental Planning
Density and Walkable Communities
 Density and Walkable Communities Reid Ewing Professor & Chair City and Metropolitan Planning University of Utah ewing@arch.utah.edu Department of City & Metropolitan Planning, University of Utah MRC Research
Country Residential High and Low Density Areas
 Country Residential Low Density Subject Area HIGHWAY 16 SHERWOOD PARK HIGHWAY HIGHWAY 21 AIR PHOTO Country Residential Low Density Area Subject Area PLANNING & DEVELOPMENT SERVICES Drawn By: M.Fraser Date