Central Ground Water Board. Government of India. Faridabad
|
|
|
- Loraine Norris
- 5 years ago
- Views:
Transcription


1 Central Ground Water Board क न द र य भ -जऱ ब र ड Ministry of Water Resources, River Development and Ganga Rejuvenation जऱ स स धन, नद व क स और ग ग स रक षण म त र ऱय Government of India भ रत सरक र Faridabad फ़र द ब द
2 २०१४-२०१५ Central Ground Water Board क न द र य भ -जऱ ब र ड Ministry of Water Resources, River Development and Ganga Rejuvenation जऱ स स धन, नद व क स और ग ग स रक षण म त र ऱय Government of India भ रत सरक र Faridabad फ़र द ब द
3 GROUND WATER YEAR BOOK- INDIA CONTENTS Chapter Page No. 1.0 Hydrogeological Setup of the Country Ground Water Occurrence Porous Formations Fissured Formations (Consolidated Formations) 1.2 Hydrogeological Units and their Ground Water Potential 2.0 Ground Water Level Scenario Introduction 2.2 Depth to Water Level 2.3 Annual Water Level Fluctuation 2.4 Seasonal Water Level Fluctuation 2.5 Decadal Water Level Fluctuation 2.6 Rain Fall Variations 3.0 Ground Water Resource Availability and Development Status Dynamic Fresh Ground Water Resource 3.2 Stage of Ground Water Development 3.3 Categorization of Assessment Units LIST OF PLATES Hydrogeological Map of India Location of Ground Water Monitoring Wells Depth to Water Level at a glance Depth to water level (Pre monsoon2015) Depth to water level (August 2015) Depth to water level (Post monsoon2015) Depth to water level (January 2016) PLATE No. I II III IV V VI VII
4 Annual water level fluctuation at a glance Annual water level fluctuation (Pre monsoon ) Annual water level fluctuation (August 2015-August 2014) Annual water level fluctuation (November 2015-November 2014) Annual water level fluctuation (January 2016-January 2015) Seasonal water level fluctuation at glance Seasonal water level fluctuation (August 2015-Pre monsoon 2014) Seasonal water level fluctuation (Post monsoon2015-pre monsoon 2014) Seasonal water level fluctuation (January 2016-Pre monsoon 2015) Decadal water level fluctuation at a glance Decadal water level fluctuation, Decadal mean pre monsoon ( ) Vs pre monsoon 2015 Decadal water level fluctuation, Decadal mean August ( ) Vs August 2015 Decadal water level fluctuation, Decadal mean November ( ) Vs November 2015 Decadal water level fluctuation, Decadal mean January ( ) Vs January 2016 VIII IX X XI XII XIII XIV XV XVI XVII XVIII XIX XX XXI Annual Rainfall Maps of India XXII Categorization of Ground Water Assessment Units Ground Water Resource Availability and Utilization in India XXIII XXIV LIST OF TABLES TABLE No. Major aquifer System In The Country 1 State Wise Status of GW Monitoring Wells 2 State Wise Ground water Resources Availability, Utilization and Stage of Development 3 Categorization of Ground Water Assessment Units 4 LIST OF ANNEXURES ANNEXURE No. State - Wise Distribution Of Percentage Of Observation Wells Premonsoon State - Wise Distribution Of Percentage Of Observation Wells August I II State - Wise Distribution Of Percentage Of Observation Wells Post-Monsoon
5 III State - Wise Distribution Of Percentage Of Observation Wells 2016 January IV State - Wise Fluctuation And Frequency Distribution From Different Ranges From 2015 Premonsoon To 2014 Premonsoon State - Wise Fluctuation And Frequency Distribution From Different Ranges From 2015 August To 2014 August State - Wise Fluctuation And Frequency Distribution From Different Ranges From 2015 Post monsoon To 2014 Post monsoon State - Wise Fluctuation And Frequency Distribution From Different Ranges From 2016 January To 2015 January State - Wise Fluctuation And Frequency Distribution From Different Ranges From 2015 Premonsoon To 2015 August State - Wise Fluctuation And Frequency Distribution From Different Ranges From 2015 Premonsoon To 2015 November State - Wise Fluctuation And Frequency Distribution From Different Ranges From 2015 Premonsoon To 2016 January State - Wise Fluctuation And Frequency Distribution With Decadal Mean ( ) And 2015 Premonsoon State - Wise Fluctuation And Frequency Distribution With Decadal Mean ( ) And 2015 August State - Wise Fluctuation And Frequency Distribution With Decadal Mean ( ) And 2015 November State - Wise Fluctuation And Frequency Distribution With Decadal Mean ( ) And 2016 January V VI VII VIII IX X XI XII XIII XIV XV
6 1. HYDROGEOLOGICAL SETUP OF THE COUNTRY 1.1 GROUND WATER OCCURRENCE The ground water behavior in the Indian sub-continent is highly complicated due to the occurrence of diversified geological formations with considerable lithological and chronological variations, complex tectonic framework, climatological dissimilarities and various hydrochemical conditions. Studies carried out over the years have revealed that aquifer groups in alluvial / soft rocks even transcend the surface basin boundaries. Broadly two groups of rock formations have been identified depending on characteristically different hydraulics of ground water, Viz. Porous Formations and Fissured Formations POROUS FORMATION Porous formations have been further subdivided into Unconsolidated and Semi-consolidated formations. UNCONSOLIDATED FORMATIONS The areas covered by alluvial sediments of river basins, coastal and deltaic tracts constitute the unconsolidated formations. These are by far the most significant ground water reservoirs for large scale and extensive development. The hydrogeological environment and ground water regime in the Indo-Ganga-Brahmaputra basin indicate the existence of potential aquifers having enormous fresh ground water reserve. Bestowed with high incidence of rainfall and covered by a thick pile of porous sediments, these ground water reservoirs get replenished every year and are being used heavily. In these areas, in addition to the Annual Replenishable Ground Water Resources available in the zone of water level fluctuation (Dynamic Ground Water Resource), there exists a huge ground water reserve in the deeper passive recharge zone below the zone of fluctuation as well as in the deeper confined aquifers which remains largely unexplored as yet. Although the mode of development of ground water is primarily through dug wells, dug cum bore well and cavity wells, thousands of tube wells have been constructed during last few decades. SEMI-CONSOLIDATED FORMATIONS The semi-consolidated formations normally occur in narrow valleys or structurally faulted basins. The Gondwanas, Lathis, Tipams, Cuddalore sandstones and their equivalents are the most extensive productive aquifers in this category. Under favorable situations, these formations give rise to free flowing wells. In selected tracts of northeastern India, these water-bearing formations are quite productive. The Upper Gondwanas, which are generally arenaceous, in general, constitute prolific aquifers FISSURED FORMATIONS (CONSOLIDATED FORMATIONS) The consolidated formations occupy almost two-thirds of the country. These formations, except vesicular volcanic rocks have negligible primary porosity. From the hydrogeological point of view, fissured rocks are broadly classified into four types viz. Igneous and metamorphic rocks (excluding volcanic and carbonate rocks), volcanic rocks, consolidated sedimentary rocks and Carbonate rocks. IGNEOUS AND METAMORPHIC ROCKS EXCLUDING VOLCANIC AND CARBONATE ROCKS The most common rock types under this category are granites, gneisses, charnockites, khondalites, quartzites, schists and associated phyllites, slates, etc. These rocks possess negligible primary porosity but attain porosity and permeability due to fracturing and weathering. 1
7 Ground water yield also depends on the rock type and grade of metamorphism. Generally, the granites, Khondalites and biotite gneisses have better yield potential as compared to charnockites. VOLCANIC ROCKS The predominant types of volcanic rocks are the basaltic lava flows of Deccan Plateau. The highly variable water bearing properties of different flow units control ground water occurrence in Deccan Traps. The Deccan Traps have usually poor to moderate permeability depending on the presence of primary and secondary fractures. CONSOLIDATED SEDIMENTARY ROCKS EXCLUDING CARBONATE ROCKS Consolidated sedimentary rocks occur in Cuddapahs, Vindhyans and their equivalents. The formations consist of conglomerates, sandstones, shales. The presence of bedding planes, joints, contact zones and fractures controls the ground water occurrence, movement and yield potential. CARBONATE ROCKS Limestones in the Cuddapah, Vindhyan and Bijawar group of rocks dominates the carbonate rocks other than marbles and dolomites. In carbonate rocks, the circulation of water creates solution cavities thereby increasing the permeability of the aquifers. The solution activity leads to widely contrasting permeabilities within short distances. 1.2 HYDROGEOLOGICAL UNITS AND THEIR GROUND WATER POTENTIAL Hydrogeological map of India is depicted in Plate-I and the geographical distribution of hydrogeological units along with their Ground water potential is given in Table 1. TABLE 1: AQUIFER SYSTEM IN THE COUNTRY System Coverage Ground water potential Unconsolidated formations - alluvial Consolidated/semiconsolidated formations - sedimentaries, basalts and crystalline rocks Indo-Gangetic, Brahmaputra plains Coastal Areas Part of Desert area Rajasthan and Gujarat Peninsular Areas Enormous reserves down to 600 m depth. High rain fall and hence recharge is ensured. Can support large-scale development through deep tube wells Reasonably extensive aquifers but risk of saline water intrusion Scanty rainfall. Negligible recharge. Salinity hazards. Ground water Availability at great depths. Availability depends on secondary porosity developed due to weathering, fracturing etc. Scope for GW availability at shallow depths (20-40 m) in some areas and deeper depths ( m) in other areas. Varying yields. Hilly Hilly states Low storage capacity due to quick runoff 2

8 PLATE - I 3
9 2.0 GROUND WATER LEVEL SCENARIO 2.1 INTRODUCTION Ground Water Year Book is prepared annually by CGWB depicting changes in ground water regime of the country through different seasons. It is an effort to obtain information on ground water levels through representative monitoring wells. The important attributes of ground water regime monitoring are ground water level. The natural conditions affecting the regime involve climatic parameters like rainfall, evapotranspiration etc., whereas anthropogenic influences include pumpage from the aquifer, recharge due to irrigation systems and other practices like waste disposal etc. Ground water levels are being measured by Central Ground Water Board four times a year during January, March/April/ May, August and November. The regime monitoring started in the year 1969 by Central Ground Water Board. A network of observation wells, as on , located all over the country is being monitored. Ground water samples are collected from these observation wells once a year during the month of March/April/ May to obtain background information of ground water quality changes on regional scale. The database thus generated forms the basis for planning the ground water development and management programmes. The ground water level and quality monitoring is of particular importance in coastal as well inland saline environment to assess the changes in salt water/fresh water interface as also the gradual quality changes in the fresh ground water regime. This data is used for assessment of ground water resources and changes in the regime consequent to various development and management activities. The premonsoon water level data is collected from all the monitoring stations during the months of March/ April/ May, depending on the climatological conditions of the region. For North eastern states premonsoon data is collected during March, since the onset of monsoon is normally observed in April. Similarly for Orissa, West Bengal and Kerala where monsoon appears early in May the monitoring is carried out during the month of April. For remaining states premonsoon monitoring month is May. Water levels during August are monitored to access the impact of monsoon on the ground water resources. Post monsoon data collected during November reflects the cumulative effect of ground water recharge and withdrawal of ground water for various purposes. January water level data indicates the effect of withdrawal for rabi crops. The data is analyzed to know about the frequency distribution of water levels during different periods and seasonal, annual and decadal fluctuations in water levels. The water level and water level fluctuation maps are prepared for each monitoring period to study the spatial and temporal changes in ground water regime. The State/UT-wise distribution of the ground water observation wells is given in table- 2 and depicted in Plate II. 4

10 PLATE - II 5
11 TABLE-2 STATE/UT -WISE STATUS OF GROUND WATER MONITORING WELLS (AS ON ) Status of Ground Water Monitoring Stations (March 2015) Sl No Name of the State/UTs Number of Ground Water Monitoring Stations DW PZ Total 1 Andhra Pradesh Arunachal Pradesh Assam Bihar Chhattisgarh Delhi Goa Gujarat Haryana Himachal Pradesh Jammu & Kashmir Jharkhand Karnataka Kerala Madhya Pradesh Maharashtra Manipur Meghalaya Nagaland Odisha Punjab Rajasthan Tamil Nadu
12 24 Telangana Tripura Uttar Pradesh Uttarakhand West Bengal UT s 2 Andaman & Nicobar Chandigarh Dadra & Nagar Haveli Daman & Diu TOTAL
13 2.2 DEPTH TO WATER LEVEL DEPTH TO WATER LEVEL PRE MONSOON 2015 The ground water level data for Premonsoon 2015 indicate that out of the total wells analysed, 993 (6%) wells are showing water level less than 2 m bgl (metres below ground level), 4145 (27%) wells are showing water level in the depth range of 2-5 m bgl, 6142 (40 %) wells are showing water level in the depth range of 5-10 m bgl, 3176 (21%) wells are showing water level in the depth range of m bgl, 740 (5%) wells are showing water level in the depth range of m bgl and the remaining 213 (1 %) wells are showing water level more than 40 m bgl. The distribution of number of wells under different depth ranges is presented in the histogram (Fig-1) and statistical distribution is given in Annexure-I. The maximum depth to water level of m bgl is observed in Rajasthan whereas the minimum is less than 1 m bgl. The depth to water level map of Premonsoon 2015 (Plate III) for the country indicates that in general depth to water level ranges from 2 to 20 m bgl as observed at about more than 85% of the monitoring stations. In Sub-Himalayan area and parts of Uttar Pradesh, Bihar, Chhattisgarh, Odisha, almost whole of Assam and few areas in Maharashtra, coastal Tamil Nadu, Andhra Pradesh generally the depth to water level varies from 2-5 meter below ground level. Very shallow water level of less than 2 m bgl is observed locally, in the states of Assam, Andhra Pradesh, Himachal Pradesh, and Tamil Nadu. In major area of the Country, water level is observed to be in the range of 5 to 10 m, mostly in the states of Bihar, Chhatisgarh, Jharkhand, Karnataka, Kerala, Madhya Pradesh, Maharashtra, Odisha, Telangana, Uttar Pradesh and West Bengal. Water level in the range of m bgl is mostly observed in the states of Delhi, Gujarat, Haryana, Madhya Pradesh, Maharashtra, Punjab, Rajasthan, Telangana and West Bengal. In major parts of northwestern states depth to water level generally ranges from m bgl. In the western parts of the country, deeper water level is recorded in the depth range of m bgl and more than 40 m bgl. In parts Delhi and a major part of Rajasthan, water level of more than 40 m bgl is recorded. Along the eastern & western coast water level is generally upto 10 m bgl. Central part of West Bengal recorded water level in the range of m bgl. In Central and eastern India water level generally varies between 5 m bgl to 10 m bgl, except in isolated pockets where water level more than 10 m bgl has been observed. The peninsular part of country generally recorded a water level in the range of 10 to 20 m bgl depth range. DEPTH TO WATER LEVEL AUGUST 2015 Ground Water Level Scenario - August 2015 The ground water level data for August 2015 indicate that out of the total wells analysed, 3917 (26 %) wells are showing water level less than 2 m bgl (metres below ground level), 4842 (32%) wells are showing water level in the depth range of 2-5 m bgl, 3812 (25 %) wells are showing water level in the depth range of 5-10 m bgl, 1760 (12%) wells are showing water level in 8
14 the depth range of m bgl, 470 (3%) wells are showing water level in the depth range of m bgl and the remaining 225 (2 %) wells are showing water level more than 40 m bgl, (Annexure-II). The maximum depth to water level of m bgl is observed in Rajasthan whereas the minimum is less than 1 m bgl. The depth to water level map of August 2015 (Plate V) for the country indicates that in general depth to water level ranges from 0 to 5 m bgl as observed at about more than 60% of the monitoring stations. Sub-Himalayan area, north of river Ganges, Uttar Pradesh, Bihar, Odisha, Assam, Andhra Pradesh and Tripura generally the depth to water level varies from 2-5 meter below ground level. Shallow water level of less than 2 m bgl is observed in the states of Assam, Chhatishgarh, Maharashtra, Orissa and Uttar Pradesh and also in isolated pockets in Madhya Pradesh. In the states of Madhya Pradesh, Jharkhand, Maharashtra, Karnataka, Telangana, Kerala and West Bengal water level generally varies from 5 to 10 m bgl with small patches showing depth to water level between 2 to 5 m bgl. In major parts of north-western states depth to water level generally ranges from m bgl. In the western parts of the country deeper water level is recorded in the depth range of m bgl and more than 40 m bgl. In some parts of Delhi and Rajasthan water level of more than 40 m bgl is recorded. Along the eastern & western coast water level is generally less than 10 m. Central part of West Bengal state recorded water level in the range of m bgl. In Central India water level generally varies between 2 m bgl to 10 m bgl, except in isolated pockets where water level more than 10 m bgl has been observed. The peninsular part of country generally recorded a water level in the range of 5 to 20 m bgl depth range. DEPTH TO WATER LEVEL POST MONSOON 2015 The ground water level data for November 2015 indicate that out of the total wells analysed, 2602(16 %) wells are showing water level less than 2 m bgl (metres below ground level), 5796(36%) wells are showing water level in the depth range of 2-5 m bgl, 4665 (29 %) wells are showing water level in the depth range of 5-10 m bgl, 2260 (14%) wells are showing water level in the depth range of m bgl, 774(5%) wells are showing water level in the depth range of m bgl and the remaining 223 (1 %) wells are showing water level more than 40 m bgl. The distribution of number of wells under different depth ranges is presented in the histogram (Fig-1) and statistical distribution is given in Annexure-I. The maximum depth to water level of m bgl is observed in Buikaner district of Rajasthan whereas the minimum is less than 1 m bgl. The depth to water level map of November 2015(Plate II) for the country indicates that in general depth to water level ranges from 2 to 10 m bgl as observed at about more than 65% of the monitoring stations. Sub-Himalayan area, north of river Ganges, Uttar Pradesh, Bihar, Odisha, Chhatishgarh, Assam, Andhra Pradesh, Maharashtra, and Tripura generally the depth to water 9
15 level varies from 2-5 meter below ground level. Shallow water level of less than 2 m bgl is observed in the states of Assam, Andhra Pradesh, Chhatishgarh, Himachal Pradesh, Maharashtra, Odisha, Tripura and Uttar Pradesh and also in isolated pockets in Karnataka, Gujarat and Tamil Nadu. In the states of Madhya Pradesh, Jharkhand, Maharashtra, Chhatishgarh, Gujarat, Karnataka, Tamil Nadu, Telangana, Kerala and West Bengal water level generally varies from 5 to 10 m bgl with small patches showing depth to water level between 2 to 5 m bgl. In major parts of north-western states depth to water level generally ranges from m bgl. In the western parts of the country deeper water level is recorded in the depth range of m bgl and more than 40 m bgl. In some parts of Haryana, and Delhi and almost major parts of Rajasthan, water level of more than 40 m bgl is recorded. Along the eastern & western coast water level is generally upto 10 mbgl. Central part of West Bengal recorded water level in the range of 5-20 m bgl. In Central India water level generally varies between 2 m bgl to 10 m bgl, except in isolated pockets where water level more than 10 m bgl has been observed. The peninsular part of country generally recorded a water level in the range of 2 to 20 m bgl depth range. DEPTH TO WATER LEVEL JANUARY 2016 The ground water level data for January 2016 indicate that out of the total wells analysed, 1371(9 %) wells are showing water level less than 2 m bgl (metres below ground level), 4958 (33%) wells are showing water level in the depth range of 2-5 m bgl, 5342 (36 %) wells are showing water level in the depth range of 5-10 m bgl, 2498 (17%) wells are showing water level in the depth range of m bgl, 607(4%) wells are showing water level in the depth range of m bgl and the remaining 198 (1 %) wells are showing water level more than 40 m bgl. The distribution of number of wells under different depth ranges is presented in the histogram (Fig-1) and statistical distribution is given in Annexure-I. The maximum depth to water level of m bgl is observed in Bikaner district of Rajasthan whereas the minimum is less than 1 m bgl. The depth to water level map of January 2016 (Plate II) for the country indicates that in general depth to water level ranges from 2 to 10 m bgl as observed at about more than 65% of the monitoring stations. Sub-Himalayan area, north of river Ganges, northern parts of Uttar Pradesh, northern parts of Bihar, Odisha, Assam, Andhra Pradesh, coastal parts of Maharashtra, and Tripura generally the depth to water level varies from 2-5 meter below ground level. Shallow water level of less than 2 m bgl is observed in the states of Assam and isolated pockets in Andhra Pradesh, Maharashtra, Odisha and Tamil Nadu. In West Bengal water level generally varies from 2 to 10 m bgl and central parts of the state shows water level of 10 m and above and deeper water level of more than 20 m bgl in small pockets. 10
16 In major parts of north-western states depth to water level generally ranges from m bgl. Water level of more than 40 m bgl is also prevalent in the north western part of the country. In the western parts of the country deeper water level is recorded in the depth range of m bgl and more than 40 m bgl. In some parts of Haryana, and Delhi and almost major parts of Rajasthan, water level of more than 40 m bgl is recorded. Along the eastern coast water level is generally upto 5 m bgl whereas in the western coast water level of 10 m bgl is prevalent. In Central India water level generally varies between 5 m bgl to 20 m bgl, except in isolated pockets where water level of less than 5 m bgl has been observed. The peninsular part of country generally recorded a water level in the range of 2 to 20 m bgl depth range. 11

17 PLATE - III DEPTH TO WATER LEVEL AT A GLANCE 12
18 PLATE - IV 13
19 PLATE - V 14
20 PLATE VI 15
21 PLATE VII 16
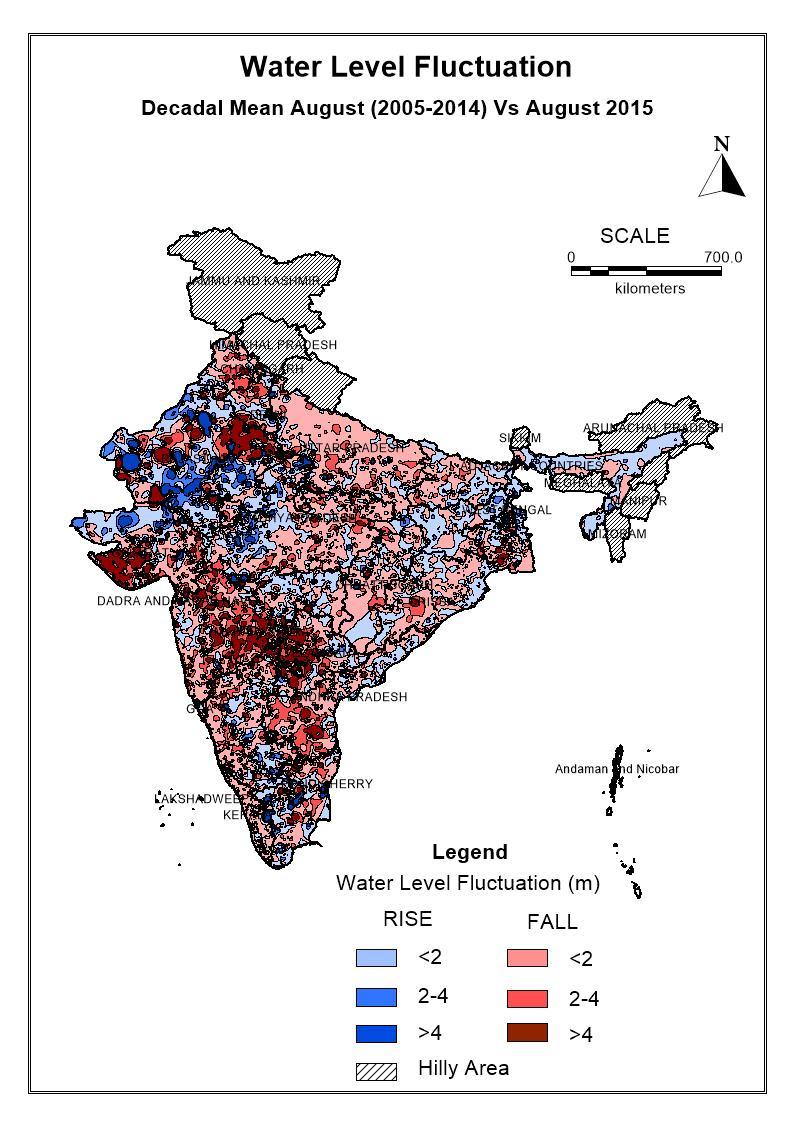
22 2.3 ANNUAL WATER LEVEL FLUCTUATION ANNUAL WATER LEVEL FLUCTUATION (PREMONSOON 2015-PREMONSOON 2014) The water level fluctuation of Premonsoon 2015 with Premonsoon 2014 shows that out of wells analysed, 5425 (40%) are showing rise and 7608 (57%) are showing fall in water level. Remaining 425 (3%) stations analysed do not show any change in water level. About 31% wells are showing rise in the water level in the range of less than 2 m. About 5% wells are showing rise in water level in 2-4 m range and 4 % wells showing rise in water level more than 4 m range. About 57% wells are showing decline in water level, out of which 43% wells are showing decline in water level in less than 2 m range. About 8% wells are showing decline in water level in 2-4 m range. About 5% wells are showing decline in water level more than 4 m range (Fig-2 and Annexure-II). Majority of the wells showing rise/decline falls in the range of 0-2 m. A comparison of depth to water level of Premonsoon 2015 to Premonsoon 2014 is presented in the form of water level fluctuation map (Plate IV) reveals that in general, there is fall in water level in almost the entire country, except in few states such as Assam, Karnataka, Kerala, Rajasthan and Tamil Nadu. Fall is mostly in the range of 0-2 m, although fall in the range of more than 2 m is also prevalent in all the states in small patches. Fall of more than 2 m is mainly seen in the central parts of the country, mostly in Maharashtra and Telangana ANNUAL WATER LEVEL FLUCTUATION (AUGUST 2015-AUGUST 2014) A comparison of depth to water level of August 2015 with August 2014 (Plate-X) reveals that in general, there is fall in water level in almost the entire country, except few states such as Assam, Bihar, Jharkhand, Orissa, West Bengal and parts of Maharashtra and Tamil Nadu. Fall is mostly in the range of 0-2 m, although fall in the range of more than 2 m is also prevalent in all the states in patches. Rise in water level of more than 4 m has been observed in small pockets in the states of Assam, Tamil Nadu, Bihar, Maharashtra, Rajasthan and Gujarat. About 38% of the wells analysed are showing rise and 60% are showing fall in water level. Remaining 2% wells analysed do not show any change in water level. About 29% wells are showing rise in the water level in the range of less than 2 m. About 6% wells are showing rise in water level in 2-4 m range and 3 % wells showing rise in water level more than 4 m range. About 60% wells are showing decline in water level, out of which 43% wells are showing decline in water level in less than 2 m range. About 11 % wells are showing decline in water level in 2-4 m range. About 7% wells are showing decline in water level more than 4 m range. Majority of the wells showing rise/decline falls in the range of 0-2 m. 17
23 ANNUAL WATER LEVEL FLUCTUATION (NOVEMBER NOVEMBER 2014) The water level fluctuation of November 2014 to November 2015 shows that out of wells analysed, 4609(35%) are showing rise and 8219 (63%) are showing fall in water level. Remaining 207 (2%) stations analysed do not show any change in water level. About 29% wells are showing rise in the water level in the range of less than 2 m. About 4% wells are showing rise in water level in 2-4 m range and 3 % wells showing rise in water level more than 4 m range. About 63% wells are showing decline in water level, out of which 47% wells are showing decline in water level in less than 2 m range. About 11 % wells are showing decline in water level in 2-4 m range. About 5% wells are showing decline in water level more than 4 m range (Fig-2 and Annexure-II). Majority of the wells showing rise/decline falls in the range of 0-2 m. A comparison of depth to water level of November 2015 to November 2014 is presented in the form of water level fluctuation map (Plate III) reveals that in general, there is fall in water level in almost the entire country, except in few states such as Assam, Andhra Pradesh, Gujarat, Madhya Pradesh, Kerala and Tamil Nadu. Fall is mostly in the range of 0-2 m, although fall in the range of more than 2 m is also prevalent in all the states in small patches. ANNUAL WATER LEVEL FLUCTUATION (JANUARY JANUARY 2015) The water level fluctuation of January 2016 to January 2015 shows that out of wells analysed, 4570 (35%) are showing rise and 8446 (64%) are showing fall in water level. Remaining 228 (2%) stations analysed do not show any change in water level. About 27% wells are showing rise in the water level in the range of less than 2 m. About 4% wells are showing rise in water level in 2-4 m range and 3 % wells showing rise in water level more than 4 m range. About 64% wells are showing decline in water level, out of which 47% wells are showing decline in water level in less than 2 m range. About 10 % wells are showing decline in water level in 2-4 m range and 7% wells are showing decline in water level more than 4 m range (Fig-2 and Annexure-II). Majority of the wells showing rise/decline falls in the range of 0-2 m. A comparison of depth to water level of January 2015 to January 2014 is presented in the form of water level fluctuation map (Plate III) reveals that in general, there is fall in water level in almost the entire country, except in few states such as Assam, Andhra Pradesh, Gujarat, Kerala, Karnataka, Rajasthan and Tamil Nadu. Rise in water level in isolated pockets is observed in the states of Madhya Pradesh, West Bengal, Haryana, and Maharashtra. Fall is mostly in the range of 0-2 m, although fall in the range of more than 2 m is also prevalent in all the states in small patches. Fall of more than 4 m is prominent in the states of Andhra Prdesh, Gujarat, Karnataka, Madhya Pradesh, Maharashtra, Rajasthan, Telangana and West Bengal. 18
24 PLATE - VIII ANNUAL WATER LEVEL FLUCTUATION AT A GLANCE 19
25 PLATE-IX 20
26 PLATE - X 21
27 PLATE XI 22
28 PLATE XII 23
29 2.4 SEASONAL WATER LEVEL FLUCTUATIONS SEASONAL WATER LEVEL FLUCTUATION (PREMONSOON AUGUST 2015) A comparison of depth to water level of August 2015 with Premonsoon 2015 indicate that about 81% of wells are showing rise in water levels, out of which 37% wells are showing rise of less than 2 m range. About 24% wells are showing rise in water level in the range of 2-4 m and another 20 % wells are showing rise in water in range of more than 4 m. Only 17 % wells are showing decline in water level, out of which 13 % wells are showing decline in water in the range of 0-2 m. Rise in water level more than 4 m is mostly prominent in the states of Bihar, Chhattisgarh, Dadra & Nagar Haveli, Gujarat, Jharkhand, Karnataka, and Kerala (Plate XIV) SEASONAL WATER LEVEL FLUCTUATION (PREMONSOON 2015-NOVEMBER 2015) A comparison of depth to water level of November 2015 with Premonsoon 2015 indicates that about 77% of wells analysed are showing rise in water levels, out of which 43% wells are showing rise of less than 2 m range. About 21% wells are showing rise in water level in the range of 2-4 m and another 13 % wells are showing rise in water in range of more than 4 m. Only 21 % wells are showing decline in water level, out of which 17 % wells are showing decline in water in the range of 0-2 m. Rise in water level is prominent in all the states of the country except in few states such as Chandigarh, Delhi, Haryana, Punjab and to some extent Rajasthan. (Fig-3 and Annexure-IV). Rise in water level of more than 4 m is prominent in the most of the states such as Andhra Pradesh, Assam, Chhatishgarh, Gujarat, Jharkhand, Karnataka, Madhya Pradesh, Maharashtra, Rajasthan, Tamil Nadu, Telangana, Uttarakhnad, West Bengal. A comparison of depth to water level of November 2015 with Premonsoon 2015 is presented in the form of water level fluctuation map (Plate III) reveals that in general, there is rise in water level in almost the entire country, except in few states such as Chandigarh, Delhi, Haryana and Punjab. Fall is seen in isolated pockets in the states of Uttar Pradesh, Maharshrtra, Telangana, Tamil Nadu.Fall is mostly in the range of 0-2 m. SEASONAL WATER LEVEL FLUCTUATION (JANUARY 2016 TO PREMONSOON 2015) The water level fluctuation of January 2016 to Premonsoon 2015 indicates that out of wells analysed, 8521 (64%) are showing rise and 4523 (34%) are showing fall in water level. Remaining 297 (2%) wells analysed do not show any change in water level. About 45% wells are showing rise in the water level in the range of less than 2 m. About 12% wells are showing rise in water level in 2-4 m range and 7 % wells showing rise in water level more than 4 m range. About 34% wells are showing decline in water level, out of which 26% wells are showing decline in water level in less than 2 m range. About 5 % wells are showing decline in water level in 24
30 2-4 m range and 3% wells are showing decline in water level more than 4 m range (Fig-3 and Annexure-IV). Majority of the wells showing rise/decline falls in the range of 0-2 m. A comparison of depth to water level of January 2016 with Premonsoon 2015 is presented in the form of water level fluctuation map (Plate III) reveals that in general, there is rise in water level in almost the entire country, except in few states. Rise in water level is prominent in all the states of the country except Punjab and Uttar Pradesh and to some extent in Rajasthan. Rise in water level of more than 4 m is prominent in the most of the states such as Andhra Pradesh, Gujarat, Jharkhand, Madhya Pradesh, Maharashtra, Odisha, Rajasthan and Tamil Nadu. Decline in water level is prominent in Uttar Pradesh, Rajasthan and Punjab and in isolated pockets of Bihar, West Bengal, Madhya Pradesh, Karnataka, Chhatishgarh and Gujarat. 25

31 PLATE - XIII SEASONAL WATER LEVEL FLUCTUATION AT A GLANCE 26

32 PLATE XIV 27

33 PLATE XV 28
34 PLATE XVI 29
35 2.5 DECADAL WATER LEVEL FLUCTUATION WATER LEVEL FLUCTUATION WITH DECADAL MEAN (PREMONSOON-2005 TO PREMONSOON-2014) TO PREMONSOON-2015 A comparison of depth to water level of Premonsoon 2015 with decadal mean of Premonsoon ( ) indicate that 7431 (52%) of wells are showing rise in water level, out of which 39% wells are showing rise of less than 2 m (Annexure-III). About 8% wells are showing rise in water level in the range of 2-4 m and about 4% wells are showing rise in water level in the range of more than 4 m (47%) wells are showing decline in water level, out of which 35% wells are showing decline in water in the range of 0-2 m. 8% wells are showing decline in water level in 2-4 m range and remaining 5% are in the range of more than 4 m. Decline in water level of more than 4 m is mostly prominent in the states of Andhra Pradesh, Dadra & Nagar Haveli, Delhi, Gujarat, Haryana, Madhya Pradesh, Rajasthan, Telangana,Tamil Nadu and Uttarakhand. Rise in water level of more than 4 m is observed mostly in the states of Arunachal Pradesh, Chandigarh, Chhattisgarh, Gujarat, Himachal Pradesh, Karnataka, Madhya Pradesh, Tamil Nadu, Rajasthan and Uttarakhand. Remaining 91 (1%) stations analysed do not show any change in water level. The decadal water level fluctuation map of India for Premonsoon, 2015 with the mean of Premonsoon ( ) is shown in Plate-V and frequency distribution of fluctuation ranges is shown in Fig. 3. As observed in Plate-V, there is both rise and fall in water level in the country. Maximum fall is observed in and around parts of Andhra Pradesh, Assam, Chandigarh, Delhi, Punjab, Harynana, Jharkhand, Rajasthan, Gujarat and Telangana. A rise in water level is observed in almost all the states but occurs sporadically. WATER LEVEL FLUCTUATION WITH DECADAL MEAN (AUGUST-2005 TO AUGUST- 2014) TO AUGUST A comparison of depth to water level of August 2015 with decadal mean of August ( ) indicate that about 40% of wells are showing rise in water level, out of which 32% wells are showing rise of less than 2 m. About 5% wells are showing rise in water in the range of 2-4 m and about 3 % wells are showing rise in water level in the range of more than 4 m. About 60% wells are showing decline in water level, out of which 41% wells are showing decline in water in the range of 0-2 m. 12% wells are showing decline in water level in 2-4 m range and remaining 8% are in the range of more than 4 m. Decline in water level of more than 4 m is mostly prominent in the states of Andhra Pradesh, Chandigarh, Delhi, Gujarat, Haryana, Karnataka, Madhya Pradesh, Maharashtra, Punjab, Rajasthan, Telangana and Tamil Nadu. Rise in water level of more than 4 m is observed mostly in the states of Chandigarh, Gujarat, Himachal Pradesh and Rajasthan. Remaining 53 (less than 1%) stations analysed do not show any change in water level. 30
36 Maximum fall is observed in and around parts of Punjab, Rajasthan and Tamil Nadu. A rise in water level is observed in almost all parts of the country. In states of Punjab, Kerala and Tamil Nadu rise in water level is observed as patches. WATER LEVEL FLUCTUATION WITH DECADAL MEAN (NOV-2005 TO NOV-2014) TO NOV-2015 A comparison of depth to water level of November 2015 with decadal mean of November ( ) indicate that 5195 (about 35%) of wells are showing rise in water level, out of which 28% wells are showing rise of less than 2 m (Annexure-IV). About 4% wells are showing rise in water level in the range of 2-4 m and about 2% wells are showing rise in water level in the range of more than 4 m (about 56%) wells are showing decline in water level, out of which 45% wells are showing decline in water in the range of 0-2 m. 12% wells are showing decline in water level in 2-4 m range and remaining 8% are in the range of more than 4 m. Decline in water level of more than 4 m is mostly prominent in the states of Andhra Pradesh, Delhi, Gujarat, Haryana, Karnataka, Madhya Pradesh, Maharashtra, Rajasthan, Telangana,Tamil Nadu and West Bengal. Rise in water level of more than 4 m is observed in few states such as Himachal Pradesh, Rajastha and Tamil Nadu. 43 (1%) stations analysed do not show any change in water level. The decadal water level fluctuation map of India for November, 2015 with the mean of November ( ) is shown in Plate-V and frequency distribution of fluctuation ranges is shown in Fig. 4. As observed in Plate-IV maximum fall is observed in and around parts of Punjab, Telangana, Maharashtra, Rajasthan, Gujarat, Karnataka, Uttar Pradesh, West Bengal, Tamil Nadu. A rise in water level is observed in the country in few states but occurs sporadically. WATER LEVEL FLUCTUATION WITH DECADAL MEAN (JAN 2006 TO JAN 2015) TO JAN 2016 A comparison of depth to water level of January 2016 with decadal mean of January ( ) indicates that 4904 (about 35%) of wells are showing rise in water level, out of which 28% wells are showing rise of less than 2 m (Annexure-IV). About 4% wells are showing rise in water level in the range of 2-4 m and only 2% wells are showing rise in the range of more than 4 m (about 65%) wells are showing decline in water level, out of which 44% wells are showing decline in water in the range of 0-2 m. 13% wells are showing decline in water level in 2-4 m range and remaining 9% are in the range of more than 4 m. Decline in water level of more than 4 m is mostly prominent in the states of Andhra Pradesh, Chhatishgarh, Delhi, Gujarat, Haryana, Karnataka, Madhya Pradesh, Maharashtra, Punjab, Rajasthan, Telangana and West Bengal. Rise in water level of more than 4 m is also observed in few states in isolated pockets such as Gujarat, Himachal Pradesh, Rajasthan and Tamil Nadu. 31
37 The decadal water level fluctuation map of India for January, 2016 with the mean of January ( ) is shown in Plate-V and frequency distribution of fluctuation ranges is shown in Fig. 4. As observed in Plate-IV, almost whole country is showing decline in water level, maximum fall is observed in and around parts of Rajasthan, Haryana, Punjab, Gujarat, Telangana, Maharashtra, Uttar Pradesh, Bihar, Chhatishgarh, Jahrkhand and West Bengal. A rise in water level is observed in few states but occurs sporadically. 32


38 PLATE XVII DECADAL WATER LEVEL FLUCTUATION AT A GLANCE 33
39 PLATE XIX 34
40 35
41 PLATE XX 36
42 PLATE XXI 37
43 2.6 Rainfall Variations Rain gauge stations are established and maintained by different departments and Undertakings of Central and State governments and also by private parties to cater their particular data need. India Meteorological Department (IMD) has 559 observatories (both departmental and part time). Though the period of seasons varies from place to place, for Climatological purposes especially for rainfall, year at all the places is uniformly divided into 4 parts, called seasons. The seasons are: Winter (January and February), Pre monsoon (March to May), South West Monsoon (June to September) and Post Monsoon season (October to December). For the purpose of compiling the rainfall data and draw the inferences India is divided into 36 meteorological homogeneous regions.during the season, out of the total 36 meteorological subdivisions, 23 subdivisions constituting 67.3% of the total area of the country received normal season rainfall and the remaining 12 subdivisions (30% of the total area of the country) received deficient season rainfall. One subdivision (south Interior Karnataka) constituting 3% of the total area of the country received excess rainfall. The Subdivisions having positive percentage departure values are Jammu and Kashmir, Orissa, south Interior Karnataka, coastal Karnataka and Kerala. During the monsoon season, all the months, except September, rainfall was below its LPA value. The rainfall deficiency was highest during the month of June with 58% LPA value. The rainfall during July and August was below normal (90% of LPA) respectively. The second half of the season rainfall was 2% below its LPA values (90% of LPA during August and 108% during September). During July, majority of the subdivisions from central India and west peninsula received excess (3 subdivisions) or normal rainfall (17 subdivisions). The excess rainfall subdivisions are Konkan & Goa, south Interior Karnataka and Odisha. The large rainfall deficiency was observed over north and northeast India, region close to Himalayas and interior & southeast Peninsula. During August, majority of the subdivisions from Peninsula, east and northeast India received normal / excess rainfall. On the other hand, majority of the subdivisions from northwest India and neighboring central India received deficient/ scanty rainfall. During September, the rainfall activity over many parts of the country showed significant increase and 23 subdivisions received excess or normal rainfall. However, 13 subdivisions mainly from north India along the plains of Himalayan region and north peninsula received deficient rainfall. The main observed anomaly features in the monthly and seasonal rainfall patterns can be summarized as; (i) normal seasonal rainfall was received over most parts of the country, however only 5 subdivisions have positive percentage 29 departure, (ii) The country received very large rainfall deficiency during June and above normal rainfall in September, (iii) Only one subdivision (south Interior Karnataka) received excess season rainfall. 38

44 PLATE XXI 39
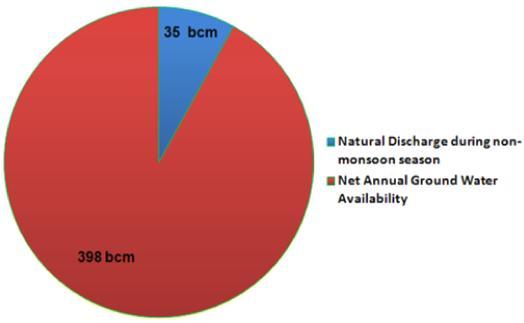
45 3.0 GROUND WATER RESOURCE AVAILABILITY AND DEVELOPMENT STATUS 3.1 DYNAMIC FRESH GROUND WATER RESOURCE The dynamic ground water resources of the States and Union Territories have been assessed jointly by the CGWB and State Ground Water Departments under the supervision of the State level Committees. The base year of computation of the resources is The ground water resources in some of the State/Union Territory/Islands viz. Sikkim, Andaman & Nicobar, Dadra & Nagar Haveli, and Lakshadweep have been estimated by CGWB in absence of active participation of State Govt. The ground water assessment figures computed at the State Level are presented in the following compilation. The dynamic ground water resources are also known as Annual Replenishable Ground Water Resources since it gets replenished/ recharged every year. The Annual Replenishable Ground Water Resource for the entire country has been assessed as 433 billion cubic meter (bcm). The major source of ground water recharge is the monsoon rainfall. About 58% of the annual replenishable resources i.e. 253 bcm are contributed by monsoon rainfall recharge. The overall contribution of rainfall to country s Annual Replenishable Ground Water Resource is 68% and the share of other sources viz. canal seepage, return flow from irrigation, recharge from tanks, ponds, and water conservations structures taken together is 32%. State-wise Ground Water Resources of India as on March, 2011 is given in Table 3 and Plate XXIV presents the overall scenario of ground water resource utilization and availability of the country. The contribution from other sources such as canal seepage, return flow from irrigation, seepage from water bodies etc in Annual Replenishable Ground Water Resource is more than of 33% in the states of Andhra Pradesh, Delhi, Haryana, Gujarat, Goa, Jammu & Kashmir, Karnataka, Punjab, Tamil Nadu, Uttar Pradesh, and UT of Puducherry. South-west monsoon being the most prevalent contributor of rainfall in the country, about 73 % of country s Annual Ground Water Recharge takes place during the Kharif period of cultivation. Keeping 35 bcm for natural discharge, the Net Annual Ground Water Availability for the entire country is 398 bcm. Volumetric estimates are dependent on the areal extent of the assessment unit. Thus, relative comparison of ground water resource of different assessment units based on volumetric estimates is not possible. Hence volumetric estimates of annual replenishable ground water resources have been divided by the area of the assessment unit to arrive at estimates per unit area (in meter). Replenishable Groundwater resource is significantly high in the Indus Ganga Bramhputra alluvial belt in the North, East and North East India covering the states of Punjab, Haryana, Uttar Pradesh, Bihar, West Bengal and valley areas of North Eastern States, where rainfall is plenty and thick piles of unconsolidated alluvial formations are conducive for recharge. Annual Replenishable 40
46 Ground Water Resource in these regions varies from 0.25 to more than 0.5 m. The coastal alluvial belt particularly Eastern Coast also has relatively high replenishable ground water resources, in the range 0.25 to more than 0.5 m. In western India, particularly Rajasthan and parts of northern Gujarat which have arid climate, the annual replenishable ground water resources are scanty, mostly up to m. Similarly, in major parts of the southern peninsular India covered with hard rock terrains, annual replenishable ground water recharge is less, only up to 0.10 m. This is primarily because of comparatively low infiltration and storage capacity of the rock formations prevailing in the region. The remaining part of Central India is mostly characterized by moderate recharge in the range of m. The overall estimate of annual replenishable ground water resources of the entire country shows a marginal increase in the present estimate as compared to the 2009 by about 2 bcm. However there are significant variations in the recharge estimates of some of the States. The main reasons for this can be attributed to changing ground water regime, widespread implementation of rainwater harvesting and water conservation measures, changes in rainfall pattern, adoption of revised values of parameters like Specific Yield which were estimated based on subsequent field studies and availability of improved database which helped in refinements in assessment. 3.2 STAGE OF GROUND WATER DEVELOPMENT The overall stage of ground water development in the country is 62%. The status of ground water development is very high in the states of Delhi, Haryana, Punjab and Rajasthan, where the Stage of Ground Water Development is more than 100%, which implies that in the states the annual ground water consumption is more than annual ground water recharge. In the states of Himachal Pradesh, Tamil Nadu and Uttar Pradesh and UTs of Daman & Diu, and Puducherry, the stage of ground water development is 70% and above. In rest of the states / UTs the stage of ground water development is below 70%. The ground water development activities have increased generally in the areas where future scope for ground water development existed. This has resulted in increase in stage of ground water development from 61% (2009) to 62% (2011). 3.3 CATEGORIZATION OF ASSESSMENT UNITS Out of 6607 numbers of assessed administrative units (Blocks/ Taluks/ Mandals/ Districts), 1071 units are Over-exploited, 217 units are Critical, 697 units are Semi-critical, and 4530 units are Safe. Apart from these, there are 92 assessment units which are completely Saline (Annexure III). Number of Over-exploited and Critical administrative units are significantly higher (more than 15% of the total assessed units) in Delhi, Haryana, Himachal Pradesh, Karnataka, Punjab, Rajasthan and Tamil Nadu, Uttar Pradesh and also the UTs of Daman & Diu and Puducherry (Plate XXIII). 41
47 Categorization of Ground Water Assessment Units PLATE XXIII 42
48 Table 3 STATE-WISE GROUND WATER RESOURCES AVAILABILITY, UTILIZATION AND STAGE OF DEVELOPMENT INDIA (As on 2011) (in bcm) Sl. No. States / Union Territories Annual Replenishable Ground Water Resource Natural Discharge Net Annual Ground Annual Ground Water Draft Monsoon Season Non-monsoon Season Total during nonmonsoon Water Availability Irrigation Domestic and Total industrial Recharge Recharge Recharge Recharge from from other from from other season uses rainfall sources rainfall sources Projected demand for Domestic and Industrial uses upto 2025 Ground Water Availability for future irrigation use Stage of Ground Water Develo pment (%) States 1 Andhra Pradesh Arunachal Pradesh Assam Bihar Chhattisgarh Delhi Goa Gujarat Haryana Himachal Pradesh Jammu & Kashmir Jharkhand Karnataka Kerala
49 15 Madhya Pradesh Maharashtra Manipur Meghalaya Mizoram Negligible Negligible Nagaland 0.40 Negligible 0.21 Negligible Odisha Punjab Rajasthan Sikkim Tamil Nadu Tripura Uttar Pradesh Uttarakhand West Bengal Total States Union Territories 1 Andaman & Nicobar Nil Nil Chandigarh Dadara & Nagar Haveli Daman & Diu Lakshdweep Puducherry Total Uts Grand Total


50 PLATE XXIV Ground Water Resource Availability and Utilization 45
ALL INDIA INSTALLED CAPACITY (IN MW) OF POWER STATIONS
 OF POWER STATIONS") Region Northern Region Western Region Southern Region Eastern Region North Eastern Region Islands ALL INDIA Figures at decimal may not tally due to rounding off ALL INDIA INSTALLED CAPACITY (IN MW) OF
Region Northern Region Western Region Southern Region Eastern Region North Eastern Region Islands ALL INDIA Figures at decimal may not tally due to rounding off ALL INDIA INSTALLED CAPACITY (IN MW) OF
W E E K L Y MONSOON INSIGHT
 W E E K L Y MONSOON INSIGHT 08 th July 2016 Indian Monsoon Dynamics Recent Weather Development India received 35% surplus rainfall in the week ended 6 July with all regions recording above-normal rainfall
ALL INDIA INSTALLED CAPACITY (IN MW) OF POWER STATIONS
 OF POWER STATIONS") Region Northern Region Western Region Southern Region Eastern Region North Eastern Region Islands ALL INDIA Figures at decimal may not tally due to rounding off ALL INDIA INSTALLED CAPACITY (IN MW) OF
Region Northern Region Western Region Southern Region Eastern Region North Eastern Region Islands ALL INDIA Figures at decimal may not tally due to rounding off ALL INDIA INSTALLED CAPACITY (IN MW) OF
ALL INDIA WEATHER SUMMARY AND FORECAST BULLETIN
 Sunday 22 April 2018 NIGHT Time of Issue: 2000 hours IST ALL INDIA WEATHER SUMMARY AND FORECAST BULLETIN Significant Weather Features The ongoing fairly widespread rainfall activity with isolated thunder
ALL INDIA INSTALLED CAPACITY (IN MW) OF POWER STATIONS
 OF POWER STATIONS") Region Northern Region Western Region Southern Region Eastern Region North Eastern Region Islands ALL INDIA Figures at decimal may not tally due to rounding off ALL INDIA INSTALLED CAPACITY (IN MW) OF
Region Northern Region Western Region Southern Region Eastern Region North Eastern Region Islands ALL INDIA Figures at decimal may not tally due to rounding off ALL INDIA INSTALLED CAPACITY (IN MW) OF
Long Range Forecast Update for 2014 Southwest Monsoon Rainfall
 Earth System Science Organization (ESSO) Ministry of Earth Sciences (MoES) India Meteorological Department PRESS RELEASE New Delhi, 9 June 2014 Long Update for 2014 Southwest Monsoon Rainfall HIGHLIGHTS
ALL INDIA WEATHER SUMMARY AND FORECAST BULLETIN
 Saturday 21 April 2018 MORNING Time of Issue: 0800 hours IST ALL INDIA WEATHER SUMMARY AND FORECAST BULLETIN Significant Weather Features Isolated thunder squalls and hailstorms are very likely over Sub
ALL INDIA WEATHER SUMMARY AND FORECAST BULLETIN
 Tuesday 08 May 2018 MID DAY Time of Issue: 1345 hours IST ALL INDIA WEATHER SUMMARY AND FORECAST BULLETIN Significant Weather Features Under the influence of the present Western Disturbance over Jammu
AFP Surveillance Bulletin - India Report for week 1, ending 5 January 2019
 Jan-18 Feb-18 Mar-18 Apr-18 May-18 Jun-18 Jul-18 Aug-18 Sep-18 Oct-18 Nov-18 Dec-18 Jan-19 Table 1: cases by month of paralysis onset, last 13 months State/UT's Total cases in cases as on week 1, cases
Key Finding: Long Term Trend During 2014: Rain in Indian Tradition Measuring Rain
 Chapter 34 RAINFALL Key Finding: Long Term Trend Despite of theories suggesting increase in rainfall in Asian Region due to global warming, no significant trend has been observed at all India level (confirmed
CURRENT STATUS OF MONSOON Main Meteorological conditions of the last week (27August to 2 September)
") CURRENT STATUS OF MONSOON 2009 Main Meteorological conditions of the last week (27August to 2 September) Last week s low pressure area over Orissa and neighbourhood moved west-northwestwards across central
CURRENT STATUS OF MONSOON 2009 Main Meteorological conditions of the last week (27August to 2 September) Last week s low pressure area over Orissa and neighbourhood moved west-northwestwards across central
O.I.H. GOVERNMENT OF INDIA MINISTRY OF AGRICULTURE AND FARMERS WELFARE DEPARTMENT OF AGRICULTURE, COOPERATION AND FARMERS WELFARE
 O.I.H. GOVERNMENT OF INDIA MINISTRY OF AGRICULTURE AND FARMERS WELFARE DEPARTMENT OF AGRICULTURE, COOPERATION AND FARMERS WELFARE 185. SHRI DEVJI M. PATEL: LOK SABHA UNSTARRED QUESTION NO.185 TO BE ANSWERED
CHAPTER 4 CIRCULATION OF PUBLICATIONS
 Circulation of Publications 49 CHAPTER 4 CIRCULATION OF PUBLICATIONS 4.1. A total number of 29,599 publications furnished their circulation figures online for 2016-17 claiming a total circulation of 48,80,89,490
Date of. Issued by (AICRPAM), & Earth System
, & Earth System") National Agromet Advisory Service Bulletin Based on Extended Range Weather Forecast (ERFS) Validity: 29 September 12 October 2017 Date of Issue: 29 September 2017 Issued by Indian Council of Agricultural
National Agromet Advisory Service Bulletin Based on Extended Range Weather Forecast (ERFS) Validity: 29 September 12 October 2017 Date of Issue: 29 September 2017 Issued by Indian Council of Agricultural
Charges for Deviation (Paise/kWh) applicable for: 19 December 2018
 applicable for: 19 December 2018") Annexure-I Annexure-II Average Frequency of the time block (Hz) र ट र य भ र प र षण क द र, ब -9 (प रथम तल), क त ब इ ट ट य शनल ए रय, कटव रय सर य, नई द ल -110016 Date of Issue: Charges for Deviation (Paise/kWh)
Annexure-I Annexure-II Average Frequency of the time block (Hz) र ट र य भ र प र षण क द र, ब -9 (प रथम तल), क त ब इ ट ट य शनल ए रय, कटव रय सर य, नई द ल -110016 Date of Issue: Charges for Deviation (Paise/kWh)
Government of India India Meteorological Department (Ministry of Earth Sciences) Subject: Current weather conditions and forecast for next two weeks
 Subject: Current weather conditions and forecast for next two weeks") Government of India India Meteorological Department (Ministry of Earth Sciences) Press Release Dated 18 June, 2010 Subject: Current weather conditions and forecast for next two weeks Advance of monsoon
Government of India India Meteorological Department (Ministry of Earth Sciences) Press Release Dated 18 June, 2010 Subject: Current weather conditions and forecast for next two weeks Advance of monsoon
O.I.H GOVERNMENT OF INDIA MINISTRY OF AGRICULTURE AND FARMERS WELFARE DEPARTMENT OF AGRICULTURE, COOPERATION AND FARMERS WELFARE
 O.I.H GOVERNMENT OF INDIA MINISTRY OF AGRICULTURE AND WELFARE DEPARTMENT OF AGRICULTURE, COOPERATION AND WELFARE 810. SHRI R. DHRUVA NARAYANA: SHRI RAVINDRA KUMAR PANDEY: DR. UDIT RAJ: SHRI DALPAT SINGH
N. K. Manglik Director
 N. K. Manglik Director Hydro-meteorological observations could be broadly defined as the scientific way for collection of flow data at a specific location along the river including selected meteorological
GOVERNMENT OF INDIA MINISTRY OF HEALTH AND FAMILY WELFARE DEPARTMENT OF HEALTH AND FAMILY WELFARE
 GOVERNMENT OF INDIA MINISTRY OF HEALTH AND FAMILY WELFARE DEPARTMENT OF HEALTH AND FAMILY WELFARE LOK SABHA STARRED QUESTION NO. 183 TO BE ANSWERED ON THE 29 TH JULY, 2016 VECTOR BORNE DISEASES *183. SHRI
GOVERNMENT OF INDIA MINISTRY OF WATER RESOURCES, RIVER DEVELOPMENT & GANGA REJUVENATION LOK SABHA UNSTARRED QUESTION NO ANSWERED ON
 2705. SHRI JITENDRA CHAUDHURY SHRI VENKATESH BABU T.G. SHRI SUSHIL KUMAR SINGH GOVERNMENT OF INDIA MINISTRY OF WATER RESOURCES, RIVER DEVELOPMENT & GANGA REJUVENATION LOK SABHA UNSTARRED QUESTION NO. 2705
Part 1: Weather Forecast Severe Weather Warnings (Source: IMD, Date: 1 st September, 2008)
") Sphere India Unified Response Strategy Situation report (India Floods 2008) 01 st September 2008 Part 1: Weather Forecast Severe Weather Warnings (Source: IMD, Date: 1 st September, 2008) HEAVY RAINFALL
Sphere India Unified Response Strategy Situation report (India Floods 2008) 01 st September 2008 Part 1: Weather Forecast Severe Weather Warnings (Source: IMD, Date: 1 st September, 2008) HEAVY RAINFALL
ANALYTICAL REPORTS ELEMENTARY EDUCATION IN RURAL INDIA
 2011-12 ANALYTICAL REPORTS ACKNOWLEDGEMENTS NUEPA is engaged in strengthening the educational management information system for more than ten years now. The process initiated in 42 districts across 7
3. HYDROMETEROLOGY. 3.1 Introduction. 3.2 Hydro-meteorological Aspect. 3.3 Rain Gauge Stations
 3. HYDROMETEROLOGY 3.1 Introduction Hydrometeorology is a branch of meteorology and hydrology that studies the transfer of water and energy between the land surface and the lower atmosphere. Detailed hydrological
Study of Hydrometeorology in a Hard Rock Terrain, Kadirischist Belt Area, Anantapur District, Andhra Pradesh
 Open Journal of Geology, 2012, 2, 294-300 http://dx.doi.org/10.4236/ojg.2012.24028 Published Online October 2012 (http://www.scirp.org/journal/ojg) Study of Hydrometeorology in a Hard Rock Terrain, Kadirischist
COAL EXPLORATION & RESOURCES
 COAL EXPLORATION & RESOURCES Chapter-3 3.1 INTRODUCTION Exploration for Coal in the country is carried out in two broad stages i.e. the Regional Exploration and Detailed Exploration. The regional exploration
ORIGINAL IN HINDI GOVERNMENT OF INDIA MINISTRY OF CONSUMER AFFAIRS, FOOD & PUBLIC DISTRIBUTION DEPARTMENT OF FOOD AND PUBLIC DISTRIBUTION
 ORIGINAL IN HINDI GOVERNMENT OF INDIA MINISTRY OF CONSUMER AFFAIRS, FOOD & PUBLIC DISTRIBUTION DEPARTMENT OF FOOD AND PUBLIC DISTRIBUTION LOK SABHA UNSTARRED QUESTION NO. 549 TO BE ANSWERED ON 06 TH FEBRUARY,
ORIGINAL IN HINDI GOVERNMENT OF INDIA MINISTRY OF CONSUMER AFFAIRS, FOOD & PUBLIC DISTRIBUTION DEPARTMENT OF FOOD AND PUBLIC DISTRIBUTION
 ORIGINAL IN HINDI GOVERNMENT OF INDIA MINISTRY OF CONSUMER AFFAIRS, FOOD & PUBLIC DISTRIBUTION DEPARTMENT OF FOOD AND PUBLIC DISTRIBUTION LOK SABHA UNSTARRED QUESTION NO. 4122 TO BE ANSWERED ON 20 TH MARCH,
National Project on Organic Farming
 National Project on Organic Farming Department of Agriculture and Cooperation, Ministry of Agriculture Government of India Biofertilizers and Organic Fertilizers Statistics Year 2005-06 to 2009-10 Compiled
Key Finding: During 2013: Rain in Indian Tradition: Measuring Rain
 CHAPTER 34 RAINFALL Key Finding: Despite of theories suggesting increase in rainfall in Asian Region due to global warming, no significant trend has been observed at all India level (confirmed by both
Water Resource & Management Strategies
 Water Resource & Management Strategies National Conference on Integrated Water Resource Management for enhancing Farmers' Income March 22, 2017, Hotel Park, New Delhi Nalin Rawal Chief Business head Agribusiness
Suppressed Surface Heating over northwestern parts of the Country and the ensuing Monsoon Rainfall
 Suppressed Surface Heating over northwestern parts of the Country and the ensuing Monsoon Rainfall During this year, the temperatures have been below normal over north and northwestern parts of India.
CHAPTER 5 ELECTRIC POWER SUPPLY AND SYSTEM LOSSES
 CHAPTER 5 ELECTRIC POWER SUPPLY AND SYSTEM LOSSES REVIEW: Central Electricity Authority General Review 2006 CHAPTER 5 ELECTRIC POWER SUPPLY AND SYSTEM LOSSES During the year 2004-05 gross electricity generation
Geographical location and climatic condition of the
 Geographical location and climatic condition of the study sites North eastern region of India is comprised of eight states namely; Arunachal Pradesh, Assam, Manipur, Meghalaya, Mizoram, Nagaland, Sikkim
Characterization of Weekly Cumulative Rainfall Forecasts over Meteorological Subdivisions of India Using a GCM
 WEATHER AND FORECASTING VOLUME Characterization of Weekly Cumulative Rainfall Forecasts over Meteorological Subdivisions of India Using a GCM S. A. SASEENDRAN,* S. V. SINGH, L.S.RATHORE, AND SOMESHWAR
INDIA METEOROLOGICAL DEPARTMENT (MINISTRY OF EARTH SCIENCES) SOUTHWEST MONSOON-2014 END OF SEASON REPORT For the state of RAJASTHAN
 SOUTHWEST MONSOON-2014 END OF SEASON REPORT For the state of RAJASTHAN") INDIA METEOROLOGICAL DEPARTMENT (MINISTRY OF EARTH SCIENCES) SOUTHWEST MONSOON-2014 END OF SEASON REPORT For the state of RAJASTHAN HIGHLIGHTS For the country as a whole, the rainfall for the season (June-September)
INDIA METEOROLOGICAL DEPARTMENT (MINISTRY OF EARTH SCIENCES) SOUTHWEST MONSOON-2014 END OF SEASON REPORT For the state of RAJASTHAN HIGHLIGHTS For the country as a whole, the rainfall for the season (June-September)
Figure 2.1: Constituent Area
 2 The Region 2.1 CONSTITUENT AREA The National Capital Region includes NCT-Delhi, nine districts of Haryana, six districts of Uttar Pradesh and one district of Rajasthan. Total area of the region is 34,144
2. PHYSICAL FEATURES OF INDIA
 2. PHYSICAL FEATURES OF INDIA Question 1: Choose the right answer from the four alternatives given below. (i) A landmass bound by sea on three sides is referred to as (a) Coast (c) Peninsula (b) Island
Board Question Paper : March 2015
 Board Question Paper : March 2015 BOARD QUESTION PAPER : MARCH 2015 Time: 2 Hours Total Marks: 40 Note: i. All questions are compulsory. ii. Figure to the right indicate full marks. iii. Solve Q. No.3
Contents. Foreword... (vii) Preface...(ix) About the Author...(xi) List of Tables...(xxi) List of Figures... (xxvii)
 Preface...(ix) About the Author...(xi) List of Tables...(xxi) List of Figures... (xxvii)") (xiii) Contents Foreword... (vii) Preface...(ix) About the Author...(xi) List of Tables...(xxi) List of Figures... (xxvii) CHAPTER 1: INTRODUCTION TO WATER RESOURCES 1.1 Global Water Resources... 3 1.2
(xiii) Contents Foreword... (vii) Preface...(ix) About the Author...(xi) List of Tables...(xxi) List of Figures... (xxvii) CHAPTER 1: INTRODUCTION TO WATER RESOURCES 1.1 Global Water Resources... 3 1.2
PROMOTIONAL AND DETAILED EXPLORATION
 Chapter 9 PROMOTIONAL AND DETAILED EXPLORATION ANNUAL REPORT 2017-18 Ministry of Coal Promotional and Detailed Exploration Promotional Exploration Geological Survey of India (GSI), Mineral Exploration
Growth in India: An Analysis Using Elasticities
 Multidimensional Poverty and Inclusive Growth in India: An Analysis Using Elasticities Sabina Alkire and Suman Seth University of Oxford November 10, 2014 Motivation India maintained higher economic growth
Climate Change. Ashok Kumar 1, Ch. Sridevi 2, Durai VR 3, Singh KK 4, Prasad VS 5, Mukhopadhyay P 6, Krishna RPM 7, Deshpande M 8, Chattopadhyay N 9
 RESEARCH 4(14), April - June, 2018 ISSN 2394 8558 EISSN 2394 8566 Climate Change Block level weather forecast using T-1534 model output and biasfree temperature forecast by decaying weighted mean procedure
1 LAND USE PLANNING IN INDIA - RETROSPECT AND PROSPECT
 1 LAND USE PLANNING IN INDIA - RETROSPECT AND PROSPECT T. Haque National Fellow, National Centre for Agricultural Economics and Policy Research, New Delhi Ever since independence, India's planners and
Assessment of water resources and seasonal prediction of rainfall in India
 Proc. IAHS, 374, 151 157, 2016 proc-iahs.net/374/151/2016/ doi:10.5194/piahs-374-151-2016 Author(s) 2016. CC Attribution 3.0 License. Assessment of water resources and seasonal prediction of rainfall in
India is a vast country with varied landforms. Our country has practically all major physical features of the earth i.e. mountains, plains, deserts,
 India is a vast country with varied landforms. Our country has practically all major physical features of the earth i.e. mountains, plains, deserts, plateaus and islands. India is a large landmass formed
GROUNDWATER CONFIGURATION IN THE UPPER CATCHMENT OF MEGHADRIGEDDA RESERVOIR, VISAKHAPATNAM DISTRICT, ANDHRA PRADESH
 GROUNDWATER CONFIGURATION IN THE UPPER CATCHMENT OF MEGHADRIGEDDA RESERVOIR, VISAKHAPATNAM DISTRICT, ANDHRA PRADESH Prof.P.Jagadeesara Rao Department of Geo-Engineering and Centre for Remote Sensing, College
HYDROMET SERVICES FOR FLOOD FORECASTING. Dr. Surinder Kaur IMD, India, New Delhi
 HYDROMET SERVICES FOR FLOOD FORECASTING Dr. Surinder Kaur IMD, India, New Delhi Real Time Rainfall monitoring Hydromet Services Hyomet design Flood meteorological Services AWS=675 ARG=1289 Surface obs(dept)=
OUR COUNTRY INDIA LOCATIONAL SETTING
 7 India is a country of vast geographical expanse. In the north, it is bound by the lofty Himalayas. The Arabian Sea in the west, the Bay of Bengal in the east and the Indian Ocean in the south, wash the
DR.M.K.K ARYA MODEL SCHOOL
 DR.M.K.K ARYA MODEL SCHOOL Sub: Social science Syllabus Class-IV Session 2018-19 Prescribed book: Candid New Trends in Social Studies Syllabus to be completed in the month of April. Chapter 1.India Our
Child Budgeting. Child Budgeting
 Child Budgeting 7.1.1 Taking a cue from existing works and gender budgeting initiatives, for the very first time, the Department had undertaken to draw up a statement of funds provisioning in the Union
PART III. Heavy Rains
 PART III Heavy Rains Observational Analysis of Heavy Rainfall during Southwest Monsoon over India Pulak Guhathakurta India Meteorological Department, Pune 411005, India pguhathakurta@rediffmail.com 1.
ORIGINAL IN HINDI GOVERNMENT OF INDIA MINISTRY OF CONSUMER AFFAIRS, FOOD & PUBLIC DISTRIBUTION DEPARTMENT OF FOOD AND PUBLIC DISTRIBUTION
 ORIGINAL IN HINDI GOVERNMENT OF INDIA MINISTRY OF CONSUMER AFFAIRS, FOOD & PUBLIC DISTRIBUTION DEPARTMENT OF FOOD AND PUBLIC DISTRIBUTION LOK SABHA UNSTARRED QUESTION NO. 3503 TO BE ANSWERED ON 08 th AUGUST,
BOARD OF SECONDARY EDUCATION (AP) SUMMATIVE ASSESSMENT - I TENTH SOCIAL MODEL PAPER PAPER - I (ENGLISH VERSION) SECTION - I
 SUMMATIVE ASSESSMENT - I TENTH SOCIAL MODEL PAPER PAPER - I (ENGLISH VERSION) SECTION - I") BOARD OF SECONDARY EDUCATION (AP) SUMMATIVE ASSESSMENT - I TENTH SOCIAL MODEL PAPER PAPER - I (ENGLISH VERSION) Time: 2 hrs. 45 mins. PART - A& B Maximum Marks: 40 Time: 2 hrs. 15 mins. PART - A Marks:
BOARD OF SECONDARY EDUCATION (AP) SUMMATIVE ASSESSMENT - I TENTH SOCIAL MODEL PAPER PAPER - I (ENGLISH VERSION) Time: 2 hrs. 45 mins. PART - A& B Maximum Marks: 40 Time: 2 hrs. 15 mins. PART - A Marks:
INDIA SIZE AND LOCATION
 QUESTION BANK IN SOCIAL SCIENCE CLASS-IX (TERM-I) 1 INDIA SIZE AND LOCATION Location CONCEPTS India lies entirely in the Northern Hemisphere. India s mainland extends between 8 4'N and 37 8'N latitudes,
INDIAN SCHOOL MUSCAT SENIOR SECTION DEPARTMENT OF SOCIAL SCIENCE CLASS: IX : GEOGRAPHY TOPIC/CHAPTER: CHAPTER: 2 PHYSICAL FEATURES
 INDIAN SCHOOL MUSCAT SENIOR SECTION DEPARTMENT OF SOCIAL SCIENCE CLASS: IX : GEOGRAPHY TOPIC/CHAPTER: CHAPTER: 2 PHYSICAL FEATURES WORKSHEET NO. 06 Summary:- Tectonic Plate Theory:- This theory is based
Regional and seasonal variations in aerosol optical characteristics and their frequency distributions over India during
 JOURNAL OF GEOPHYSICAL RESEARCH, VOL. 113,, doi:10.1029/2007jd008560, 2008 Regional and seasonal variations in aerosol optical characteristics and their frequency distributions over India during 2001 2005
DROUGHT A WATER SCARCITY CASE STUDY BY STATISTICAL APPROACH
 DROUGHT A WATER SCARCITY CASE STUDY BY STATISTICAL APPROACH V.VENKATESAN Assistant Professor, Department of Civil Engineering, University College of Engineering, Ariyalur Abstract In spite of the technological
Frequency analysis of rainfall deviation in Dharmapuri district in Tamil Nadu
 Indian Journal of Geo Marine Sciences Vol.46 (8), August 217, pp. 171-1714 Frequency analysis of rainfall deviation in Dharmapuri district in Tamil Nadu V. Rajendran 1* & R. Venkatasubramani 2 1 Department
NCERT Class 9th Social Science Geography Chapter 2: Physical Features of India
 NCERT Class 9th Social Science Geography Chapter 2: Physical Features of India Question 1. Choose the right answer from the four alternatives given below. (i) A landmass bounded by sea on three sides in
Block level weather forecast using direct model output from NWP models during monsoon season in India
 MAUSAM, 68, 1 (January 2017), 23-40 551.509.313 Block level weather forecast using direct model output from NWP models during monsoon season in India ASHOK KUMAR, NABANSU CHATTOPADHAYAY*, Y. V. RAMARAO,
TABLE -I RAINFALL RECORDED AT PORT BLAIR (MM) FROM 1949 TO 2009
 FROM 1949 TO 2009") A. RAINFALL TABLE -I RAINFALL RECORDED AT PORT BLAIR (MM) FROM 1949 TO 2009 MONTH/YEAR 1949 1950 1951 1952 1953 1954 1955 1956 1957 1958 JANUARY 0.0 0.8 82.5 0.0 26.9 37.3 71.4 46.2 10.2 28.7 FEBRUARY
A. RAINFALL TABLE -I RAINFALL RECORDED AT PORT BLAIR (MM) FROM 1949 TO 2009 MONTH/YEAR 1949 1950 1951 1952 1953 1954 1955 1956 1957 1958 JANUARY 0.0 0.8 82.5 0.0 26.9 37.3 71.4 46.2 10.2 28.7 FEBRUARY
Economic Growth and Human Development: An Empirical Analysis of Major States of India During the Period to
 Economic Affairs: 59(1): 11-21 March, 2014 DOI Number 10.5958/J.0976-4666.59.1.002 Economic Growth and Human Development: An Empirical Analysis of Major States of India During the Period 1993-94 to 2004-05
Geography: Contemporary India - For Class IX Physical Features of India
 Geography: Contemporary India - For Class IX Physical Features of India (Q.1) Which are the two broad classification of peninsular plateau? (Q.2) What is a Doab? (Q.3) What is an Alluvial Plain. (Q.4)
Chapter-3 GEOGRAPHICAL LOCATION, CLIMATE AND SOIL CHARACTERISTICS OF THE STUDY SITE
 Chapter-3 GEOGRAPHICAL LOCATION, CLIMATE AND SOIL CHARACTERISTICS OF THE STUDY SITE Chapter-3 GEOGRAPHICAL LOCATION, CLIMATE AND SOIL CHARACTERISTICS OF THE STUDY SITE Assam, the eastern most state of
Districtwise Drought Climatology Of The Southwest Monsoon Season over India Based on Standardized Precipitation Index (SPI) D. S.
 D. S.") E N MARCH 2010 RR No. 2/2010 NCC RESEARCH REPORT Districtwise Drought Climatology Of The Southwest Monsoon Season over India Based on Standardized Precipitation Index (SPI) D. S. Pai Latha Sridhar Pulak
E N MARCH 2010 RR No. 2/2010 NCC RESEARCH REPORT Districtwise Drought Climatology Of The Southwest Monsoon Season over India Based on Standardized Precipitation Index (SPI) D. S. Pai Latha Sridhar Pulak
CHAPTER 9 SUMMARY AND CONCLUSIONS
 CHAPTER 9 SUMMARY AND CONCLUSIONS The following are the important conclusions and salient features of the present study. 1. The evaluation of groundwater potential is a prerequisite for any kind of planning
Occurrence of heavy rainfall around the confluence line in monsoon disturbances and its importance in causing floods
 Occurrence of heavy rainfall around the confluence line in monsoon disturbances and its importance in causing floods GNAGESWARA RAO Department of Meteorology & Oceanography, Andhra University, Visakhapatnam
Rainfall is the major source of water for
 RESEARCH PAPER: Assessment of occurrence and frequency of drought using rainfall data in Coimbatore, India M. MANIKANDAN AND D.TAMILMANI Asian Journal of Environmental Science December, 2011 Vol. 6 Issue
Course Scheme -UCE501: SOIL MECHANICS L T P Cr
 Course Scheme -UCE501: SOIL MECHANICS L T P Cr 3 1 2 4.5 Course Objective: To expose the students about the various index and engineering properties of soil. Introduction: Soil formation, various soil
Summary and Conclusions
 241 Chapter 10 Summary and Conclusions Kerala is situated in the southern tip of India between 8 15 N and 12 50 N latitude and 74 50 E and 77 30 E longitude. It is popularly known as Gods own country.
SUMMARY REPORT FOR COUNCIL OF MINISTERS ON IMPORTANT DEVELOPMENTS IN POWER SECTOR DURING THE MONTH OF OCTOBER, 2018
 SUMMARY REPORT FOR COUNCIL OF MINISTERS ON IMPORTANT DEVELOPMENTS IN POWER SECTOR DURING THE MONTH OF OCTOBER, 2018 1. CAPACITY ADDITION (Generation and Transmission) (i) Thermal capacity 600 MW has been
Probability models for weekly rainfall at Thrissur
 Journal of Tropical Agriculture 53 (1) : 56-6, 015 56 Probability models for weekly rainfall at Thrissur C. Laly John * and B. Ajithkumar *Department of Agricultural Statistics, College of Horticulture,
Elementary Education in India
 Analytical Tables 2015-16 Elementary Education in India Progress towards UEE i Arun C. Mehta Analytical Tables 2015-16 Elementary Education in India Progress towards UEE ii Arun C. Mehta The data presented
Section 2: Installed Capacity and Capacity Utilisation
 Section 2: Installed Capacity and Capacity Utilisation COKING COAL : Table 2.1: Installed Capacity of Coal Washeries in India as on 31.3.08 and 31.03.09 Sl. No. Washery & Operator State of Location Capacity
Rainfall Analysis in Sri Kalahasti Mandal, Chittoor District, Andhra Pradesh, South India Using Statistical Technique
 IOSR Journal of Engineering (IOSRJEN) ISSN (e): 2250-3021, ISSN (p): 2278-8719 Vol. 08, Issue 8 (August. 2018), V (I) 43-50 www.iosrjen.org Analysis in Sri Kalahasti Mandal, Chittoor District, Andhra Pradesh,
Summative Assessment I
 Class: IV Time: 3 Hrs. Summative Assessment I Social Science Marks: 88 Handwriting: 2 Total: 90 1. All questions are compulsory. 2. Use crayons for colouring. General Instruction I. Multiple choice questions:
Natural Vegetation and Wildlife
 Natural Vegetation and Wildlife Exercise Page 51 Question 1: Choose the right answer from the four alternatives given below. (i) To which one of the following types of vegetation does rubber belong? (a)
GOVERNMENT OF NEPAL MINISTRY OF IRRIGATION GROUND WATER RESOURCES DEVELOPMENT BOARD BABARMAHAL, KATHMANDU, NEPAL
 GOVERNMENT OF NEPAL MINISTRY OF IRRIGATION GROUND WATER RESOURCES DEVELOPMENT BOARD BABARMAHAL, KATHMANDU, NEPAL GIS Based Updating of Groundwater Level Siraha District Final Report Submitted to Ground
Chapter 8 [Our World Continents and Oceans]
![Chapter 8 [Our World Continents and Oceans]](/thumbs/89/101173350.jpg "Chapter 8 [Our World Continents and Oceans]") 1 (iv) so. std. Multiple Choice Questions (MCQs) (for 2 nd Term) CLASS: IV SUBJECT: SOCIAL STUDIES Chapter 8 [Our World Continents and Oceans] 1. Earth is known as the planet. (a) red (b) blue (c) white
1 (iv) so. std. Multiple Choice Questions (MCQs) (for 2 nd Term) CLASS: IV SUBJECT: SOCIAL STUDIES Chapter 8 [Our World Continents and Oceans] 1. Earth is known as the planet. (a) red (b) blue (c) white
Prediction of western disturbances and associated weather over Western Himalayas
 Prediction of western disturbances and associated weather over Western Himalayas H. R. Hatwar*, B. P. Yadav and Y. V. Rama Rao India Meteorological Department, Lodi Road, New Delhi 110 003, India Two cases
SMART NOTES ON INDIAN GEOGRAPHY - 1
 ON INDIAN GEOGRAPHY - 1 Point. Precise. Powerful. www.thesmartnotes.org ON INDIAN GEOGRAPHY - 1 To our Hardworking and persistence aspirants. Success is going from failure to failure without losing enthusiasm.
Rainfall variation and frequency analysis study in Dharmapuri district, India
 Indian Journal of Geo Marine Sciences Vol. 45 (11), November 216, pp. 156-1565 Rainfall variation and frequency analysis study in Dharmapuri district, India V. Rajendran 1*, R. Venkatasubramani 2 & G.
Investigation of Rainfall Trend in Jorhat Town, Assam, India
 EUROPEAN ACADEMIC RESEARCH Vol. II, Issue 7/ October 2014 ISSN 2286-4822 www.euacademic.org Impact Factor: 3.1 (UIF) DRJI Value: 5.9 (B+) Investigation of Rainfall Trend in Jorhat Town, MAYURAKSHI BHUYAN
Recent Applications of RESOURCESAT-2. Presentation by Indian Delegation at the 49 th Session of STSC-UNCOPUOS Vienna - February 2012
 Recent Applications of RESOURCESAT-2 Presentation by Indian Delegation at the 49 th Session of STSC-UNCOPUOS Vienna - February 2012 Outline Space Programme in India Earth Observation Assets of India RESOURCESAT-2:
SMART NOTES ON INDIAN GEOGRAPHY - 3
 ON INDIAN GEOGRAPHY - 3 Point. Precise. Powerful. www.thesmartnotes.org ON INDIAN GEOGRAPHY - 3 To our Hardworking and persistence aspirants. Success is going from failure to failure without losing enthusiasm.
11/22/2010. Groundwater in Unconsolidated Deposits. Alluvial (fluvial) deposits. - consist of gravel, sand, silt and clay
 deposits. - consist of gravel, sand, silt and clay") Groundwater in Unconsolidated Deposits Alluvial (fluvial) deposits - consist of gravel, sand, silt and clay - laid down by physical processes in rivers and flood plains - major sources for water supplies
Groundwater in Unconsolidated Deposits Alluvial (fluvial) deposits - consist of gravel, sand, silt and clay - laid down by physical processes in rivers and flood plains - major sources for water supplies
Release Notes. StreetPro India
 StreetPro India 015.06 Release Notes This document contains information about 015.06 Release. Complete documentation is located at our support site. Contents: Summary Benefits Features Products Vintage
Performance of all-india southwest monsoon seasonal rainfall when monthly rainfall reported as deficit/excess
 METEOROLOGICAL APPLICATIONS Meteorol. Appl. 21: 619 634 (14) Published online 12 March 13 in Wiley Online Library (wileyonlinelibrary.com) DOI:.2/met.138 Performance of all-india southwest monsoon seasonal
Laterite. Quartzite Rs./t 315 Silica Sand Rs./t 127 Sand (others) Rs./t 43. Shale Rs./t 21 Steatite
 Rs./t 43. Shale Rs./t 21 Steatite") 1 India 143 Abrasive 344 Refractory 315 (U) 272 Up to 40% Cr2O3 2345 40-52% Cr2O3 2630 Above 52% Cr2O3 Up to 40% Cr2O3 1258 40-52% Cr2O3 1433 Above 52% Cr2O3 4945 Concetrates (U) 7477 Below 60% Fe 529
1 India 143 Abrasive 344 Refractory 315 (U) 272 Up to 40% Cr2O3 2345 40-52% Cr2O3 2630 Above 52% Cr2O3 Up to 40% Cr2O3 1258 40-52% Cr2O3 1433 Above 52% Cr2O3 4945 Concetrates (U) 7477 Below 60% Fe 529
KUALA LUMPUR MONSOON ACTIVITY CENT
 T KUALA LUMPUR MONSOON ACTIVITY CENT 2 ALAYSIAN METEOROLOGICAL http://www.met.gov.my DEPARTMENT MINISTRY OF SCIENCE. TECHNOLOGY AND INNOVATIO Introduction Atmospheric and oceanic conditions over the tropical
INTEGRATION OF THEMATIC MAPS FOR IDENTIFICATION OF GROUND WATER EXPLORATION ZONES IN THE PARTS OF BHIND, MADHYA PRADESH (INDIA)
") Journal of Environmental Research And Development Vol. 2 No. 4, April-June, 2008 INTEGRATION OF THEMATIC MAPS FOR IDENTIFICATION OF GROUND WATER EXPLORATION ZONES IN THE PARTS OF BHIND, MADHYA PRADESH
Journal of Environmental Research And Development Vol. 2 No. 4, April-June, 2008 INTEGRATION OF THEMATIC MAPS FOR IDENTIFICATION OF GROUND WATER EXPLORATION ZONES IN THE PARTS OF BHIND, MADHYA PRADESH
Impact of the Danube River on the groundwater dynamics in the Kozloduy Lowland
 GEOLOGICA BALCANICA, 46 (2), Sofia, Nov. 2017, pp. 33 39. Impact of the Danube River on the groundwater dynamics in the Kozloduy Lowland Peter Gerginov Geological Institute, Bulgarian Academy of Sciences,
Assessment of Ground Water in a Part of Coastal West Bengal using Geo-Electrical Method
 Vol. 13, No. 2, pp. 203-210 (2013) Journal of Agricultural Physics ISSN 0973-032X http://www.agrophysics.in Research Article Assessment of Ground Water in a Part of Coastal West Bengal using Geo-Electrical
January 25, Summary
 January 25, 2013 Summary Precipitation since the December 17, 2012, Drought Update has been slightly below average in parts of central and northern Illinois and above average in southern Illinois. Soil
Chapter- Three GEOMORPHOLOGY AND RAINFALL PATTERN
 Chapter- Three GEOMORPHOLOGY AND RAINFALL PATTERN 3.1 INTRODUCTION Geomorphology and its slope as a basic and applied science in general and as tool for searching groundwater resources in efficient geomorphological
Abstract. Introduction. International Journal of Remote Sensing & Geoscience (IJRSG)
") ANALYSIS ON SPATIAL VARIATION OF RAINFALL AND GROUNDWATER FLUCTUATION IN KODAYAR SUB BASIN,TAMILNADU, INDIA Danee Joycee C.S Research Scholar Faculty of Building and Environment, Sathyabama University,
ANALYSIS ON SPATIAL VARIATION OF RAINFALL AND GROUNDWATER FLUCTUATION IN KODAYAR SUB BASIN,TAMILNADU, INDIA Danee Joycee C.S Research Scholar Faculty of Building and Environment, Sathyabama University,
Spatial and Temporal Analysis of Rainfall Variation in Yadalavagu Hydrogeological unit using GIS, Prakasam District, Andhra Pradesh, India
 International Research Journal of Environment Sciences ISSN 2319 1414 Spatial and Temporal Analysis of Rainfall Variation in Yadalavagu Hydrogeological unit using GIS, Prakasam District, Andhra Pradesh,
Impact of climate change on extreme rainfall events and flood risk in India
 Impact of climate change on extreme rainfall events and flood risk in India P Guhathakurta, O P Sreejith and PAMenon India Meteorological Department, Shivajinagar, Pune 411 005, India. e-mail: pguhathakurta@rediffmail.com