The phenomenon of El Niño Consequences of El Niño Climate records through isotope proxies
|
|
|
- Abigail Chapman
- 5 years ago
- Views:
Transcription

1 The phenomenon of El Niño Consequences of El Niño Climate records through isotope proxies

2 El Niño Southern scillation ENS ENS is known to be a natural oscillation of the ocean-atmosphere system with El Niño as the ocean component of the interaction between the upper layers of the tropical Southern Pacific and the atmosphere. ENS appears as enhanced sea surface temperature in the Easter Pacific near the Peruvian coast. The water temperature is usually dominated by the cold water flow of the umboldt current. The ENS effect enhances temperatures and reduces biological productivity. The effect is observed around Christmas about every seven years and was therefore dubbed El Niño (the son) by the local fishermen. Normal conditions ENS conditions The Southwestern Pacific hot ocean water region is typically contained by trade winds blowing from the east. These winds change directions every 7 years expanding the warm water zone eastwards. L corresponds to low atmospheric pressure, to high atmospheric pressure.


3 Normally low pressure region over Australia and Indonesia delivering rainfall, in El Nino years, there is high pressure over these regions and the low pressure area moves east and rainfall occurs over the Pacific cean. The Southern scillation Index SI is defined in terms of the Mean Sea Level Pressure P between Tahiti and Darwin, Australia. SI indicates El Nino episodes: SI 10 ENS : Non ENS : P P P P Tahiti P P Darwin Darwin Darwin P Tahiti P P month Tahiti Tahiti P Darwin Tahiti month Darwin SI negative SI positive mean Computed at a monthly basis SI ranging from -3 to +3

4 There is a directly observable correlation between the SI and the water surface temperature SST of the coast of South America! La Niña is the name chosen for a situation where strong trade winds confine the hot water condition to the southwestern region of the Pacific.

 and wind")
5 1. The trigger of the El Niño event are recurrent spontaneous statistical fluctuations sea surface temperature reflecting different oscillation modes in the coupled ocean SST system.. This SST fluctuation causes a spontaneous reduction of the the east west pressure gradient in the atmosphere. 3. Changed atmospheric pressure gradient reduces wind (collapse of trade winds as already observed by Darwin on his journey on the Beagle) and wind driven drag of water westwards 4. Reduced drag allows warm water to expand eastwards preventing cold water up-welling from umboldt current.


6 The ENS occurrence has global consequences, it changes rain fall patterns in Africa and North America and causes droughts in Australia. The ENS event is recorded by tree ring, ice core, and coral reef analysis for millennia. ENS driven draught in Australia ENS driven rainstorm in Southern California
7 El Niño


8 US Tornado Season There are statistics based arguments that the number of Tornados in the US tornado alley is correlated with El Niño and La Niña conditions in the Southern Pacific cean.

9 Climate Records from isotope and/or molecule distributions
 has a number of stable and beta-unstable")

10 The isotope chart Each element with atomic number Z (number of protons) has a number of stable and beta-unstable isotopes which are distinguished by a different number of neutrons N Isobar A=constant Isotone N=constant Isotope Z=constant
=1.66 10-4 g g M M M g g amu M g g amu M 4 3 4 3 4")
 ( 1.")

11 U B Mass differences Atomic Mass Unit: 1 amu=1/1(m 1 C)= g g M M M g g amu M g g amu M ) ( ) ( ) ( ) ( separator separator kin centrifugal Lorenz m m r r B U C q m C B m U q B q v m r m U q v B q v m r U q v m E F r v m m F B v

12 Variation and fractionation of isotopic abundances The chemical behavior of the isotopes of a certain element are identical because the chemical interactions are controlled by Z, the number and configurations of the electron in the atomic shell. owever, small differences due to physical conditions can lead to a deviation from the characteristic isotopic abundance ratio by fractionation processes. These variations are extremely slight, typically in the range of 0.01 to 0.1 and require sensitive equipment to be detected. The fractionation is expressed in terms of. sample isotope ratio standard isotope ratio δ 1000 standard isotope ratio 13 C C C sm 13 1 C C 13 1 st C C st The isotope ratios are expressed with the heavier component in the numerator; is a relative deviation from the standard ratio in units parts/mil or!
13 xygen has three stable isotopes,, 17, with the average abundances of %, 0.039%, and 0.05%, respectively. The / abundance ratio in a Jurassic limestone is the ratio in ocean water is The fractionation can be determined with respect to the average abundance ratio ( ) or to a standard. If taking the ocean water as standard (standard mean ocean water, SMW), the fractionation in Jurassic lime stone is: SMW sm st st The positive number indicates that the sample has a higher heavy isotope abundance as the standard. If the sample has a lower heavy isotope abundance the fractionation value will be negative. cean water in Maxwell Bay, Antarctica has: 3.1 SMW 0 00 MB SMW 1000 SMW SMW


14 oxygen isotope distribution Isoscapes An extensive data bank on the isotope distribution has been developed worldwide. It is useful for a wide range of applications, ranging from hydrology to forensics, from plant ecology to meteorite analysis, and from geology to climate studies.
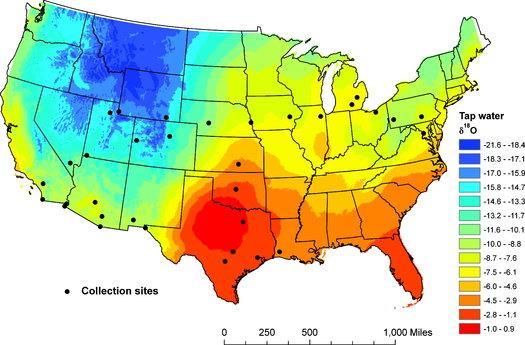
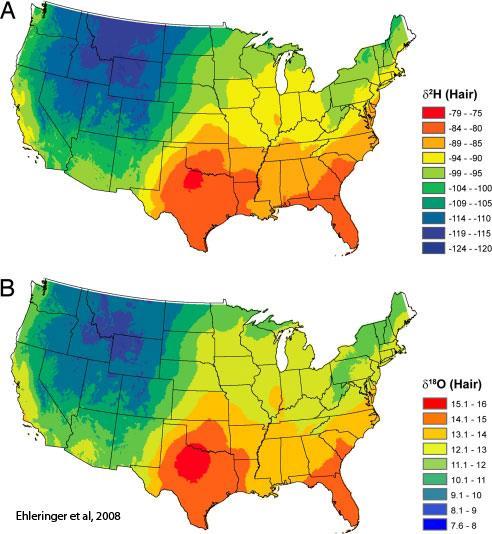
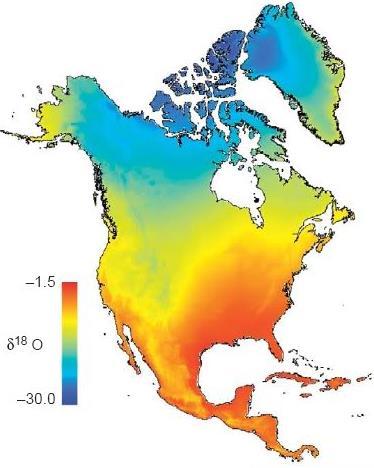
15 precipitation isoscapes

16 Fractionation processes There are a number of chemistry specific fractionation processes for the various elements. For oxygen, the chemical processes are mostly associated with geological fractionation observed for rocks, lime stones and carbonates. For plant, water, and ice related oxygen isotope analysis, the dominant fractionation processes are mostly associated with evaporation and precipitation processes. Therefore the oxygen fractionation is frequently correlated with hydrogen fractionation of the two table hydrogen isotopes, hydrogen 1 and deuterium.

17 Chemical or physics processes for two different isotopes show subtle differences in the specific reaction rate k for the lighter isotopes k L and the heavier isotopes k. The ratio of these rates defines the fractionation factor. k k L Chemical or physical processes with light isotopes are typically faster than the ones involving heavier isotopes: k <k L, <1. This results in a fractionation of isotopes in the chemical process with an enrichment factor = - 1. For evaporation: product 1000 product source source k is 1.% slower vapor k k sea water than k
18 Fractionation in equilibrium At isotopic equilibrium between two phases (e.g. liquid vapor), the forward and backward reaction rates of any particular isotope are equal. The isotopic compositions of two phases at equilibrium are not identical, but the ratios of the different isotopes in each phase are constant for a particular temperature. As water vapor condenses in rain clouds (equilibrium process), the heavier water isotopes ( and ) become enriched in the liquid phase, while the lighter isotopes ( and 1 ) remain in the vapor phase. Vapor Liquid LiquidVapor Vapor Liquid 1 Vapor Liquid LiquidVapor Liquid Vapor and If the fractionation factor for evaporation is: similarly Vapor Liquid condensati on The fractionation factor for condensation is: evaporation Vapor Liquid
19 All of the fractionation processes are temperature dependent! Evaporation driven fractionation is determined by the Clausius Clapeyron equation (lecture 7-), stating that the saturated vapor pressure SVP=P increases exponentially with T. k P d ln P dt ln P ln e L L RT ln P dp P dt L RT C L R T P P ln P Typically modeled by functions like: C C3 C1 ln 1 T C e T T for T in Kelvin : C 0.03 C C L RT L 1. The difference in evaporation process is due to differences in the latent heat (binding energy associated with the phase transition) for the water molecules with different oxygen (hydrogen) isotopes. Fractionation factor for condensation 1.1 T α ( ) α ( ) 0 C C C C
 1000 0.44 0 00 Fractionation in condensation and precipitation processes are highly temperature dependent!")
20 Precipitation Starting from the cloud fractionation value =-1 derived in previous example! rain cloud for at T 5 o C rain (1 1000) for at T 0 o C rain (1 1000) Fractionation in condensation and precipitation processes are highly temperature dependent! This identifies these processes as possible tools for temperature measurements: = f(t)!
MPACT OF EL-NINO ON SUMMER MONSOON RAINFALL OF PAKISTAN
 MPACT OF EL-NINO ON SUMMER MONSOON RAINFALL OF PAKISTAN Abdul Rashid 1 Abstract: El-Nino is the dominant mod of inter- annual climate variability on a planetary scale. Its impact is associated worldwide
Name: Date: Hour: Comparing the Effects of El Nino & La Nina on the Midwest (E4.2c)
") Purpose: Comparing the Effects of El Nino & La Nina on the Midwest (E4.2c) To compare the effects of El Nino and La Nina on the Midwest United States. Background Knowledge: The El Nino-Southern Oscillation
Purpose: Comparing the Effects of El Nino & La Nina on the Midwest (E4.2c) To compare the effects of El Nino and La Nina on the Midwest United States. Background Knowledge: The El Nino-Southern Oscillation
lecture 10 El Niño and the Southern Oscillation (ENSO) Part I sea surface height anomalies as measured by satellite altimetry
 Part I sea surface height anomalies as measured by satellite altimetry") lecture 10 El Niño and the Southern Oscillation (ENSO) Part I sea surface height anomalies as measured by satellite altimetry SPATIAL STRUCTURE OF ENSO In 1899, the Indian monsoon failed, leading to drought
lecture 10 El Niño and the Southern Oscillation (ENSO) Part I sea surface height anomalies as measured by satellite altimetry SPATIAL STRUCTURE OF ENSO In 1899, the Indian monsoon failed, leading to drought
Name the surface winds that blow between 0 and 30. GEO 101, February 25, 2014 Monsoon Global circulation aloft El Niño Atmospheric water
 GEO 101, February 25, 2014 Monsoon Global circulation aloft El Niño Atmospheric water Name the surface winds that blow between 0 and 30 What is the atmospheric pressure at 0? What is the atmospheric pressure
Website Lecture 3 The Physical Environment Part 1
 Website http://websites.rcc.edu/halama Lecture 3 The Physical Environment Part 1 1 Lectures 3 & 4 1. Biogeochemical Cycling 2. Solar Radiation 3. The Atmosphere 4. The Global Ocean 5. Weather and Climate
Answer each section in a separate booklet.
 DURATION: 3 HOURS TOTAL MARKS: 150 Internal Examiners: Dr S Pillay & Mr J Lutchmiah External Examiner: Dr J Odindi NOTE: This paper consists of 8 pages and an MCQ answer sheet. Please ensure that you have
8. Climate changes Short-term regional variations
 8. Climate changes 8.1. Short-term regional variations By short-term climate changes, we refer here to changes occurring over years to decades. Over this timescale, climate is influenced by interactions
Name Date Class. growth rings of trees, fossilized pollen, and ocean. in the northern hemisphere.
 Lesson Outline LESSON 2 A. Long-Term Cycles 1. A(n) climate cycle takes much longer than a lifetime to complete. a. To learn about long-term climate cycles, scientists study natural records, such as growth
The Climate System and Climate Models. Gerald A. Meehl National Center for Atmospheric Research Boulder, Colorado
 The Climate System and Climate Models Gerald A. Meehl National Center for Atmospheric Research Boulder, Colorado The climate system includes all components of the physical earth system that affect weather
El Niño: How it works, how we observe it. William Kessler and the TAO group NOAA / Pacific Marine Environmental Laboratory
 El Niño: How it works, how we observe it William Kessler and the TAO group NOAA / Pacific Marine Environmental Laboratory The normal situation in the tropical Pacific: a coupled ocean-atmosphere system
Fluid Circulation Review. Vocabulary. - Dark colored surfaces absorb more energy.
 Fluid Circulation Review Vocabulary Absorption - taking in energy as in radiation. For example, the ground will absorb the sun s radiation faster than the ocean water. Air pressure Albedo - Dark colored
Week: Dates: 3/2 3/20 Unit: Climate
 clementaged.weebly.com Name: EVEN Period: Week: 28 30 Dates: 3/2 3/20 Unit: Climate Monday Tuesday Wednesday Thursday Friday 2 O 3 E *Vocabulary *Water in the Atmosphere and Clouds Notes *Cloud Drawings
Climate Changes due to Natural Processes
 Climate Changes due to Natural Processes 2.6.2a Summarize natural processes that can and have affected global climate (particularly El Niño/La Niña, volcanic eruptions, sunspots, shifts in Earth's orbit,
Stable Isotopes OUTLINE
 Stable Isotopes OUTLINE Reading: White Ch 9.1 to 9.7.1 (or digital p370-400) Exercise answer? What does the salt do? Today 1. 2 leftovers 2. Stable Isotopes for hydrologic and climate applications 1 CaCO
Geol. 656 Isotope Geochemistry
 STABLE ISOTOPE THEORY: KINETIC FRACTIONATION AND THE HYDROLOGIC SYSTEM KINETIC FRACTIONATION Kinetic effects are normally associated with fast, incomplete, or unidirectional processes like evaporation,
Climate and the Atmosphere
 Climate and Biomes Climate Objectives: Understand how weather is affected by: 1. Variations in the amount of incoming solar radiation 2. The earth s annual path around the sun 3. The earth s daily rotation
Guided Notes: Atmosphere Layers of the Atmosphere
 Guided Notes: Atmosphere Layers of the Atmosphere Atmosphere: Absorbs solar radiation, Burns up meteors, transports and recycles water, and other chemicals, and moderates climate Main Components: o Meteorology
Climate 1: The Climate System
 Climate 1: The Climate System Prof. Franco Prodi Institute of Atmospheric Sciences and Climate National Research Council Via P. Gobetti, 101 40129 BOLOGNA SIF, School of Energy, Varenna, July 2014 CLIMATE
Global Weather Trade Winds etc.notebook February 17, 2017
 Global Weather 1 north pole northern hemisphere equator southern hemisphere south pole 2 We have seasons because of the Earth's tilt The seasons are opposite in the northern and southern hemispheres winter
Name Date Class. well as the inland, found near the Tropics. 4. In the, or the regions near the Equator, you may find a lush
 WATER, CLIMATE, AND VEGETATION Vocabulary Activity DIRECTIONS: Fill in the Blanks Select a term from below to complete each of the following sentences. CHAPTER 1. The constant movement of water, a process
Our climate system is based on the location of hot and cold air mass regions and the atmospheric circulation created by trade winds and westerlies.
 CLIMATE REGIONS Have you ever wondered why one area of the world is a desert, another a grassland, and another a rainforest? Or have you wondered why are there different types of forests and deserts with
Analysis of Fall Transition Season (Sept-Early Dec) Why has the weather been so violent?
 Why has the weather been so violent?") WEATHER TOPICS Analysis of Fall Transition Season (Sept-Early Dec) 2009 Why has the weather been so violent? As can be seen by the following forecast map, the Fall Transition and early Winter Season of
WEATHER TOPICS Analysis of Fall Transition Season (Sept-Early Dec) 2009 Why has the weather been so violent? As can be seen by the following forecast map, the Fall Transition and early Winter Season of
b. The boundary between two different air masses is called a.
 NAME Earth Science Weather WebQuest Part 1. Air Masses 1. Find out what an air mass is. http://okfirst.mesonet.org/train/meteorology/airmasses.html a. What is an air mass? An air mass is b. The boundary
Weather & Ocean Currents
 Weather & Ocean Currents Earth is heated unevenly Causes: Earth is round Earth is tilted on an axis Earth s orbit is eliptical Effects: Convection = vertical circular currents caused by temperature differences
Ocean in Motion 7: El Nino and Hurricanes!
 Ocean in Motion 7: El Nino and Hurricanes! A. Overview 1. Ocean in Motion -- El Nino and hurricanes We will look at the ocean-atmosphere interactions that cause El Nino and hurricanes. Using vocabulary
UPDATE OF REGIONAL WEATHER AND SMOKE HAZE (September 2017)
") UPDATE OF REGIONAL WEATHER AND SMOKE HAZE (September 2017) 1. Review of Regional Weather Conditions in August 2017 1.1 Southwest Monsoon conditions continued to prevail in the region in August 2017. The
UPDATE OF REGIONAL WEATHER AND SMOKE HAZE (September 2017) 1. Review of Regional Weather Conditions in August 2017 1.1 Southwest Monsoon conditions continued to prevail in the region in August 2017. The
Untitled.notebook May 12, Thunderstorms. Moisture is needed to form clouds and precipitation the lifting of air, or uplift, must be very strong
 Thunderstorms Moisture is needed to form clouds and precipitation the lifting of air, or uplift, must be very strong cold air and warm air must mix; creating an active circulation system that has both
Weather Systems Study Guide:
 Weather Systems Study Guide: 1. Draw a diagram of Earth s water cycle and label each part. 2. Explain how the water cycle works. 3. What happens in the troposphere and stratosphere? Atmosphere Level What
ATMOSPHERIC MODELLING. GEOG/ENST 3331 Lecture 9 Ahrens: Chapter 13; A&B: Chapters 12 and 13
 ATMOSPHERIC MODELLING GEOG/ENST 3331 Lecture 9 Ahrens: Chapter 13; A&B: Chapters 12 and 13 Agenda for February 3 Assignment 3: Due on Friday Lecture Outline Numerical modelling Long-range forecasts Oscillations
Paleoclimate indicators
 Paleoclimate indicators Rock types as indicators of climate Accumulation of significant thicknesses of limestone and reef-bearing limestone is restricted to ~20º + - equator Gowganda tillite, Ontario
Energy Systems, Structures and Processes Essential Standard: Analyze patterns of global climate change over time Learning Objective: Differentiate
 Energy Systems, Structures and Processes Essential Standard: Analyze patterns of global climate change over time Learning Objective: Differentiate between weather and climate Global Climate Focus Question
Introduction to Meteorology & Climate. Climate & Earth System Science. Atmosphere Ocean Interactions. A: Structure of the Ocean.
 Climate & Earth System Science Introduction to Meteorology & Climate MAPH 10050 Peter Lynch Peter Lynch Meteorology & Climate Centre School of Mathematical Sciences University College Dublin Meteorology
Possible Applications of Deep Neural Networks in Climate and Weather. David M. Hall Assistant Research Professor Dept. Computer Science, CU Boulder
 Possible Applications of Deep Neural Networks in Climate and Weather David M. Hall Assistant Research Professor Dept. Computer Science, CU Boulder Quick overview of climate and weather models Weather models
Climate vs. Weather. Weather: Short term state of the atmosphere. Climate: The average weather conditions in an area over a long period of time
 Weather and Climate Climate vs. Weather Weather: Short term state of the atmosphere. Temperature, humidity, cloud cover, precipitation, winds, visibility, air pressure, air pollution, etc Climate: The
p = ρrt p = ρr d = T( q v ) dp dz = ρg
 dp dz = ρg") Chapter 1: Properties of the Atmosphere What are the major chemical components of the atmosphere? Atmospheric Layers and their major characteristics: Troposphere, Stratosphere Mesosphere, Thermosphere
Chapter 1: Properties of the Atmosphere What are the major chemical components of the atmosphere? Atmospheric Layers and their major characteristics: Troposphere, Stratosphere Mesosphere, Thermosphere
Name: Climate Date: EI Niño Conditions
 Name: Date: Base your answers to questions 1 and 2 on the maps and the passage below. The maps show differences in trade wind strength, ocean current direction, and water temperature associated with air-pressure
1 What Is Climate? TAKE A LOOK 2. Explain Why do areas near the equator tend to have high temperatures?
 CHAPTER 17 1 What Is Climate? SECTION Climate BEFORE YOU READ After you read this section, you should be able to answer these questions: What is climate? What factors affect climate? How do climates differ
What a Hurricane Needs to Develop
 Massive Storms! Hurricanes What a Hurricane Needs to Develop Warm tropical water - at least 80 F High Humidity Light wind Low Pressure Area Form between 5 and 20 latitude Hurricane Ingredients Hurricane
Environmental Isotopes in Hydrology. Woocay substituting for Walton
 Environmental Isotopes in Hydrology Oct 7, 2010 1 What is an Isotope? An element is defined by the number of protons (Z) in the nucleus The number of neutrons (N) defines the isotope(s) of that element
Issue Overview: El Nino and La Nina
 Issue Overview: El Nino and La Nina By Bloomberg, adapted by Newsela staff on 09.28.16 Word Count 748 TOP: A Category 5 typhoon in the Pacific Ocean. BOTTOM: Graphics courtesy of the U.S. National Oceanic
Climate Classification Chapter 7
 Climate Classification Chapter 7 Climate Systems Earth is extremely diverse No two places exactly the same Similarities between places allow grouping into regions Climates influence ecosystems Why do we
Water in the Atmosphere The Role of Water in Earth s Surface Processes. Hurricane Warning
 Hurricane Warning 1 Earth, the lue Planet. What makes Earth blue? It has to do with all of the water on Earth. There is water in more places than the vast oceans. Water is also in the atmosphere. High
Weather Vs. Climate. Weather Vs. Climate. Chapter 14
 Weather Vs. Climate Chapter 14 Weather: Conditions of the atmosphere at a particular time and place, for short periods of time (days). Climate: Long-term averages of weather (Averaged over 30 yrs). Weather
Stable Isotope Tracers
 Stable Isotope Tracers OCN 623 Chemical Oceanography 5 March 2015 Reading: Emerson and Hedges, Chapter 5, p.134-153 (c) 2015 David Ho and Frank Sansone Outline Stable Isotopes - Introduction & Notation
Bell Work. REVIEW: Our Planet Earth Page 29 Document A & B Questions
 9.12.16 Bell Work REVIEW: Our Planet Earth Page 29 Document A & B Questions Intro to Climate & Weather https://www.youtube.com/watch?v=vhgyoa70q7y Weather vs. Climate Video Climate & Weather 3.1 Weather
Systems? Climate Systems. Earth Systems. Earth Interior Systems. Atmospheric/Biospheric Systems: Human Impact Hydrologic Cycle.
 Chapter 15 Climate Systems Systems? What is a system? Geologic phenomena are complex. All processes are related to, and interact with, other processes. So it is useful to think of geologic processes as
Wind: Global Systems Chapter 10
 Wind: Global Systems Chapter 10 General Circulation of the Atmosphere General circulation of the atmosphere describes average wind patterns and is useful for understanding climate Over the earth, incoming
General Circulation. Nili Harnik DEES, Lamont-Doherty Earth Observatory
 General Circulation Nili Harnik DEES, Lamont-Doherty Earth Observatory nili@ldeo.columbia.edu Latitudinal Radiation Imbalance The annual mean, averaged around latitude circles, of the balance between the
Winds and Global Circulation
 Winds and Global Circulation Atmospheric Pressure Winds Global Wind and Pressure Patterns Oceans and Ocean Currents El Nino How is Energy Transported to its escape zones? Both atmospheric and ocean transport
Warm Up Vocabulary Check
 Warm Up Vocabulary Check Surface current Coriolis Effect global winds upwelling Gulf Stream deep current climate El Nino convection current continental deflection 1.The apparent curving of the path of
Global Warming is a Fact of Life
 RECENT HISTORICAL TEMPERATURE AND TRADE-WIND INVERSION VARIATIONS IN HAWAI I Global Warming is a Fact of Life Tom Giambelluca Geography UH Manoa 1976-2005: 0.177 o C per decade 1906-2005: 0.074 o C per
Current and future climate of the Cook Islands. Pacific-Australia Climate Change Science and Adaptation Planning Program
 Pacific-Australia Climate Change Science and Adaptation Planning Program Penrhyn Pukapuka Nassau Suwarrow Rakahanga Manihiki N o r t h e r n C o o k I s l a nds S o u t h e Palmerston r n C o o k I s l
Pleistocene Glaciation (Ch.14) Geologic evidence Milankovitch cycles Glacial climate feedbacks
 Geologic evidence Milankovitch cycles Glacial climate feedbacks") Pleistocene Glaciation (Ch.14) Geologic evidence Milankovitch cycles Glacial climate feedbacks End of last ice-age rise of human civilization Modern ice-ages begin Asteroid impact end of dinosaurs Cambrian
Pleistocene Glaciation (Ch.14) Geologic evidence Milankovitch cycles Glacial climate feedbacks End of last ice-age rise of human civilization Modern ice-ages begin Asteroid impact end of dinosaurs Cambrian
How strong does wind have to be to topple a garbage can?
 How strong does wind have to be to topple a garbage can? Imagine winds powerful enough to pick up a truck and toss it the length of a football field. Winds of this extreme sometimes happen in a tornado.
Chapter outline. Reference 12/13/2016
 Chapter 2. observation CC EST 5103 Climate Change Science Rezaul Karim Environmental Science & Technology Jessore University of science & Technology Chapter outline Temperature in the instrumental record
Lecture 28: Observed Climate Variability and Change
 Lecture 28: Observed Climate Variability and Change 1. Introduction This chapter focuses on 6 questions - Has the climate warmed? Has the climate become wetter? Are the atmosphere/ocean circulations changing?
What a Hurricane Needs to Develop
 Weather Weather is the current atmospheric conditions, such as air temperature, wind speed, wind direction, cloud cover, precipitation, relative humidity, air pressure, etc. 8.10B: global patterns of atmospheric
1 What Is Climate? TAKE A LOOK 2. Explain Why do areas near the equator tend to have high temperatures?
 CHAPTER 17 1 What Is Climate? SECTION Climate BEFORE YOU READ After you read this section, you should be able to answer these questions: What is climate? What factors affect climate? How do climates differ
Table of Contents. Chapter: Atmosphere. Section 1: Earth's Atmosphere. Section 2: Energy Transfer in the Atmosphere. Section 3: Air Movement
 Table of Contents Chapter: Atmosphere Section 1: Earth's Atmosphere Section 2: Energy Transfer in the Atmosphere Section 3: Air Movement Table of Contents Chapter 4: Atmosphere Section 1: Earth's Atmosphere
3. The map below shows an eastern portion of North America. Points A and B represent locations on the eastern shoreline.
 1. Most tornadoes in the Northern Hemisphere are best described as violently rotating columns of air surrounded by A) clockwise surface winds moving toward the columns B) clockwise surface winds moving
2. Fargo, North Dakota receives more snow than Charleston, South Carolina.
 2015 National Tournament Division B Meteorology Section 1: Weather versus Climate Chose the answer that best answers the question 1. The sky is partly cloudy this morning in Lincoln, Nebraska. 2. Fargo,
Environmental Science Chapter 13 Atmosphere and Climate Change Review
 Environmental Science Chapter 13 Atmosphere and Climate Change Review Multiple Choice Identify the choice that best completes the statement or answers the question. 1. Climate in a region is a. the long-term,
Ocean-Atmosphere Interactions and El Niño Lisa Goddard
 Ocean-Atmosphere Interactions and El Niño Lisa Goddard Advanced Training Institute on Climatic Variability and Food Security 2002 July 9, 2002 Coupled Behavior in tropical Pacific SST Winds Upper Ocean
6. What has been the most effective erosive agent in the climate system? a. Water b. Ice c. Wind
 Multiple Choice. 1. Heinrich Events a. Show increased abundance of warm-water species of planktic foraminifera b. Show greater intensity since the last deglaciation c. Show increased accumulation of ice-rafted
WHAT CAN MAPS TELL US ABOUT THE GEOGRAPHY OF ANCIENT GREECE? MAP TYPE 1: CLIMATE MAPS
 WHAT CAN MAPS TELL US ABOUT THE GEOGRAPHY OF ANCIENT GREECE? MAP TYPE 1: CLIMATE MAPS MAP TYPE 2: PHYSICAL AND/OR TOPOGRAPHICAL MAPS MAP TYPE 3: POLITICAL MAPS TYPE 4: RESOURCE & TRADE MAPS Descriptions
Stable Isotope Tracers OCN 623 Chemical Oceanography
 Stable Isotope Tracers OCN 623 Chemical Oceanography 21 March 2017 Reading: Emerson and Hedges, Chapter 5, p.134-153 2017 Frank Sansone and David Ho Student Learning Outcomes At the completion of this
Tropical Moist Rainforest
 Tropical or Lowlatitude Climates: Controlled by equatorial tropical air masses Tropical Moist Rainforest Rainfall is heavy in all months - more than 250 cm. (100 in.). Common temperatures of 27 C (80 F)
Weather: Air Patterns
 Weather: Air Patterns Weather: Air Patterns Weather results from global patterns in the atmosphere interacting with local conditions. You have probably experienced seasonal shifts, such as winter in New
Please be ready for today by:
 Please be ready for today by: 1. HW out for a stamp 2. Paper and pencil/pen for notes 3. Be ready to discuss what you know about El Nino after you view the video clip What is El Nino? El Nino Basics El
Temperature Over Time
 Temperature Over Time 1 Module Overview In this module, you will investigate whether Earth is warming. First, you will review the causes of seasonal and daily temperature changes at different latitudes
Mid-latitude Cyclones & Air Masses
 Lab 9 Mid-latitude Cyclones & Air Masses This lab will introduce students to the patterns of surface winds around the center of a midlatitude cyclone of low pressure. The types of weather associated with
Weather, Air Masses, Fronts and Global Wind Patterns. Meteorology
 Weather, Air Masses, Fronts and Global Wind Patterns Meteorology Weather is what conditions of the atmosphere are over a short period of time. Climate is how the atmosphere "behaves" over long periods
Climate Variability. Andy Hoell - Earth and Environmental Systems II 13 April 2011
 Climate Variability Andy Hoell - andrew_hoell@uml.edu Earth and Environmental Systems II 13 April 2011 The Earth System Earth is made of several components that individually change throughout time, interact
Climate.tgt, Version: 1 1
 Name: Key Concepts Choose the letter of the best answer. (5 points each) 1. 2. 3. 4. 5. 6. 7. 8. 9. 10. Date: A city located in the middle of North America experiences extreme temperature changes during
SIO15 Midterm 2, Wednesday Nov. 28, 2018
 SIO15 Midterm 2, Wednesday Nov. 28, 2018 TEST VARIATION: B 1) For what are flood frequency curves used? a) to predict the next rain storm b) to estimate the highest flood likely in a 100-year interval
East Penn School District Curriculum and Instruction
 East Penn School District Curriculum and Instruction Curriculum for: Meteorology Course(s): Meteorology Grades: 10-12 Department: Science Length of Period (average minutes): 42 Periods per cycle: 6 Length
Introduction HENRY F. DIAZ. NOAA/ERL, 325 Broadway, Boulder, Colorado 80303, U.S.A. VERA MARKGRAF
 1 Introduction HENRY F. DIAZ NOAA/ERL, 325 Broadway, Boulder, Colorado 80303, U.S.A. VERA MARKGRAF Institute of Arctic and A/pine Research, University of Colorado, Boulder, Colorado 80309, U.S.A. Significant
Chapter Introduction. Weather. Patterns. Forecasts Chapter Wrap-Up
 Chapter Introduction Lesson 1 Lesson 2 Lesson 3 Describing Weather Weather Patterns Weather Forecasts Chapter Wrap-Up How do scientists describe and predict weather? What do you think? Before you begin,
SIO15 Midterm 2, Friday Dec. 1, 2017 TEST VARIATION: 2
 SIO15 Midterm 2, Friday Dec. 1, 2017 TEST VARIATION: 2 1) Why does San Diego have flood control channels? a) many hurricanes make landfall and bring devastating floods b) strong winter storms can bring
Climate Outlook through 2100 South Florida Ecological Services Office Vero Beach, FL September 9, 2014
 Climate Outlook through 2100 South Florida Ecological Services Office Vero Beach, FL September 9, 2014 Short Term Drought Map: Short-term (
From Isotopes to Temperature: Using Ice Core Data!
 From Isotopes to Temperature: Using Ice Core Data! Spruce W. Schoenemann schoes@uw.edu UWHS Atmospheric Sciences 211 May 2013 Dept. of Earth and Space Sciences University of Washington Seattle http://www.uwpcc.washington.edu
Global Circulation. Local weather doesn t come from all directions equally Everyone s weather is part of the global circulation pattern
 Global Circulation Local weather doesn t come from all directions equally Everyone s weather is part of the global circulation pattern Wind rose shows % frequency of winds around the compass 1 Global Circulation
Clouds and turbulent moist convection
 Clouds and turbulent moist convection Lecture 2: Cloud formation and Physics Caroline Muller Les Houches summer school Lectures Outline : Cloud fundamentals - global distribution, types, visualization
Temperature Pressure Wind Moisture
 Chapter 1: Properties of Atmosphere Temperature Pressure Wind Moisture Thickness of the Atmosphere (from Meteorology Today) 90% 70% The thickness of the atmosphere is only about 2% of Earth s thickness
UPDATE OF REGIONAL WEATHER AND SMOKE HAZE (May 2017)
") UPDATE OF REGIONAL WEATHER AND SMOKE HAZE (May 2017) 1. Review of Regional Weather Conditions in April 2017 1.1 Inter monsoon conditions, characterised by afternoon showers and winds that are generally
UPDATE OF REGIONAL WEATHER AND SMOKE HAZE (May 2017) 1. Review of Regional Weather Conditions in April 2017 1.1 Inter monsoon conditions, characterised by afternoon showers and winds that are generally
ENSO: Recent Evolution, Current Status and Predictions. Update prepared by: Climate Prediction Center / NCEP 9 November 2015
 ENSO: Recent Evolution, Current Status and Predictions Update prepared by: Climate Prediction Center / NCEP 9 November 2015 Outline Summary Recent Evolution and Current Conditions Oceanic Niño Index (ONI)
Class Notes: Water and Climate. Ever since the outgassing of water vapor years ago, Earth has been recycling its water supply. Water Cycle -!
 Name: Date: Period: Water and Climate The Physical Setting: Earth Science I. The Water Cycle Ever since the outgassing of water vapor years ago, Earth has been recycling its water supply Earth has not
Massive Storms! 8.10C Identify the role of the oceans in the formation of weather systems such as hurricanes
 Massive Storms! 8.10C Identify the role of the oceans in the formation of weather systems such as hurricanes Instructional page: Each person in group will take on one portion or set of questions: Each
 Page 1 of 5 Home research global climate enso effects Research Effects of El Niño on world weather Precipitation Temperature Tropical Cyclones El Niño affects the weather in large parts of the world. The
lecture 11 El Niño/Southern Oscillation (ENSO) Part II
 Part II") lecture 11 El Niño/Southern Oscillation (ENSO) Part II SYSTEM MEMORY: OCEANIC WAVE PROPAGATION ASYMMETRY BETWEEN THE ATMOSPHERE AND OCEAN The atmosphere and ocean are not symmetrical in their responses
lecture 11 El Niño/Southern Oscillation (ENSO) Part II SYSTEM MEMORY: OCEANIC WAVE PROPAGATION ASYMMETRY BETWEEN THE ATMOSPHERE AND OCEAN The atmosphere and ocean are not symmetrical in their responses
Link between Hurricanes and Climate Change: SST
 Link between Hurricanes and Climate Change: SST FRIDAY: PROJECT 2 Proposals due! Bring laptops on weds (at least one per group)! Discuss assessment on Weds. Roger Francois will talk on Friday about the
KUALA LUMPUR MONSOON ACTIVITY CENT
 T KUALA LUMPUR MONSOON ACTIVITY CENT 2 ALAYSIAN METEOROLOGICAL http://www.met.gov.my DEPARTMENT MINISTRY OF SCIENCE. TECHNOLOGY AND INNOVATIO Introduction Atmospheric and oceanic conditions over the tropical
Global climate change
 Global climate change What is climate change? This winter was really cold! Temp difference ( C): Jan 2004 vs. Jan 2002-2003 Make your own maps at: http://www.giss.nasa.gov/data/update/gistemp/maps/ 1 What
An El Niño Primer René Gommes Andy Bakun Graham Farmer El Niño-Southern Oscillation defined
 An El Niño Primer by René Gommes, Senior Officer, Agrometeorology (FAO/SDRN) Andy Bakun, FAO Fisheries Department Graham Farmer, FAO Remote Sensing specialist El Niño-Southern Oscillation defined El Niño
ESS15 Lecture 13. End of the oceans (tropical / El Nino, thermohaline circulation) Weather vs. climate.
 Weather vs. climate.") ESS15 Lecture 13 End of the oceans (tropical / El Nino, thermohaline circulation) Weather vs. climate. Please give me feedback through the EEE midterm evaluation survey. I promise to adapt to it. Review
ESS15 Lecture 13 End of the oceans (tropical / El Nino, thermohaline circulation) Weather vs. climate. Please give me feedback through the EEE midterm evaluation survey. I promise to adapt to it. Review
Temp 54 Dew Point 41 Relative Humidity 63%
 Temp 54 Dew Point 41 Relative Humidity 63% Water in the Atmosphere Evaporation Water molecules change from the liquid to gas phase Molecules in liquids move slowly Heat energy makes them move faster When
Marine Ecoregions. Marine Ecoregions. Slide 1. Robert G. Bailey. USDA Forest Service Rocky Mountain Research Station
 Slide 1 Marine Ecoregions Robert G. Bailey Marine Ecoregions Robert G. Bailey USDA Forest Service Rocky Mountain Research Station rgbailey@fs.fed.us Draft of 7/20/2006 8:44 PM Abstract: Oceans occupy some
UPDATE OF REGIONAL WEATHER AND SMOKE HAZE (February 2018)
") UPDATE OF REGIONAL WEATHER AND SMOKE HAZE (February 2018) 1. Review of Regional Weather Conditions for January 2018 1.1 The prevailing Northeast monsoon conditions over Southeast Asia strengthened in January
UPDATE OF REGIONAL WEATHER AND SMOKE HAZE (February 2018) 1. Review of Regional Weather Conditions for January 2018 1.1 The prevailing Northeast monsoon conditions over Southeast Asia strengthened in January
Lecture 5: Atmospheric General Circulation and Climate
 Lecture 5: Atmospheric General Circulation and Climate Geostrophic balance Zonal-mean circulation Transients and eddies Meridional energy transport Moist static energy Angular momentum balance Atmosphere
School Name Team # International Academy East Meteorology Test Graphs, Pictures, and Diagrams Diagram #1
 School Name Team # International Academy East Meteorology Test Graphs, Pictures, and Diagrams Diagram #1 Use the map above, and the locations marked A-F, to answer the following questions. 1. The center