FINAL REPORT. SERDP Project ER-2423
|
|
|
- Eleanore Wilson
- 5 years ago
- Views:
Transcription

1 FINAL REPORT In Situ Treatment Train for Remediation of Perfluoroalkyl Contaminated Groundwater: In Situ Chemical Oxidation of Sorbed Contaminants (ISCO-SC) SERDP Project ER-2423 M. Crimi, T. Holsen, C. Bellona Clarkson University C. Divine Arcadis E. Dickenson Southern Nevada Water Authority OCTOBER 2017 Distribution Statement A
2 Page Intentionally Left Blank
3 This report was prepared under contract to the Department of Defense Strategic Environmental Research and Development Program (SERDP). The publication of this report does not indicate endorsement by the Department of Defense, nor should the contents be construed as reflecting the official policy or position of the Department of Defense. Reference herein to any specific commercial product, process, or service by trade name, trademark, manufacturer, or otherwise, does not necessarily constitute or imply its endorsement, recommendation, or favoring by the Department of Defense.
4 Page Intentionally Left Blank
5 REPORT DOCUMENTATION PAGE Form Approved OMB No Public reporting burden for this collection of information is estimated to average 1 hour per response, including the time for reviewing instructions, searching existing data sources, gathering and maintaining the data needed, and completing and reviewing this collection of information. Send comments regarding this burden estimate or any other aspect of this collection of information, including suggestions for reducing this burden to Department of Defense, Washington Headquarters Services, Directorate for Information Operations and Reports ( ), 1215 Jefferson Davis Highway, Suite 1204, Arlington, VA Respondents should be aware that notwithstanding any other provision of law, no person shall be subject to any penalty for failing to comply with a collection of information if it does not display a currently valid OMB control number. PLEASE DO NOT RETURN YOUR FORM TO THE ABOVE ADDRESS. 1. REPORT DATE (DD-MM-YYYY) 3. DATES COVERED (From - To) REPORT TYPE Final Report 4. TITLE AND SUBTITLE In Situ Treatment Train for Remediation of Perfluoroalkyl Contaminated Groundwater: In Situ Chemical Oxidation of Sorbed Contaminants (ISCO-SC) 07/ /2018 5a. CONTRACT NUMBER 5b. GRANT NUMBER 5c. PROGRAM ELEMENT NUMBER 6. AUTHOR(S) Michelle, Crimi Holsen, Tom Bellona, Christopher Divine, Craig Dickenson, Eric 7. PERFORMING ORGANIZATION NAME(S) AND ADDRESS(ES) Clarkson University 8 Clarkson Avenue, PO Box 5805 Potsdam, NY d. PROJECT NUMBER 5e. TASK NUMBER 5f. WORK UNIT NUMBER 8. PERFORMING ORGANIZATION REPORT NUMBER 9. SPONSORING / MONITORING AGENCY NAME(S) AND ADDRESS(ES) 10. SPONSOR/MONITOR S ACRONYM(S) Strategic Environmental Research and Development Program 4800 Mark Center Drive, Suite 17D03 Alexandria, VA DISTRIBUTION / AVAILABILITY STATEMENT Unlimited; Public Release SERDP 11. SPONSOR/MONITOR S REPORT NUMBER(S) ER SUPPLEMENTARY NOTES 14. ABSTRACT The historical use of an aqueous film forming foam (AFFF) formulations containing per- and polyfluoroalkyl substances (PFAS) for firefighting and training activities at the Department of Defense (DoD) sites has led to concern over the potential for contamination of groundwater. Because PFAS have been detected at higher concentrations exceeding regulatory guidance, cost-effective in situ groundwater treatment approaches that consider their unique chemical properties (high solubility, surface-active behavior, recalcitrance, and presence as mixtures) are needed. The objective of this work was to develop a predictable and low cost in situ horizontal reactive media well treatment train (technically named in situ chemical oxidation of sorbed contaminants (ISCO-SC)) for remediating PFAS contaminated groundwater. This research evaluates the feasibility, effectiveness, and sustainability of ISCO-SC, where granular activated carbon (GAC) is used to sorb and concentrate PFAS and AFFF derived co-contaminants in situ, followed by contaminant destruction and GAC regeneration in situ using activated persulfide oxidation. 15. SUBJECT TERM chemical oxidation, Remediation, Perfluoroalkyl Contaminated Groundwater, dissolved organic carbon, dissolved organic matter, electrochemical fluorination, energy dispersive X-ray spectroscopy, Fourier Transform Infrared Spectroscopy, Sorbed Contaminants 16. SECURITY CLASSIFICATION OF: 17. LIMITATION OF ABSTRACT a. REPORT Final Report b. ABSTRACT U c. THIS PAGE U U 18. NUMBER OF PAGES a. NAME OF RESPONSIBLE PERSON Michelle Crimi 19b. TELEPHONE NUMBER (include area code) Standard Form 298 (Rev. 8-98) Prescribed by ANSI Std. Z39.18
6 Page Intentionally Left Blank
7 ABSTRACT Objective: The historical use of an aqueous film forming foam (AFFF) formulations containing per- and polyfluoroalkyl substances (PFAS) for firefighting and training activities at the Department of Defense (DoD) sites has led to concern over the potential for contamination of groundwater. Because PFAS have been detected at higher concentrations exceeding regulatory guidance, cost-effective in situ groundwater treatment approaches that consider their unique chemical properties (high solubility, surface-active behavior, recalcitrance, and presence as mixtures) are needed. The objective of this work was to develop a predictable and low cost in situ horizontal reactive media well treatment train (technically named in situ chemical oxidation of sorbed contaminants (ISCO-SC)) for remediating PFAS contaminated groundwater. This research evaluates the feasibility, effectiveness, and sustainability of ISCO-SC, where granular activated carbon (GAC) is used to sorb and concentrate PFAS and AFFF derived cocontaminants in situ, followed by contaminant destruction and GAC regeneration in situ using activated persulfate oxidation. Technical Approach: The research involved four major components. The first of these was not specifically funded by SERDP, however it relates directly to the ISCO-SC concept and is thus reported herein. A flexible operational model of the horizontal well that adequately represents field application and allows for data collection across a wide range of test conditions was designed and constructed. This physical model was used to determine the expected capture zone of a horizontal well under a range of hydraulic conductivity differentials. In the second component of the research, six types of coal-based GAC sources, as well as one coconut-based source, were characterized. Characterization included physico-chemical properties as well as sorption capacity for PFAS. Two GAC sources, F400 (coal-based) and CBC (coconut-based) from Calgon Corporation, were chosen for further evaluation based on their sorption behavior. Langmuir and Freundlichs isotherms were developed for PFOA and PFOS both individually and when present in mixture, in the presence of co-contaminants, and under varied geochemical conditions. A parallel study was conducted to increase the uptake of PFAS through surface property modifications of GAC by chemical treatment using hydrochloric acid, sodium hydroxide base, heat activated persulfate and catalyzed hydrogen peroxide. The third research component evaluated the effectiveness of heat-activated persulfate oxidation for degradation of PFAS sorbed onto the GAC through time-series batch tests and two-dimensional flow-through column tests. Column tests employed two different spent GAC sources from a field-scale pumpand-treat site. Here, the persulfate dose efficiency, PFAS oxidation byproducts and intermediates, the possibility for in situ regeneration of PFAS sorbed onto GAC, and GAC reusability with treatment were explored broadly. The fourth component involved characterization of the biotransformation pathways for persistent PFOS using Meta-PC degradation simulation software. Results: Research results demonstrate the feasibility of horizontal well capture of contaminated groundwater. Results can be used to upscaling design and predicting field-scale performance. The ratio of hydraulic conductivity within the well to outside of the well is a key design parameter. ii
8 Sorption results indicate that GAC sorption capacity for individual compounds is greater than when PFAS are present in mixture. Of the GAC sources evaluated, Calgon F400 GAC showed the highest sorption capacity. The presence of co-contaminants (kerosene, trichloroethylene, and ethanol), and variations in groundwater conditions (ph, the presence of sulfate anions, natural organic carbon, and iron oxides) demonstrated limited impact on the sorption behavior of PFAS under all experimental conditions tested. The extent of sorption of tested PFAS compounds increased with hydrochloric acid treatment likely due to increasing the positive charge density. Treatment with sodium hydroxide did not affect sorption capacity, and sorption decreased under oxidative treatment. All the treated GAC had lower active surface area compared to untreated GAC, which is the main physical property deemed responsible for reduced sorption. In persulfate treatment evaluations, PFOS exhibited no transformation even with increased activated persulfate oxidant dose. PFOA undergoes degradation yielding shorter chain compounds, however only when suspended in aqueous phase, avoiding oxidant attack when sorbed onto GAC. In the aqueous phase, the greatest extent of PFOA removal was observed with more frequent low concentration oxidant doses. Temperature, aqueous ph, and GAC surface polarity, which are altered through persulfate treatment, were found to control the PFAS interaction with the GAC surface significantly. Persulfate treatment also altered the partitioning behavior of PFAS sorbed onto GAC. Sorption was actually enhanced by persulfate treatment, making contaminants even less amenable to oxidative treatment. Evaluations of the degradability of recalcitrant PFOS using predictive software indicate that degradation is possible only under high energy photo-degradation and certain enzyme-catalyzed metabolism reactions. Benefits: Results of this research have enhanced knowledge and understanding toward the design and application of GAC treatment systems for PFAS removal. Data collected can be used to design and predict treatment at pilot and full scale. Furthermore, results guide the development of new PFAS sorption materials through improved understanding of sorption mechanisms and approaches for enhancing sorption. While persulfate treatment is ineffective for PFOS, the conditions resulting from its use, including generation of low ph and excess sulfate, can impact sorption of PFAS. Results can be used to develop more effective sorption techniques and to extend the life of GAC. iii
9 ACKNOWLEDGEMENTS We gratefully acknowledge funding through The U.S. Department of Defense s Strategic Environmental Research and Development Program (SERDP). We thank Dr. Andrea Leeson and the SERDP panel for their review of materials developed for this project and their guidance. iv
10 TABLE OF CONTENTS ABSTRACT... ii ACKNOWLEDGEMENTS... iv TABLE OF CONTENTS... v LIST OF TABLES... viii LIST OF FIGURES... ix LIST OF ACRONYMS, ABBREVIATIONS, AND SYMBOLS... xiii KEYWORDS... xviii 1.0 OBJECTIVES BACKGROUND PFAS CONTAMINATION AT DOD SITES Historic use of Aqueous Film Forming Foam (AFFF) Formulations PFAS for AFFF Applications Environmental Persistence, Fate, and Transport Environmental Regulations for PFAS PFAS RESEARCH IN DRINKING WATER/WASTEWATER TREATMENT REMEDIATION OF PFAS CONTAMINATED GROUNDWATER ISCO-SC HORIZONTAL TREATMENT TRAIN The HRX Well TM Oxidation Techniques for PFAS Degradation and GAC Regeneration Application of Persulfate Oxidation in the ISCO-SC Treatment Train SORPTION OF PFAS AND CO-CONTAMINANTS Sorption of PFAS onto Activated Carbon Enhancement of PFAS Sorption onto Activated Carbon DESTRUCTION OF PFAS USING PERSULFATE OXIDATION Persulfate Chemistry Persulfate Activation for PFAS Degradation Persulfate Oxidation of PFAS COMPUTER-BASED PREDICTION OF PFAS DEGRADATION MATERIALS AND METHODS APPROACH MATERIALS AND METHODS COMMON TO MULTIPLE EXPERIMENTS Chemicals and Materials Analytical Methods LABORATORY TESTING AND VALIDATION OF THE HRX WELL TM Materials in Laboratory HRX Well TM Construction Design Laboratory HRX Well TM Treatment System Hydraulic Conductivity Measurements Selection Criteria for Aquifer and Well Media Laboratory HRX Well TM Experimental Methods CHARACTERIZATION OF PFAS AND CO-CONTAMINANTS SORPTION Preliminary Sorption Isotherm Experiments Isotherm Experiments Sorption of PFAS in the Presence of Co-contaminants v
11 Influence of Groundwater Conditions on Sorption of PFAS Sorption Isotherm Models ENHANCEMENT OF PFAS SORPTION ONTO ACTIVATED CARBON Treatment of Activated Carbon Sorption of PFAS onto Treated Carbon DESTRUCTION OF PFAS USING PERSULFATE OXIDATION Batch Experimental Setup Oxidation of PFOA and PFOS in the Aqueous Phase Oxidation of PFOA and PFOS Sorbed onto GAC Sorption of PFOA and PFOS onto Persulfate Treated GAC Mole Balance of Batch Oxidation Systems TREATMENT OF FIELD GAC WITH ACTIVATED PERSULFATE Chemicals and Materials Extraction of Field GAC Column Design and Operation Post-treatment Sorption of PFAS META-PC FOR CHARECTERIZATION OF PFOS DEGRADATION Meta-PC Software Tool for PFOS Degradation Characterization RESULTS AND DISCUSSION LABORATORY TESTING AND VALIDATION OF THE HRX WELL TM Laboratory HRX Well TM Design Hydraulic Conductivity of Well and Aquifer Media Tracer Tests CHARACTERIZATION OF PFAS AND CO-CONTAMINANTS SORPTION Preliminary Sorption Experiments PFAS Sorption Isotherms for Different GAC Types Isotherm Experiments Sorption of PFAS in Presence of Co-contaminants Influence of Groundwater Conditions on Sorption of PFAS Comparison of Experimental Results with Other Reported Studies ENHANCEMENT OF PFAS SORPTION ONTO ACTIVATED CARBON Sorption of PFAS onto Treated and Untreated Carbon Scanning Electron Microscopy (SEM) Analysis Fourier Transform Infrared (FTIR) Analysis DESTRUCTION OF PFAS USING ACTIVATED PERSULFATE Persulfate Decomposition in the Aqueous Phase Oxidation of PFOA and PFOS in the Aqueous Phase Oxidation of PFOA and PFOS Sorbed onto Activated Carbon Sorption of PFOA and PFOS onto Treated GAC TREATMENT OF FIELD GAC WITH ACTIVATED PERSULFATE Pre-Oxidation Persulfate Treatment META-PC FOR CHARACTERIZATION OF PFOS DEGRADATION Aerobic and Anaerobic Metabolism Photo-degradation Mammalian Metabolism CONCLUSION AND IMPLICATIONS FOR FUTURE RESEARCH/ IMPLEMENTATION vi
12 LITERATURE CITED APPENDIX A. SUPORTING DATA APPENDIX A.1. SORPTION ISOTHERM OF PFAS ONTO DIFFERENT GAC TYPES (500 MG/L INITIAL CONCENTRATION, 7-DAY REACTION TIME, PH =7.2) APPENDIX A.2. SORPTION ISOTHERM OF PFAS ONTO F400 AND CBC GAC (1 MG/L INITIAL CONCENTRATION, 7-DAY REACTION TIME, PH =7.2) APPENDIX A.3. EDX PATTERNS OF GAC APPENDIX A.4. PRELIMINARY OXIDATION EXPERIMENTS APPENDIX A.5. EVALUATION OF PH EFFECTS ON PFOA, PFOS, AND FLUORIDE MEASURMEMENTS APPENDIX A.6. FLUORIDE ADSORPTION ONTO GAC APPENDIX A.7. COLUMN DESIGN SPECIFICATIONS APPENDIX B. LIST OF SCIENTIFIC/ TECHNICAL PUBLICATIONS vii
13 LIST OF TABLES Table 2.1. Previously reported aqueous based PFAS degradation using activated persulfate Table 3.1. Research objectives and experimental systems Table 3.2. Physicochemical properties of synthetic class of PFAS used in laboratory sorption and oxidation studies Table 3.3. List of materials used in construction and validation of laboratory HRX Well TM Table 3.4. Isotherm experimental conditions Table 4.2. Hydraulic conductivity of media Table 4.3. Relevant dimensions of the laboratory model and hypothetical field scenario Table 4.4. Characteristics of carbon sources Table 4.5. Langmuir isotherm constants and Freundlich isotherm constants for the adsorption of PFAS onto different GAC types Table 4.6. Langmuir isotherm constants and Freundlich isotherm constants of PFAS onto F400 and CBC GAC types Table 4.7. Previous studies on sorption of PFAS on to GAC- Langmuir isotherm constants Qm (mg PFAS/g GAC) and KL (L/mg) and Freundlich isotherm constants KF [(mg PFAS/g GAC) (mg PFAS/L) -n ] Table 4.8. Percent difference of sorption on treated GAC relative to untreated GAC Table 4.9. Characteristics of treated and untreated GAC Table Weight % of elements present in each point marked SEM micrographs of F400- untreated GAC and F400 H2O2/Fe treated Table Weight % of elements present in each point marked SEM micrographs of CBC H2O2/Fe treated and CBC-untreated GAC Table FTIR frequencies for F400 and CBC GAC types Table Results of PFOS degradation as predicted in Meta-PC databases Table A.1. Aqueous PFOA and PFOS degradation with oxidant-activator combinations Table A.2. Changes in aqueous PFOA and PFOS concentration measurements along the changes in ph of the solution Table A.3. Changes in fluoride (F - ) concentration measurements along the changes in ph of the solution Table A.4. Fluoride adsorption onto GAC at different aqueous ph values Table A.5. Effects of sulfate presence on the fluoride sorption onto GAC in different aqueous ph conditions viii
14 LIST OF FIGURES Figure 1.1. The horizontal reactive treatment well approach illustrating flow focusing and treatment under buildings and infrastructure at an active facility Figure 3.1. Model of constant head method for hydraulic conductivity measurement (Fetter, 2001) Figure 3.2. Schematics of physical model of laboratory HRX Well TM with diagrams indicating the placement of well within drum (a), water tank (a), and aquifer drum (b) Figure 3.3. (a) Schematic diagram of the laboratory physical model of HRX Well TM, and (b) a picture of HRX Well TM installed within a drum Figure 3.4. Completed model with drum, water supply tank, and manometer rack Figure 3.5. Experimental setup for column tests to treat field-contaminated GAC Figure 4.1. Depiction of capture zone (ba), average width (Wave), and capture zone radius (rcz) Figure 4.2. Ratio of flow captured by the HRX Well (QHRX, measured at the well outlet) and the flow at the aquifer outlet (QA) to the ratio of KHRX and KA for the five-different media placed in the HRX Well. The open circles represent average measurements for multiple tests for various KA/KHRX ratio values and the filled diamond is the design model prediction. Error bars represent range of measurements for tests completed with the same KA/KHRX conditions. The dashed line represents the predicted relationship based on the numerical model results and the expectation of a linear relationship based on Darcy s Law Figure 4.3. NaCl tracer test results with well filled with F816 GAC at 36 inches of applied head Figure 4.4. Relative breakthrough of chloride (Cl -, circles) and methylene blue (MB, triangles) tracers at the HRX Well outlet. The cumulative MB mass recovery normalized to the cumulative Cl - mass recovery is indicated by the dotted line Figure 4.5. Amount of PFAS adsorbed in to GAC after a 4-day reaction period. Error bars on adjusted values represent the standard errors of the mean estimates Figure 4.6. SEM Micrographs of GAC magnification Figure 4.7. Sorption capacity of individual and mixture of PFOA and PFOS onto F400 and CBC GAC types, derived from (a) Langmuir (b) Freundlich isotherm models. Error bars on adjusted values represent the standard errors of the mean estimates Figure 4.8. The extent of sorption of PFAS in the presence of co-contaminants was investigated by preparing a mixture of PFOA and PFOS and measuring their sorption onto 15 mg of F400 and CBC in the presence of 0.1 mg/l Kerosene (Ker), 1 mg/l Trichloroethylene (TCE), and 1 mg/l Ethanol (Et). Error bars on adjusted values represent the standard errors of the mean estimates Figure 4.9. The extent of sorption of PFOA and PFOS adsorption onto 15 mg GAC at different groundwater conditions ph 4, ph 9, total solids (Fe), 0.1 mg/l DOC (DOC_0.1), 1 mg/l DOC (DOC 1) and SO4-2 anion (SO4). Error bars on adjusted values represent the standard errors of the mean estimates Figure Percent difference in sorption (a) PFHxS (b) PFOA onto hydrochloric acid (HCl), sodium hydroxide (NaOH), hydrogen peroxide catalyzed with iron (H2O2/Fe) and ix
15 persulfate (PS) treated GAC relative to untreated GAC after 2, 5, and 10-day reaction time. Error bars on adjusted values represent the standard errors of the mean estimates. 56 Figure Scanning electron micrographs of F400 (a) untreated (UT), (b) hydrochloric acid (HCl), (c) sodium hydroxide (NaOH), (d) persulfate (PS), and (e) hydrogen peroxide catalyzed with (H2O2/Fe) treated GAC; EDX patterns of F400 UT and H2O2/Fe treated GAC Figure Scanning electron micrographs of CBC (a) untreated (UT), (b) hydrochloric acid (HCl), (c) sodium hydroxide (NaOH), (d) persulfate (PS) and (e) hydrogen peroxide catalyzed with (H2O2/Fe) treated GAC; EDX patterns of CBC UT and H2O2/Fe treated GA Figure FTIR patterns of untreated (UT), hydrochloric acid (HCl), sodium hydroxide (NaOH), persulfate (PS) and hydrogen peroxide catalyzed with (H2O2/Fe) treated (a) F400 and (b) CBC GAC Figure (a) Persulfate decomposition to sulfate in different unbuffered aqueous system conditions, and (b) first order kinetics plot of persulfate decomposition in unbuffered aqueous phase without GAC at 30ºC and 80ºC Figure (a) Change in PFOA concentrations along the reaction period in different unbuffered aqueous phase conditions, and (b) observed intermediates and byproducts during single dose oxidation of PFOA at 80 C. Error bars on adjusted concentration values represent the standard errors of the mean estimates Figure Change in PFOS concentrations along the reaction period in different unbuffered aqueous phase conditions. Error bars on adjusted concentration values represent the standard errors of the mean estimates Figure (a) Comparison of single-dose and multiple-dose aqueous phase persulfate oxidation of PFOA, and (b) Observed intermediates and byproducts during multiple-dose oxidation of PFOA at 80 C. Error bars on adjusted concentration values represent the standard errors of the mean estimates Figure Comparison of single-dose and multiple-dose aqueous phase persulfate oxidation of PFOS. Error bars on adjusted concentration values represent the standard errors of the mean estimates Figure Molar balance across batch systems comparing different aqueous phase oxidation and control conditions containing (a) PFOA and (b) PFOS Figure The possible arrangement of PFOA and PFOS on GAC (a) surface and (b) pores during control condition; representation of protonated GAC surface with persulfate oxidation mechanism and arrangement of molecules on the (c) surface and (d) within the porous structure following oxidation Figure (a) Differences in total moles of PFOA sorbed onto GAC before and after oxidation or control period in different conditions, and (b) PFOA concentrations detected in the aqueous phase over the time in various conditions. Error bars on adjusted concentration values represent the standard errors of the mean estimates Figure (a) Differences in total moles of PFOS sorbed onto GAC before and after oxidation or control period in different conditions, and (b) PFOS concentrations detected in the aqueous phase over the time in different conditions. Error bars on adjusted concentration values represent the standard errors of the mean estimates Figure Molar balance across batch systems comparing different aqueous phase oxidation and control conditions containing (a) PFOA sorbed GAC, and (b) PFOS sorbed GAC.. 73 x
16 Figure Byproducts detected in the aqueous phase after 3-days heat activated persulfate oxidation of PFOA. Error bars on adjusted concentration values represent the standard errors of the mean estimates Figure Molar balance across (a) oxidation series and (b) control series of PFOA batch systems after every reaction stage. (*) PFOA remaining sorbed onto GAC after reaction period were solvent extracted. [(Recovered + Unrecovered) = (Total PFOA sorbed onto GAC)] Figure Molar balance across (a) oxidation series and (b) control series of PFOS batch systems after every reaction stage. (*) PFOS remaining sorbed onto GAC after reaction period were solvent extracted. [(Recovered + Unrecovered) = (Total PFOS sorbed onto GAC)] Figure (a) PFOA remain sorbed onto GAC and (b) PFOA aqueous phase concentration, after each stage in PFOA oxidation and control series. Error bars on adjusted values represent the standard errors of the mean estimates Figure (a) PFOS remain sorbed onto GAC and (b) PFOS aqueous phase concentration, after each stage in oxidation and control series. Error bars on adjusted values represent the standard errors of the mean estimates Figure Initial mass of PFAS extracted from GAC prior to persulfate treatment per 100 g of GAC. Error bars on adjusted concentration values represent the standard errors of the mean estimates Figure (a) Change in effluent ph upon introduction of heat activated persulfate, and (b) change in effluent sulfate concentrations in treated columns for F400 GAC and virgin coconut GAC. GAC upon introduction of heat activated persulfate into columns (initial persulfate concentration 10 g/l, there was no injection of heat activated persulfate in treated columns, so effluent sulfate concentrations were not reported) Figure PFAS concentration measured in (a) treated and (b) control effluent Figure Mass difference between untreated GAC (pre-treatment), persulfate treated GAC (post-treatment), and control GAC (post-control) for (a) F400 GAC and (b) virgin coconut shell-based GAC. Error bars on adjusted concentration values represent the standard errors of the mean estimates Figure Mass of PFAS recovered and unrecovered prior to and after persulfate treatment for (a) F400 GAC and (b) virgin coconut shell-based GAC. Bar height represents initial mass of PFAS extracted from GAC before treatment and first bar for each compound represents treated GAC while the second bar represents the control GAC Figure Percentage removal of PFAS in mixture with persulfate treated F400 GAC, initial concentration 1 mg/l, ph 7.2. Error bars on adjusted values represent the standard errors of the mean estimates Figure Percentage removal of PFAS in mixture with persulfate treated virgin coconut shell-based GAC; (-T) = post-treatment, (-C) = post-control Figure PFOS through mammalian metabolism dictionary- step 1 where 1 F - is removed through reaction likely facilitated by reductases Figure After removing multiple CF2 groups when CF3(CF2)3SOOOH is the starting point again a single F - is removed. This result was also obtained using the mammalian metabolism dictionary xi
17 Figure When the starting molecule is CF3SOOOH again a F - is removed resulting in products F - and SOOOHCF2. This result was also obtained using the mammalian metabolism dictionary Figure The result if it is assumed the final CF2 group was previously removed. Mammalian metabolism was not predicted to further degrade this compound Figure A.1. Adsorbability of PFAS onto F400 GAC Figure A.2. Freundlich isotherm of PFAS onto F400 GAC Figure A.3. Langmuir isotherm of PFAS onto F400 GAC Figure A.4. Adsorbability of PFAS onto F300 GAC Figure A.5. Freundlich isotherm of PFAS onto F300 GAC Figure A.6. Langmuir isotherm of PFAS onto F300 GAC Figure A.7. Adsorbability of PFAS onto Jacobi GAC Figure A.8. Freundlich isotherm of PFAS onto Jacobi GAC Figure A.9. Langmuir isotherm of PFAS onto Jacobi GAC Figure A.10. Adsorbability of PFAS onto CBC GAC Figure A.11. Freundlich isotherm of PFAS onto CBC GAC Figure A.12. Langmuir isotherm of PFAS onto CBC GAC Figure A.13. Adsorbability of PFOA onto F400 and CBC GAC-as an individual compound and in mixture Figure A.14. Freundlich isotherm of PFOA onto F400 and CBC GAC-as an individual compound and in mixture Figure A.15. Langmuir isotherm of PFOA onto F400 and CBC GAC-as an individual compound and in mixture Figure A.16. Adsorbability of PFOS onto F400 and CBC GAC-as an individual compound and in mixture Figure A.17. Freundlich isotherm of PFOS onto F400 and CBC GAC-as an individual compound and in mixture Figure A.18. Langmuir isotherm of PFOS onto F400 and CBC GAC-as an individual compound and in mixture Figure A.19. EDX patterns F400 hydrochloric acid (HCl), sodium hydroxide (NaOH) and persulfate (PS) treated GAC Figure A.20. EDX patterns CBC hydrochloric acid (HCl), sodium hydroxide (NaOH) and persulfate (PS) treated GAC Figure A.21. Effects of ph on PFOA, PFOS and F - concentration measurements. Error bars on adjusted concentration values represent the standard errors of the mean estimates Figure A.22. Fluoride adsorption onto GAC at different ph values, initial fluoride concentration 5 mg/l, 2 g of GAC Figure A.22. (a) Percentage removal of fluoride (5 mg/l), and (b) fluoride adsorption capacity of GAC (at 2 hours) in conditions with and without the presence of sulfate (20 g/l) Figure A.23. Picture of the column experiment xii
18 LIST OF ACRONYMS, ABBREVIATIONS, AND SYMBOLS AFFF aqueous film forming foam AOPs advanced oxidation processes BET Brunauer-Emmett-Teller BJH Barrett-Joyer-Halenda BOD biological oxygen demand C-C carbon-carbon (bond) C-F carbon-fluorine (bond) Ca 2+ CaSO4 CBC CCL Ce cm cm 2 cm 3 Cl - CMC CO CO2 COD CSM calcium ion calcium sulfate coconut based carbon Contaminant Candidate List aqueous phase equilibrium concentration centimeter square meter cubic meter chloride critical micelle concentration carbon monoxide carbon dioxide chemical oxygen demand conceptual site model 1-D one dimensional 2-D two dimensional 3-D three dimensional Da Dalton DFT density functional theory DI deionized DOC dissolved organic carbon xiii
19 DoD DOM ECF EDX EPA Eq. ESTCP Et F - F100 F200 F300 F400 F816 F1 F2 Fe FTIR g GAC GHT H + H2O2 HA HCl HDD HPLC HRX ISCO-SC K + Department of Defense dissolved organic matter electrochemical fluorination energy dispersive X-ray spectroscopy Environmental Protection Agency equation Environmental Security Technology Certification Program ethanol fluoride Filtrasorb-100 Filtrasorb-200 Filtrasorb-300 Filtrasorb-400 Filtrasorb-816 Low energy (no collision energy) scan using MS e mode High energy (ramped collision energy) scan using MS e mode iron Fourier Transform Infrared Spectroscopy gram granular activated carbon garden hose thread hydrogen ion hydrogen peroxide humic acid hydrochloric acid horizontal directional drilling high performance liquid chromatography horizontal reactive media well In Situ Chemical Oxidation of Sorbed Contaminants potassium ion xiv
20 KCl Ker kg Kow L LC-MS LEI m M M mg Mg 2+ min Milli-Q mm mm mol MPFHxA MPFHxS MPFOA MPFOS MS MS e MS/MS MTBE Na + NaCl NaHCO3 NaOH NAPL potassium chloride kerosene kilogram octanol-water partition coefficient liter liquid chromatography mass spectrometry lower electron image meter molar mass milligram magnesium ion minute Milli-Q ultrapure water millimeter millimolar mole perfluorohexanoic acid in methanol (standard) sodium pefluorohexanesulfonate in methanol (standard) perfluorooctanoic acid in methanol (standard) sodium perfluorooctanesulfonate in methanol (standard) mass spectrometry continuous low/high energy mass spectrometry precursor/product mass spectrometry methyl tert-butyl ether sodium ion sodium chloride sodium bicarbonate sodium hydroxide non-aqueous phase liquid xv
21 Na2S2O8 NaHCO3 nm nm NOM O3 OH - OH - PAC PEEK PFAS PFBA PFBS PFCAs PFHpA PFHxA PFHxS PFOA PFOS PFPeA PFSAs pg ph phpzc pka PP ppm PS PVC QToF sodium persulfate sodium bicarbonate nonometer nanomolar natural organic carbon ozone hydroxyl ion hydroxyl radical powder activated carbon polyether ether ketone per- and polyfluoroalkyl substances perfluoro-n-butanoic acid perfluoro-n-butane sulfonate perfluoroalkyl carboxylic acids perfluoro-n-heptanoic acid perfluoro-n-hexanoic acid perfluoro-n-hexane sulfonate perfluorooctanoic acid perfluorooctanesulfonate perfluoro-n-pentanoic acid perfluoroalkane sulfonates picogram potential of hydrogen point of zero charge ph acid dissociation constant of a solution polypropylene parts per million persulfate polyvinyl chloride quadrupole time of flight xvi
22 rpm S2O8 2- SDWA sec SEI SEM SERDP SMILES SNWA SO4 - SO4 - SPE T TCE UPLC UV UT v/v revolutions per minute persulfate anion Safe Drinking Water Act second scanning electron imaging scanning electron microscope Strategic Environmental Research and Development Program simplified molecular-input line-entry system Southern Nevada Water Authority sulfate radical sulfate ion solid phase extraction treated trichloroethene ultra performance liquid chromatography ultraviolet untreated volume/volume SYMBOLS Å angstrom aa, AA cross-sectional area AAAAAA area of capture zone AA TT aquifer total area bb AA aquifer thickness intercept ºC degree Celsius CC cccccc concentration of the controls CC ee equilibrium liquid phase concentration CC mm measured concentration CC oo initial concentration CC tt total sum of concentrations of all species ev electron volt h height or applied head xvii
23 ii AA ii ww k kv KK KK AA KK FF KK HHHHHH KK LL KK rrrrrrrrrr ll mm aquifer hydraulic gradient well hydraulic gradient hydraulic conductivity kilovolt hydraulic conductivity hydraulic conductivity of aquifer Freundlich isotherm constant hydraulic conductivity of well Langmuir isotherm constant ratio of well to aquifer hydraulic conductivities length or thickness slope in a linear equation µ micro QQ flow rate or amount of solute sorbed per mass of solid (GAC) QQ cccc flow through capture zone QQ ee equilibrium solid concentration QQ mm maximum sorption capacity QQ ww water flow rate rr cccc capture zone radius rr TT radius of aquifer rr ww radius of well t time VV volume VV HHHHHH velocity in the HRX well WW weight WW aaaaaa average treatment width x x-axis coordinate y y-axis coordinate KEYWORDS PFAS treatment; HRX Well TM ; PFOA; PFOS; PFHxS; PFBS; carbon sorption; activated persulfate; Langmuir isotherm; Freundlich isotherm; sorption enhancement; groundwater influence; xviii
24 xix
, toward expedited closure of Department of Defense (DoD) sites.")
25 1.0 OBJECTIVES The objective of ESTCP ER-2423 project is to develop a predictable and low cost in situ treatment train for remediation of groundwater contaminated by per- and polyfluoroalkyl substances (PFAS), toward expedited closure of Department of Defense (DoD) sites. The proposed treatment train approach, also termed as in situ chemical oxidation of sorbed contaminants (ISCO-SC), takes advantage of the key features of two current best practices for treatment of PFAS contaminated water, sorption onto granular activated carbon (GAC) and destruction using activated persulfate oxidation, while understanding key limitations of each. The work evaluates the feasibility, effectiveness, and sustainability of a treatment train approach where activated carbon is used to sorb and concentrate contaminants in situ, followed by contaminant destruction and carbon regeneration in situ using activated persulfate. This combined remedy is conceived to be applied using a novel horizontal reactive media well (HRX Well TM ), (patent US 8,596,351). The approach uses large diameter directionally drilled horizontal wells filled with granular reactive media, such as GAC, installed in the direction of groundwater flow (Figure 1.1). The concept leverages natural flow-focusing behavior created by the strong well-to-aquifer permeability contrast to capture and passively treat proportionally large volumes of groundwater in situ. Contaminant discharge from sources and highconcentration plume zones can be dramatically reduced and cost-effectively sustained over many years. By greatly reducing/eliminating source zone discharge, downgradient plumes can be effectively treated, possibly even achieving low water quality standards in a relatively short period of time. The HRX Well TM has the potential to overcome a variety of limitations to the current common treatment approach of delivering aqueous amendments to the subsurface via injection, including the ability to introduce reagents, high energy requirement, limited ability to address low hydraulic conductivity situations, difficulty treating large plumes, etc. The HRX Well TM approach can provide rapid and dramatic reduction in contaminant mass flux and it requires no above ground treatment or footprint and limited ongoing maintenance. Figure 1.1. The horizontal reactive treatment well approach illustrating flow focusing and treatment under buildings and infrastructure at an active facility. 1
26 Specific questions the research addressed include: Does HRX Well TM built with activated carbon media passively capture the flow of groundwater from aquifer? Are particular sources of granular activated carbon (GAC) more favorable for sorbing PFAS than others based on physical and chemical properties? What influence do varied groundwater conditions, including dissolved organic matter, and common co-contaminants have on sorption of PFAS? Can PFAS sorbed onto GAC be treated by oxidation using activated persulfate? Does activated persulfate treatment of GAC affect the physical properties, chemical properties, and/or subsequent sorption of PFAS and/or co-contaminants? What intermediates and byproducts are generated during oxidation of PFAS and/or which PFAS remain untreated? Are intermediates, byproducts, and/or untreated PFAS potentially amendable to biodegradation? Is the ISCO-SC treatment train approach cost-effective and sustainable relative to other potentially viable approaches? 2
27 2.0 BACKGROUND 2.1. PFAS CONTAMINATION AT DOD SITES Historic use of Aqueous Film Forming Foam (AFFF) Formulations Firefighting foams are mainly used to extinguish fire caught on inflammable polar and non-polar solvents. The synthetic foam formulation called Aqueous Film Forming Foam (AFFF), also denoted by A3F, has a property to coat the surface of a fuel source with layer of low-density foam that blocks atmospheric oxygen supply and eventually acts as a barrier to inhibit and extinguish combustion (Pabon & Corpart, 2002; Williams et al., 2011). Low density foam is formed when AFFF is applied through a nozzle, and when it is applied to the solvent surface, it prevents risk of re-ignition caused by solvent evaporation. AFFF are found as very efficient type of fire suppressants to attack a broad range of class B fire accidents (Lehmler, 2005). PFAS were used as essential components in AFFF formulation because they act as excellent surfactants and aqueous surface tension lowering agents (Liu et al., 2012). The properties such as low volatility, high water stability, thermal stability, emulsifying behavior, and resistance to chemical and biological degradation, make PFAS an essential ingredients in AFFF (Buck et al., 2011; McKenzie et al., 2015). PFAS composition in AFFF formulations varied from 1 to 5% depending on specific property requirements (Anderson et al., 2015). The other additive in AFFF formulations were selected based on the desired end results such as extinguishing time, corrosion rate, resistance to freezing, environmental impact concerning biological oxygen demand (BOD), chemical oxygen demand (COD), and total fluorine contribution to the environment (Lewandowski et al., 2006). PFAS formulated AFFFs were extensively used for decades of firefighting and training operations at DoD facilitates before they were characterized as contaminants of concern (Backe et al., 2013; Filipovic et al., 2015). Detection of PFAS along with fuel, chlorinated hydrocarbons, solvents (e.g., glycols and alcohols), and AFFF additives at investigation sites made it evident that all the compounds were simultaneously released into environmental matrices from AFFF formulations used during fire extinguishing operations (McGuire et al., 2014). Natural cycles such as infiltration, percolation, and runoff from the spills, discharges and disposal sites are assumed to be reasons for PFAS transport to groundwater, surface water, and wastewater treatment plants. Because of insufficient data regarding the magnitude of PFAS and AFFF used in the history of applications, understanding the extent of surface soil and groundwater contamination has become complex and challenging (Anderson et al., 2015). To date, there are estimated to be hundreds of DoD sites that are environmentally affected by AFFF and are potentially in need of remediation PFAS for AFFF Applications Manufacturing of PFAS for AFFF Applications. PFAS surfactants used throughout the history of AFFF formulations were produced mostly via either electrochemical fluorination (ECF) of hydrogen fluoride or telomerization of tetrafluoroethylene (Buck et al., 2011). The ECF process was developed by the 3M and later used by other manufacturers to produce perfluoroalkane sulfonates (PFSAs) and perfluoroalkyl carboxylic acids (PFCAs). The ECF technique was considered as the principle process to meet the supply of PFAS for AFFF use 3
28 because of cost-effectiveness factor and low side product yield benefits (Moody & Field, 2000). During the period of ECF process domination, fluorotelomer surfactants produced through the telomerization process were also employed but gained very less market share (Pabon & Corpart, 2002). According to estimates, foam formulations from 1965 to 1974 used PFCAs as surfactants, and from then PFSA-based surfactant became predominant until voluntary production phase out of PFOS and its precursors by 3M in the year 2002 (Anderson et al., 2015; Lehmler, 2005). Beginning in 2002, there was a significant shift in production of surfactants, and it involved employing telomerization process to a greater extent to produce fluorotelomer surfactants and PFCAs (ASTSWMO, 2015; USEPA, 2012b). Supporting the goal of eliminating the eliminating long chain fluorinated surfactants from the environment, a new mixture of environmental friendly surfactant grade AFFF formulations manufactured today doesn t contain PFOA, PFOS, and high chain length precursors. However, the fluorinated compounds used today are shorter chain compounds defined by their less toxic and biopersistant nature, and include mixture of fluorocarbons and hydrocarbons to achieve desired properties as conventional PFAS (Anderson et al., 2015) PFAS Detection at Contaminated Sites. Place & Field (2012) researched the major perfluorinated compounds used by US Military in AFFF formulation, and found that foam formulations supplied from manufacturers using the ECF process included mainly PFOS-based products and other shorter chain derivatives namely C6-C8 perfluoroalkyl sulfonates, C4-C6 perfluoroalkyl sulfonamides of carboxylic acid. Foam formulation from fluorotelomerization process contained 6:2 fluorotelomer thioether amido sulfonate and a telomere-based complex mixture of fluorotelomere sulfonamides with perfluoroalkyl chain lengths of 4, 6, 8 or 10 (Backe et al., 2013). In work led by D Agostino & Mabury, (2014), around 103 different fluorinated compounds were tracked in a sample group of 10 different AFFF formulations, and that included 22 distinctive classes of perfluoroalkyl substances. Identification of a diverse range of perfluorinated moiety of compounds in different proportions is due to the reason that manufacturers used to change the foam formulation grades to meet the specific property requirements of AFFF. PFAS detected in environmental matrixes include a broad range of fluorinated contaminants including fully fluorinated perfluoroalkyl sulfonic acids, perfluoroalkyl sulfonamides and highly diverse set of fluorotelomers. The nature of particular PFAS is derived from the method employed to manufacture them, and importantly the production method significantly defines its properties and as well delineates the degradation pathways followed in different environmental conditions (Anderson et al., 2015). Through the action of microcosms, the environmentally unstable precursors like long chain fluorotelomers and perfluoalkyl sulfonamides can transform to form stable class of compounds like PFOA, PFOS, PFHxS, and other short chain PFASAs and PFSAs (Key et al., 1997; Arias Espana et al., 2015) Environmental Persistence, Fate, and Transport PFAS are extremely persistent. They do not hydrolyze or degrade (physical, chemical or biological deterioration) in general environmental conditions (Tang et al., 2012). They exhibit very little to absolutely no volatility due to their ionic nature. PFOA and PFOS will remain stable in a water source even under extreme ph conditions. The geometric mean degradation half-life in water for PFOA and PFOS is greater than 41 years and 92 years, respectively (USEPA, 2012a). Perfluorinated chemicals show potential for bioaccumulation in human and animals. 4
29 Indeed, their bio-magnification rate in wildlife increases up the food chain. PFAS have been found in animal tissues throughout the globe. PFOS and related compounds were discovered in fish, bird, amphibians and marine mammals including seals, dolphin, polar bears from remotely located arctic zones that are far away from human activity (Martin et al., 2004; Smithwick et al., 2006; D Agostino & Mabury, 2014). PFAS are discovered in a large spectrum of sources throughout the world in soil, groundwater, surface water, rainwater, icecaps, animal tissues and human blood serum (Kannan et al., 2004; Martin et al., 2004). Conceptual models of sites with PFAS contamination (along with co-contaminants) are starting to emerge based on improved understanding of PFAS fate and transport in the subsurface as a function of media properties and in the presence of co-contaminants resulting from work funded by SERDP (ER-2126, Behavior of Perfluoroalkyl Chemicals in Contaminated Groundwater). However, what is emerging is clarification of how complex these sites are due to the varied properties of PFAS (and thus their varied mobility and degradability), the potential transformation of precursors to more mobile compounds, and changes to interactions with the subsurface in the presence of co-contaminants. PFAS were detected at a higher concentration in environmental matrices around fire-fighting facilities (Anderson et al., 2015). Even fresh water in the vicinity of fluorochemical utilization facilities is shown to contain PFAS above regulatory limits (Moody et al., 2001; Takagi et al., 2011). Soil and groundwater samples collected from contaminated firefighting were found to contain higher concentration (µg/g to mg/g) PFAS (McGuire et al., 2014; Filipovic et al., 2015). Filipovic et al., (2015) observed high concentration of PFAS in top soil and change in concentration along the depth in the subsurface. Also, PFAS concentrations were reported to vary depending on organic carbon content in the soil (McGuire et al., 2014; Filipovic et al., 2015). According to McKenzie et al. (2015), the mobility of PFAS in subsurface soil and groundwater decreases with increase in content of natural mineral and organic carbon composites. During PFAS transport from source to groundwater, they interact with aquifer solids, sediments, bio-solids, and minerals. The precursors transform to form specific perfluoroalkyl acids (PFAAs), including perfluoroalkyl carboxylic acids (PFASAs) with carbon chain 7 and perfluoroalkane sulfonic acids (PFSAs) with carbon chain 6, depending on the source type of PFAS released to environment (Buck et al., 2011; Backe et al., 2013). Because some PFAS are zwitterionic complexes, they undergo sorption onto solid surfaces during their transport (Guelfo & Higgins, 2013b; McGuire et al., 2014). Many of these are PFOA and/or PFOS precursors that are less mobile than their transformation products, and serve as a continuing source of these compounds in the subsurface environment (McGuire et al., 2014; Schaefer et al., 2015) Environmental Regulations for PFAS Detection of PFAS at higher concentrations in water sources including groundwater particularly around AFFF contaminated sites have raised concerns over threats to human health and the environment. State and federal regulatory agencies, scientific communities, USEPA, and Department of Defense (DoD), have led hazard identification and risk assessment research studies to establish protocols and regulations. Since 2002, the EPA tried to limit the production 5
30 and minimized the use of long chain PFAS by introducing Significant New Use Rules (SNURs). Under SNURs, initially in 2002, mainly 75 PFOS related fluorinated substances from the list of 3M s voluntary phase-out were added to prohibited chemicals list (including production, import, and general usage) with an exception for highly technical applications with conditions of low volume, low exposure, and low releases. In 2007, SNURs were amended to include 183 additional PFAS chemicals. At the same time, PFOS related substances were also restricted in Europe. In 2009, PFOS related compounds were added to Stockholm Convention candidate list as persistent organic pollutants (Paul et al., 2009). Under the Toxic Substances Control Act (TSCA), EPA proposed another SNUR in 2012 requiring companies to report in advance of starting or resuming new uses of long chain PFASAs (USEPA, 2012a, 2012b). Following the detection of PFOA and PFOS in a number of United States cities in both surface water and drinking water at varied concentrations, in January 2009, under EPA provisional health advisories, short-term exposure limits through ingestion was set as 0.2 µg/l for PFOS and 0.4 µg/l for PFOA (ASTSWMO, 2015). In the same year, USEPA Region IV scheduled residential soil screening level of 6 mg/kg for PFOS and 16 mg/kg for PFOA. In 2012, PFOS and PFOA compounds were considered under EPA s Unregulated Contaminant Monitoring Rule (UCMR) for continuous observation on concentration levels in drinking water, and in 2015 both the chemicals were enlisted on USEPA s Contaminant Candidate List (CCL) and Safe Drinking Water Act (SDWA). There are several provisional health-based guidelines PFAS set by different regulators, however, in May 2016, the USEPA announced lifetime drinking water health advisory of 70 ng/l for combined PFOA and PFOS combined concentrations and ng/l for C4-C7 PFAS (USEPA, 2016; Merino et al., 2016) PFAS RESEARCH IN DRINKING WATER/WASTEWATER TREATMENT Due to the occurrence of PFAS in the environment, wastewater effluents and finished drinking water, studies have been undertaken to evaluate a variety of conventional and advanced treatment technologies for PFAS removal from and/or degradation in water. Conventional water treatment processes have been demonstrated to be ineffective for removal or destruction of PFAS (Deng et al., 2011; Takagi et al., 2011; Thompson et al., 2011; Zhao et al., 2013). While advanced treatment processes such as nanofiltration and reverse osmosis can be effective barriers for PFAS (Steinle-Darling & Reinhard, 2008), these processes are limited to above ground treatment systems and produce a large residual stream. Past research into the sorption of PFAS onto reactive and non-reactive adsorbents has indicated that activated carbon (powdered and granular), carbon nanotubes, and ion exchange materials (natural, such as zeolites, or manufactured) are all viable materials for sorbing PFAS (Ochoa- Herrera and Sierra-Alvarez 2008; Yu et al. 2009; Senevirathna et al. 2010a; Zhou et al. 2010a, 2010b; Takagi et al. 2011; Chen et al. 2011; Deng et al. 2012). For treatment of contaminated groundwater, recent research evaluating adsorption processes for removal of PFAS has indicated that carbon adsorption and ion-exchange processes can effectively remove various PFAS from aqueous matrices (Steinle-Darling and Reinhard 2008; Yu et al. 2009; Carter and Farrell 2010; Zhou et al. 2010a; Chen et al. 2011; Eschauzier et al. 2012). Because sorption of contaminants onto activated carbon depends on the bulk surface area of materials and the surface area of the materials micropores, different sources of carbon have 6
31 different sorption capacities and rates. PFAS sorption to activated carbon is believed to occur mainly through hydrophobic interactions, although electrostatic interactions between anionic PFASs and amphoteric carbon surfaces can be important. As a result, PFAS-carbon sorption capacities depend on carbon characteristics (e.g., porosity, surface area, point-of-zero-charge ph (phpzc)), and water chemistry (e.g., ph, ionic strength). Several studies have reported that PFAS can form micelles at the surfaces of activated carbon, which may facilitate sorption due to sorbate-sorbate hydrophobic interactions, even when present at concentrations less than the critical micelle concentration (Johnson et al., 2007; Yu et al., 2009; Zhou et al., 2010a). Selection of an appropriate carbon source for treating PFAS is important because of the unique chemical properties and combined sorption/exchange behavior of PFAS, coupled with the complex geochemical conditions of the subsurface REMEDIATION OF PFAS CONTAMINATED GROUNDWATER While the understanding of the fate and transport of PFAS continues to grow, there clearly remains significant uncertainty regarding their behavior and site-to-site variations in concentrations and transport conditions. Because multiple sources of PFAS, precursors, and degradation products in groundwater can occur spatially, and because contaminant mobility varies compound-to-compound and site-to-site, a treatment approach that intercepts/captures groundwater as it moves away from a site is a comprehensive, conservative, and protective treatment approach at least until we have the improved understanding needed to develop the type of detailed conceptual site models (CSMs) necessary for a targeted approach. Until then, targeted approaches (e.g., amendment delivery) to treat PFAS-contaminated soil and groundwater could translate to inefficiently and expensively chasing contaminant with limited ultimate risk reduction. Past research into the sorption of PFAS onto reactive and non-reactive adsorbents has indicated that activated carbon (powdered and granular), carbon nanotubes, and ion exchange materials (natural, such as zeolites, or manufactured) are all viable materials for sorbing PFAS (Ochoa- Herrera & Sierra-Alvarez, 2008; Yu et al., 2009; Senevirathna et al., 2010a; Zhou et al., 2010a, 2010b; Takagi et al., 2011; Chen et al., 2011; Deng et al., 2012; Appleman et al., 2013, 2014). However, because activated carbon is inexpensive and readily available, the USEPA s document Emerging Contaminants Perfluorooctane Sulfonate (PFOS) and Perfluorooctanoic Acid (PFOA) issued in May 2012 suggest carbon filtration as one of the most viable approaches for treating PFAS in groundwater (USEPA, 2012a). In general, the use of activated carbon alone for treatment of PFAS-contaminated groundwater is limited for two primary reasons: (1) its implementation for treating groundwater is typically exsitu via expensive and energy intensive pump-and-treat (aside from limited application for sediment treatment via in situ mixing (Cho et al., 2009; Kupryianchyk et al., 2012)); and (2) spent materials are expensively managed as hazardous waste ex situ, often via incineration or landfill disposal. As a result, researchers are evaluating alternative destructive treatment technologies for PFAS that do not rely on sorption and disposal. These include photocatalytic degradation, chemical oxidation, chemical reduction, thermal destruction using electrical resistance heating, plasma treatment, and sonolytic degradation. Each of these, while in development, is currently challenging, expensive, and some are impossible to implement in situ. 7
32 The recently developed promising sustainable remediation approach named In Situ Chemical Oxidation of Sorbed Contaminants (ISCO-SC) offers an opportunity to overcome the limitations of using activated carbon in situ include: (1) the development of horizontal reactive media wells (HRX Well TM, patent US 8,596,351 B2) (Divine et al., 2013); and (2) the use of chemical oxidants for both contaminant destruction and carbon regeneration and reuse ISCO-SC HORIZONTAL TREATMENT TRAIN The HRX Well TM The HRX Well TM (Figure 1.1) is a novel approach involving installation of a large-diameter horizontal well within a contaminant plume. The approach is currently in the process of demonstration and field validation (ESTCP project ER ) (Divine et al., 2013). The HRX Well TM is oriented in the general direction of groundwater flow, and the well is filled with a granular reactive media such as activated carbon. Flow-focusing resulting from high in-well hydraulic conductivity of the engineered reactive media relative to the aquifer hydraulic conductivity causes a wide area of impacted groundwater (shaded red in Figure 1.1) to passively flow into the well through the screen at the upgradient portion of the well. Because the well is filled with activated carbon, impacted groundwater is treated in situ as it flows through the well. The treated groundwater then exits the well through the screen along the downgradient sections (shaded blue in Figure 1.1). It is important to note that in contrast to injected fluid-based in situ strategies, the treatment performance of the HRX Well TM approach potentially increases with decreasing aquifer hydraulic conductivity (due to the increased permeability contrast and flowfocusing). The HRX Well TM approach can provide rapid and dramatic reduction in contaminant mass flux and it requires no above ground treatment or footprint and limited ongoing maintenance. To date, horizontal wells for remediation and drainage have been constructed with diameters up to 12 and lengths approaching 2,000 feet. Most environmental wells are 8 inches in diameter or less, but can be larger. Horizontal directional drilling (HDD) is a robust and proven strategy that has become a very successful tool in groundwater remediation. One of the reasons that horizontal wells are so effective is that most environmental contaminants are with 100 feet of the surface and the plumes are planar in nature. Consequently, it often takes many vertical wells to achieve the same linear footage of well screen in contact with the contaminants as a few horizontal wells (Kompani-Zare et al., 2005). Horizontal wells are used in a variety of remediation strategies, and most commonly is to remove contaminants from soil (Zhan, 1999). In situations where volatile chemicals have contaminated soil or water, there are several remediation options utilizing horizontal wells to include: soil vapor extraction, steam injection, and free product removal. Specifically, for groundwater remediation, horizontal wells are used in groundwater extraction, air sparging, chemical injection, and bioremediation strategies. Due to their prevalence in the petroleum and remediation industries, there is a substantial amount of literature that examines horizontal wells in different ways. However, the literature to date does not address the subject where the passive well is filled with solid media oriented in the direction of groundwater flow. None of the current solutions captured in the literature apply to the proposed design here because of several reasons: 8
33 Most studies are related to the pumping and removal of water from the aquifer (Mohamed & Rushton, 2006; Zhan, 1999). In the HRX concept, the water remains in situ always. Others assume that the well is empty (infinite hydraulic conductivity (KK)) and there is little to no resistance within the well (Kawecki, 2000; Kawecki & Al-Subaikhy, 2005; Kompani-Zare et al., 2005). The HRX Well TM is filled with a solid reactive media and the capture and treatment zone dimensions will be highly dependent on the hydraulic conductivity differential between the reactive media and the aquifer. Because the wells are pumped and the pumping rates are much higher than the hydraulic conductivity of the aquifer, it is assumed that groundwater flow into a horizontal well enters perpendicularly (Mohamed & Rushton, 2006). They assume that there is no flow in the direction of the horizontal well (Kawecki & Al-Subaikhy, 2005). The HRX concept is oriented in the direction of the groundwater flow and relies on the horizontal flow in direction of the well as the primary capture mechanism. After a period, most treatment media, regardless of in situ or ex situ configuration, become exhausted of chemical reagents, or saturated with contaminants. For long-term viability of the HRX Well TM treatment technology, a mechanism that is relatively easy and economical well maintenance must be outlined. By inclusion of a smaller diameter injection line within the larger diameter HRX Well TM, it is feasible to regenerate treatment media in place, without the necessity for removal, making regeneration of activated carbon using suitable oxidant like activated persulfate. This might be accomplished by monitoring the condition of the treatment media through downhole instrumentation. When regeneration becomes necessary, the activated persulfate could be pumped directly into the small diameter injection line and the system could be readily designed such that little of the regeneration fluid would escape to the surrounding formation. The only system that currently uses a hydraulic conductivity differential to capture groundwater like the HRx is the trench and gate system. Similar in design to funnel and gate, trench and gate systems use high permeability trenches to collect groundwater and direct it to a gate where the groundwater is treated (Bowles et al., 2000). Researchers demonstrated that groundwater elevation contours were deflected by a trench and gate system. The main advantage of the trench and gate over the funnel and gate system is that it eliminates mounding and reduces the amount of water that bypasses the system. In a funnel and gate system, a funnel is created using materials with low hydraulic conductivities (clays) that direct the water to a gate where it is treated. One of the major concerns with the funnel and gate system is that groundwater builds up along the funnel leading to mounding. Once mounding occurs, there is a higher probability of water flowing over or around the funnel and bypassing the gate. Because the trench and gate system is constructed with areas of higher conductivity, there is no possibility of mounding and more water is directed to the gate for treatment. However, even though this system relies on hydraulic conductivity differential to capture groundwater, Bowles et al. (2000) made no attempt to determine how the ratio of K values affects the ability to capture groundwater, and assumes all the groundwater in question flows into the trenches and to the gate. It also shows that the trench system is more effective than funnels in areas with low hydraulic conductivity, but does not attempt to quantify the difference. 9
34 For the HRX Well TM to be an efficient method to treat groundwater, it must have a capture width significantly greater than the diameter of the well and it must behave in a predictable fashion. Therefore, two questions that are important to answer before advancing the technology include: 1) Does the HRX Well TM effectively capture groundwater? 2) Is the capture zone predictable as a function of well media and aquifer permeability? Oxidation Techniques for PFAS Degradation and GAC Regeneration Different oxidation- reduction combinations of reactions have been evaluated to degrade PFAS (Vecitis et al., 2009). Generally used oxidants in soil and groundwater remediation include but not limited to: permanganate (l), hydrogen peroxide (l), ozone(g), persulfate(p), peroxone (l)(g), percarbonate (s) and calcium peroxide (s). Through activation, some oxidants yield more reactive species that can transform and degrade recalcitrant contaminant compounds. Depending on the type of oxidant, degradation steps involves electron transfer and free radical reaction pathways through various intermediate steps. Among the produced reactive species, oxygen-containing free radicals, mainly hydroxyl radical (OH -, +2.8 V), sulfate radical (SO4 -, +2.6 V), persulfate anion (S2O8 2-, +2.1V) and ozone (O3, +2.1 V), are the strongest, and they are employed particularly in degradation of conventional recalcitrant organic pollutants (Siegrist et al., 2011). However, PFAS are resistant to oxidative degradation using hydroxyl radicals and ozone species (C. D. Vecitis et al., 2009). Hydroxyl radicals are best known to react with hydrogen atom containing aliphatic and aromatic organic compounds at near diffusion rates to form water, but PFAS moiety of compounds, in general, don t contain hydrogen atoms in the perfluorinated tail (Yang et al., 2013). Despite this condition, instead of reacting with the carbon chain, hydroxyl radicals act through a direct electron transfer to form the less thermodynamically favorable hydroxyl ion (OH -, +1.9 V). Persulfate oxidant that gives rise to the strong reactive species, sulfate radicals, upon activation is more viable amongst advanced oxidation processes (AOPs) because of its dual electron transfer and free radical oxidation mechanisms (Tsitonaki et al., 2010). While PFAS cannot be effectively treated using traditional AOPs (Yuan et al., 2001; Sinclair & Kannan, 2006) due to the inability of these free radical-based oxidants to overcome the strength of C-F bond, in particular, persulfate oxidant is found to degrade PFOA (Hori et al., 2008; Lee et al., 2012; Liu et al., 2012; Wang et al., 2015a; Park et al., 2016) and PFOS (Yang et al., 2013) in the aqueous phase. Activated persulfate has been used to effectively and rapidly oxidize contaminants frequently found in soil and groundwater including halogenated aliphatic compounds, fuel hydrocarbons and polycyclic aromatics (Huang et al., 2005; Tsitonaki et al., 2010; Zhao et al., 2013; An et al., 2015; Eberle et al., 2016). Many studies have focused on regenerating GAC using persulfate or Fenton s reagent (or catalyzed hydrogen peroxide) (Toledo et al., 2003; Huling et al., 2005, 2012; Kan & Huling, 2009; Hutson et al., 2012). These studies have demonstrated effective treatment of contaminants sorbed onto activated carbon, including organochlorine compounds (Toledo et al., 2003), methyl tert-butyl ether (MTBE) (Huling et al., 2005, 2011, 2012; Hutson et al., 2012), and trichloroethylene (TCE) (Liang et al., 2009) with limited or no change to the carbon s physical and chemical properties. However, it is likely that oxidants show impact on carbon properties and affect carbon surfaces differently for example exposing different functional groups based on the carbon make-up (Moreno-Castilla et al., 2000). 10
35 More recent carbon regeneration studies have focused specifically on the use of persulfate activated using iron, alkaline ph, heat, and dual oxidation using hydrogen peroxide and persulfate (Huling et al., 2012, 2011; Liang et al., 2009). In comparison of heat, alkaline ph, and dual oxidantion approaches for treatment of carbon-sorbed MTBE, Huling et al., (2011) found that heat activation was most effective and it is likely that surfaces of the activated carbon facilitated oxidant activation based on an analysis of the reaction kinetics. The combined efforts of these researchers point to several factors to guide the path forward for implementing oxidant regeneration of activated carbon. Lessons learned include: (1) increasing temperature improves treatment effectiveness likely because of enhanced contaminant desorption coupled with enhanced oxidant activation; (2) pre-treatment of activated carbon, in some cases, can enhance oxidative treatment likely because of changes in functional groups that can influence oxidant activation rates; (3) treatment can be enhanced using more frequent and lower volume delivery of high concentrations of oxidant; and (4) sulfate produced from persulfate decomposition coupled with the decrease in ph due to generation of hydrogen ion can negatively impact contaminant sorption post-oxidative treatment because carbon surfaces become protonated and sulfate will be attracted to the protonated surfaces (reversible by increasing solution ph). To date there has been no documented comprehensive comparative evaluation of the effectiveness of varied persulfate activation approaches for treatment of PFAS, nor has there been a detailed analysis of reaction intermediates and byproducts resulting for activated persulfate oxidation of PFAS. While the feasibility of regenerated activated sorbed carbon and destroying sorbed contaminants has been established, there have been no evaluations of the approach for PFAS, which is one of important focuses of this research Application of Persulfate Oxidation in the ISCO-SC Treatment Train There are limitations to activated persulfate use for treating PFAS in situ due to the reactivity of activated persulfate with natural subsurface media, which results in nonproductive decomposition of the oxidant. Because PFAS are highly soluble, contamination at sites may be expected as large, dilute plumes, for which traditional in situ chemical oxidation (ISCO) is expensive and inefficient due to large chemical requirements and the labor/time-on-site necessary for active delivery of oxidants over a large site area. The HRX Well TM design is particularly well-suited for treatment of large dilute plumes using activated carbon and in situ regeneration using activated persulfate delivered to the well. The use of the HRX Well TM containing activated carbon and regeneration with activated persulfate are synergistic in that carbon avoids the high cost and energy/labor intensity of treating large areas or volumes of dilute contaminant. The HRX Well TM configuration allows for both processes to occur in situ, serving as an efficient and predictable reactor. The packing of the carbon in the well promotes reaction at the carbon-water interface and the well can be designed to achieve target residence times for optimal treatment. The oxidation reaction is isolated from surrounding aquifer soil; therefore, costly nonproductive interactions of oxidant with the soil are avoided. Furthermore, the use of oxidant avoids the risk and costs associated with managing hazardous waste concentrated on carbon solids above ground. 11
36 Furthermore, it may be beneficial to couple chemical oxidative processes with other treatment processes to optimize treatment of PFAS and associated co-contaminants. Due to the complexity of AFFF formulations, presence of co-contaminants, and distribution in the environment, no single treatment technology will fully manage all such contaminants of concern at DoD sites. An important objective of this research is to identify oxidation intermediates and byproducts toward understanding any limitations of ISCO and the need for additional coupled processes, including aerobic or anaerobic bioprocesses, and the amenability of intermediates and byproducts to biological or chemical reductive treatment using computer-based prediction tools SORPTION OF PFAS AND CO-CONTAMINANTS Sorption of PFAS onto Activated Carbon The expense of treating large sites can be reduced by choosing low cost and readily available carbon sources. Therefore, in the context of in situ groundwater treatment with an approach like ISCO-SC, adsorption by inexpensive and commercially available activated carbon appears to be one of the most viable options for PFAS removal. Most of the PFAS sorption research has investigated sorption of perfluorooctonoic acid (PFOA) and perfluorooctanesulfonic acid (PFOS), although more recent work has also investigated PFAS precursors (Eschauzier et al., 2012). Both powdered activated carbon (PAC) and granular activated carbon (GAC) have relatively high affinity for PFOS and PFOA. Researchers have demonstrated that activated carbon may be less effective for shorter chain PFAS (Ochoa-Herrera and Sierra-Alvarez 2008; Eschauzier et al., 2012). Carbons from different sources exhibit varying sorption capacities and rates due to differences in the bulk surface area of materials and the surface area of the material s micropores (Yu et al., 2009). PFAS sorption onto activated carbon occurs mainly through hydrophobic interactions, although electrostatic interactions between anionic PFAS and amphoteric carbon surfaces can be important (Du et al., 2014; Johnson et al., 2007). As a result, PFAS-carbon sorption capacities depend on carbon characteristics (e.g., porosity, surface area, point-of-zero-charge ph (phpzc)), and water chemistry (e.g., ph, ionic strength). Several studies have reported that PFAS can form micelles at the surfaces of activated carbon, which may facilitate sorption due to sorbate-sorbate hydrophobic interactions, even when present at concentrations less than the critical micelle concentration (Johnson et al., 2007; Yu et al., 2009; Zhou et al., 2010a). Selection of an appropriate carbon source for treating PFAS is important because of the unique chemical properties and combined sorption/exchange behavior of PFAS and co-contaminants, coupled with the complex geochemical conditions of groundwater. Because of extensive surface area, properly developed microporous structure and presence of a vast range of surface functional groups, activated carbon has unique adsorption properties, and is an effective adsorbent for the removal of various organic and inorganic contaminants (Yin et al., 2007; Zhi and Liu, 2016). Activated carbon can be produced from various carbonaceous materials, including wood, coal, lignin, coconut shells, and sugar (Zhi & Liu, 2016). Physical properties, as well as chemical properties of activated carbon, play an important role in adsorption. The activated carbon structure consists of carbon atoms which are arranged in parallel stacks of hexagonal layers that are crossed linked and tetrahedrally bonded (Karanfil & Kilduff, 1999). Highly reactive sites are available at the edges and where there are discontinuities in the 12
37 activated carbon structure. These active centers contain carbon atoms with unpaired electrons and unsaturated valences that can chemically interact with different heteroatoms such as oxygen, hydrogen, nitrogen, and sulfur as single atoms or surface functional groups which are responsible for the surface reactivity (Karanfil & Kilduff, 1999; Marsh & Rodrigues-Reinoso, 2006). Oxygen is the most important heteroatom in the carbon structure which arises from the raw materials and from chemisorption of oxygen during the activation process. Carboxyl, carbonyl, phenols, enols, lactones, and quinones are some of the oxygen-containing functional groups suggested as present in the carbon structure (Karanfil and Kilduff, 1999; Marsh and Rodrigues- Reinoso, 2006; Roque-Malherbe, 2010). There are three types of oxygen-containing surface groups in activated carbon which are acidic, basic and neutral. Acidic groups include carboxyl, lactone and phenol, and basicity is linked with pyrone, ether and carbonyl groups (Marsh and Rodrigues-Reinoso, 2006; Yin et al., 2007; Roque-Malherbe, 2010). The neutral functional groups arise during irreversible chemisorption of oxygen at the ethylene type unsaturated sites on the carbon structure (Marsh & Rodrigues-Reinoso, 2006). Furthermore, activated carbon surfaces contain minerals such as calcium, sulfate, and phosphate ions, which have an influence on the adsorption capacities as well as surface properties such as zeta potential and specific surface area (Julien et al., 1998; Marsh and Rodrigues-Reinoso, 2006) Enhancement of PFAS Sorption onto Activated Carbon Weak interactions between PFAS and the surface of GAC is the key factor that may limit the treatment efficiency. Therefore, approaches to improve the affinity of PFAS for GAC may be beneficial for both effective and economical treatment of PFAS (Zhi & Liu, 2016). Recent studies have focused on modifying the specific properties of activated carbon in order to enhance its effectiveness and develop affinity of activated carbon for certain contaminants (Karanfil and Kilduff, 1999; Babel and Kurniawan, 2004; Goel et al., 2005; Huling et al., 2005; Huling et al., 2007; Yin et al., 2007; Huling et al., 2009; Kan and Huling, 2009; Zhi and Liu, 2016). For example, detailed investigations have been carried out with acidic treatment to introduce acidic functional groups onto the surfaces of activated carbon, because it has been found to be the main factor that control the uptake of metal ions (Karanfil and Kilduff, 1999; Yin et al., 2007; Huling et al., 2009; Kan and Huling, 2009). It is necessary to understand the various factors that influence the adsorption capacity of AC before the modification. Sorption affinity for the surface of an adsorbate depends on the physical characteristics of carbon such as specific surface area, pore size distribution, pore volume; chemical characteristics such as presence of surface functional groups; as well as the chemical structure of the sorbate (Karanfil and Kilduff, 1999; Yin et al., 2007). The type of raw material used, the degree of activation during the production stage, and the frequency of regeneration determine the composition of the activated carbon (Yin et al., 2007). According to the literature, carbon modification techniques are categorized into three main groups including chemical, physical, and biological modifications. These modifications are further divided into subgroups according to the available treatment techniques. Treatment with acid, base, and impregnation of foreign material are chemical modification techniques (Karanfil and Kilduff, 1999; Yin et al., 2007). Acid treatment increases acidic functional groups on the GAC surface as well as enhances chelation ability with metal species. On the other hand, disadvantages include decreasing BET surface area and pore volume, which have an adverse 13
38 effect on uptake of organics and give off undesired gasses (SO2-treatment with H2SO4, NO2- treatment with HNO3). Basic treatment enhances uptake of organics and decreases the uptake of metal ions sometimes due to the decrease of specific surface area or micropore volume (Yin et al., 2007). Impregnation of foreign material such as metals or polymeric materials enhances the built-in catalytic oxidation capability and may decrease BET surface area and pore volume. Physical modification includes heat, which may increase BET surface area and pore volume and decrease oxygen-containing surface functional groups (Yin et al., 2007). These modifications may change surface reactivity as well as structural and chemical properties of the carbon, and treatment to improve the chemical characteristics of activated carbon may, on the downside, adversely affect its physical characteristics or vice versa (Yin et al., 2007). In spite of the fact that availability of active sites with functional groups have a small contribution compared to total surface area, a large influence on sorption capacity can result from a small change in surface chemistry (Marsh & Rodrigues-Reinoso, 2006) DESTRUCTION OF PFAS USING PERSULFATE OXIDATION Once the activated carbon media in ISCO-SC treatment train is exhausted with PFAS contaminants (reaching saturation or near saturation), the bed needs to be replaced or recharged in situ. The GAC recharging process is a regeneration step, which is technically and economically feasible using determined free radical oxidation-reduction chain reactions. The goal of GAC regeneration using persulfate oxidation includes successful breakdown of PFAS sorbed on GAC and simultaneous reactivation of porous surface for next adsorption cycle and potentially towards sustainable and long-term operation of ISCO-SC for treating PFAS contaminated groundwater Persulfate Chemistry Persulfate (S2O8 2- ) anion oxidant is formed following the aqueous dissociation of sodium persulfate. Sodium persulfate is relatively low cost and has higher solubility and stability in aqueous phase than its other salt forms that form complexes with hydrolyzed perfluorinated compounds (Siegrist et al., 2011). Upon activation in the aqueous phase, persulfate is consumed rapidly to produce reactive free radicals that are nonspecific in nature and attack a broad range of contaminant species through direct electron transfer reactions. Kinetics of reaction between persulfate and target compounds are complex but are assumed as first order (Peyton, 1993; Johnson et al., 2008) and pseudo first order (Liu et al., 2012; Park et al., 2016). Compared to other advanced oxidation processes, activation of persulfate is slower and takes a longer time under normal environmental conditions. Slower activation rates are considered advantageous because it makes oxidant remain for a prolonged duration of contact with targeted compounds. In reality, the activation rate is a function of ph, temperature, salinity and other species concentrations (Krembs et al., 2010; Siegrist et al., 2011). Generally, persulfate can be activated through different methods. Each activation method involves a different reaction mechanism, and each reaction mechanism produces different reactive ions (Tsitonaki et al., 2010). Selection of the right activation method is essential to produce the desired reactive species that further results in thermodynamically favorable oxidative degradation of contaminants (Siegrist et al., 2011). The major free radical species that are produced because of persulfate anion activation are sulfate radical (SO4 - ) and hydroxyl radical (HO - ), and both are spontaneously produced and rapidly 14
39 consumed. Sulfate radicals are active in the acidic region, whereas the hydroxyl radicals are active when ph is greater than 11 (Lee et al., 2015). According to previous studies, sulfate radicals as stable reactive species are capable of degrading a large class of recalcitrant compounds including long-chain perfluorinated substance (Lee et al., 2012; Park et al., 2016). Also, unlike other species, persulfate precursors or sulfate radicals with more stable half-life are transported to greater distance and create a large radius of treatment ( Siegrist et al., 2011; Monteagudo et al., 2015) Persulfate Activation for PFAS Degradation Different persulfate activation methods include the use of transition metals, hydrogen peroxide, alkaline ph, UV/VUV irradiation, ultrasound or microwave, and heat (Tsitonaki et al., 2010). Activation involving redox reactions of transition metals like ferrous iron or chelated iron or using other reagents like hydrogen peroxide are typical one-electron transfer reactions that produce a mixture of sulfate radical (SO4 - ) and sulfate anion (SO4 2- ) as represented by Equation 2.1. The iron precipitates as result of activation can accumulate on the GAC surface and decreases the active surface area (Hutson et al., 2012; Zhong et al., 2015), while the activation mechanism using hydrogen peroxide or peroxone usually results in aggressive precipitation reactions (Zhao et al., 2013), hence both activation methods are considered unsuitable for ISCO- SC. Alkaline ph activation by maintaining ph > 11, is favorable for producing hydroxyl radicals utilizing sulfate radical (Equation 2.2), but hydroxyl radicals are not desired for degradation of PFAS (Vecitis et al., 2009). S2O e - SO SO4 - Eq. 2.1 SO4 - + OH - HO - + SO4 2- Eq. 2.2 Even though photolytic persulfate activation using UV source, ultrasound and microwave has shown success in yielding the same or even lesser PFAS degradation than thermally activated persulfate in the laboratory, it is still considered relatively expensive compared to simple costeffective thermal activation method (Giri et al., 2011; Tang et al., 2012; Yang et al., 2013; Park et al., 2016). Experimentally, the percent degradation of PFOA and PFOS employing different persulfate activation methods was tested in the aqueous medium in preliminary experiments, and according to the observed results in Appendix A.4. the thermally/heat activated persulfate showed the highest degradation compared to other persulfate-activator combinations. Heat activated persulfate oxidation produces two sulfate radicals because of the electron transfer reactions as shown in Equation 2.3. Persulfate decomposition reaction steps are a total function of supplied energy. With increasing temperature or energy supply, the activation rate increases, and the persulfate half-life decreases. Further, heat activated persulfate gives rise to a large pool of sulfate radicals that are essential for degradation of PFAS compounds (Peyton, 1993; Xu et al., 2014). At the same time, heat activation may also lead to a very aggressive oxidizing environment. Accelerating the oxidation rate with increasing supplied heat, non-essential side reactions between contaminant, radicals, and other chemical species start to occur simultaneously at an increasing rate. An example is hydrolysis of sulfate radicals, which possibly occurs at all ph conditions, generating sulfate anions of lesser electrode potential utilizing sulfate 15
40 radicals (Equation 2.4), and creating a drop in ph to a very acidic level as a result of constant accumulation of hydrogen ions (Siegrist et al., 2011; McKenzie et al., 2015). S2O e - 2 SO4 - Eq. 2.3 SO4 - + H2O HO - + SO H + Eq. 2.4 Direct heat on PFAS might weaken the chemical bonds in perfluorinated chain and aid during sulfate radicals attack on PFAS (C. S. Liu et al., 2012). Drop in aqueous system ph is typical during activated persulfate oxidation. Although lower ph encourages unfavorable radical-radical interaction according to Arrhenius law on activation energies, during PFAS aqueous phase PFAS oxidation using heat activated persulfate ph effects were seen insignificant (Hori et al., 2005, 2008; C. S. Liu et al., 2012; Yang et al., 2013). Acidic ph breaks biphasic behavior of PFAS and keep them well dissolved, while high temperature heightens the diffusional transport rate of sorbed PFAS compounds from the interior of GAC to the exterior (Hutson et al., 2012). Thus acidic ph and high temperature conditions were assumed to favor the PFAS degradation by creating a greater contact between sulfate radicals and contaminants (Hutson et al., 2012) Persulfate Oxidation of PFAS Previous degradation studies utilizing heat activated persulfate have largely focused on environmentally stable PFOA, PFOS and other C4 C8 chain length perfluorinated compounds. As result of acid hydrolysis, PFOA and PFOS compounds present as ionic compounds in aqueous solution. According to Liu et al. (2012), the sulfate radical species first target the functional group attached to PFAS compound to produce an unstable perfluorinated radical. In extension, the unstable perfluorinated radical again gets hydrolyzed and then starts to transform to form shorter chain homologues, step-by-step in sequence by losing a CF2 every time until compounds get completely mineralized to form fluoride (F - ) under the influence of free radical reactants. Sulfate radical reactions and hydrolysis of the perfluorinated chain following functional group detachment were the two important steps involved in deflourination. Formation of shorter chain length compounds and subsequent degradation was observed along the experimental reaction period (C. S. Liu et al., 2012), but it is still not evident that degradation follows that procedure. In the perfluorinated carbon tail, C-C bonds (100 kcal/mol) are prone to termination before C-F bonds (120 kcal/mol) (C. D. Vecitis et al., 2009). So, a possibility is long chain PFAS may also break to form different shorter chain intermediates rather than the slow sequential unzipping of CF2. Table 2.1 provides a brief literature review on the use of persulfate oxidation for degradation of PFOA and PFOS. Complete decomposition of PFOA with a defluorination efficiency of around 67% was observed within 72 hours at 40 C using UV-radiated or heat-activated persulfate (Lee et al., 2012); while, around 93% of PFOA decomposition and 43% of fluoride yield was observed after 30 hours at 85 C using heat-activated persulfate (Liu et al., 2012). In both cases, a larger percentage of intermediate and shorter chain perfluoroalkane compounds [CnF2n+1H, (n = 4-6)] with/without carboxylic head groups were observed during reaction period. Major possible intermediates during PFOS degradation include PFOA (perfluorooctanoic acid), PFHpA (perfluoroheptanoic acid), PFHxS (perfluorohexanesulfonate), PFHxA (perfluorohexanoic acid), 16
41 PFPeA (perfluoropentanoic acid), PFBS (perfluorobutanesulfonate), and PFBA (perfluorobutanoic acid). Major possible intermediates during PFOA degradation include PFHpA, PFHxA, PFPeA, and PFBA. Regarding temperature effects, PFOA oxidation defluorination rates were found significantly lower below 80 C, and while at a higher temperature like 150 C, the oxidation reactions were inhibited (Hori et al., 2008). The process of choosing the optimum oxidant dose relies on the concentrations and properties of heterogeneous mixture of PFAS and co-contaminants. For instance, the PFAS moiety compounds like PFOA and PFOS coexist along co-contaminants in groundwater. Thus, the selected oxidant dose should produce sufficient sulfate radical concentration that not just treat PFOA but also can efficiently treat the co-contaminant compounds PFOS. Free radical degradation chemistry does not necessarily have to be stoichiometric, but the optimum oxidant loading rate for efficient removal of contaminants must be achieved to save energy and resources. According to Huling et al. (2011), treatment of compounds sorbed onto GAC using activated persulfate can be enhanced using more frequent and lower volume delivery of high concentration oxidant, however, it does not confirm for PFAS. To date there has been no documented comprehensive comparative evaluation of the effectiveness of activated persulfate oxidation approach for the treatment of PFAS sorbed GAC. While the feasibility of regenerating GAC and destroying sorbed contaminants has been established for many compounds (Kan & Huling, 2009; Huling et al., 2009, 2011; Hutson et al., 2012; Anfruns et al., 2013; An et al., 2015), there has been no evaluation of the approach for PFAS. Table 2.1. Previously reported aqueous based PFAS degradation using activated persulfate Condition Concentrations Observed Results Reference PFOA and short-chain PFASAs degradation using thermally activated persulfate (80 C) PFOA (374 µm), persulfate (50 mm) Complete decomposition with F - recovery of 77 to 88 % (Hori et al., 2008) PFOA degradation using thermally activated persulfate (20-40 C) PFOA degradation using thermally activated persulfate (85 C, buffered to ph 7.1) PFOA degradation using thermally activated persulfate (60 C) PFOS degradation using UV activated persulfate (20 C) PFOA (241.5 µm), persulfate ( mm) PFOA (0.5 nm), persulfate (10 mm), PFOA (24 µm), PFOS (0.92 µm), persulfate (42-84 mm) PFOS (0.186 mm), persulfate (18.5 mm) Complete decomposition after 72 h at 40 C (67 % F - yield), and after 215 hours at 30 C (69 % F - yield) 93.5% decomposition with 43.6% F - yield within 30 hours Complete decomposition of PFOA even under the presence BTEX; no breakdown of PFOS was recorded Around 65 to 85 % of defluorination was observed (Lee et al., 2012) (Liu et al., 2012) (Park et al., 2016) (Yang et al., 2013) 17
42 2.7. COMPUTER-BASED PREDICTION OF PFAS DEGRADATION Microbial transformation studies of PFAS and their breakdown products are important. While biological experiments are expensive and beyond the scope of this study, there are several computer-based prediction tools that are used to evaluate breakdown and transformation products of PFAS and their potential biodegradability. For example, the Meta-PC software (developed by MultiCASE Inc., Cleveland, OH, USA) rule-based algorithm, can predict breakdown products based on compound structure recognition. Prediction tools are cost-effective and less time consuming compared to laboratory studies that require complex experimental and analytical procedures. They can provide an understanding of the biodegradation process of chemical compounds. Previous research has attempted to simulate the degradation of PFOS and PFOA into non-toxic shorter chain compounds and byproducts, however, PFOS is exceptionally stable and total degradation methods have been minimally successful. Meta program tool can potentially narrow the range of possible treatment options by using a computer program and to simulate degradation pathways that can be mimicked first ex situ and then further developed for in situ applications. In this study, it is used to predict the potential PFOS degradation pathways and analyze the need of additional coupled processes in association with ISCO-SC. The Meta-PC software tool was developed for pharmaceutical research to evaluate degradation of drugs in various systems. Meta-PC specifically predicts degradation pathways via mammalian metabolism, anaerobic and aerobic processes, and photo-degradation. The software uses dictionaries containing varying numbers of possible transformation reactions. Software development included the process of training the program to recognize most probable reactants and to generate the metabolite. An algorithm compares the chemical input to the selected dictionary and modifies the substrate as needed to give possible products. Possible transformation reactions are the output result along with a rule number and reference(s). The rule number corresponds to the length of time for the reaction to occur and thus the likelihood of occurrence. The reference is the primary literature reference that provides details of the reaction (Meta-PC). The reactions considered depend on the dictionary selected (Klopman et al., 1994). Anaerobic and aerobic dictionaries consider bacterial metabolism reactions. Photo degradation encompasses reactions catalyzed by energy from varying wavelengths. Mammalian metabolism considers reaction catalyzed by enzymes and other components of mammalian metabolism. 18
43 3.1. APPROACH 3.0 MATERIALS AND METHODS A combination of batch reactor systems and 1-D and 2-D transport systems were employed to meet this project s objectives, as summarized in Table 3.1. Table 3.1. Research objectives and experimental systems Objective Reaction System Notes Validate of HRX Well TM 2-D flow-through tank Related to, but not funded by concept evaluations; computer-based this project specifically Characterize sorption of PFAS and Co-contaminants onto GAC Determine influence of groundwater conditions on sorption of PFAS Enhance sorption of PFAS onto GAC Measure PFAS destruction rate and extent using heat-activated persulfate Determine potential to treat and regenerate field GAC containing sorbed PFAS using heatactivated persulfate Evaluate potential for natural degradation of PFAS oxidation byproducts simulations Batch reactor systems Batch reactor systems Batch reactor systems Batch reactor systems Equilibrium sorption*; variations in PFAS type, carbon type, PFAS individually present vs mixture, presence of cocontaminants Equilibrium sorption*; variations in organic carbon concentration, presence of ironbased solids, ph, sulfate concentration Pre-treated GAC with acid, base, catalyzed hydrogen peroxide, heat-activated persulfate Conducted without GAC and with GAC containing sorbed PFAS 1-D flow-through column tests Two types of spent field GAC obtained from PFAS treatment site Computer-based simulation Meta-PC software *Note: The HRX Well TM concept applied in situ would involve a long duration of contact between GAC and contaminated water, thus equilibrium sorption is assumed and applied 3.2. MATERIALS AND METHODS COMMON TO MULTIPLE EXPERIMENTS Chemicals and Materials All chemicals used in this study were reagent grade. All solutions were prepared with deionized water or Milli-Q ultrapure. Sodium persulfate (S2O8 2- >98%) and sodium sulfate (Na2SO4 >99%) were obtained from Sigma-Aldrich Co. Four perfluoroalkyl acids, including perfluorooctanoic acid (PFOA, C8F15HO2, 98%), perfluorooctanesufonic acid (PFOS, C8HF17O3S, 98%), perfluorohexanesulfonic acid potassium salt (PFHxS, C6F13KO3S, 98%) and perfluorobutanesulfonic acid (PFBS, C4HF9O3S, 97%) were obtained from Sigma-Aldrich Co. 19
44 Linear perfluoroalkylcarboxylic acids and sulfonates were purchased from Wellington Laboratories (Guelph ON) and used for standards. They included: perfluoro-n-octanoic acid (PFOA), perfluoro-n-octanesulfonate (PFOS), perfluoro-n-hexanesulfonate (PFHxS) and perfluoro-n-butanesulfonate (PFBS) (Table 3.2). A series of 13 C-labeled PFAS were used for quantification (internal) standards consisting of pefluoro-1-hexane[ 18 O2] sulfonate (MPFHxS), perfluoro-1-[1,2,3,4-13 C4] octane sulfonate (MPFOS), perfluoro-n-[1,2-13 C2] hexanoic acid (MPFHxA) and perfluoro-n-[1,2,3,4-13 C4] octanoic acid (MPFOA). Stock solutions of each individual standard or mixtures supplied by the manufacturer were prepared by diluting the original in methanol (HPLC grade). All the original standards and stock solutions were stored in the refrigerator (~ 4 o C) in amber vials covered with aluminum foil. Table 3.2. Physicochemical properties of synthetic class of PFAS used in laboratory sorption and oxidation studies. PFAS Molecular Weight (g/mol) Molecular Volume b (cm 3 /mol) Water solubility (mg/l) at 25 0 C pk a Log K ow c PFOA PFOS a a b,c,d PFHxS c,d 0.14 c,d 4.34 PFBS c,d 0.14 c,d 2.73 a USEPA (2016); b Yu et al. (2009); c Deng et al. (2012); d Du et al. (2014) Seven sources of granular activated carbon (GAC) including five coal-based GAC (F100, F200, F816, F400 and F300) and one coconut based GAC (CBC-OLC 12 30) were obtained from Calgon Carbon Corporation, and one coal based GAC (Omni-G 12 40) was obtained from Jacobi Carbon Corporation. Calgon Carbon Corporation Coal-based GAC are FILTRASORB, which are a pulverized blend of bituminous coals. Jacobi Carbon Corporation s coal based GAC is AquaSorb. Each carbon type was cleaned by first rinsing in deionized (DI) water three times, then washed in 80 o C DI water for 2 hours and finally oven dried at 105 o C for 48 hours. The dried carbon was crushed by mortar and pestle and passed through a mm sieve (Yu et al. 2009; Senevirathna et al. 2010a) Analytical Methods PFAS Sample Analysis. Aqueous based aliquots collected during isotherm sorption and persulfate oxidation experiments were first filtered through a 0.2 µm nylon syringe filter. The activated carbon samples were analyzed according to solvent based soil extraction procedure of Guelfo & Higgins, (2013). A state-of-the art PFAS analytical facility at Clarkson University was used to quantify both linear and branched PFAS in samples using liquid chromatography mass spectrometry (LC-MS/MS). Samples were diluted multiple-fold in HPLC-grade water to make samples concentrations to fall into linear range of calibration for better quantification of byproducts and intermediate PFAS compounds before analysis. At the final step, 0.1 ml of the diluted sample was added to a 2-mL vial and reconstituted with 2 ng (50 µl of 40 ng/ml) of injection standard, 450 µl of 100 % methanol, and 1 ml of HPLC grade water before injection Liquid Chromatography Mass Spectrometry (LC-MS) Instrument Setup. A Waters Acquity UPLC with a Xevo G2 QToF mass spectrometer was equipped with a 2.1 mm x 100 mm
45 Acquity HSS T3 1.8 µm column and 100 µl injection loop. All Teflon lines were replaced with Polyetheretherketone (PEEK) tubing. An isolator column was placed directly after the mobile phase mixing chamber but before the syringe to delay the elution of solvent derived background. Mobile phases consisted of 0.1% formic acid in water (A) and methanol (B) at a flow rate of ml/min. After full loop injection, the initial gradient, 75% A, was held for 1 minute, 40% A by 1.5 minute, 1% A by 9.5 minutes, 100% B by 9.6 minutes and held until 17.0, and returned to the initial composition of 75% A by 18.5 minutes. Flow was directed to waste during the column flush ( minutes) and re-equilibration to 75% A for 1 minute ( minutes) prior to the next run. The Xevo-QToF was set to negative polarity in sensitivity mode (>10,000 FWHM) with the extended dynamic range option selected. The capillary, sampling, and extraction cone voltages, source and desolvation temperatures were set to 1.9kV, 60V, 4.0V, 120 C and 250 C, respectively, with a desolvation gas flow of 750 L/h. The QToF was alternated between 3 data acquisition functions (MSe), to simultaneously collect (1) a low energy scan consistent with a standard time-of-flight spectrum from 50 to 1000 Da (F1), (2) a highenergy scan (F2) applying a collision energy ramped from 15 to 35 ev using argon as a collision gas, and (3) lock mass utilizing fragments and m/z of leucine enkephalin. The first two functions provide complementary spectra for a given peak, creating typical precursor ion fragments (F1) and potential product ions (F2) during a given run. Applying collision energy, the second function further fragments parent ions relative to F1 providing a simultaneous high-resolution precursor (F1) and product (F2) characterization or confirmation of the compound of interest. The QToF was calibrated daily using sodium formate clusters ( m/z). Quantification was performed using the most abundant fragment ion in the first function (F1). Crimmins et al. (2014) has shown that the parent [M]- and the parent minus CO2 ([M-CO2] - ) was observed for the carboxylic acids. The lower molecular weight homologues were decarboxylated in the first function. The molecular ion was the dominant species for sulfonates. Applying a collision energy in the second function produced [M] - as the primary fragment for the sulfonates, however it will be a minor component for all the carboxylic acids. In addition, the linear carboxylate F2 spectra exhibit a predictable CnF2n+1 series of 2 < n < (x 3), where x is the number of carbons in the linear PFAA. The linear range of this methodology spans more than three orders of magnitude ( pg on column) with correlation coefficients greater than 0.98 (typically > 0.99) using an inverse weighting function. Since this is time-of-flight instrument unknown compounds in the chromatogram were analyzed in the same way, yielding parent and product (F2) characterization allowing break-down products to be identified. Parent PFAS metabolites, isomers or structurally similar impurities were screened using the fragmentation patterns as defined in Crimmins et al., (2014). The configuration of the Xevo G2 QToF provides the most effective platform for quantitative and qualitative screening for perfluorinated species efficiently performing multiple experiments in one run generating searchable spectral databases for non-targeted analysis ph and Inorganic Compounds Analysis. Fisher Scientific Accumet Excel XL 60 device setup comprised of ph and fluoride ion selective electrodes was used to measure ph and fluoride (Moody & Field, 2000; Rodriguez-Freire et al., 2015; Park et al., 2016). Persulfate concentration was quantified employing absorbance spectrophotometry (HACH DR5000) based Ferrous Ammonium Sulfate method (Huang et al., 2005; D. Zhao et al., 2013). Sulfate concentration 21
46 was measured using HACH TNT-plus sulfate test kit in HACH DR5000 UV-Vis spectrophotometer (Richard L. Johnson et al., 2008). During fluoride analysis, first the samples were mixed with TISAB (total ionic strength adjuster buffer) solution in 1:1 (v/v) ratio and measured for mv (millivolt potential). Next by using prepared calibration curve (ppm vs mv), the fluoride concentration in samples was determined Characterization of granular activated carbon. Characterization of GAC was carried out to understand what factors relate to measured differences on sorption of PFAS in treated and untreated GAC. The BET surface areas of the granular activated carbons were measured by gas adsorption isotherms by a volumetric method using a Micromeritics ASAP2020 surface area and pore analyzer. The ph drift method was used to determine the ph at point of zero charge (phpzc) (Kan & Huling, 2009). Fifty milliliters of 0.01 M NaCl solution was placed in 100 ml amber vials. The ph was adjusted to each value between 2 and 9 with 0.1 M HCl or 0.1 M NaOH solutions and nitrogen was sparged through the solution to stabilize the ph by preventing the dissolution of CO2. Then, 0.15 g of GAC was added to the solution and the vial was capped immediately. The equilibrium solution ph was measured after 48 hours and plotted versus the initial ph. The ph at which the curve crossed the line phinitial = phfinal was taken as the point of zero charge (Kan & Huling, 2009). Scanning Electron Microscopy (SEM) was used to examine the morphology of the treated and untreated GAC. The specimens were examined under the secondary electron imaging (SEI) mode using a JEOL JSM-7400F electron microscope coupled with an Energy Dispersive X-Ray Detector (EDX). The lower electron image (LEI) detector was used for taking images. The composition of the solids was evaluated by transmission fourier transform infrared (FTIR) spectra obtained with a BRUKER Vector 22 spectrophotometer GAC Solvent Extraction. Sample extractions were conducted to determine the mass change of PFAS sorbed onto GAC. The extraction method involved repeated extractions of the GAC sediment using a solvent mixture of 99:1 (v/v) methanol and ammonium hydroxide (Guelfo and Higgins 2013). Extractions were performed on a rotator at 60 rpm for a period of 5 days. Homogenized GAC sample containing sorbed PFAS was weighed into a 50-mL polypropylene vial, to which 9.9 ml of methanol and 0.1 ml of ammonium hydroxide was added. After rotating for 5 days, vials were vortexed and placed in a preheated ultrasonic bath at 30 for 1 h. The vials were then removed from the ultrasonic bath and placed on a shaker table for 2 h, then centrifuged at 2700 rpm for 20 min and extracts was decanted into a 15-mL polypropylene vial. This procedure was conducted thrice and performed in duplicates. Prior to analysis for PFAS, extracts were filtered through a 0.2 µm nylon syringe filter to remove any suspended particles. The PFAS concentration in the extracts was determined using a highperformance liquid chromatograph coupled with tandem mass spectrometry (HPLC MS/MS) and quantified using internal standard calibration curves of concentrations , 2, 10 and 20 ng/ml. 22
47 3.3. LABORATORY TESTING AND VALIDATION OF THE HRX WELL TM Materials in Laboratory HRX Well TM Construction A physical model of a HRX Well TM treatment system was constructed within a 55-gallon metal drum (33.5" tall, 22.5" diameter), containing a one-inch well. Easily sourced materials were chosen with an effort to simplify construction and reduce overall costs (Table 3.3). Table 3.3. List of materials used in construction and validation of laboratory HRX Well TM Pipe Fittings (PVC components) Units Bulkhead fittings 6 45 degree elbow 2 90 degree elbow 1 PVC pipe 1 x 3-ft 1" screened well* 1 x 3-ft Plug 1 Roll of geo-membrane (landscaping fabric) 1 Standard garden hoses 1 x 25-foot Female to female GHT fittings 2 Female to male GHT fittings 2 5-gallon plastic container 1 x 5-gallon Tygon tubing 300-ft Polypropylene pipette tips 50 Tape measure 1 x 10-foot Aquifer and In-well Media Quantity Playground sand (Source: The Home Deport 700 lbs Gravel 150 lbs Calgon Filtrasorb ml (v) Calgon Filtrasorb ml (v) Lima soda beds 2.0 mm to 3.5 mm 500 ml (v) Pea gravel 500 ml (v) Aquarium gravel 500 ml (v) Chemicals Quantity Methylene blue tracer (reagent grade dye) 20g Sodium chloride tracer (reagent grade) 100g *1" slotted screened well with slot width of inch (.15 mm) procured from ECT Manufacturing was used as a well Design Laboratory HRX Well TM Treatment System The laboratory horizontal well concept is based on differences in hydraulic conductivity (k) as shown in the simple illustration by Fetter, (2001) (Figure 3.1), where the experiments were designed for constant head flow in according to Darcy s law. The velocity of water flow into the 23

48 aquifer and well system was measured by evaluating the percentage capture of water, while tracer tests were performed to measure the velocity within the aquifer and the well. The well was packed with various media having a range of hydraulic conductivities, and the head applied to the system was varied by changing the height of the overhead water supply tank. Figure 3.1. Model of constant head method for hydraulic conductivity measurement (Fetter, 2001). A total of four bulkhead fittings were installed in the drum; two near the bottom and two near the top. The screened well was suspended from one of the top bulkheads (top-right) by a nonscreened PVC pipe that serves as the outlet for the water captured by the well. The well was also connected to a bulkhead fitting near the bottom of the drum (bottom-left). This fitting was plugged during normal operation and was used to change the media inside the well. The other bottom bulkhead (bottom-right) fitting serves as the inlet for the water from the wall mounted supply tank. The final top bulkhead fitting on the drum (top-left) serves as an outlet for water flowing through the aquifer (i.e. water that is not captured by the well), and it was located exactly opposite the outlet for the well and was at the same height to ensure that water flow is not affected (Figures 3.2 and 3.3). 24
 (b)")

. (a) (b) Figure 3.")
49 Materials/Construction 55 gallon drum Tank mounted to wall Aquifer Material 1 screened PVC well Garden hose Geo-membrane Gravel Bulkhead fitting (a) (b) Figure 3.2. Schematics of physical model of laboratory HRX Well TM with diagrams indicating the placement of well within drum (a), water tank (a), and aquifer drum (b). (a) (b) Figure 3.3. (a) Schematic diagram of the laboratory physical model of HRX Well TM, and (b) a picture of HRX Well TM installed within a drum. 25

 to easily flow into the")
50 While constructing the HRX Well TM laboratory tank system, first 1 of gravel was laid in the bottom of the drum. The gravel allows the water entering the drum from the water supply tank to evenly disperse throughout the bottom of the drum ensuring uniform flow of water throughout the aquifer cross-section. A geo-membrane was installed above the gravel to prevent sand from the aquifer infiltrating the gravel. An approximately 29 of sand was filled over the geomembrane to serve as an aquifer material. Another layer of geo-membrane was placed on the top of the aquifer sand and then 3 of gravel was filled to allow the water raise from aquifer (water not captured by the well) to easily flow into the aquifer outlet. The water supply tank (an overhead 5-gallon plastic container) was installed with a bulkhead fitting to allow the water to flow from it to the water inlet on the drum. A second bulkhead fitting was installed in the side of the container to serve as the overflow and to maintain a constant head on the system. Standard garden hoses were used to connect the water supply tank to the drum. Figure 3.4 shows the final constructed tank system. Figure 3.4. Completed model with drum, water supply tank, and manometer rack Hydraulic Conductivity Measurements Due to the importance of hydraulic conductivities (KK) to the HRX Well TM concept, precautions were taken while calculating and measuring the KK values of the various media used in aquifer and the well. The aquifer consists of common playground sand and was held constant in all tests. The KK value of the well was varied by changing the in-well media. The hydraulic conductivities of each media in the lab was measured and ensured to fall within commonly accepted range of values presented by Bear (1972). 26
51 An instrument to conduct falling head and permeameter tests on materials to measure KK values was developed based on Equation 3.1 (Fetter, 2001). All media were measured with the same device to assure consistency. The device consisted of a 48 section of clear, 1.5 PVC pipe with a PVC, ¼ turn ball valve at the bottom. The column was marked at specified heights using plastic zip ties. KK = 2.3aaaa log ( h 1 ) Eq. 3.1 AAAA h 2 Where, KK = hydraulic conductivity, aa = the cross-sectional area of the water column, ll = the thickness of the sample, AA = the cross-sectional area of the sample, h 1 = Initial height of water column, h 2 = ending height of water column, tt = time it takes the water level to fall from h 1 to h Selection Criteria for Aquifer and Well Media Drum (Aquifer) Gravel. Gravel (½ to ¾ ) was chosen to ensure minimal impedance to water flow. Gravel was placed in the bottom of the well with the intent to allow the water from the supply tank to quickly disperse throughout the drum and facilitate even flow and head throughout the cross section of the aquifer. At the top of the drum, the intent of the gravel use was to allow water from the aquifer (water not captured by the well) to quickly flow to the aquifer outlet Sand. To represent the aquifer, Quickrete Premium Play Sand purchased from Home Depot was used. There were many reasons why sand was selected for aquifer media 1) sand media would have high enough hydraulic conductivity to allow enough water through that we could easily measure the output and allowed the system to come to equilibrium as soon as possible, 2) the aquifer had to have a low enough hydraulic conductivity that could create a range of ratios of KK values (KK rrrrrrrrrr ) with in-well media, and 3) sand is relatively easy to pack in the drum and has a low uniformity coefficient that is conducive to uniform flow throughout Granular Activated Carbon (GAC). GAC was utilized as in-well media to perform nonconservative tracer tests. We selected two different types of GAC for experiments; Calgon Filtrasorb-400 (F400) and Calgon Filtrasorb-816 (F816). F400 was relatively small with an effective size of mm and represents the lowest expected in-well hydraulic conductivity. F816 was larger with an effective size of mm. This provided a hydraulic conductivity that was of sufficient contrast to the aquifer and was closer to anticipated field conditions Well Gravel. Pea sized gravel (3/8 to ¼ ) was used as in-well media to have a large hydraulic conductivity in the well. Small gravel was likely to be used in field applications to achieve higher KK and to allow to explore a larger range of KK ratios Aquarium Gravel. The standard aquarium gravel used was smaller than the abovementioned well gravel. The selected gravel allowed to achieve hydraulic conductivity between the well gravel and the GAC and different KK ratio data. 27
52 Laboratory HRX Well TM Experimental Methods Experimental Set-up. The measurement of outflow from the well and aquifer enabled calculation of the percentage of introduced water captured by the well. A conservative salt (NaCl) tracer test was used to determine the velocity of the water in the well and in the aquifer and non-conservative (sorptive) methylene blue tracer test was conducted to find the effectiveness of the GAC in retarding and absorbing a contaminant. To run a test, the wall mounted supply tank was adjusted to apply a specified head to the system. The applied head was measured from the aquifer outlet to the water supply tank overflow (Figure 3.5). This measurement corresponds h as a constant head in Equation 3.1. Applied heads for all the tests include 24, 30, and 36. After the 36 test run, a continual flow of water was provided to the water supply tank. The water level in the water supply tank rose until it reached the intended applied head (i.e. the level of the overflow). When the water reached the overflow, the system was given several hours at steady state to ensure equilibrium throughout the system Experimental Test Runs. Initial runs were conducted with an empty well, and the percentage of water captured and breakthrough curves were developed with NaCl as a tracer at 24, 30, and 36 inches of applied head. Later, the same tests were conducted with the well filled with two types of GAC (Calgon Filtrasorb F816 and F400), pea gravel, and aquarium gravel. Finally, a tracer test was conducted with methylene blue at 24 of applied head with GAC in the well to demonstrate that the GAC within the well treated the water. A combined sorption and tracer test was also conducted with the well filled with GAC by simultaneously adding 20 g methylene blue and 100 g of NaCl to the water supply tank. Samples were collected from the aquifer, well, and overflow outlets and tested each using the Accumet conductivity electrode meter and a HACH DR5000 spectrophotometer at a wavelength of 668nm to determine the concentration of salt and methylene blue, respectively. To change out in-well media, first the pipe connecting the top of the well to the bulkhead was removed. Next the drain on the lower left side of the drum was removed and was fixed with the water hose to flush out the in-well media. For the larger media, it was sometimes necessary to insert a piece of wire into the drain to help dislodge the media. To pack the well, the connecting pipe and drain plug removed were fixed and media was directly added from top opening of the well. While adding the media, the drain was closely monitored to ensure that the media was filling the entire well. To easily fill in limesoda beads and GAC entirely into the well, their respective slurries were prepared and added to the well. A dowel rod was used to push the gravels in from the bottom to ensure that the well was packed correctly CHARECTERIZATION OF PFAS AND CO-CONTAMINANTS SORPTION Preliminary Sorption Isotherm Experiments Preliminary isotherm experiments were carried out to select the best performing GAC source for adsorption of PFAS. The initial concentration levels were high relative to the typical environmental concentration levels, but the main objective was to down select the best carbon sources based on performance. To determine the period to reach equilibrium concentration, preliminary sorption tests were carried out with three PFAS (PFOA, PFHxS, and PFBS) and five different GAC types (F100, F200, F300, F816, and F400). To perform this experiment, PFAS (500 mg/l) were sorbed onto the same mass of each GAC (100 mg) individually in 50 ml of DI 28
53 water in 50 ml polypropylene reactors. System ph was controlled at 7.2 with phosphate buffer. Then sample aliquots were collected at selected time periods and analyzed until they reached the equilibrium concentration of PFAS in solution. The key findings of the preliminary sorption experiments using one PFAS concentration and one GAC mass were then used to determine the conditions for follow-on preliminary sorption isotherm experiment, where carbon mass was varied. These preliminary isotherm experiments were conducted using PFOA, PFOS, PFHxS, and PFBS and three coal-based GAC (F400, F300, and Jacoby) and one coconut based GAC, in duplicate. Sorption of 500 mg/l of PFOA and PFHxS, 250 mg/l of PFOS and PFBS (due to dissolution limitations) onto five different carbon masses (0, 50, 75, 100, 125 and 150 mg) of each of the four carbon types was evaluated in 50 ml of deionized water in 50 ml polypropylene reactors. The sample ph was controlled around 7.2 using 0.1 M phosphate buffer. Reactors were tumbled at 145 rpm and sampled at 4 and 7 days. Samples were analyzed for PFAS as according to method mentioned in Section Isotherm Experiments Batch sorption experiments were carried out with 1 mg/l of PFOA and PFOS individually and in mixture, sorbed onto five different carbon masses (0, 5, 10, 15, 20 and 25 mg) of each F400 and coconut-based carbon (CBC) types. These samples were prepared in 125 ml of deionized water in 125 ml polypropylene reactors. The sample ph was controlled around 7.2 using 0.1M phosphate buffer. Reactors were tumbled at 145 rpm and sampled at 7 days (Table 3.4). Table 3.4. Isotherm experimental conditions Isotherm Experiments GAC PFAS Experiment Conditions F400 CBC 1 mg/l PFOA 1 mg/l PFOS 1 mg/l PFOA+ 1 mg/l PFOS GAC= 0, 5, 10,15, 20, 25 mg, V= 125 ml, t= 7 days, ph=7.2, phosphate buffer, 145 rpm Sorption of PFAS in presence of co-contaminants GAC PFAS Co-contaminants Experiment Conditions F mg/L Ker CBC 1 mg/l TCE 1 mg/l PFOA + 1 mg/l GAC= 0, 5, 15 mg, V= 125 ml, t= 7 days, ph=7.2 phosphate buffer, 145 rpm PFOS 1 mg/l Et Influence of groundwater conditions on sorption of PFAS GAC PFAS GW Conditions Experiment Conditions ph = 4 ph = 4 (0.1M CH 3 COOH/0.1 CH 3 COONa.3H 2 O) ph = 9 ph = 9 (0.05M NaHCO3/0.1M NaOH) F400 CBC 1 mg/l PFOA + 1 mg/l PFOS 10 mg/l SO mg/l DOC 1 mg/l DOC 0.5 mg Fe Sorption of PFAS in the Presence of Co-contaminants GAC= 0, 5, 15 mg, V= 125 ml, t= 7 days, 145 rpm, ph=7.2 phosphate buffer Sorption experiments were carried out in the presence of co-contaminants to determine their influence on sorption of PFAS onto GAC. Co-contaminants selected for study included kerosene (Ker) as a model fuel extinguished by AFFF, trichloroethylene (TCE) as a model solvent that can be present at AFFF sites, and ethanol (Et) as an AFFF additive. Experiments were carried out in 29
54 duplicate with a mixture of PFOA and PFOS and two types of GAC, F400 and CBC. Cocontaminants, 0.1 mg/l Ker, 1 mg/l TCE and 1 mg/l Et were added each separately. Sorption of 1 mg/l of each PFOA and PFOS mixture in the presence of co-contaminants onto two different carbon masses and a zero control (0, 5, and 15 mg) of each of the two carbon types were evaluated in 125 ml of deionized water in 125 ml polypropylene reactors. The two masses were selected in the range of isotherm experiments to compare the extent of sorption with isotherm results. The sample ph was controlled at 7.2 using 0.1M phosphate buffer. Reactors were tumbled at 145 rpm and sampled at 7 days (Table 3.4) Influence of Groundwater Conditions on Sorption of PFAS The same conditions used in the experiment of sorption of PFOA and PFOSs in the presence of co-contaminants were carried out with variations in total solids, ph, dissolved organic carbon (DOC), and competing anion (sulfate) to determine the influence of typical groundwater conditions on sorption of PFAS into GAC. Total solids were varied using iron-based solid (Fe2O3-0.5 mg as Fe +3 ) as a representative typical groundwater solid and as a competitor for GAC. ph was varied by adjusting the initial ph to 4 using acetic acid/sodium acetate buffer (0.1M CH3COOH/0.1M CH3COONa.3H2O) and ph 9 using sodium bicarbonate/sodium hydroxide buffer (0.05M NaHCO3/0.1M NaOH). DOC concentrations can vary in groundwater and hence two different magnitudes (0.1 and 1 mg/l), comparable to PFAS concentration, were evaluated using standard IHSS reference materials (Suwannee River Natural NOM-Humic acid standard II). The effect of dissolved anions on sorption was evaluated using sulfate anion (10 mg/l SO 4 2 from Na2SO4). Sorption of 1 mg/l of PFOA and PFOS at different groundwater conditions onto two different carbon masses including zero control (0, 5, and 15 mg) of each of the two carbon types were evaluated in 125 ml of deionized water in 125 ml polypropylene reactors for each variation in groundwater condition. The two masses were selected in the range of isotherm experiments to compare the extent of sorption with isotherm results. Reactors were tumbled at 145 rpm, and sampled at 7 days (Table 3.4) Sorption Isotherm Models The Langmuir isotherm model (Eq. 3.2 and Eq. 3.3) assumes formation of a monolayer adsorbate on the homogeneous outer surface of an adsorbent and constant sorbate affinity for all sites. Once a sorbate molecule occupies a site, no further sorption take place and maximum sorption capacity obtained when the sorption sites are saturated (Ochoa-Herrera and Sierra-Alvarez 2008; Hansen et al. 2010). QQ ee = QQ mm.kk LL.CC ee 1+KK LL CC ee Eq. 3.2 CC ee = 1 + CC ee Eq. 3.3 QQ ee KK LL QQ mm QQ mm Where QQ ee is the equilibrium solid concentration (mg PFAS/ g GAC), CC ee is the equilibrium concentration of the adsorbate (mg PFAS L 1 ). QQ mm and KK LL are Langmuir adsorption constants, where QQ mm is the maximum sorption capacity (mg/g) and KK LL is the sorption equilibrium constant (L/mg) (Ochoa-Herrera and Sierra-Alvarez 2008; Yu et al. 2009). The linear form of the Langmuir equation (Eq.3.3) was used to determine the Langmuir adsorption parameters. The 30
55 values of QQ mm and KK LL were calculated from the slope and intercept of the linear plot of CC ee /QQ ee versus CC ee (Eq. 3.3). The Freundlich isotherm (Eq. 3.4 and Eq. 3.5) is an empirical equation used to describe the multilayer adsorption characteristics for the heterogeneous surfaces including activated carbon, clays, metals, and polymers. This isotherm is widely used and is a more accurate approximation at adsorption process for many compounds in diluted solution (Ochoa-Herrera and Sierra- Alvarez, 2008; Hansen et al., 2010; Senevirathna et al., 2010a, 2010b). 1 QQ ee = KK FF. CC nn ee Eq. 3.4 LLLLLL QQ ee = LLLLLL KK FF + 1 nn LLLLLL CC ee Eq. 3.5 Where, KK FF is the Freundlich adsorption constant or sorption capacity factor [(mg PFAS g 1 sorbent) (mg PFAS L 1 ) n ], nn is the Freundlich exponent which represents the sorption intensity. The degree of nonlinearity of solution concentration and adsorption is indicated by n and when n = 1, the isotherm becomes linear and the partitioning between the two phases is independent of the concentration (Ochoa-Herrera and Sierra-Alvarez, 2008; Yu et al., 2009; Senevirathna et al., 2010b). The values of nn and KK FF were calculated from the slope and intercept of the linear plot of LLLLLL QQ ee versus LLLLLL CC ee (Eq. 3.5) ENHANCEMENT OF PFAS SORPTION ONTO ACTIVATED CARBON Treatment of Activated Carbon F400 and CBC were modified using catalyzed hydrogen peroxide, acid treatment, base treatment and heat activated persulfate treatment. One hundred milliliters of 1 M HCl, 100 ml of 1 M NaOH, and 100 ml of 10% solution of H2O2 and iron (III) perchlorate (10:1 ratio) were added to glass vials containing 2.5 g of GAC (F400 and CBC) separately. The containers were covered and kept at room temperature for 24 hours. For heat activated persulfate treatment, 0.1 g of Na2SO4 was dissolved in 100 ml of deionized water and added to glass vials containing 2.5 g of GAC and kept at oven at 80 0 C for 24 hours. After 24 hours, the excess solution was decanted, and the carbon was rinsed thoroughly with DI water three times and placed in the oven at C for 48 hours. Finally, treated GAC were used for adsorption experiments and the effect of treatment on the sorption of PFAS was evaluated after 2, 5, and 10 days the equilibrium aqueous concentration was reached Sorption of PFAS onto Treated Carbon Sorption of 1 mg/l of PFOA and PFHxS each in mixture with 10 mg of each of the two carbon types, both treated and untreated, were evaluated in 125 ml of deionized water in 125 ml polypropylene reactors. The sample ph was controlled around 7.2 using 0.1M phosphate buffer. Reactors were tumbled at 145 rpm and sampled at 2, 5 and 10 days. Samples were analyzed by ultra-performance liquid chromatography equipped with a quadrupole time-of-flight mass spectrometer (UPLC-QToF) as described in Section The amount of PFAS adsorbed by 31
56 each treated (T) and untreated (UT) GAC was calculated using the Eq. 3.6 and the percent different in sorption of treated GAC relative to untreated GAC was determined using Eq QQ = (CC CCCCCC CC ee )VV WW Eq. 3.6 % DDDDDDDDDDDDDDDDDDDD = QQ TT QQ UUUU QQ UUUU 100 Eq. 3.7 Where, QQ = the amount of solute adsorbed from the solution (mg/g), VV = Volume of the adsorbate (ml), WW = the weight in grams of the adsorbent, CC cccccc = the concentration of the control sample after the sorption period and CC ee = the equilibrium concentration of the samples after the sorption period DESTRUCTION OF PFAS USING PERSULFATE OXIDATION Batch Experimental Setup For every experimental batch, freshly prepared contaminant stock solution containing known concentrations of PFOA and/or PFOS was prepared by dissolving with deionized water in a borosilicate volumetric flask. The stock solutions were thoroughly shaken until complete compound dissolution, and then kept under a sonication water bath for about 60 minutes. Because compounds are known to sorb partially onto the glass surface, their exact concentration was measured using LC-MS before they were transferred into 50 ml closable polypropylene centrifuge reaction vials containing GAC or oxidant. The persulfate concentration was achieved by adding a known measured amount of powder activated persulfate into the aqueous solution. Duplicates of every condition were prepared. The reaction period was accounted from the time oxidant was added to the aqueous solution. The heat-activation step was carried out by maintaining sample vials in a temperature controlled water bath. The total reaction period was either 120 or 168 hours, and the aliquot was withdrawn from the reaction vials at the following time points: 8, 24, 48, 72, 96, 120, 144 and 168 hours. The collected samples were quenched in cold water, and with priority, they were instantly analyzed for PFAS, ph, sulfate, and fluoride. In the case of PFAS analysis, after collection, the samples were stored in the refrigerator (~ 4 o C) until the analysis. Before preparing samples for analysis, refrigerated sample vials were brought to room temperature and vigorously shaken to mix the solution. In general, use of persulfate oxidant lead to drop in ph of aqueous phase, and sometimes become very acidic. So, the possible effects on sensitivity of PFAS and fluoride measurements with analytical instruments were evaluated (Appendix A.5), however, no significant differences were recorded Oxidation of PFOA and PFOS in the Aqueous Phase In aqueous based oxidation experiments (without GAC), a total of four pairs of reactor vials were prepared. The first pair of reactors were subjected to oxidation, while the rest were contained as controls. The first pair, dosed with the oxidant, was kept in the temperature controlled hot water bath maintained at 80 C for heat-activation, while the second pair, also dosed with the oxidant, was retained to room temperature. The idea behind the second pair was to determine the potential 32
57 for slow degradation of PFAS at room temperature activated persulfate. At the same time, the third pair and fourth pair, containing only stock solution were subjected to 80 C hot water bath and room temperature, respectively, to determine the influence of heat and no heat on PFOA/PFOS concentration in the absence of oxidant. Single oxidant dose. Powder sodium persulfate (Na2S2O8) (approx mmol was spiked to vials containing 50 ml PFOA/ PFOS stock solution to create persulfate oxidant concentration of 10 g/l (52.3 mmol/l). Multiple oxidation doses. In place of spiking the single dose of sodium persulfate as for single dose oxidation, 1/5 th of the single dose i.e. (approx g or mmol/ 50 ml) was added for five consecutive times at an interval of 24-hours Oxidation of PFOA and PFOS Sorbed onto GAC Filtrasorb400 (F400) coal-based GAC was used as a source of activated carbon in these persulfate oxidation studies. Sorption of PFOA and PFOS onto clean F400 GAC (untreated) was conducted as in the procedure described in Section No buffer solutions were added to maintain the system ph. After the sorption step, the aqueous phase was decanted and measured for PFOA/PFOS to quantify the unsorbed portion of compounds. A total of four pairs of reactor vials were prepared. All pairs were 50 ml polypropylene reactor vials containing only PFOA or PFOS sorbed GAC (5 mg/g) from the sorption step with 50 ml of fresh ultrapure water added. Like the procedure of aqueous based oxidation without GAC, the first pair of reactors were subjected to oxidation, while the rest were contained as controls. The first pair with oxidant was kept in the temperature controlled hot water bath maintained at 80 C for heat-activation, while the second pair, also with the oxidant, was retained to room temperature. The third pair containing PFOA/PFOS sorbed GAC (no oxidant) was subjected to 80 C hot water bath to estimate the amount of PFOA/PFOS desorption under the influence of heat. The fourth pair containing just PFOA/PFOS sorbed GAC was kept at room temperature to find the amount of PFOA/PFOS desorption to water under no-oxidant and no-heat conditions. The single and multiple dose oxidation patterns were just like the procedure mentioned in the previous section Sorption of PFOA and PFOS onto Persulfate Treated GAC Like previous oxidation studies, this batch experiment was conducted in 50 ml polypropylene centrifuge vials. Initially, in the sorption stage, two sets of ten pairs of 50 ml vials with one set containing PFOA sorbed onto GAC (approx. 5.5±0.25 mg/g) and another containing PFOS sorbed onto GAC (approx. 6.12±0.16 mg/g) were prepared according to the pre-sorption stage (Section 3.5.2). The aqueous phase equilibrium concentrations were measured at the end of the 5-days sorption period. Amongst ten pairs belonging to PFOA or PFOS, following sorption, five were maintained as controls, and the remaining five pairs were subjected to heat activated persulfate oxidation. Before the oxidation stage, one pair, was sacrificed and subjected to solvent extraction to determine compounds sorbed onto GAC following the first sorption stage. The remaining four pairs containing PFOA or PFOS sorbed onto GAC were treated with a single dose (persulfate dose of 10 g/l; sodium persulfate - approx g or 2.6 mmol per 50 ml) of heat activated persulfate. Following oxidation, the aqueous phase was separated and analyzed for compounds and one pair was sacrificed for extraction, while the remaining three pairs were rinsed with fresh water for a period of 15 minutes three times to recover the GAC s ph from 33
58 acidic to neutral. All the aqueous rinses from samples were analyzed to account for any losses of the compounds. After rinsing, a new batch of fresh water was introduced again into the system and allowed to equilibrate for 3 days. The aqueous phase from all three pairs after the equilibration was decanted and analyzed for the aqueous concentration. In the following stage, one pair was sacrificed for extraction and the remaining two pairs were introduced to a new batch of contaminant solution for post-treatment sorption (sorbing approx. 5.67±0.25 mg/g of PFOA or approx. 3.73±6.14 mg/g of PFOS for the second time) and allowed to react for 3 days. The aqueous phase equilibrium concentration was measured, and of the two pairs, one was extracted and the other was subjected again to sorption (sorbing approx. 5.67±0.25 mg/g of PFOA or approx. 3.73±6.14 mg/g of PFOS for the third time) by introducing a new batch of contaminant solution similarly to the previous sorption. After the last sorption stage, the equilibrium concentration was noted, and the GAC was finally extracted. In controls, the same above mentioned procedure was followed except and equivalent amount of sodium sulfate (equal to post oxidation sulfate concentration of 10 g/l; sodium sulfate 0.74 g/ 50 ml) was used in place of sodium persulfate. Unlike the oxidation of PFOA or PFOS sorbed onto GAC described in Section 3.6.2, where the controls were not amended with any oxidant, in this experiment, sodium sulfate was introduced to controls to replicate the aqueous phase ionic content without active sulfate radicals. The equilibrium concentration measured during the second and third sorption were compared against the equilibrium concentration from the first sorption to determine possible changes in sorption capacity of GAC following treatment. Solvent extraction was used to identify and analyze the compounds sorbed onto GAC after every change made to its condition during the reaction period. All reaction vials were prepared in duplicate and as sacrificial vials that were solvent extracted according to Guelfo and Higgins (2013) to determine the PFAS remaining sorbed onto GAC after each reaction condition. Aqueous phases from all reaction conditions, including decants and rinses, and the aliquot withdrawn from vials at different time intervals during the oxidation period were analyzed Mole Balance of Batch Oxidation Systems Mole balance calculations were conducted across all batch oxidation and control systems to compare initial and final PFAS concentrations, and to account defluorination yield. The general stoichiometric equation, input = output + accumulation + disappearance, was considered as a base for making a mole balance across the batch systems. The reaction byproducts including shorter chain intermediates (C4-C7) and fluoride associated with elemental composition of PFOA or PFOS were included in mole balance calculations, and the presence of other measured and unmeasured reactive and non-reactive species such as S2O8 2-, SO4 -, H2O2, Na +, OH -, H +, etc. were neglected. Input and output were the concentrations at the beginning and end of reaction period. Input was initial measured concentration of PFOA or PFOS (mol/l), while both byproducts and unreacted PFOA or PFOS were considered as output. Compounds remaining sorbed on GAC before and after oxidation were extracted to the solvent phase and then quantified. The extracted compounds concentrations were converted from mol/g to mol/l equivalent. The disappearance and accumulation units in the stoichiometric equation were both combined and termed as unaccounted. The unaccounted portion contains compounds lost during oxidation and the unrecovered compounds that remain sorbed onto the solid surfaces, as well as the compounds such as CO, CO2, unstable shorter chain homologues of PFOA and PFOS 34
59 that went undetected or not quantified as result of analytical limitations. The percent contribution of each compound or element was calculated as a fraction of the total concentration of the system measured (Equation 3.8). % cccccccccccccccccccccccc = CCCC 100 Eq. 3.8 CCCC Where, CC mm = measured concentration of a compound or species, CC tt = total sum of concentrations of all species. Because each mole of PFOA and PFOS can contribute to 15 and 17 moles of fluoride respectively, CC mm for fluoride was calculated by dividing measured fluoride by ((moles of F - formed)/ (mole of PFOA or PFOS)) TREATMENT OF FIELD GAC WITH ACTIVATED PERSULFATE Chemicals and Materials Two types of spent GAC, F400 and virgin coconut shell-based GAC, which had been used for treating PFAS contaminants in groundwater at a former Air Force Base pump-and-treat site, were used in this study. ph was only maintained at the initial stage of the experiment using 0.1 M hydrochloric acid (HCl) and 0.1 M sodium hydroxide (NaOH). Synthetic groundwater with a composition of 200 mg/l calcium carbonate (CaCO3) 272 mg/l calcium sulfate (CaSO4), 252 mg/l sodium bicarbonate (NaHCO3), 194 mg/l Magnesium carbonate hydroxide pentahydrates (4MgCO3.Mg(OH2).5H2O) and 750 mg/l potassium chloride (KCl) served as the source water. The components of the synthetic groundwater were based on a previous work by Stewart et al. (2005). Persulfate was activated by adding the desired amount of sodium persulfate (10 g/l) to a known volume in a 50-mL polypropylene and kept in a temperature controlled hot water bath at 80 for 2 h. Aside from the persulfate activation experiment, all other experiments were conducted at room temperature of 23 ± Extraction of Field GAC Sample extractions were conducted prior to and after oxidation experiments to determine the mass change of PFAS sorbed onto GAC. The GAC solvent extraction from Section was followed. The PFAS that were investigated/considered in this study and detected in both field GAC were PFBA, PFPeA, PFBS, PFHxA, PFHpA, PFHxS, PFOA, and PFOS. Results for PFOA and PFOS were the most reported in this study as they are the most commonly detected PFAS of concern at contaminated groundwater sites Column Design and Operation Persulfate oxidation of field GAC with sorbed PFAS was performed in 1-dimensional mini 100- ml polypropylene columns with a height of 24 cm and inner diameter of 3.5 cm. The polypropylene column, tubing, mesh, aquarium gravel and all other equipment used were rinsed with methanol and milli-q water prior to experimentation. Mesh and aquarium gravel were placed at the bottom and the top of columns to prevent leakage and flotation of GAC. A schematic of the column experiment setup is shown in Figure 3.5 and Appendix A.7 provide additional data on experimental design calculations. 35
60 Figure 3.5. Experimental setup for column tests to treat field-contaminated GAC. Exactly 100 g of field sorbed GAC were weighed into columns (wet packed) and 10 pore volumes (300-mL) of synthetic groundwater were first fed through each column in an upward flow mode using a peristaltic pump at a flow rate of ml/h. Effluent samples were collected from the top of the column at designated sampling intervals (2 h and 4 h intervals) at each column effluent collection ports throughout the experiment for water quality analysis. After first flushing with synthetic groundwater (10 pore volumes), groundwater flow was disconnected and one reactor volume (30-mL) of heat activated persulfate (10 g/l, 80 ) was instantly injected into the first 2 columns and retained in the columns for 24 hours, which is how long this concentration will persist at this temperature in the presence of GAC based on preliminary tests. The columns were jacketed with fiber glass pipe wrap to help maintain the heat in the columns. After oxidation, groundwater flow of 10 pore volumes was resumed and effluent samples were then again collected at 2 h and 4 h intervals for a period of 24 h to measure the following parameters: byproducts, ph, sulfate, PFAS concentration, and fluoride. A control experiment was also conducted using the same procedure with synthetic groundwater replacing heat 36
61 activated persulfate. After treatment with heat activated persulfate, columns were unmounted and contents were unpacked for extraction to determine the change in mass of PFAS Post-treatment Sorption of PFAS Two approaches were used to evaluate sorption of PFAS following persulfate treatment. The F400 GAC was evaluated in batch systems, while the virgin coconut shell-based GAC was evaluated in flow through mode. 2 g of persulfate treated GAC were weighed into 50-mL polypropylene vial (pp), and 40-mL volume of 1 mg/l stock solution of a mixture of 5 PFAS (PFBA, PFHpA, PFHxA, PFOA and PFOS) was added to the pp vials. The stock solution was prepared with synthetic groundwater and sonicated to ensure proper dissolution of compounds. The vials were left on the rotator and samples were collected after 5 days to check for their extent of sorption. The aqueous phase was decanted and PFAS concentrations were measured to determine the amount of PFAS sorbed on GAC using Equation 3.9. All sorption tests were performed in triplicates to ensure reproducibility and to estimate experimental errors. CC oo CC ee CC oo 100 Eq. 3.9 Where, CC oo and CC ee are the initial and final concentration (µg/l) of PFAS before and after adsorption. While the extent of sorption was calculated using Equation 3.10, where VV is the volume or pore volume (L) used and MM is the mass of adsorbent (g). CC oo CC ee VV Eq MM The virgin coconut shell-based GAC regeneration test was conducted in the 1-D mini columns using the same stock solution as in the batch experiments. Twenty pore volumes (600 ml) of synthetic groundwater containing 1 mg/l of 5 PFAS was introduced into columns in an upward flow mode at a flow rate of ml/h for 48 hours. Effluent PFAS samples were collected from the collection ports and PFAS concentrations measured at 2 h, 4 h and 46 h intervals for a period of 48 h to identify the exhaustion point of GAC in the columns META-PC FOR CHARECTERIZATION OF PFOS DEGRADATION Meta-PC Software Tool for PFOS Degradation Characterization The details of PFOS and other compounds of interest were entered to the Meta-PC software using Simplified Input Line Entry System (SMILES). SMILES contain the physical and chemical properties of each individual atom from the one end of the molecule to the other in a structure line format. Meta-PC can evaluate the influence of conditions (mammalian metabolism, photo-degradation, anaerobic, and aerobic conditions) on the properties of the compound. Photodegradation and mammalian metabolism were checked as primary methods for PFOS degradation. SMILES data of PFOS and its possible shorter-chain derivatives were entered in the Meta-PC. Prior to running the program, with the use of view tool, molecular structures of compounds were observed. The structures of compounds were as well observed after the conditions acted on their properties and checked for possible destruction. The tool component of 37
62 Meta-PC allowed the user to view the 3-D result of the SMILES input. Predicted degradation pathways were followed until no more metabolites were predicted. Soluble and carcinogenic metabolites were noted. Attempts were made to assess the metabolites when two chemical species were entered, however, faced with limitations in software compatibility and results were not produced. The Help guide stated Meta-PC could only process one species at a time. For example, when attempting to show PFOS reacting with superoxide the software simply added two oxygen atoms to PFOS. 38

63 4.0 RESULTS AND DISCUSSION 4.1. LABORATORY TESTING AND VALIDATION OF THE HRX WELL TM Laboratory HRX Well TM Design The capture zones in HRX Well TM for each media tested in the well were a function of the ratio of the hydraulic conductivities of the media in the well and the sand in the aquifer (KK rrrrrrrrrr ), as well as the well geometry. Figure 4.1 presents a well flow simulation using a simple particle tracking model with the terms used throughout the discussion. Figure 4.1. Depiction of capture zone (bb AA ), average width (WW aaaaaa ), and capture zone radius (rcz). The main idea of the horizontal well concept is to capture water through flow focusing which results from the differential conductivity of the in-well media and surrounding media. The flow of water through the well (QQ ww ) was calculated according to Equation 4.1. While, Darcy s law (Eq. 4.2) was used to calculate the average width of capture (WW aaaaaa ). QQ ww = KK ww ππrr ww 2 ii ww Eq. 4.1 WW aaaaaa = QQ ww KK AA bb AA ii AA Eq. 4.2 Where, QQ ww = water flow in capture zone (cm 3 /sec), KK ww = hydraulic conductivity of in-well media (cm/sec), rr ww = radius of horizontal well (cm), ii ww = hydraulic gradient along the well, WW aaaaaa = average treatment width (cm), KK AA = hydraulic conductivity of surrounding media of the well (cm/sec), bb AA = aquifer thickness intercepted by the horizontal well (cm), ii AA = aquifer hydraulic gradient. 39
64 Because the horizontal well is oriented parallel to the aquifer groundwater flow direction, hydraulic gradients for the well and aquifer are approximately equal. Equation 4.3 was developed using this assumption and combining Equations 4.1 and 4.2. WW aaaaaa = KK wwππrr ww 2 KK AA bb AA Eq. 4.3 Equation 4.3 shows that the horizontal well treatment width depends on the ratio of the in-well and surrounding hydraulic conductivities, radius of the horizontal well, and the aquifer intercepted thickness. For many field applications, the length of the angled portion can be taken as an approximation to the aquifer thickness intercepted by treatment well (bb AA ). Equation 4.3 was used along with numerical modeling during the design process to ensure that the expected treatment width of the well was less than the boundaries the aquifer (i.e. the 55-gallon drum). By definition, all water that flows through the capture zone flows into the well and is measured at the well outlet (QQ CCCC = QQ WW ). Assuming uniform flow throughout the cross section of the aquifer, as shown in Equation 4.4 the ratio of flow through capture zone to total flow must equal the ratio of the area of the capture zone and the total area. If the angled portion of the well is absent and the aquifer is uniform and anisotropic, the capture 2 zone is approximately circular, AA CCCC = ππππ CCCC and AA TT = ππrr 2 TT. Then, Equation 4.4 and 4.5 are equal QQ WW QQ TT = AA CCCC AA TT Eq. 4.4 rr cccc rr TT = QQ WW QQ TT Eq. 4.5 Where, QQ CCCC = flow through capture zone (l/h), QQ WW = flow rate through the well (l/h), QQ TT = total flow rate of the entire system (l/h) (QQ TT = QQ WW + QQ aaaaaaaaaaaaaa ) (l/h), AA CCCC = area of the capture zone (cm 2 ), AA TT = aquifer total area (cm 2 ), rcz = capture zone radius (cm), rt = aquifer radius (cm). For field applications, the capture zones may have a complex shape and there could be a varying capture zone width along the length of the treatment well Hydraulic Conductivity of Well and Aquifer Media Multiple measurements of the hydraulic conductivities of each of the media were conducted and averaged (Table 4.2). Table 4.3 shows the laboratory tank dimensions used in Equation 4.3. Table 4.2. Hydraulic conductivity of media. Average Time (sec) K (cm/sec) Standard Deviation Sand F400 GAC F816 GAC Aquarium Gravel Large Well Gravel Aquifer Gravel
65 Table 4.3. Relevant dimensions of the laboratory model and hypothetical field scenario. Lab Field r well (cm 2 ) b (cm) slope Figure 4.2 compares the ratio of flow captured by the HRX Well (QHRX, measured at the well outlet) and the flow at the aquifer outlet (QA) to the ratio of KK HHHHHH and KK AA for the five-different media placed in the HRX Well. The open circles represent average measurements for various tests for various KK AA /KK HHHHHH ratio values and the filled diamond is the design model prediction. The dashed line represents the predicted relationship based on the numerical model results and the expectation of a linear relationship based on the assumption of laminar flow conditions and Darcy s Law. Figure 4.2. Ratio of flow captured by the HRX Well (QHRX, measured at the well outlet) and the flow at the aquifer outlet (QA) to the ratio of KHRX and KA for the five-different media placed in the HRX Well. The open circles represent average measurements for multiple tests for various KA/KHRX ratio values and the filled diamond is the design model prediction. Error bars represent range of measurements for tests completed with the same KA/KHRX conditions. The dashed line represents the predicted relationship based on the numerical model results and the expectation of a linear relationship based on Darcy s Law Tracer Tests Conservative Tracer Tests. For several tests where the well was filled with GAC (Calgon Filtrasorb F816), a slug of conservative tracer (chloride (as NaCl), Cl - ; measured by specific conductance) was added to the water supply reservoir to qualitatively measure arrival times. Tracer test runs were conducted by adding 100 grams of NaCl to the water supply tank and 41
66 collecting samples at the well outlet, the aquifer outlet, and the water supply tank overflow. The conductivity of each collected sample was measured for NaCl concentration. A representative graph is shown in Figure 4.3. A high concentration of NaCl was detected in the overflow immediately after the beginning of the test run. The concentrations decayed very rapidly and returned to baseline in a very short period of time. This represented the NaCl was lost via the water supply tank overflow that never entered the tank. The well outlet remained at baseline for a few minutes and then rapidly increased, peaked, and then quickly returned to baseline. Generally, within 5 to 7 minutes of adding the NaCl to the water supply tank, a corresponding increase in conductively was measured. The peak concentration was observed between 10 and 15 minutes. The conductivity returned to baseline within minutes. The NaCl at the aquifer outlet remained at baseline longer, rose more gradually, peaked later and at a lower concentration, and then slowly returned to baseline. NaCl first appeared between 12 to 24 minutes, and peaked at a range of 35 to 55 minutes, and then returned to baseline after 90 minutes. Regardless of the media in the well or the head applied, all the graphs had the same basic shape and characteristics. The higher the hydraulic conductivity in the well, the sooner the increase in conductivity from the well was measured, and longer it took to see NaCl arrive at the aquifer outlet. Based on the aquifer and media properties, the flow velocity within the well (VV HHHHHH ) was expected to be 3.5 to 4.5 times greater than the flow velocity in the aquifer. Based on observed breakthrough the average tracer velocities were 3.3, 3.4, and 3.6 times faster for water exiting the well outlet compared to the aquifer outlet. These results are consistent with expectations and further confirm that the HRX Well behaves as a preferential flow feature that both focuses flow and exhibits enhanced flow velocity. Figure 4.3. NaCl tracer test results with well filled with F816 GAC at 36 inches of applied head Conservative and Non-Conservative Tracer Tests. To demonstrate the possible effects of GAC as a well media for sorption of contaminants, a dual tracer test was conducted. F816 GAC was used to fill the well. Methylene blue (20g) and NaCl (100g) were both added simultaneously 42
67 to the water supply tank, and test run timer was started. Samples from the well and aquifer outlets were collected at specified times and measured for concentration of NaCl and methylene blue. The profile for the NaCl was like the conservative test run test conducted before. The measured tracer breakthrough curves at the well outlet are shown in Figure 4.4 (data are normalized to injected concentration and chloride breakthrough time; tcl). It is evident that the GAC within the HRX Well TM dramatically affected the transport of MB. The initial arrival of MB and the HRX Well TM outlet is approximately two times later than Cl - and the relative peak concentrations are 35 times lower than Cl -. Due to the slug addition, supply reservoir overflow system, and aquifer outlet configurations, the exact mass of tracer added to the tank is not precisely known and, therefore, an absolute tracer mass balance is not possible. However, because the tracers were added in the same way and at the same time, the cumulative mass recovery of MB relative to Cl - (the dotted line shown in Figure 4.4) was used to quantify the total relative MB mass treated over time. After 10 tcl, the cumulative MB mass recovery is about 20 times less than Cl -. Note that unlike some other types of reactive media (e.g., zerovalent iron), GAC does not destroy MB and, therefore, long-term low-level desorption is expected; nevertheless, after 25 tcl the cumulative MB breakthrough was still 10 times less than Cl -. The physical model clearly shows that an HRX Well TM will focus flow and solute transport is then affected by the reaction processes associated with the solid phase media in the well. For specific field applications, several factors (e.g., sorption/desorption potential of the media, reaction kinetics, and residence time), will need to be considered in the well design and performance expectations. Figure 4.4. Relative breakthrough of chloride (Cl -, circles) and methylene blue (MB, triangles) tracers at the HRX Well outlet. The cumulative MB mass recovery normalized to the cumulative Cl - mass recovery is indicated by the dotted line. Additional experimental details, data, and interpretation related to the physical tank testing can be found in Divine et al., (2017). Overall the physical tanks testing modeling analyses completed 43
.")
68 for this project demonstrate that the HRX Well concept is viable and may be an implementable and effective technology for some sites CHARACTERIZATION OF PFAS AND CO-CONTAMINANT SORPTION Preliminary Sorption Experiments This work was completed as part of a Ph.D dissertation and are documented in detail in Siriwardena (2017). Results of the preliminary sorption experiment show increasing sorption (decreasing aqueous phase concentration) after 4 days. Sample aliquots were collected after 7 days and analyzed to determine whether equilibrium concentration has been reached. Aqueous concentration obtained for 4 th day and 7 th day samples showed less than ±5% difference; therefore, a seven-day period was chosen as time to reach equilibrium concentration for the follow-on isotherm experiments. Adsorption results indicate similar performance for each carbon type and sorption capacities are in the range of 150 to 200 mg-pfas / g-gac (Figure 4.5). The GAC types of F400 and F300 had slightly higher sorption for PFOA and PFHxS. F300 shows higher sorption for PFBS at 175 mg-pfbs/g-gac (Figure 4.5). Different sorption behavior of PFBS compared to PFOA and PFHxS likely occurred due to the different carbon-fluorine chain lengths. According to Wang et al., (2015b), longer carbon-fluorine chain PFAS have higher binding affinity than short-chain PFAS. According to the surface morphology visualized by SEM micrographs of carbon (Figure 4.6), all GAC types have porous structures. Because all the carbon sources have similar physical properties (Table 4.4), the chemical composition of the surfaces of F400 and F300 may account for the higher sorption capacity. Out of all the carbon sources tested, F300, F400, and CBC have the highest BET surface area (Table 4.4) respectively. Jacobi carbon showed the highest phpzc of 8.1 (Table 4.4) and hence the surface tends to be more positively charge with experiment ph controlled at 7.2. This may increase the electrostatic attraction between negatively charge PFAS and the positively charge GAC surface and may account for higher sorption (Du et al., 2014; Zhi et al., 2015). Based on these results, F400 carbon along with F300, Jacobi, and CBC GAC were chosen for further experiments. Figure 4.5. Amount of PFAS adsorbed in to GAC after a 4-day reaction period. Error bars on adjusted values represent the standard errors of the mean estimates. 44
69 Table 4.4. Characteristics of carbon sources. GAC BET Surface Area (±m 2 /g) ph pzc pore volume 1 F100 F200 F816 F400 F300 Jacobi CBC BJH Adsorption Cumulative volume of pores between A 0 2 Adsorption average pore width (4V/A by BET) (cm 3 /g) Pore Width 2 (Å) PFAS Sorption Isotherms for Different GAC Types Among the four GAC types tested during isotherm experiments at high PFAS concentration, F300 and F400 showed the highest sorption capacity for PFOA, respectively, according to the QQ mm and KK FF values of Langmuir and Freundlich isotherm models, respectively (Table 4.5). For PFOS, PFHxS and PFBS, F400 displayed the highest sorption capacity according to Langmuir isotherm model. In this experiment, the initial concentration of 500 mg/l was used for PFOA and PFHxS isotherm experiments, while 250 mg/l was used for PFOS and PFBS due to their dissolution limitations. Because the initial concentration has an effect on sorption capacities (Coles, 2007), the sorption capacities of PFAS in this preliminary experiment cannot be compared. The Langmuir isotherm model and Freundlich isotherm model fit all the sorption data well according to their correlation coefficients R 2 >0.91 for Langmuir model and R 2 >0.85 for Freundlich model (Table 4.5). Appendix A.1 provides supporting data on isotherm models with PFAS sorption onto different GAC sources. The CBC GAC had the lowest sorption capacity compared to the other three types of carbons. F400 and CBC were chosen for the future experiments, because F400 showed higher sorption capacity in most of the preliminary isotherm experiments and CBC represents a contrasting GAC material. 45
70 Table 4.5. Langmuir isotherm constants and Freundlich isotherm constants for the adsorption of PFAS onto different GAC types. GAC F300 F400 PFAS Langmuir Isotherm Constants Freundlich Isotherm Constants QQ mm KK LL r 2 KK FF n r 2 PFOA PFOS PFHxS PFBS PFOA PFOS PFHxS PFBS PFOA Jacobi PFOS PFHxS PFBS PFOA CBC PFOS PFHxS PFBS QQ mm (mg PFAS/g GAC), KK LL (L/mg), KK FF [(mg PFAS/g GAC) (mg PFAS/L) -n ], n for the adsorption of PFAS onto different GAC types. Initial concentration of PFOA and PFHxS = 500 mg/l and PFOS and PFBS = 250 mg/l. Solution ph 7. 46


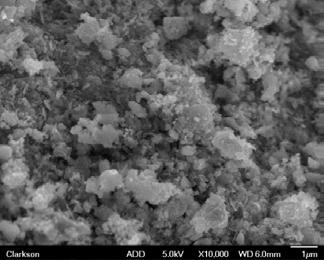

71 F100 F200 F300 F816 F400 Jacobi CBC Figure 4.6. SEM Micrographs of GAC magnification. 47
72 Isotherm Experiments The adsorption capacities of two types of GAC (F400 and CBC) for PFOA and PFOS, individually and in mixture, at low concentration (1 mg/l) were compared by fitting the experimental data to Freundlich and Langmuir isotherm equations to determine adsorption constants. The isotherm constants determined from Langmuir and Freundlich models at 1 mg/l initial concentration are listed in Table 4.6. Appendix A.2 provides supporting data on isotherm models for PFAS sorption onto F400 and CBC type of GAC. The Langmuir isotherm model provided better fits than the Freundlich isotherm model according to the correlation coefficient (r 2 ). It was reported that PFOS and PFOA adsorption is well described by the Langmuir model (Ochoa-Herrera and Sierra-Alvarez, 2008; Yu et al., 2009; Zhang et al., 2011; Du et al., 2014). The Freundlich model is also acceptable because multilayer adsorption of PFAS is probable during sorption process (Yu et al., 2009; Du et al., 2014). According to the maximum sorption capacity derived from both models, the higher sorption capacity was obtained for individual compounds compared to those in mixture for both PFOA and PFOS (Figure 4.7). Also, coalbased F400 showed higher sorption than the coconut based carbon in all the combinations. For both carbon sources, PFOS showed greater sorption than PFOA individually and in mixture. Moreover, according to the QQ mm values of Langmuir isotherm, PFOA shows 60% more sorption when it is present as an individual compound compared to when in mixture, whereas PFOS shows 6% more sorption for F400. Similarly, 35% of more PFOA and 1% of more PFOS sorbed for CBC when they are present as individual compounds. Therefore, there is less difference between adsorption capacities of PFOS in individual compared to in a mixture, whereas PFOA showed higher difference according to Langmuir isotherm model. This trend can also be seen in the KK FF values of the Freundlich isotherm. There, 70% of more PFOA and 34% of more PFOS sorbed into F400 and 43% of more PFOA and 19% of more PFOS sorbed into CBC when the compounds were present individually, compared to present as a mixture (Figure 4.7). Table 4.6. Langmuir isotherm constants and Freundlich isotherm constants of PFAS onto F400 and CBC GAC types. GAC F400 PFAS Langmuir Isotherm Constants Freundlich Isotherm Constants QQ mm K L R 2 KK FF n R 2 PFOA PFOA(Mix) PFOS PFOS(Mix) PFOA PFOA(Mix) CBC PFOS PFOS(Mix) QQ mm (mg PFAS/g GAC), K L (L/mg), KK FF [(mg PFAS/g GAC) (mg PFAS/L) -n ], n for the adsorption of PFAS onto different GAC types at 1mg/L initial concentration of PFAS. Solution ph
73 (a) QQ_mm (mg PFAS/g GAC) Individual Mixture PFOA PFOS PFOA PFOS F400 CBC (b) [(mg PFAS/g GAC)(mg PFAS/L) -n ] Individual Mixture PFOA PFOS PFOA PFOS F400 CBC Figure 4.7. Sorption capacity of individual and mixture of PFOA and PFOS onto F400 and CBC GAC types, derived from (a) Langmuir (b) Freundlich isotherm models. Error bars on adjusted values represent the standard errors of the mean estimates. It was previously reported that both the length and functionality of the head groups of PFAS have an effect on sorption (Higgins and Luthy 2006; Wang et al., 2012). Because PFOA and PFOS have the same carbon chain lengths, carboxylate and sulfonate head groups may have an influence on their sorption. The sulfonate group is slightly larger compared to the carboxylate group and hence shows higher hydrophobic properties to a certain extent (Higgins & Luthy, 2006). Moreover, PFOS has a higher log Kow (5.26) than PFOA (4.59) (Table 3.2), which indicates that the sulfonic group is more hydrophobic than the carboxylic group even though they have same carbon chain length (Deng et al., 2012). PFOA and PFOS have the same carbon chain length, but PFOS contains eight fluorinated carbons and PFOA has seven which results in stronger hydrophobic character in PFOS (Zhou et al., 2010a, 2010b; Zhi and Liu 2015; Merino et al., 2016). In addition, it is reported that the PFOS molecule has higher polarizability than the PFOA molecule (PFOS: Å 3 molecule -1, PFOA: Å 3 molecule -1 ). Therefore, the Van der Waals interactions with the sorbent surface induced by PFOS are likely stronger than PFOA (Zhi & Liu, 2015). According to the sorption capacity terms derived from Freundlich and Langmuir isotherm models of the sorption data, hydrophobic interactions play an important role because PFOS shows higher sorption when present both individually or in mixture compared to sorption of PFOA (QQ mm and KK FF values in Table 4.6). PFOA and PFOS have low pka values (Table 3.2) and hence they exist as anions in the aquatic environment (Wang et al., 2012; Shih and Wang, 2013; Du et al., 2014). In these experiments ph was controlled at 7.2 and the ph of point zero charge of F400 and CBC were found to be 6.1 and 7.5 respectively (Table 4.4). Therefore the surface of F400 tends to be more negatively charged resulting in electrostatic repulsion between F400 surface and PFAS anions and decreased the sorption capacity to some extent (Deng et al., 2012; Du et al., 2014). On the other hand, CBC has a weakly charged surface (ph ~ phpzc) with likely negligible electrostatic interactions (Tang et al., 2010). According to isotherm experimental results, F400 shows a higher sorption capacity 49
74 than CBC. Therefore, electrostatic interactions may have less of influence on sorption compared to hydrophobic interactions. Differences in sorption capacities can be attributed to the physical properties of GAC to some extent. The main factors for higher adsorption of PFAS onto F400 relate to the higher surface area, pore size distribution and formation of micelles and hemi-micelles (Yu et al., 2009; Deng et al., 2012). The BET surface area of F400 is slightly higher than that of CBC and is not likely the main reason for the higher sorption capacity of F400 (Table 4.4) compared to CBC. The length of a PFOA and PFOS molecule is reported to be about m (Yu et al., 2009; Deng et al., 2012; Zhi and Liu, 2015). The diameter of PFOA is about m and m for PFOS (Deng et al., 2012; Zhi & Liu, 2015). Both F400 and CBC have BJH adsorption average pore width in the range of micropores (< m) (Table 4.4). But, PFOA and PFOS molecules may not be accessible to some of the micropores (< m) due to their larger size than micropore volume. Hence, the available micropores in the GAC surface for sorption of PFOA and PFOS relevant to their size is a more important factor (Yu et al., 2009). The critical micelle concentration (CMC) was reported to be 4,573 mg/l for PFOS and 15,696 mg/l for PFOA (Yu et al., 2009; Deng et al., 2012), but hemi-micelles can be formed on the adsorbent surface when the PFAS concentration is in the range of of the CMC (Johnson et al., 2007; Yu et al., 2009; Zhang et al., 2011; Deng et al., 2012). The concentration used for this study, however, was much lower than their CMC. The BJH Adsorption Cumulative volume of pores of F400 and CBC were found to be and cm 3 /g respectively. PFAS concentration in pores can be calculated by the ratio between pore volume of GAC and the sorption capacity of the respective GAC. The sorption capacities of F400 (42.9 mg/g PFOS and 34.4 mg/g PFOA) translate to aqueous concentrations of g/l PFOS and g/l PFOA in its pores. The similar sorption capacity of CBC (15.8 mg/g PFOS and 14.6 mg/g PFOA) is equal to g/l PFOS and g/l PFOA in the pores of CBC (Zhang et al., 2011). These are much higher concentrations than the CMC and hence the possibility of forming micelles and hemi-micelles in the pores. Because, aqueous concentrations are higher in pores of CBC, more micelles tend to be formed and can prevent the sorption of other molecules, resulting in lower sorption capacity than F400 (Yu et al. 2009). Moreover, when PFOA and PFOS are in the mixture, PFOS shows a higher sorption capacity than PFOA. There was a competition between molecules for adsorption. Because the CMC of PFOS was lower than that of PFOA, it was easier to form micelles or hemimicelles than it was for PFOA in the surface or inside the pores. Also, the bigger size of PFOS tend to form larger micelles and hemi-micelles than PFOA and can block the pores leading to the inhibition of PFOA sorption (Yu et al., 2009) Sorption of PFAS in Presence of Co-contaminants The effect of co-contaminants (kerosene, trichloroethylene and ethanol) on sorption of PFAS (1mg/L PFOA and PFOS mixture) onto 15 mg of GAC (F400 and CBC) are represented in Figure 4.8. For both types of GAC, the extent of sorption was increased by mg/g (36-50 %) of PFOA in the presence of all types of co-contaminants whereas PFOS shows very little change (~1 mg/g (10%)). A similar trend was observed with the experiment with 5 mg of GAC. It was reported that fuels or chlorinated solvents existing as non-aqueous phase liquids (NAPL) may have a varied effect on sorption and these can compete with PFAS for sorption sites (Guelfo & Higgins, 2013). The impact of TCE on PFAS sorption has been shown to be concentration- 50
75 dependent where sorption was unimpacted or slightly decrease at low concentration (1µg/L) and increased at high concentration (500 µg/l) of PFAS (Guelfo & Higgins, 2013). Moreover, cocontaminants can hinder sorption by blocking access to PFAS sorption sites. Also, at high concentration of PFAS, the presence of a NAPL can act as an additional adsorbent for PFAS. Moreover, it has been demonstrated that long chain PFAS (>6 Carbon) have a different influence and uncertain effect on sorption in the presence of NAPL (Guelfo & Higgins, 2013). Therefore, sorption of PFAS in the presence of co-contaminants depends on the characteristics of GAC, PFAS concentration and chain length Extent of sorption (mg/g) F400-PFOA F400-PFOS CBC-PFOA CBC-PFOS GW Only GW + Ker GW + TCE GW + Et Figure 4.8. The extent of sorption of PFAS in the presence of co-contaminants was investigated by preparing a mixture of PFOA and PFOS and measuring their sorption onto 15 mg of F400 and CBC in the presence of 0.1 mg/l Kerosene (Ker), 1 mg/l Trichloroethylene (TCE), and 1 mg/l Ethanol (Et). Error bars on adjusted values represent the standard errors of the mean estimates Influence of Groundwater Conditions on Sorption of PFAS The effects of ph (4 and 9), total solids (Fe2O3), dissolved organic carbon (0.1 and 1 mg/l) and anion (SO 4 2 ) on sorption of PFAS (1mg/L PFOA and PFOS mixture) onto 15 mg of GAC (F400 and CBC) are summarized in Figure 4.9. PFOA and PFOS mainly exist in an anionic form within the ph tested (4 and 9) in this study because the pka values of those molecules are lower than the experimental ph (Table 3.2). The phpzc of F400 and CBC are found to be 6.1 and 7.5, respectively. The charge of the mineral surface depends mainly on the solution ph (Tang et al., 2010). Therefore, at ph 4, both F400 and CBC surfaces are more positively charged, and they are more negatively charged at ph 9. Therefore, at lower ph PFAS sorption increases due to enhanced electrostatic attraction forces between negatively charged PFAS molecules and the positively charged surface (Johnson et al., 2007; Zhang et al., 2011; Deng et al., 2012; Wang et al., 2012; Du et al., 2014; Wang et al., 2015b). However, a slight increase (<1 mg/g (10%)) of PFOA and PFOS sorption level on F400 and CBC was observed at ph 4. Therefore, electrostatic forces are enhanced between negatively charged PFAS molecules and the positively charged surface at lower ph and can increase sorption (Johnson et al., 2007; Tang et al., 2010). At ph 9, 51

76 no enhancement in sorption in F400 for both PFAS and a small decrease (<1 mg/g (10%)) of the extent of sorption on CBC was observed for both PFOA and PFOS. In general, a change of ph had no significant change in the extent of sorption of PFAS into GAC. Figure 4.9. The extent of sorption of PFOA and PFOS adsorption onto 15 mg GAC at different groundwater conditions ph 4, ph 9, total solids (Fe), 0.1 mg/l DOC (DOC_0.1), 1 mg/l DOC (DOC 1) and SO4-2 anion (SO4). Error bars on adjusted values represent the standard errors of the mean estimates. According to the Figure 4.9, the effect of SO 4 2 anions on the extent of sorption of PFOS is negligible (< 1 mg/g (10%)) for both types of GAC. For PFOA, F400 has 4.6 mg/g (43%) and CBC has 3.5 mg/g (42%) enhancement in sorption. Most studies in published literature have found that inorganic ions compete with PFAS for sorption sites on adsorbents and hindered the sorption capacity of PFAS to some degree (Zhang et al., 2011; Wang et al., 2012; Deng et al., 2012; Du et al., 2014). But, Zhang et al. (2011) indicated that sulfate anions affected the sorption rate to some extent but have little effect on sorption capacity. Moreover, the effect of inorganic ions on PFAS sorption is complicated and mainly depends on concentrations and types (Du et al., 2014). In this experiment, the PFAS to SO 4 2 ion ratio was 1:10 and had varied influence on sorption. Natural organic matter (NOM) is commonly present in the natural environment and is a main competitor for PFAS sorption (Yu et al., 2012; Bao et al., 2014; Du et al., 2014). The presence of dissolved organic carbon (DOC) causes competitive adsorption effects and preloading or fouling of GAC (Rahman et al., 2014) and can interact with PFAS through hydrophobic and electrostatic interactions (Bao et al., 2014). Also, the concentration limits and size of the NOM have an influence on PFAS sorption onto GAC (Qiu et al., 2007; Yu et al., 2012). In this experiment, two concentrations (0.1 and 1 mg/l) of Suwannee River Natural NOM-Humic Acid (HA) standard II were used to determine the DOC effect on sorption of PFAS. According to Figure 4.9, the impact of DOC on sorption of PFOS is negligible (<1 mg/g (10%)) with a low concentration of DOC (0.1 mg/l) for both types of GAC, whereas sorption 52
77 decreased by 3.3 mg/g (30%) with a high concentration of DOC (1 mg/l) for CBC. PFOA shows a 4.6 mg/g (44%) and 3.3 mg/g (40%) increase in sorption with a low concentration of DOC and 2.8 mg/g (27 %) and 1.6 (20%) mg/g increase in sorption with high concentration for F400 and CBC respectively. It was noted that PFAS adsorption can be increased via hydrophobic interactions on the HA to some extent (Bao et al., 2014). Also with a high concentration of DOC, the sorption rate can be decreased due to a steric hindrance effect of HA molecule and competitive sorption between HA and PFAS (Bao et al., 2014). Moreover, dissociation of carboxylic and phenolic functional groups in water make negative charges in the HA molecule, resulting in enhancement of electrostatic repulsion between them and PFAS anions. This effect could decrease the removal rate of PFAS with increasing DOC concentration (Bao et al., 2014). The size of the NOM also plays an important role in sorption of PFAS molecules, because NOM has a varied size distribution. It was reported that the smaller molecular weight fraction (<1 kda =1 kg/mol) has a higher effect on sorption than the larger molecular weight (>30 kda = 30 kg/mol) fraction (Yu et al., 2012). PFAS (PFOA = 438 g/mol, PFOS= 538 g/mol) mainly occupy micropores, and the smaller NOM molecules with a similar size as PFAS, which is a small fraction of NOM, may compete with PFAS molecules for the micropores (Qiu et al., 2007; Yu et al., 2012). The extent of sorption of PFOA was increased by 4.5 mg/g (46%) and 3.8 mg/g (45%) for F400 and CBC respectively with negligible change in PFOS (<1 mg/l (10%)) in the presence of iron oxide solids. Because it was reported that PFAS and anionic surfactants can sorb onto iron oxide rich materials (Johnson et al., 2007), the influence of it is expected to be minor compared to the GAC sorption capacity Comparison of Experimental Results with Other Reported Studies Earlier studies on sorption of PFAS onto GAC reported Langmuir and Freundlich isotherm constants (Table 4.7). When compared the KK FF values in Freundlich model, the study of Ochoa- Herrera and Sierra-Alvarez (2008) and Yu et al. (2009) have the same order of magnitude. On the other hand, KK FF values for PFOA sorption from Zhi and Liu, (2015) and sorption of PFOS from Senevirathna et al. (2010b) show a vast difference. There are little differences in Langmuir isotherm parameters reported in the literature and our study except for Hansen et al. (2010) that used contaminated well water with very low initial concentration of PFAS and DOC. The initial concentration appears to have an effect on sorption capacities (Coles, 2007). The ph of the system also has an effect on sorption because, phpzc accountable for the interactions between PFAS molecules and the surface of GAC (Deng et al., 2012; Du et al., 2014). Also, differences in sorption capacities can be attributed to the physical properties of GAC and main factors for higher adsorption of PFAS onto GAC relate to the higher surface area, pore size distribution and formation of micelles and hemi-micelles (Yu et al., 2009; Deng et al., 2012). Therefore, differences in the literature values with our study are likely caused by the different initial concentration ranges, experimental conditions, as well as the properties of GAC used in the isotherm studies (Table 4.7). 53
78 GAC Type Table 4.7. Previous studies on sorption of PFAS on to GAC- Langmuir isotherm constants QQ mm (mg PFAS/g GAC) and KK LL (L/mg) and Freundlich isotherm constants KK FF [(mg PFAS/g GAC) (mg PFAS/L) -n ] Amount (g) [PFAS]initial (mg/l) PFAS Langmuir Isotherm QQ mm (mg/g) KK LL (L/mg) Freundlich Isotherm KK FF (mg/g) (mg/l) -n n Experimental Conditions Properties of GAC References F PFOA V=100 ml, ph 7.2,150 PFOS rpm, reaction time= 48h, T=30 0 C F PFOA V=100 ml, 150 rpm, PFOS T=25 0 C F PFOS V=100 ml, ph 6.4, 150 rpm, reaction time= 100h, t=25 0 C GAC (coal) GAC (coal) F400 CBC PFOA PFOS V=100 ml, ph 5.0, reaction time= 168h 0.1 (1.4±0.2) 10-3 PFOA (1.1±0.15) (30±9) ±0.05 V=800 ml, 100 rpm T= Well water C, reaction time = 4 (Ochoa-Herrera & Sierra- Alvarez, 2008) (Zhi & Liu, 2015) weeks Size = mm SA= m 2 /g Size = mm SA = m 2 /g Size = mm BET SA = 712 m 2 /g size = mm SA = 1200 m 2 /g Size = 226 µm (1.4±0.13) 10-4 Well water PFOS (5.3±1.4) 10-3 (8± ± PFOA SA= 924 m 2 /g PFOS V= 125 ml, 145 rpm, Size = mm ph 7.2, reaction time = 1 PFOA days SA= 908 m 2 /g PFOS Size = mm (Senevirathna et al. 2010b) (Yu et al. 2009) (M C Hansen et al., 2010) This study 54
79 4.3. ENHANCEMENT OF PFAS SORPTION ONTO ACTIVATED CARBON Sorption of PFAS onto Treated and Untreated Carbon The extent of sorption of two types of GAC (F400 and CBC) with four different treatments (HCl, NaOH, Persulfate (PS) and H2O2/Fe) is shown in Figure Out of all treatment methods, both the F400 and CBC GAC treated with HCl showed the increased sorption of both PFHxS and PFOA. There is no significant difference in the amount of sorption with reaction time for all treated systems tested. Also, PFHxS and PFOA show a similar trend for extent of sorption with all modified forms of F400 and CBC GAC. The percent difference of sorption on untreated GAC relative to the treated GAC after 2,5, and 10-day reaction time is summarized in Table 4.8. After 10 days, the system reached the equilibrium concentration. The extent of sorption of PFHxS was increased by 8.6% (±0.01%) for the HCl treated F400, and 5.1% (±0.6%) HCl treated CBC, after 10 days. The amount of sorbed PFOA increased by 7.6% (±0.2 %) and 6.4% (±2.5%) for HCl treated F400 and CBC respectively after 10 days. For all other three treatments, the extent of sorption was decreased. The highest decrease in amount of sorption was obtained with H2O2/Fe treated GAC followed by PS treatment, for all cases. It was around 20% for both PFHxS and PFOA with H2O2/Fe treated F400 and around 30% and 25% with H2O2/Fe treated CBC for PFHxS and PFOA respectively. NaOH treated F400, the extent of sorption of both PFHxS and PFOA, was around 1% less than the control which is the lowest drop obtained after 10 days. Table 4.8. Percent difference of sorption on treated GAC relative to untreated GAC. Treatment GAC PFOA PFHxS 2D 5D 10D 2D 5D 10D HCl F400 12% 8% 8% 12% 10% 9% CBC 10% 7% 6% 8% 4% 5% NaOH F400-5% -1% -1% -3% -2% -1% CBC -11% -7% -7% -10% -8% -11% H 2 O 2 /Fe F400-30% -25% -18% -33% -27% -23% CBC -35% -33% -25% -34% -30% -32% PS F400-20% -16% -8% -15% -11% -6% CBC -18% -11% -9% -15% -15% -14% Differences in the extent of sorption are mainly attributed to the physical properties of GAC. The main factors for adsorption of PFAS onto GAC relate to the surface area and pore size distribution (Yu et al., 2009; Deng et al., 2012). According to the results in Table 4.9, treatment of both types of GAC resulted in a decrease in the BET surface area, pore volume and pore width. This may be a result of pore blockage in the micropores caused during treatment due to modification of the textural characteristics of the untreated GAC (Yin et al., 2007). The highest decrease of BET surface area was obtained for H2O2/Fe treated GAC followed by PS treated 55
80 GAC for both F400 and CBC. This was comparable with the reduction in the extent of sorption results too (Figure 4.10). The iron precipitates formed as result of activation can accumulate on the GAC surface and decrease the active surface area (Huling et al., 2007; Hutson et al., 2012; Zhong et al., 2015). An accumulation of sulfur and sodium, which were sodium persulfate residuals, and sulfate anions, which was a byproduct of persulfate oxidation, can result the blockage of sorption sites and decrease the contaminant sorption (Hutson et al., 2012). (a) % Difference in sorption relative to untreated 15% 5% -5% -15% -25% -35% -45% F400 CBC F400 CBC F400 CBC F400 CBC HCl NaOH H2O2/Fe PS 2D 5D 10D (b) % Difference in sorption relative to untreated 25% 15% 5% -5% -15% -25% -35% -45% F400 CBC F400 CBC F400 CBC F400 CBC HCl NaOH H2O2/Fe PS 2D 5D 10D Figure Percent difference in sorption (a) PFHxS (b) PFOA onto hydrochloric acid (HCl), sodium hydroxide (NaOH), hydrogen peroxide catalyzed with iron (H2O2/Fe) and persulfate (PS) 56
81 treated GAC relative to untreated GAC after 2, 5, and 10-day reaction time. Error bars on adjusted values represent the standard errors of the mean estimates. The pka values of PFOA and PFHxS are around 2.8 (USEPA, 2016) and 0.14 (Deng et al., 2012; Du et al., 2014), both lower than the ph (7.2) controlled in this study. Therefore, PFOA and PFHxS mainly exist as anions in the ph of these experiments. The ph of point zero charge (phpzc) of untreated F400 and CBC were found to be 6.1 and 7.5, respectively (Table 4.9). Therefore the surface of F400 tends to be more negatively charged resulting in electrostatic repulsion between F400 surface and PFAS anions and can decrease the sorption capacity to some extent (Deng et al., 2012; Du et al., 2014). On the other hand, CBC has a weakly charged surface (ph~phpzc) with likely negligible electrostatic interactions (Tang et al., 2010). After HCl treatment, the phpzc was slightly less with F400 and it decreased to 5.6 in CBC. Hence the electrostatic repulsion should increase. With NaOH treatment, the phpzc increased for both F400 and CBC creating more positively charged surfaces with potential for increased electrostatic interactions. But, for both HCl and NaOH, treatments show the opposite effect which demonstrates that electrostatic interactions have less influence on sorption than hydrophobic interactions. For both types of GAC, the phpzc was decreased to around 2 with H2O2/Fe and PS treatment creating negative charge on GAC surfaces. That drastic reduction of phpzc may increase the electrostatic repulsion and have influence on sorption to some extent because H2O2/Fe and PS treatments show the higher decreases in the extent of sorption than untreated GAC. Table 4.9. Characteristics of treated and untreated GAC. Conditions BET SA (m 2 /g) pore vol b (cm 3 /g) F400 pore width c (Å) ph pzc UT HCl NaOH H 2 O 2 /Fe PS CBC UT HCl NaOH H 2 O 2 /Fe PS a BJH adsorption SA of pores (m 2 /g) b BJH adsorption pore volume (cm 3 /g) c BJH Adsorption average pore width (4V/A) (Å) 57
82 Scanning Electron Microscopy (SEM) Analysis Figure 4.11 and Figure 4.12 show the SEM of F400 and CBC GAC types before and after treatment along the EDX pattern of untreated and H2O2/Fe treated GAC. Table 4.10 and Table 4.11 present the weight percentage of each element present in treated and untreated F400 and CBC GAC, respectively. Appendix A.3 provides additional EDX patterns that support this study. The changes in the surface microstructure due to modifications can be directly observed in SEM images. A complex pore network including small pores and cracks can be seen over the GAC surface. Also, treatment affects surface structures different for F400 and CBC GAC types. The treatments do not significantly change the morphology of F400 surface compared to the untreated F400. But, CBC surfaces demonstrate some changes due to treatment. In comparison to the untreated CBC, pore widening can be seen in the HCl and PS-treated CBC, whereas small pore structures can be seen in NaOH and H2O2/Fe treated CBC. Elemental analysis provided the complete weight percentage of elemental composition of both treated and untreated carbon as shown in Table 4.10 for F400 and in Table 4.11 for CBC. The elemental compositions obtained for two points marked in SEM micrographs of treated and untreated F400 and CBC were included in Table 4.10 and Table 4.11 accordingly. Chloride content was increased in both F400 and CBC HCl treated GAC. This is due to some chlorine that remained chemisorbed on the GAC surface and decreased micropore volume and width (Table 4.9) (Moreno-castilla et al., 1998). Hydroxide ions were expected to react with surface functional groups on the GAC surface with NaOH treatment. Oxygen content is increased in both GAC types with NaOH treatment and sodium was detected in F400 NaOH treated GAC. Also, sulfur content was increased in both PS treated GAC types. Therefore, an accumulation of sulfur and sodium may result in blockage of sorption sites and decreased the micropore volume and width (Table 4.9). In the H2O2/Fe treated GAC, a high amount of Fe is accumulated in the pores (Point 1of both H2O2/Fe F400 and CBC micrographs) which is responsible for the pore blockage and lower micropore volume and width. Also, oxygen content is increased after H2O2/Fe treatment. Table Weight % of elements present in each point marked SEM micrographs of F400- untreated GAC and F400 H2O2/Fe treated. F400 Weight Percentage of Elements C O Al Si S Cl Fe Na UT_ UT_ HCl_ HCl_ NaOH_ NaOH_ PS_ PS_ H 2 O 2 /Fe_ H 2 O 2 /Fe_
_f400_naoh 1 1 2 2 (d)_f400_ps")

")
, (c) sodium hydroxide (NaOH), (d)")
 treated")
83 (a)_f400_ut 2 (b)_f400_hcl 1 (c)_f400_naoh (d)_f400_ps (e)_f400_h2o2/fe F400_UT_1 F400_UT_2 F400_H 2 O 2 /Fe_1 F400_H 2 O 2 /Fe_2 Figure Scanning electron micrographs of F400 (a) untreated (UT), (b) hydrochloric acid (HCl), (c) sodium hydroxide (NaOH), (d) persulfate (PS), and (e) hydrogen peroxide catalyzed with (H2O2/Fe) treated GAC; EDX patterns of F400 UT and H2O2/Fe treated GAC. 59
_cbc_ps (e) CBC_H2O2 2")

 untreated (UT), (b) hydrochloric")
, (d) persulfate (PS) and (e)")
 treated GAC; EDX patterns of")
84 (a) CBC 2 1 (b)_cbc_hcl 2 1 (c) CBC_NaoH 1 2 (d)_cbc_ps (e) CBC_H2O CBC_UT_1 CBC_UT_2 CBC_H 2 O 2 _1 CBC_H 2 O 2 _2 Figure Scanning electron micrographs of CBC (a) untreated (UT), (b) hydrochloric acid (HCl), (c) sodium hydroxide (NaOH), (d) persulfate (PS) and (e) hydrogen peroxide catalyzed with (H2O2/Fe) treated GAC; EDX patterns of CBC UT and H2O2/Fe treated GA. 60
85 Table Weight % of elements present in each point marked SEM micrographs of CBC H2O2/Fe treated and CBC-untreated GAC. CBC Weight Percentage of Elements C O Al Si S Cl Fe K UT_ UT_ HCl_ HCl_ NaOH_ NaOH_ PS_ PS_ H 2 O 2 /Fe_ H 2 O 2 /Fe_ Fourier Transform Infrared (FTIR) Analysis FTIR transmission spectra for the F400 and CBC untreated and treated GAC are represented in Figure Also, possible vibration assignments per band position are included in Table The peaks or broad bands observed in the spectra are due to the presence of functional groups. In the samples, adsorption peaks in between cm -1 and cm -1 are due to the C-C band in alkanes and out of plane C-C band respectively. These can be seen in all the samples (Chiang et al., 2002). A new band appears in HCl, NaOH, PS and H2O2/Fe-treated F400 and CBC treated GAC in between cm -1 assigned to C-O bond stretching and O-H bending modes of alcohol, phenol, and carboxylic groups (Pradhan & Sandle, 1999). The adsorption bands of overlapping aromatic ring bands and C=C vibrations with the band of C=O moieties appeared between cm -1 (Park & Jang, 2002). This band can be observed in all samples, with a small intensity of PS treated F400. Also, C-O-C vibration from ether structures can be observed in the range of cm -1 (Park & Jang, 2002; Pradhan & Sandle, 1999). The O-H stretching mode of the hydroxyl functional group arises around 3500 cm -1 which can be seen in all the samples of CBC with similar intensity and high intensity with broad band in NaOH-treated F400 (Pradhan & Sandle, 1999). Also, it was reported that the bond in the region of 1600 cm -1 can be a highly conjugated carbonyl groups (C=O) related to the structure of acetylacetone (Moreno-castilla et al., 1998; Pradhan & Sandle, 1999). Therefore, the results of FTIR analysis confirm that the treatments of GAC increase the surface oxygen complexes compared to untreated GAC. 61
86 (a) H 2 O 2 /Fe (b) H 2 O 2 /Fe Transmittance (arbitrary units) PS NaOH HCl UT Transmittance (arbitrary units) PS NaOH HCl UT Wave number (cm -1 ) Wave number (cm -1 ) Figure FTIR patterns of untreated (UT), hydrochloric acid (HCl), sodium hydroxide (NaOH), persulfate (PS) and hydrogen peroxide catalyzed with (H2O2/Fe) treated (a) F400 and (b) CBC GAC. Table FTIR frequencies for F400 and CBC GAC types. Possible Adsorption Peaks (cm -1 ) assignments F400 CBC UT HCl NaOH PS H 2 O 2 /Fe UT HCl NaOH PS H 2 O 2 /Fe C-C (alkane) Out of plane ring C-C C-O alcohol Aromatic C=C C-O-C CO O-H Previous studies reported that increases in surface functional groups are partially responsible for reduction of contaminant uptake (Hutson et al., 2012). Carbon surface acidity is an important factor on the adsorption of hydrophobic contaminants. Introducing surface oxygen functional groups with acidic character including phenols increases the polarity of the surface of GAC and reduces the adsorption of hydrophobic contaminants (Karanfil and Kilduff, 1999; Hutson et al., 2012). Moreover, contaminant access to the graphite basal plane of GAC reduced with polarized surfaces due to water clusters attracted onto the polar surface sites resulting in pore blockage. Also, that will reduce the interaction between hydrophobic contaminants with the surface and reduce the sorption of contaminants (Hutson et al., 2012). 62
. Once persulfate starts decomposing to generate protons, the solution ph falls to the acidic region. However, with higher persulfate concentration, ph drops rapidly under heat activation.")
87 4.4. DESTRUCTION OF PFAS USING ACTIVATED PERSULFATE Persulfate Decomposition in the Aqueous Phase Persulfate decomposition in unbuffered aqueous phase is a function of supplied heat (Liu et al., 2012). Once persulfate starts decomposing to generate protons, the solution ph falls to the acidic region. However, with higher persulfate concentration, ph drops rapidly under heat activation. The persulfate (10g/L or 52.1mM) decomposition in the aqueous phase was found to be 90±2% within 1 hour under heat activation at 80ºC and 88±2 % at the end of 48 hours in systems without heat activation at 30ºC (Figure 4.14). Besides it was found that in the presence of GAC in an aqueous system, persulfate decomposition to sulfate under heat activation was around 80% within 24 hours compared to less than 70% sulfate recovery in a similar condition with the absence of GAC (Figure 4.14 (a)). Also, with the presence of GAC, persulfate decomposition to sulfate was observed to be less than 15% at room temperature conditions (without external heat supply). As also observed by An et al. (2015), the solution ph dropped more quickly in heat activated persulfate systems with GAC than in any other conditions (Figure 4.14 (a)). Johnson et al., (2008) noted the increase in persulfate decomposition rates under heat activation with the presence of organic and mineral compounds in soil. In the presence of GAC in the aqueous phase, ph sharply decreased to less than 2 within 4 hours, while it required around 6 to 8 hours for the same ph drop in the aqueous phase system without GAC. The aqueous phase heatactivated persulfate decomposition was measured to Peyton (1993) (Figure 4.14 (b)), and was assumed to follow first order kinetics. (a) Figure (a) Persulfate decomposition to sulfate in different unbuffered aqueous system conditions, and (b) first order kinetics plot of persulfate decomposition in unbuffered aqueous phase without GAC at 30ºC and 80ºC. (b) Oxidation of PFOA and PFOS in the Aqueous Phase Use of Single Oxidant Dose: Amongst different unbuffered aqueous phase PFOA oxidation and control reaction conditions mentioned in Section 3.6.2, in the condition of single dose oxidation at 80 C where persulfate (10g/L or 52.1 mm) was heat activated, the maximum 63
 and another with added persulfate and maintained at 30 C (single dose oxidation, 30 C), the PFOA")

88 of around 96% of PFOA degradation was observed within the first 8 hours (Figure 4.15 (a)). In the control samples, one with no added persulfate and maintained at 80 C (control, 80 C) and another with added persulfate and maintained at 30 C (single dose oxidation, 30 C), the PFOA concentration remained the same throughout the observation period with minor fluctuations from the initial value. This affirmed that persulfate and supplied heat in combined are essential for degradation of PFOA. Obtained results of aqueous phase PFOA degradation were similar as previous results (Hori et al., 2008; Liu et al., 2012; Park et al., 2016). The fluoride yield and shorter chain PFCAs, mainly PFHpA, PFHxA, PFPeA and PFBA, were measured at different time intervals of reaction period (Figure 4.15 (b)). Decreasing concentration of PFCAs along with increasing fluoride yield was assumed because of sequential unzipping of CF2 ( Lee et al., 2012;Liu et al., 2012). Yang et al. (2013) attempted PFOS degradation with UV-activated persulfate that is similar heat-activated persulfate oxidation, and observed shorter chain PFCAs byproducts resulted from PFOS defluorination. However, no observed oxidation byproducts including fluoride affirmed the PFOS were unaffected during single dose heat activated persulfate oxidation (Figure 4.15 (a)). Park et al. (2016) also confirmed no defluorination of PFOS with heat activated persulfate oxidation. About 20±5% losses in PFOS concentration was seen in the case of a single dose heat activated persulfate oxidation at 80 C, while PFOS was unaffected in control conditions (Figure 4.16). Sundström et al. (2012) observed surface adherence of just PFOS molecule, but neither PFOA nor other shorter chain PFCAs and PFSAs, onto the wall surface of polypropylene containers. So, the observed PFOS losses in heatactivated persulfate oxidation were assumed due to sorption onto the walls of containers. (a) (b) Figure (a) Change in PFOA concentrations along the reaction period in different unbuffered aqueous phase conditions, and (b) observed intermediates and byproducts during single dose oxidation of PFOA at 80 C. Error bars on adjusted concentration values represent the standard errors of the mean estimates. 64

89 Figure Change in PFOS concentrations along the reaction period in different unbuffered aqueous phase conditions. Error bars on adjusted concentration values represent the standard errors of the mean estimates Multiple Oxidant Doses: To avoid rapid sulfate radical scavenging reactions and to make maximum utilization of sulfate radicals, multiple small dose concentrations of persulfate was spiked into the system to maintain condition with an attempt to improve degradation of PFOA and PFOS. Except for the oxidant dosing pattern, all the reaction conditions in the multiple dose aqueous phase treatment remained the same as for the single dose aqueous phase treatment. In a 120-hour reaction period, 2 g/l or 10.4 mm of persulfate was spiked five consecutive times at an interval of 24 hours to achieve a total dose of 10 g/l. In the case of PFOA during multiple dose aqueous phase oxidation, around 95% of PFOA disappearance was observed within 24 hours, just with the first dose, and complete disappearance was seen within 48 hours (Figure 4.17 (a)). PFOA defluorination progressed along the reaction period with every addition of a new dose (2g/L), unlike in single dose aqueous phase oxidation of PFOA where maximum fluoride yield was observed within first 24 hours (Figure 4.17 (b)). Comparing fluoride yields, the highest deflorination yield from degradation of PFOA in aqueous phase was recorded with the use of multiple dose oxidation. Single dose oxidation produced 83±5% and 89±3% of fluoride (F - ) at 24 and 168 hours, respectively. While with the multiple dose, 69±3% and >99% of fluoride (F - ) was achieved respectively at 24 and 120 hours. Multiple dose oxidation showed no effects on concentration of PFOS, and the results were like the single dose oxidation of PFOS (Figure 4.18) Molar Balance Across the Aqueous Phase Batch Oxidation Systems: Referring to the molar balance conducted across every aqueous phase oxidation system, complete mineralization of PFOA and its shorter chain compounds was seen with multiple dose persulfate oxidation in the aqueous phase (Figure 4.19 (a)). Although a higher loss and unrecovered portion was observed during PFOA oxidation with multiple persulfate doses (Figure 4.19 (a)), the fluoride recovery was relatively high with 98.8% compared to 70.4% from single dose oxidation. In the case of PFOS, as seen in Figure 4.19 (b), with no defluorination measured, the PFOS was found 65
 (b) Figure 4.17.")
 Observed intermediates and byproducts during")


90 unaffected by persulfate oxidation but its disappearance was assumed due to surface sorption onto vial surface. (a) (b) Figure (a) Comparison of single-dose and multiple-dose aqueous phase persulfate oxidation of PFOA, and (b) Observed intermediates and byproducts during multiple-dose oxidation of PFOA at 80 C. Error bars on adjusted concentration values represent the standard errors of the mean estimates. Figure Comparison of single-dose and multiple-dose aqueous phase persulfate oxidation of PFOS. Error bars on adjusted concentration values represent the standard errors of the mean estimates 66

91 (a) (b) Figure Molar balance across batch systems comparing different aqueous phase oxidation and control conditions containing (a) PFOA and (b) PFOS. 67
92 Oxidation of PFOA and PFOS Sorbed onto Activated Carbon PFAS Sorbed GAC Surface and Oxidation Chemistry: In general, PFAS have the capability to sorb onto the solid surfaces of different surface polarity (Du et al., 2014), but their sorption rates are highly influenced by electrostatic and hydrophobic interactions (Zhang et al., 2011; Merino et al., 2016). The factors that drive sorption are GAC s surface properties (elemental composition, surface acidity or phpzc) and physical properties (active surface area, pore size distribution and pore volume) (Zhi & Liu, 2015). Because both PFOA and PFOS have negatively charged functional groups and electronegative carbon-fluoride tail, they tend to sorb easily onto a positively charged GAC surface because of electrostatic attraction. Even if the GAC surface is neutral or negative in charge, PFOA and PFOS will adhere to the surface overcoming electrostatic repulsion because of their hydrophobic and oleophobic nature (Du et al., 2014; Yan et al., 2014). The Filtrasorb-400 (F400) GAC used in this experimentation has a neutral surface charge with phpzc value of 6.8±0.7. Thus, PFOA and PFOS uptake during sorption step was assumed from their hydrophobic interactions with the GAC. Zhi & Liu (2015) analyzes the pore volume distribution in F400 GAC using Density Functional Theory (DFT) and confirms F400 GAC as more microporous and mesoporous structure. The nature of pore volume distribution was assumed as a dominant reason for the extended PFOA and PFOS sorption uptake displayed by F400 GAC (Yu et al., 2009; Zhang et al., 2011; Zhi & Liu, 2015). Particularly, PFOA and PFOS, with more hydrophobic nature and comparatively lower CMC values than other shorter chain compounds (<C8), show a great tendency to form micelles in the porous structure (Yu et al., 2009; Zhang et al., 2011). The concentrations of PFOA and PFOS in this study were 19.3 µmol/g (equivalent to 38.6 µm) and 6.8 µmol/g (equivalent to 13.6 µm), respectively. The concentrations were found to fall in the range of of their critical micelle concentrations (CMC) (Pabon & Corpart, 2002; Johnson et al., 2007; Yu et al., 2009; Guelfo & Higgins, 2013). In addition, PFOA and PFOS pore volume concentrations calculated as according to Section 4.3.3, around mm and mm respectively, were found to fall within the range of CMC values. Thus, PFOA and PFOS were presumed to potentially form hemi-micelles (Figure 4.20 (a)) and micelles (Figure 4.20 (b)) following sorption (Du et al., 2014; Yu et al., 2009). According to Du et al. (2014), when the perfluorinated tail of one compound encounters a functional head of another compound, they tend to stick to each other overcoming electrostatic repulsion. Guelfo & Higgins (2013) state that the hemi-micelles and micelles have the potential to support apparent sorption of PFOA and PFOS molecules further due to hydrophobic interactions between perfluorinated compounds. Also, the formation of micelle or aggregation PFOA or PFOS easily block the pores and prevent the inter particle diffusion of molecules (Figure 4.20 (b)) (Yu et al., 2009; Zhang et al., 2011). During heat-activated persulfate oxidation of PFOA or PFOS sorbed onto GAC, as the ph of the solution drops below the phpzc value of GAC, the produced large pool of hydrogen cations protonate the GAC surface (Yan et al., 2014) and dominate the formation of electrical double layer with positively charged inner layer and outer layer complex containing bulk ions (Figure 4.20 (c) & (d)). Following GAC surface protonation, the PFOA or PFOS compounds that present on the GAC individually or through hemi-micelles as a result of hydrophobic and ion exchange interactions, rearrange themselves to form an electrostatic bond with protonated GAC surface (Yu et al., 2009). The deposits of monovalent and polyvalent cations on the GAC also aid to 68
93 attract compounds as result of electrostatic interactions. McKenzie et al. (2015) reported an increase in PFCAs (PFOA) and PFSAs (PFOS) sorption with the increase in aqueous phase polyvalent cation (i.e. Mg 2+, Ca 2+, H +, Na + ) concentration and with acidic ph. Sundström et al. (2012) observed a change in solubility and partition coefficient of PFOA and PFOS in the presence of organic and inorganic mineral compounds such as chloride, phosphate, and bicarbonates. The increase in ionic strength of the solution surpasses the ph effects on GAC. However, as noted by Du et al. (2014) and Merino et al. (2016), increasing the ionic strength of solution weakens the electrical double layer on GAC and leads to weakened electrostatic interaction between charged surface and anionic PFAS. The shorter chain anionic complexes, fluoride, and byproducts formed following oxidation get suspended in the aqueous phase during aqueous phase oxidation of PFOA as described in Section Unlike that, in oxidation of PFOA sorbed onto GAC, the fluoride (Ravančić & Stanić, 2015) and possible byproduct including complex shorter chain PFAS (Du et al., 2014; Zhang et al., 2011), despite being anionic, were believed to sorb onto charged GAC surface because of their electrostatic interaction with the protonated GAC surface (Figure 4.20 (c)). While PFOA and PFOS molecules aggregate to form hemi-micelle or micelle they tend to block pores and prevent the diffusion of other molecules (Yu et al., 2009; Zhang et al., 2011). As shown in Figure 4.20 (d), the reactive species (sulfate radicals and sulfate ions) diffuse through pores and may break micelles and hemi-micelles and promote PFAS molecule s interaction with the protonated GAC surface, and possibly push PFAS further deep into the porous structure. Figure The possible arrangement of PFOA and PFOS on GAC (a) surface and (b) pores during control condition; representation of protonated GAC surface with persulfate oxidation mechanism and arrangement of molecules on the (c) surface and (d) within the porous structure following oxidation. 69
 and multiple dose oxidation (heat activated persulfate dose 2g/L 5 times) were tested on PFOA")
94 Single and Multiple Dosing of Persulfate: Single dose oxidation (heat activated persulfate dose 10 g/l) and multiple dose oxidation (heat activated persulfate dose 2g/L 5 times) were tested on PFOA and PFOS sorbed onto GAC. In the case of PFOA sorbed onto the GAC, about 29.5±9.2% and 40.9±7.3% of PFOA was desorbed to the aqueous phase and degraded within 120 hours with a single dose and multiple dose heat activated oxidation, respectively (Figure 4.21 (a)). About 10±6% of PFOA was desorbed to the aqueous phase in control not dosed with oxidant and maintained at 30 C, and 20±2% of PFOA was desorbed to the aqueous phase in control not dosed with oxidant but maintained at 80 C. Detected aqueous phase PFOA concentrations during 120h of reaction or control period are shown in Figure 4.21 (b). In the case of PFOS, under the influence of heat activated persulfate about 40±4% and 15±2% of PFOS was desorbed from the GAC to the aqueous phase within 120h in a single dose and multiple dose systems, respectively (Figure 4.22 (a)). In comparison, 13±1% of PFOS was desorbed to the aqueous phase in controls that was not dosed with oxidant and maintained at 30 C, and 16±1% of PFOS was desorbed to the aqueous phase in 120h in the control that was not dosed with oxidant but maintained at 80 C (Figure 4.22 (a)). PFOS was confirmed to resist heat-activated persulfate oxidation in Section The drop in PFOS concentration in aqueous phase conditions in both oxidation and controls along the reaction periods with no observed byproducts or intermediates was presumed because of losses onto the container wall and sorption back onto GAC caused by hydrophobic nature of PFOS (Figure 4.22 (b)). Comparing persulfate oxidant dosing patterns, maximum desorption recovery of PFOA from GAC over the reaction period was observed with the use of multiple oxidant doses, while it was maximum with the use of single dose oxidation in case of PFOS. High system temperature and acidic ph both combined, break the biphasic behavior of PFAS, and aid in inter particle diffusion from the interior to the exterior of the GAC that increases the contact between PFAS and sulfate radicals (Hutson et al., 2012; Lee et al., 2012). (a) (b) Figure (a) Differences in total moles of PFOA sorbed onto GAC before and after oxidation or control period in different conditions, and (b) PFOA concentrations detected in the aqueous phase over the time in various conditions. Error bars on adjusted concentration values represent the standard errors of the mean estimates. 70
 Differences in total moles of PFOS sorbed onto GAC before and after oxidation or control period in different conditions, and (b) PFOS concentrations detected in the aqueous phase over the time in")
95 (a) (b) Figure (a) Differences in total moles of PFOS sorbed onto GAC before and after oxidation or control period in different conditions, and (b) PFOS concentrations detected in the aqueous phase over the time in different conditions. Error bars on adjusted concentration values represent the standard errors of the mean estimates. The PFOA concentrations detected in aqueous phase during 120 hours of oxidation and control conditions were in range from 0 to 70 nm, which was very minimal compared to total amount of PFOA sorbed onto the GAC (38.6 µm or equivalent to 19.3µmol/g) (Figure 4.21 (a)). PFOA detected in the aqueous phase was relatively high during oxidation conditions compared to controls (Figure 4.21 (b)). Although the shorter chain PFCAs produced during oxidation were assumed to sorb onto GAC (Section ), their detection in the aqueous phase at low concentration range (0-15 nm) in both single and multiple dose oxidation conditions, confirmed the possible degradation of PFOA. In an experiment conducted to find influence of ph on fluoride sorption onto GAC (Appendix A.6), at ph 2, more than 95% and 69% of fluoride sorption was seen with and without the presence of sulfate in the aqueous system, respectively. So, fluoride from possible defluorination of PFOA was presumed to sorb onto GAC. To determine if PFOA or PFOS remain sorbed onto GAC after 120 hours of reaction period, the GAC was solvent extracted as according to the Section Referring to molar balance conducted across oxidation systems containing PFOA or PFOS sorbed onto GAC, the highest PFOA removal was seen in multiple oxidant dosing system (Figure 4.23 (a)). In the case of PFOS sorbed onto GAC (Figure 4.23 (b)), relatively high loss and unrecovered portions were seen in both oxidation and control conditions. Under the influence of multiple oxidant doses, PFOA was desorbed from GAC to aqueous phase and oxidized under the influence of sulfate radicals, while in single dose oxidation of PFOA sorbed onto GAC it was likely that the PFOA degradation was limited by scavenging of active sulfate radicals (Figure 4.21 (a)). In PFOS systems, large desorption to aqueous phase was observed with a single dose presumably because of the immediate ph drop and high temperature conditions (Figure 4.22 (a)). The sulfate radicals and ions influence on the weakly GAC bound PFOS molecules, while hydrogen ions seeking to protonate on GAC surface, can possibly lead to rearrangement of PFOS micelle. But in the multiple dose oxidation condition, the scarcity of active sulfate radicals and hydrogen ions resulted from scavenging reactions was assumed to be ineffective in acting on PFOS molecules 71
96 that were generally more hydrophobic than PFOA. The observed losses of PFOA (Figure 4.21 (a)) and PFOS (Figure 4.22 (a)) to aqueous phase in controls were assumed because of diffusion of weakly bound PFOA or PFOS from the hemi-micelle and micelle formed on the GAC. Under the influence of heat in the controls, the diffusion rate from GAC to the aqueous phase was presumed to be higher, thus more losses of PFOA (Figure 4.21 (a)) and PFOS (Figure 4.22 (a)) to aqueous phase were observed in controls maintained at 80 C compared to the ones at 30 C. 72

97 (a) (b) Figure Molar balance across batch systems comparing different aqueous phase oxidation and control conditions containing (a) PFOA sorbed GAC, and (b) PFOS sorbed GAC. 73
98 Sorption of PFOA and PFOS onto Treated GAC An analysis of molar balance was conducted after every reaction stage in oxidation and control batch systems. The sacrificial vials from reaction stages were solvent extracted to estimate PFAS remain sorbed onto GAC. The recovery of PFOA (Figure 4.25) and PFOS (Figure 4.26) during solvent extraction was higher from the GAC that was treated with either heat-activated persulfate (in oxidation series) or just sulfate oxidation (in control series) compared to other stages. In the case of PFOA, around 95.7% and 92.9% of PFOA was recovered by solvent extraction from the GAC treated with activated persulfate (Figure 4.25 (a)) and just sulfate (Figure 4.25 (b)), respectively. The byproducts of PFOA (Figure 4.24) were observed only during heat activated persulfate oxidation (Figure 4.25 (a)). Although PFOA was seen to desorb to the aqueous phase during rinse and equilibration stage, no byproducts or intermediates were observed in either of their aqueous or extraction phases. Like the phenomenon explained in Figure 4.20 (c) & (d), in PFOA oxidation series (Figure 4.25 (a)), the oxidant species resulting from heat activated persulfate oxidation were assumed to break hemi-micelle or aggregates of PFOA on GAC, and strongly protonate the GAC surface. The persulfate oxidization was assumed to enhance the electrostatic attraction between the anionic perfluorinated chain and protonated GAC surface. In the PFOA oxidation series (Figure 4.25 (a)), relatively greater amount of PFOA was recovered from GAC in stages after persulfate oxidation. In the PFOA control series (Figure 4.25 (b)), the extraction recovery yield decreased from around 92.9% (after sulfate treatment stage) to around 62% (after the rinsing and equilibrium stage), and further to around 32% and 25.6% (after sorption II and III, respectively). In the PFOA oxidation series (Figure 4.25 (a)), the PFOA extraction recovery was reduced from 95.63% (after the persulfate treatment) to 63.4% (after the rinsing and equilibrium stage), but it remained relatively the same until the end of sorption II and III. The higher extraction recovery of PFOA from GAC in the PFOA oxidation series represents that the GAC had continued to retain its protonated surface resulting from heat-activated persulfate oxidation even after multiple rinses, equilibrium, and multiple sorption stages. In the case of PFOS, around 80.3% and 86.6% of PFOS was recovered by solvent extraction from the GAC treated with activated persulfate (oxidation series, Figure 4.26 (a)) and just sulfate (control series, Figure 4.26 (b)), respectively. In both oxidation and control series of PFOS (Figure 21(a) & (b)), after rinsing and equilibration of the GAC, extraction recovery dropped to the 20-25% range, and remained the same in the following stages. Unlike PFOA oxidation or control series, the PFOS extraction recovery was found to be very similar in both the oxidation and control series. The activated persulfate or sulfate treatment was assumed to break hemi-micelle or aggregates of PFOS, and displace PFOS further deep into pores. But seeing low extraction recovery from GAC after the rinsing and equilibration stage in the PFOS oxidation series (Figure 4.26 (a)), the GAC surface protonation was assumed to show no effects on hydrophobic PFOS molecules. PFOS molecules were assumed not to form electrostatic interaction with protonated GAC surface. Like results seen during oxidation of the PFOS sorbed GAC in Section , with no byproducts or intermediates detected in aqueous or extraction phase, PFOS remained unaffected by oxidation. The sorption equilibrium concentration (Ce) of PFOA (Figure 4.27 (b)) and PFOS (Figure 4.28 (b)) in the aqueous phase after 5-days of sorption I (1 st sorption) was around 250 and 1070 nm, respectively. However, Ce values were reduced to less than 10 and 25 nm after treatment, rinsing and equilibrium stages in the oxidation and control series of both PFOA (Figure 4.27 (b)) and 74
99 PFOS (Figure 4.28 (b)). In the case of PFOA, after introducing a new contaminant dose concentration, the Ce values after 3-days sorption II (2 nd sorption) stage was measured to be around 80 and 41 nm for oxidation and control series, respectively. Similarly, the Ce values after 3-days sorption III (3 rd sorption) stage was measured to be around 230 and 30 nm for oxidation and control series, respectively. The achieved Ce values after sorption II and sorption III stage were seen to be lesser than Ce values from sorption I. In the case of PFOS, Ce values after sorption II and III remained lower in value than after sorption I (Figure 4.28 (b)). The total amount of PFOA and PFOS sorbed onto GAC against the amount extracted using solvent extraction in oxidation and control stages is mentioned in Figure 4.27 (a) and Figure 4.27 (b). Although the contaminant dose concentrations during sorption I, II & III were similar, the reduction in sorption equilibrium concentration (Ce) in sorption II and III compared to sorption I showed potential increase in sorption capacity of the GAC after treatment with persulfate oxidation or sulfate. In both oxidation and control series, very minimum number of PFOA (Figure 4.27) and PFOS (Figure 4.28) got desorbed to aqueous phase during persulfate or sulfate treatment, rinse and equilibrium reaction stages. Seeing less than 1% desorption of PFOA or PFOS from the GAC to aqueous phase during oxidation stage, it was asserted that destruction of compounds cannot be achieved with heat activated persulfate. Instead, heat activated persulfate oxidation treatment can be effectively used to increase the PFAS sorption onto GAC by breaking the aggregates of micelles and hemi-micelles that block active surface area and pores. Figure Byproducts detected in the aqueous phase after 3-days heat activated persulfate oxidation of PFOA. Error bars on adjusted concentration values represent the standard errors of the mean estimates. 75
100 (a) (b) Figure Molar balance across (a) oxidation series and (b) control series of PFOA batch systems after every reaction stage. (*) PFOA remaining sorbed onto GAC after reaction period were solvent extracted. [(Recovered + Unrecovered) = (Total PFOA sorbed onto GAC)]. 76
 PFOS remaining sorbed onto GAC after reaction period were solvent extracted. [(Recovered + Unrecovered) = (Total PFOS sorbed onto GAC)].")
101 (a) (b) Figure Molar balance across (a) oxidation series and (b) control series of PFOS batch systems after every reaction stage. (*) PFOS remaining sorbed onto GAC after reaction period were solvent extracted. [(Recovered + Unrecovered) = (Total PFOS sorbed onto GAC)]. 77
102 Figure (a) PFOA remain sorbed onto GAC and (b) PFOA aqueous phase concentration, after each stage in PFOA oxidation and control series. Error bars on adjusted values represent the standard errors of the mean estimates. 78
 PFOS remain sorbed onto GAC and (b) PFOS aqueous phase concentration, after each stage in oxidation and")
103 Figure (a) PFOS remain sorbed onto GAC and (b) PFOS aqueous phase concentration, after each stage in oxidation and control series. Error bars on adjusted values represent the standard errors of the mean estimates. 79
104 4.5. TREATMENT OF FIELD GAC WITH ACTIVATED PERSULFATE Pre-Oxidation Figure 4.29 shows the initial mass of PFAS extracted from GAC prior to persulfate treatment. Extraction results showed that the mass of PFHxS and PFOS extracted from spent GAC was greater than all other PFAS measured/detected in both field GAC (F400 and virgin coconut shellbased). This is not surprising as the sulfonates are known to sorb more onto GAC than the carboxylates due to their high hydrophobicity of their sulfonic group and their fluorocarbon chain length (Higgins & Luthy, 2006; Ochoa-Herrera & Sierra-Alvarez, 2008; Hansen et al., 2010; Deng et al., 2012). Figure Initial mass of PFAS extracted from GAC prior to persulfate treatment per 100 g of GAC. Error bars on adjusted concentration values represent the standard errors of the mean estimates Persulfate Treatment Persulfate Decomposition: During saturation of GAC with synthetic groundwater (10 pore volumes), the initial ph value measured in all columns was between 6.0 and 7.0. Upon the introduction of heat activated persulfate (10 g/l or 52.1 mm, 80 ) into the treatment columns, the solution ph measured in column effluents was found to drop to an acidic level in treated columns, whereas there was no significant change in effluent ph in the control columns (Figure 4.30) indicating that persulfate was decomposed. This change in ph results in generation of more sulfate radicals and sulfate ions via acid catalysis in an acidic environment, which might lead to an increase in contaminant degradation. However, Hori et al. (2005, 2008) and Liu et al. (2014) have reported the insignificant effect of ph on PFAS degradation in the aqueous phase. Effluent 80
105 sulfate (persulfate byproduct) concentrations measured in the treatment columns decreased with reaction time (Figure 4.30) indicating persulfate decomposition. The same effect was observed for the virgin coconut GAC oxidation tests. (a) (b) Figure (a) Change in effluent ph upon introduction of heat activated persulfate, and (b) change in effluent sulfate concentrations in treated columns for F400 GAC and virgin coconut GAC. GAC upon introduction of heat activated persulfate into columns (initial persulfate concentration 10 g/l, there was no injection of heat activated persulfate in treated columns, so effluent sulfate concentrations were not reported). 81
106 Aqueous Phase PFAS: The concentration of PFAS lost in the aqueous phase prior to persulfate treatment and after persulfate treatment were measured periodically (Figure 4.31). Effluent PFAS concentrations detected in the treated columns after persulfate treatment were found to be slightly lower than those initially detected prior to treatment. As the reaction period progressed, the PFAS effluent concentrations were seen to be slightly decreasing. PFCAs have been reported in literature to be amenable to heat activated persulfate (Lee et al., 2012; Park et al., 2016; Yin et al., 2016), so PFOA was used as a reference here to determine the reason for decreased effluent concentrations. Studies on the PFOA degradation pathway by heat activated persulfate have proposed that upon PFOA attack by the formed sulfate radical, PFOA decomposes via a stepwise pathway to form shorter chain PFCAs as intermediates by losing CF2 units as like in Section It was assumed that PFHpA and PFHxA were first formed as degradation intermediates, with their concentrations first increasing and later decreasing with reaction time, followed by the formation of further shorter PFCAs (Liu et al., 2012). However, this is in contrast with this study. The concentration of PFHpA and PFHxA measured in the treated column effluent was not found to increase after oxidation (Figure 4.31) nor did the concentrations of PFPeA and PFBA increase. In the control (Figure 4.31), there was no observed difference in the PFAS concentration measured in the control column prior to and after treatment indicating desorption of PFAS into solution, which suggests that there was still available mass associated with the GAC. McKenzie et al. (2015) investigated the effect of chemical oxidants on PFAS transport in 1-D porous media columns and found no increase in effluent PFAS concentrations after oxidant (persulfate) application to columns containing PFAS contaminated sand PFAS Defluorination: Low defluorination efficiency, expressed as moles of F formed/moles of fluorine content in initial PFAS was measured in columns after treatment with heat activated persulfate which led to a lack of fluorine mass balance. This was probably due to released fluoride adsorbing to GAC. Fluoride adsorption onto GAC was tested at different ph levels to confirm this, and results showed that greater adsorption occurred at low ph levels when compared to high ph levels. A test was also conducted to determine if sulfate interference played a role in the low fluoride detected in the effluent. Results showed that sulfate does not interfere with fluoride analysis in the presence of GAC (Appendix A.6). The low fluoride detection may also be due to low/no transformation of PFAS into fluoride, indicating that little or no degradation/oxidation by heat activated persulfate occurred Post Oxidation: After oxidation, extraction was conducted to account for the change in mass of PFAS sorbed onto GAC by subtracting the measured PFAS masses on GAC after oxidation (post-treatment) from the measured masses before persulfate oxidation (pre-treatment). The results show that there was a mass difference between treated and untreated GAC, especially for the PFSAs, when compared to the PFCAs. The mass reduction in PFHxS and PFOS was more pronounced than other PFAS in the treated column. Figure 4.32 shows the mass difference between untreated GAC, persulfate-treated GAC (post-treatment), and control GAC (control) for F400 GAC and virgin coconut shell-based GAC, respectively. 82
107 Figure PFAS concentration measured in (a) treated and (b) control effluent. 83
108 (a) 60 Pre-treatment Post-treatment Post-control Mass of PFAS (mg/100 g of GAC) PFBA PFPeA PFBS PFHxA PFHpA PFHxS PFOA PFOS (b) 7 Pre-treatment Post-treatment Post-control Mass of PFAS (mg/100 g of GAC) PFBA PFPeA PFBS PFHxA PFHpA PFHxS PFOA PFOS Figure Mass difference between untreated GAC (pre-treatment), persulfate treated GAC (post-treatment), and control GAC (post-control) for (a) F400 GAC and (b) virgin coconut shellbased GAC. Error bars on adjusted concentration values represent the standard errors of the mean estimates. 84
109 Mass Balance: A mass balance calculation was conducted for both field GAC types (F400 and coconut-based GAC) to determine the change in mass of PFAS on GAC (pretreatment and post-treatment extractions). The summed mass of PFAS recovered in the aqueous phase was also considered in the mass balance calculations. There was a mass reduction of PFAS between treated and untreated GAC, especially for the sulfonates. This significant mass reduction (fewer recoveries) in PFAS implies that heat activated persulfate treatment had an impact on PFAS sorbed onto GAC, especially on the sulfonates compared to the carboxylates. This is however surprising as it has been reported that PFSAs are not susceptible to heat activated persulfate treatment (Park et al., 2016). The observed mass reduction may be due to sulfate (persulfate byproduct) altering the partitioning behavior of the sulfonates PFAS, as the sulfonates are known to sorb more on GAC than the carboxylates due to their high hydrophobicity. It is possible that during desorption with heat activated persulfate, the GAC surface was reconfigured so PFOS diffused from GAC surface into the larger interior pores of GAC surface (becoming physically entrapped) which led to their less desorption from GAC into the aqueous phase. This physical entrapment of PFOS within GAC pores has been reported in Senevirathna et al. (2010b) and Zhao et al. (2012). Also, it is possible that PFAS bound in the GAC interior pores also contributed to the resistance of persulfate treatment on GAC by preventing the diffusion of the formed sulfate radicals into GAC pores. According to Zhang et al. (2011), PFAS molecules tend to form aggregates which may block pores of porous media and prevent diffusion of other molecules, Figure 4.33 show the mass balance calculation results showing the mass of PFAS recovered and unrecovered from GAC prior to and after persulfate oxidation. The total recovery results suggest that decomposition of PFAS by heat activated persulfate was minimal for the carboxylates as much difference was not observed for the treated and control GAC, while a big difference was seen in the PFSAs Regeneration Test: In support of the study, the ability of chemically oxidized GAC to continue to sorb PFAS after being treated with activated persulfate was tested. Results from the batch test (Figure 4.34) with the F400 GAC demonstrated that the extent of sorption and removal of the model PFAS (PFBA, PFPeA, PFBS, PFHxA, PFHpA, PFHxS, PFOA, and PFOS) was greater in treated columns when compared to control columns with no persulfate treatment. Similar results have been reported by McKenzie et al. (2015), where sorption of PFAS increased in persulfate treated columns which was attributed to changes in water quality (ph, presence of polyvalent cations). For the virgin coconut shell-based GAC sorption test in the columns, the extent of sorption and removal of the PFAS was increased in the first 24 h. However, PFAS removal decreased as reaction time progressed further, and lowest removal was observed with PFBS and PFOS (Figure 4.35). The results of the column GAC re-adsorption test suggest that adsorption and desorption of PFAS occurred mainly on GAC surface, as PFAS are known to be controlled mostly by electrostatic interaction and hydrophobic interactions on GAC surface (Ochoa-Herrera & Sierra-Alvarez, 2008; Zhao et al., 2012; Du et al., 2014). The solution ph change, which was measured in the column effluent may have led to increased protonation of the GAC surface, resulting in the potential to enhance sorption of PFAS through electrostatic interactions (Higgins & Luthy, 2006; McKenzie et al., 2015) by the creation of more sorption sites on the GAC surface. 85
110 (a) Mass of PFAS (mg/ 100g of GAC) PFBA PFPeA PFBS PFHxA PFHpA PFHxS PFOA PFOS Unrecovered Recovered (b) Mass of PFAS (mg/ 100g of GAC) PFBA PFPeA PFBS PFHxA PFHpA PFHxS PFOA PFOS Unrecovered Recovered Figure Mass of PFAS recovered and unrecovered prior to and after persulfate treatment for (a) F400 GAC and (b) virgin coconut shell-based GAC. Bar height represents initial mass of PFAS extracted from GAC before treatment and first bar for each compound represents treated GAC while the second bar represents the control GAC. 86
111 100 Post-treatment GAC Post-control GAC Percentage Removal (%) PFBA PFBS PFHxS PFOA PFOS Figure Percentage removal of PFAS in mixture with persulfate treated F400 GAC, initial concentration 1 mg/l, ph 7.2. Error bars on adjusted values represent the standard errors of the mean estimates. 120 PFBA-T PFBA-C PFBS-T PFBS-C PFHxS-T PFHxS-C PFOA-T PFOA-C PFOS-T PFOS-C 100 Percentage Removal (%) Time (h) Figure Percentage removal of PFAS in mixture with persulfate treated virgin coconut shell-based GAC; (-T) = post-treatment, (-C) = post-control. 87
112 Also, the cations (Na +, K +, Ca 2+, Mg 2+ ) present in the PFAS contaminated synthetic groundwater which may have bound to GAC surface during oxidation may have also helped improve sorption by forming aggregates at the liquid-solid interface thereby causing PFAS to partition into them resulting in increased sorption (McKenzie et al., 2015). However, You et al. (2010) and Zhao et al. (2012) reported an increase in PFOS sorption onto adsorbents with increasing solution ph in the presence of Ca 2+ which was assumed to be due to the bridging and electrostatic effect between the anionic PFAS in solution and the divalent cations because of formation of basic sites on the adsorbent surface. The low re-adsorption exhibited by PFOS with time progression might be a result of pore diffusion limitations, where entrapped PFOS slowly moved to the GAC surface from the interior pores of GAC. The effect of PFOS critical micelle concentration cannot also be ruled out, the concentration of PFAS (1 mg/l) used in the regeneration test is orders of magnitude less than that of the CMC of PFOS (4573 mg/l)(yu et al., 2009). It is potentially possible that hemi-micelles and micelle might have formed in the interior pores of GAC after adsorbing on its porous surface limiting the adsorption of more PFOS by blocking the passage of other PFOS molecules META-PC FOR CHARECTERIZATION OF PFOS DEGRADATION Meta-PC was used to evaluate degradation of PFOS under aerobic and anaerobic conditions as well as mainly via photo-degradation and mammalian metabolism conditions. Results were presented as the probable reaction mechanism and the priority (relative reaction speed and thus probability of occurrence). As shown in Table 4.13, the aerobic and anaerobic degradation of PFOS was not predicted. However, photo-degradation and mammalian metabolism degradation were predicted, primarily at low priority values (indicating more rapid reaction speed). Table Results of PFOS degradation as predicted in Meta-PC databases. Reaction Metabolite(s) Reaction description Priority* database possible Aerobic No - - Anaerobic No - - Mammalian Yes 2 Reductases 9 Photodegradation Yes 32, 2 soluble Russel mechanism Alpha-scission in sulfones Alkyl fluorides Photohydrolysis Sulfonic acid oxidation Alkyl fluorides reduction Defluorination * Priority values represent speed of the corresponding reaction. Value of 0 represents spontaneous reaction, 1 represents very fast reaction, and scale from 2 to 9 fall to range of reactions that are progressively slow. 88
113 Aerobic and Anaerobic Metabolism The software database dictionary assessed results of reacting the chemical species entered with bacterially mediated reactions under aerobic and anaerobic conditions. Meta-PC defines anaerobic conditions as those occurring in sludge but did not specify temperature or sludge composition. Aerobic conditions were suggested to be those matching the general definition of aerobic (Klopman et al., 1994). Additionally, Howard et al. (1992) was referenced for aerobic dictionary development for Meta-PC. The specific mechanism depends on how closely the entered species matched with reactants in the dictionary. Thus, the disclaimer for results generated is that the dictionary is not able to predict all possible reactions and may predict reactions that are very unlikely to occur. Under anaerobic and aerobic conditions no metabolites of PFOS were predicted. The same result was found for PFOS when the terminal CF3 and various CF2 groups were removed sequentially starting at the CF3. The photo-degradation and mammalian metabolism pathways did predict degradation, including soluble compounds and carcinogenic compounds Photo-degradation Photo-degradation was assumed to be those in the natural conditions like upper layers of a lake exposed to sunlight (Sedykh et al., 2001). Biotransformation occurred due to photodehalogenation, which produced 32 metabolites with 2 metabolites produced multiple times. Photo-dehalogenation is the reaction in which photons provide the energy for removal of halogens from a molecule. Predicted reaction speed, given the priority number n values varied from 1 (very rapid reaction) to 6 (moderately slow reaction). Of the metabolites produced socalled S9 was soluble and was the result of a priority 1 reaction of sulfone degradation (alpha scission in sulfones). That reaction produces methyl radical intermediates leading to further degradation of the original compound. S23 was the result of the Russell mechanism where a C-C bond is cleaved. The reaction is characterized by formation and subsequent reaction by peroxy radicals. The peroxy radical reacts cyclically with itself to produce a tetraoxide intermediate. The proposed products are a ketone and an alcohol plus O2 or an excited ketone and an alcohol plus O2 (Miyamoto et al., 2003) Mammalian Metabolism Mammalian metabolism measurements were largely based on rat (or rodent) metabolism. In some cases, Meta-PC developers used metabolism data from other mammals when rodent data was unavailable. Differences in species sex were not considered in the model nor were genetic variations (Talafous et al., 1994). However, those differences (and others) may inherently appear in the results as there was no indication in the supporting papers that differences were normalized. Degradation of PFOS by mammalian metabolism was predicted to occur by reductases. The specific reaction was related to work by L.M. Sayre and the output statement was biotransformed by reductases by reduction of terminal aliphatic trihalides. However, the reaction was assigned priority 9, meaning it would be very slow to occur and may not occur at all. Results for degradation of compounds related to PFOS or differing greatly may be based on very different mechanisms. When a CF2 group was removed from the SMILES for PFOS, the output appeared as in Figure In Figure 4.36, the observed resulting metabolites were F - and (CF2)8SOOOH. By further selecting a metabolite, the references and rules were viewed. The priority assigned, as shown in Table 4.13, was 9 given a general mechanism of action by 89
114 reductases. After removing four CF2 groups from the metabolite in Figure 4.36, metabolites in Figure 4.37 were obtained. This method of arriving at Figure 4.37 from Figure 4.36 is illustrated here. Neither the mammalian metabolism dictionary nor the program itself had a continuity feature or allowed multiple molecule inputs. To understand what daughter compound of PFOS or PFOA would be readily degraded under any dictionary a CF2 or CF3 group was removed before the SMILES was entered and the program was run. Figure 4.38 was obtained after additional manual removal of CF2 groups. At this point assigned priority was consistent as was the probable mechanism. Figure 4.39 results when the molecule SMILES were entered but no metabolites were produced under mammalian metabolism, while Figures 4.36 to Figure 4.38 demonstrate defluorination by mammalian metabolism, which was the only metabolite option offered for the given SMILES input. The Meta-PC description includes the mammalian metabolism dictionary which contains 1467 transformations, 505 aerobic transformation, 344 anaerobic transformations, 1193 photodegradation transformations. Thus, variation in probable degradation reactions is likely to occur for compounds other than PFOS. The results from Meta-PC indicate that probable degradation pathways exist for photo-degradation and mammalian metabolism. The specific mechanisms were found via referenced literature with the rule result. A specific method to produce the Russell mechanism was not found in the literature. However, methods to produce characteristics of the mechanism (i.e. application of significant energy) were found and future research will be based on refining these methods. Mammalian metabolism degradation pathways using reductase provided sufficient information to determine an enzyme-based solution may be viable. Enzymes are employed in natural and engineered systems to overcome reaction energy barriers and thus may be a promising solution. For example, laccase was used to treat PFOA in one study with approximately 50% reduction observed (Luo et al., 2015). Using additional literature, specific reaction conditions will be determined for high-energy and enzymatic systems. 90
3SOOOH is the starting point again a single F - is removed.")
115 Figure PFOS through mammalian metabolism dictionary- step 1 where 1 F - is removed through reaction likely facilitated by reductases. Figure After removing multiple CF2 groups when CF3(CF2)3SOOOH is the starting point again a single F - is removed. This result was also obtained using the mammalian metabolism dictionary. 91

116 Figure When the starting molecule is CF3SOOOH again a F - is removed resulting in products F - and SOOOHCF2. This result was also obtained using the mammalian metabolism dictionary. Figure The result if it is assumed the final CF2 group was previously removed. Mammalian metabolism was not predicted to further degrade this compound. 92
117 5.0 CONCLUSIONS AND IMPLICATIONS FOR FUTURE RESEARCH/IMPLEMENTATION Validation of HRX Well TM laboratory scale physical model: Experimental results indicated that the HRX Well TM concept is valid and potentially feasible for field implementation. The physical model has proven to be a valuable tool in exploring the performance of a horizontal well installed in the direction of groundwater flow. A horizontally drilled well installed in the direction of groundwater flow will passively focus the flow of groundwater into the well and the capture zones behaves in a predictable manner with a linear correspondence to the ratio of hydraulic conductivity (KK rrrrrrrrrr ) values of the reactive media in the well and the surrounding aquifer. The velocity of water captured in the well can be significantly higher than the surrounding aquifer with a greater value of KK rrrrrrrrrr. The percentage of water captured by the well and capture zone areas were determined. A wide range of ratios of hydraulic conductivities was tested by varying the in-well media. Tracer tests were successfully performed to measure the water velocity in the well and aquifer, and to confirm the treatment by GAC of the reactive solute (i.e., model contaminant) relative to the conservative solute. Characterization of PFAS and co-contaminants sorption onto GAC and measure of influence of groundwater conditions on sorption of PFAS: Sorption characteristics of different carbon adsorbent sources were analyzed. The sorption capacity of coal-based GAC (F400) and coconut-based GAC (CBC) for compounds PFOA and PFOS as individual compounds and as a mixture were investigated through the Freundlich and Langmuir isotherm study. A higher sorption capacity was obtained for individual compounds compared to those in the mixture for both PFOA and PFOS. F400 showed higher sorption than the CBC in all the combinations evaluated. PFOS showed higher sorption than PFOA individually and in mixture due to the higher hydrophobicity of the sulfonate head group, high polarizability and presence of more C-F bonds than PFOA. Hydrophobic interactions were mainly involved in the sorption process and electrostatic interactions were less influential. The physical properties of GAC such as surface area, pore size distribution and formation of micelles and hemi-micelles also influence the sorption capacities in different GACs. Multilayer sorption can occur and hemi-micelles and micelles can form in the porous structure of the GAC regardless of the concentrations. In this study, it was found that the presence of non-pfas co-contaminants (Kerosene, TCE and ethanol), and different groundwater conditions (ph, presence of SO 4 2 anions, NOM and iron oxides) had little impact on the extent of sorption of PFASs onto GAC under the experimental conditions tested. 93
118 The experimental results have the same order of magnitude for Freundlich parameters and little difference with Langmuir parameters compared to similar previous studies. On the other hand, results were vastly different than some other studies, and these differences are likely due to different initial concentration ranges, as well as the properties of GAC used in the isotherm studies. Enhancement of PFAS sorption onto activated carbon: The extent of sorption of PFOA and PFHxS increased with HCl treatment for both F400 (8% and 9%) and CBC (6% and 5%), respectively, due to increase in positive charge density of GAC with treatment. The extent of sorption decreased with treatment using persulfate, and H2O2/Fe, and remained unchanged using NaOH. Treatment of F400 and CBC types of GAC resulted in a decrease in the BET surface area, pore volume and pore width which are the main physical characters related to the sorption. This decrease was likely due to pore blockage in the micropores caused during treatment due to modification of the textural characteristics of the untreated GAC as was shown in elemental analysis. An accumulation of chloride, sodium, sulfur, and iron may result in blockage of sorption sites, decreasing the micropore volume and width with HCl, NaOH, PS and H2O2/Fe treatments respectively. phpzc results revealed that for both HCl and NaOH treatments, electrostatic interactions have less influence on sorption than hydrophobic interactions. For F400 and CBC types of GAC, H2O2/Fe and PS treatment created negative charge on GAC surfaces and resulted in drastic reduction of phpzc. This effect increased the electrostatic repulsion and influenced sorption to some extent because those two treatments show the higher decreases in the extent of sorption than untreated GAC. The treatment of GAC introduced more surface oxygen functional groups like alcohol, phenol and carboxylic which were detected in FTIR spectra. phpzc decreases as the oxygen content increases which reflects increase in surface acidity. Moreover, surface oxygen functional groups increase the polarity of the carbon surface, which can result in decreased sorption of hydrophobic PFAS. Measurement of destruction of PFAS sorbed GAC, extension of GAC life using activated persulfate, and treatment of field GAC: The degradation efficiencies achieved by activated persulfate oxidation were observed to be a function of oxidant concentration and number of doses. During aqueous phase oxidation, PFOA degradation was confirmed by generation of fluoride and shorter chain byproducts. However, partial degradation of PFOA was seen during oxidation of PFOA sorbed onto GAC. PFOS was not degraded by heat-activated persulfate treatment. Although mineralization of PFOA was achieved within a shorter reaction period by increasing persulfate oxidant dose, multiple oxidant doses of lower concentration were found to achieve degradation with maximum defluorination yield through maximum utilization of oxidant species and minimum scavenging reactions. 94
119 Activated persulfate treatment does not effectively treat PFOA and PFOS sorbed onto GAC, however persulfate treatment can extend the sorption capacity of GAC by breaking the aggregates of micelle or hemi-micelle that influence sorption. Heat activated persulfate treatment alters the partitioning behavior of PFAS sorbed onto GAC. Specifically, sorption of PFSAs is enhanced. Evaluation of potential natural degradation of PFOS using META-PC simulation software: PFOS is susceptible to degradation under photo-degradation and mammalian metabolism reaction conditions; metabolites are not produced under simulated aerobic and anaerobic microbial conditions. Radical based reactions under Russell mechanism in photo-degradation and reductase enzyme based mammalian metabolism reactions both commonly supported the cleavage of C-C bond and sequential breakdown of CF2 in PFOS molecule. No possible biodegradation pathways were seen for sulfonate head group. Implications for Future Research/Implementation: The HRX Well TM is currently being demonstrated and validated under ESTCP project ER , Demonstration and Validation of the Horizontal Reactive Media Treatment (HRX) Well for Managing Contaminant Plumes in Complex Geological Environments. Continued research into low-cost sorbents for managing PFAS sites is recommended. Ideal sorbents will have greater sorption capacity, faster rates of sorption, and will allow for effective and low-cost regeneration. Continued research into extending longevity of GAC through simple, low-cost treatments is recommended. Longevity may be extended by disrupting micelles or hemi-micelles that form in GAC pores, or by anion flushes that may drive PFAS deeper into GAC pores. Additional research into aggressive treatment approaches, such as sonolysis or plasma treatment, for their potential to regenerate GAC is recommended. 95
120 LITERATURE CITED An, D., Westerhoff, P., Zheng, M., Wu, M., Yang, Y., & Chiu, C. A. (2015). UV-activated persulfate oxidation and regeneration of NOM-Saturated granular activated carbon. Water Research, 73, Anderson, R. H., Long, G. C., Porter, R. C., & Anderson, J. K. (2015). Occurrence of select perfluoroalkyl substances at U.S. Air Force aqueous film-forming foam release sites other than fire-training areas: Field-validation of critical fate and transport properties. Chemosphere. Anfruns, A., Montes-Morán, M. A., Gonzalez-Olmos, R., & Martin, M. J. (2013). H2O2-based oxidation processes for the regeneration of activated carbons saturated with volatile organic compounds of different polarity. Chemosphere, 91(1), Appleman, T. D., Higgins, C. P., Quin, O., Vanderford, B. J., Kolstad, C., Zeigler-holady, J. C., & Dickenson, E. R. V. (2013). Treatment of poly- and perfluoroalkyl substances in U. S. full-scale water treatment systems Author s personal copy, 1. Appleman, T. D., Higgins, C. P., Quiñones, O., Vanderford, B. J., Kolstad, C., Zeigler-Holady, J. C., & Dickenson, E. R. V. (2014). Treatment of poly- and perfluoroalkyl substances in U.S. full-scale water treatment systems. Water Research, 51, Arias Espana, V. A., Mallavarapu, M., & Naidu, R. (2015). Treatment technologies for aqueous perfluorooctanesulfonate (PFOS) and perfluorooctanoate (PFOA): A critical review with an emphasis on field testing. Environmental Technology and Innovation, 4, ASTSWMO. (2015). Perfluorinated Chemicals (PFCs) : Perfluorooctanoic Acid (PFOA) & Perfluorooctane Sulfonate (PFOS ) Information Paper. Remediation and Reuse Focus Group Federal Facilities Research Center, (August). Retrieved from Babel, S., & Kurniawan, T. A. (2004). Cr (VI) removal from synthetic wastewater using coconut shell charcoal and commercial activated carbon modified with oxidizing agents and/or chitosan. Chemosphere, 54(7), Backe, W. J., Day, T. C., & Field, J. a. (2013). Zwitterionic, cationic, and anionic fluorinated chemicals in aqueous film forming foam formulations and groundwater from U.S. military bases by nonaqueous large-volume injection HPLC-MS/MS. Environmental Science and Technology, 47(10), Bao, Y., Niu, J., Xu, Z., Gao, D., Shi, J., Sun, X., & Huang, Q. (2014). Removal of perfluorooctane sulfonate (PFOS) and perfluorooctanoate (PFOA) from water by coagulation: Mechanisms and influencing factors. Journal of Colloid and Interface Science, 434, Bear, J. (1972). Dynamics of Fluids in Porous Media. Soil Science, 120(2), Bowles, M. W., Bentley, L. R., Hoyne, B., & Thomas, D. A. (2000). In-situ Groundwater Remediation Using Trench and Gate System. GROUND WATER, 38(2), Buck, R. C., Franklin, J., Berger, U., Conder, J. M., Cousins, I. T., Voogt, P. De, van Leeuwen, S. P. J. (2011). Perfluoroalkyl and polyfluoroalkyl substances in the environment: Terminology, classification, and origins. Integrated Environmental 96
121 Assessment and Management, 7(4), Carter, K. E., & Farrell, J. (2010). Removal of Perfluorooctane and Perfluorobutane Sulfonate from Water via Carbon Adsorption and Ion Exchange. Separation Science and Technology, 45, Chen, X., Xia, X., Wang, X., Qiao, J., & Chen, H. (2011). A comparative study on sorption of perfluorooctane sulfonate (PFOS) by chars, ash and carbon nanotubes. Chemosphere, 83(10), Chiang, H.-L., Huang, C. P., & Chiang, P. C. (2002). The surface characteristics of activated carbon as affected by ozone and alkaline treatment. Chemosphere, 47(3), Cho, Y. M., Ghosh, U., Kennedy, A. J., Grossman, A., Ray, G., Tomaszewski, J. E., Luthy, R. G. (2009). Field application of activated carbon amendment for in-situ stabilization of polychlorinated biphenyls in marine sediment. Environmental Science and Technology, 43(10), Coles, C. A. (2007). Estimating Retardation From the Freundlich Isotherm for Modeling Contaminant Transport. Engr.Mun.Ca, 6. Retrieved from Crimmins, B. S., Xia, X., Hopke, P. K., & Holsen, T. M. (2014). A targeted/non-targeted screening method for perfluoroalkyl carboxylic acids and sulfonates in whole fish using quadrupole time-of-flight mass spectrometry and MSe. Analytical and Bioanalytical Chemistry, 406(5), D Agostino, L. A., & Mabury, S. A. (2014). Identification of novel fluorinated surfactants in aqueous film forming foams and commercial surfactant concentrates. Environmental Science and Technology, 48(1), Deng, S., Zhang, Q., Nie, Y., Wei, H., Wang, B., Huang, J., Xing, B. (2012). Sorption mechanisms of perfluorinated compounds on carbon nanotubes. Environmental Pollution, 168, Deng, S., Zhou, Q., Yu, G., Huang, J., & Fan, Q. (2011). Removal of perfluorooctanoate from surface water by polyaluminium chloride coagulation. Water Research, 45(4), Divine, C. E., Leone, G., Gillow, J. B., Roth, T., Brenton, H., & Spurlin, M. S. (2013). Horizontal in-well treatment system and source area bypass system and method for groundwater remediation. US Patent No B2. Washington, DC: U.S. Patent and Trademark Office. Divine, C.E., Roth, T., Crimi, M., DiMarco, A.C., Spurlin, M., Gillow, J., & Leone, G (2017). The Horizontal Reactive Media Treatment Well (HRX Well TM ) for Passive In-Situ Remediation. Groundwater Monitoring & Remediation, manuscript submitted for publication. Du, Z., Deng, S., Bei, Y., Huang, Q., Wang, B., Huang, J., & Yu, G. (2014). Adsorption behavior and mechanism of perfluorinated compounds on various adsorbents-a review. Journal of Hazardous Materials, 274, Eberle, D., Ball, R., & Boving, T. B. (2016). Peroxone activated persulfate treatment of 1,4- dioxane in the presence of chlorinated solvent co-contaminants. Chemosphere, 144,
122 Eschauzier, C., Beerendonk, E., Scholte-Veenendaal, P., & De Voogt, P. (2012). Impact of treatment processes on the removal of perfluoroalkyl acids from the drinking water production chain. Environmental Science & Technology, 46(3), Fetter, C. W. (2001). Applied Hydrogeology. Filipovic, M., Woldegiorgis, A., Norström, K., Bibi, M., Lindberg, M., & Österås, A. H. (2015). Historical usage of aqueous film forming foam: A case study of the widespread distribution of perfluoroalkyl acids from a military airport to groundwater, lakes, soils and fish. Chemosphere, 129, Giri, R. R., Ozaki, H., Morigaki, T., Taniguchi, S., & Takanami, R. (2011). UV photolysis of perfluorooctanoic acid (PFOA) in dilute aqueous solution. Water Science and Technology, 63(2), Goel, J., Kadirvelu, K., Rajagopal, C., & Kumar Garg, V. (2005). Removal of lead(ii) by adsorption using treated granular activated carbon: Batch and column studies. Journal of Hazardous Materials, 125(1 3), Guelfo, J. L., & Higgins, C. P. (2013a). Subsurface transport potenguelfo, J. L., & Higgins, C. P. (2013). Subsurface transport potential of perfluoroalkyl acids at aqueous film-forming foam (AFFF)-impacted sites. Environmental Science and Technology, 47(9), Guelfo, J. L., & Higgins, C. P. (2013b). Subsurface transport potential of perfluoroalkyl acids at aqueous film-forming foam (AFFF)-impacted sites. Environmental Science and Technology, 47(9), Hansen, M. C., Borresen, M. H., Schlabach, M., & Cornelissen, G. (2010). Sorption of Perfluorinated compounds from contaminated water to activated canrbon. Journal of Soil Sediments, 10, Hansen, M. C., Børresen, M. H., Schlabach, M., & Cornelissen, G. (2010). Sorption of perfluorinated compounds from contaminated water to activated carbon. Journal of Soils and Sediments, 10(2), Higgins, C. P., & Luthy, R. G. (2006). Sorption of Perfluorinated Surfactants on Sediment. Environ.Sci.Technol., 40, Higgins, C. P., & Luthy, R. G. (2006). Sorption of perfluorinated surfactants on sediments. Environmental Science and Technology, 40(23), Hori, H., Nagaoka, Y., Murayama, M., & Kutsuna, S. (2008). Efficient decomposition of perfluorocarboxylic acids and alternative fluorochemical surfactants in hot water. Environmental Science and Technology, 42(19), Hori, H., Yamamoto, A., Hayakawa, E., Taniyasu, S., Yamashita, N., Kutsuna, S., Arakawa, R. (2005). Efficient decomposition of environmentally persistent perfluorocarboxylic acids by use of persulfate as a photochemical oxidant. Environmental Science and Technology, 39, Howard, P. H., Stiteler, W. M., Meylan, W. M., Hueber, A. E., Beauman, J. A., Larosche, M. E., & Boethling, R. S. (1992). Predictive model for aerobic biodegradability developed from a file of evaluated biodegradation data. Environmental Toxicology and Chemistry, 11(5),
123 Huang, K. C., Zhao, Z., Hoag, G. E., Dahmani, A., & Block, P. A. (2005). Degradation of volatile organic compounds with thermally activated persulfate oxidation. Chemosphere, 61(4), Huling, S. G., Jones, P. K., Ela, W. P., & Arnold, R. G. (2005). Fenton-driven chemical regeneration of MTBE-spent GAC. Water Research, 39(10), Huling, S. G., Jones, P. K., & Lee, T. R. (2007). Iron optimization for Fenton-driven oxidation of MTBE-spent granular activated carbon. Environmental Science & Technology, 41(11), Huling, S. G., Kan, E., Caldwell, C., & Park, S. (2012). Fenton-driven chemical regeneration of MTBE-spent granular activated carbon - A pilot study. Journal of Hazardous Materials, , Huling, S. G., Kan, E., & Wingo, C. (2009). Fenton-driven regeneration of MTBE-spent granular activated carbon-effects of particle size and iron amendment procedures. Applied Catalysis B: Environmental, 89(3 4), Huling, S. G., Ko, S., Park, S., & Kan, E. (2011). Persulfate oxidation of MTBE- and chloroform-spent granular activated carbon. Journal of Hazardous Materials, 192(3), Hutson, A., Ko, S., & Huling, S. G. (2012). Persulfate oxidation regeneration of granular activated carbon: Reversible impacts on sorption behavior. Chemosphere, 89(10), Johnson, R. L., Anschutz, A. J., Smolen, J. M., Simcik, M. F., & Lee Penn, R. (2007). The adsorption of perfluorooctane sulfonate onto sand, clay, and iron oxide surfaces. Journal of Chemical and Engineering Data, 52(4), Johnson, R. L., Tratnyek, P. G., & Johnson, R. O. B. (2008). Persulfate persistence under thermal activation conditions. Environmental Science and Technology, 42, Julien, F., Baudu, M., & Mazet, M. (1998). Relationship between chemical and physical surface properties of activated carbon. Water Research, 32(11), Kan, E., & Huling, S. G. (2009). Effects of temperature and acidic pre-treatment on Fentondriven oxidation of MTBE-spent granular activated carbon. Environmental Science and Technology, 43(5), Kannan, K., Corsolini, S., Falandysz, J., Fillmann, G., Kumar, K. S., Loganathan, B. G., Aldous, K. M. (2004). Perfluorooctanesulfonate and related fluorochemicals in human blood from several countries. Environmental Science and Technology, 38(17), Karanfil, T., & Kilduff, J. E. (1999). Role of granular activated carbon surface chemistry on the adsorption of organic compounds. 1. Priority pollutants. Environmental Science & Technology, 33(18), Kawecki, M. W. (2000). Transient Flow to a Horizontal Water Well. Ground Water, 38(6), Kawecki, M. W., & Al-Subaikhy, H. N. (2005). Unconfined linear flow to a horizontal well. Ground Water, 43(4),
124 Key, B. D., Howell, R. D., & Criddle, C. S. (1997). Critical Review Fluorinated Organics in the Biosphere. Environmental Science & Technology, 31, Klopman, G., Dimayuga, M., & Talafous, J. (1994). META. 1. A program for the evaluation of metabolic transformation of chemicals. Journal of Chemical Information and Computer Sciences, 34, Kompani-Zare, M., Zhan, H., & Samani, N. (2005). Analytical study of capture zone of a horizontal well in a confined aquifer. Journal of Hydrology, 307(1 4), Krembs, F. J., Siegrist, R. L., Crimi, M. L., Furrer, R. F., & Petri, B. G. (2010). ISCO for Groundwater Remediation: Analysis of Field Applications and Performance. Ground Water Monitoring & Remediation, 30(4), Kupryianchyk, D., Rakowska, M. I., Grotenhuis, J. T. C., & Koelmans, A. A. (2012). In situ sorption of hydrophobic organic compounds to sediment amended with activated carbon. Environmental Pollution, 161, Lee, H., Lee, H. J., Jeong, J., Lee, J., Park, N. B., & Lee, C. (2015). Activation of persulfates by carbon nanotubes: Oxidation of organic compounds by nonradical mechanism. Chemical Engineering Journal, 266, Lee, Y. C., Lo, S. L., Kuo, J., & Lin, Y. L. (2012). Persulfate oxidation of perfluorooctanoic acid under the temperatures of 20-40??C. Chemical Engineering Journal, , Lehmler, H. J. (2005). Synthesis of environmentally relevant fluorinated surfactants - A review. Chemosphere, 58(11), Lewandowski, G., Meissner, E., & Milchert, E. (2006). Special applications of fluorinated organic compounds. Journal of Hazardous Materials, 136(3), Liang, C., Lin, Y. T., & Shin, W. H. (2009). Persulfate regeneration of trichloroethylene spent activated carbon. Journal of Hazardous Materials, 168(1), Liu, C. S., Higgins, C. P., Wang, F., & Shih, K. (2012). Effect of temperature on oxidative transformation of perfluorooctanoic acid (PFOA) by persulfate activation in water. Separation and Purification Technology, 91, Liu, H., Bruton, T. A., Doyle, F. M., & Sedlak, D. L. (2014). In situ chemical oxidation of contaminated groundwater by persulfate: Decomposition by Fe(III)- and Mn(IV)- containing oxides and aquifer materials. Environmental Science and Technology, 48(17), Luo, Q., Lu, J., Zhang, H., Wang, Z., Feng, M., Chiang, S. Y. D., Huang, Q. (2015). Laccase- Catalyzed Degradation of Perfluorooctanoic Acid. Environmental Science and Technology Letters, 2(7), Marsh, H., & Rodrigues-Reinoso, F. (2006). Activated Carbon. Endeavour (Vol. 5). Martin, J. W., Smithwick, M. M., Braune, B. M., Hoekstra, P. F., Muir, D. C. G., & Mabury, S. A. (2004). Identification of Long-Chain Perfluorinated Acids in Biota from the Canadian Arctic. Environmental Science and Technology, 38(2),
125 McGuire, M. E., Schaefer, C., Richards, T., Backe, W. J., Field, J. A., Houtz, E., Higgins, C. P. (2014). Evidence of remediation-induced alteration of subsurface poly- and perfluoroalkyl substance distribution at a former firefighter training area. Environmental Science and Technology, 48(12), McKenzie, E. R., Siegrist, R. L., McCray, J. E., & Higgins, C. P. (2015). Effects of Chemical Oxidants on Perfluoroalkyl Acid Transport in One-Dimensional Porous Media Columns. Environmental Science & Technology, 49, Melissa M. Schultz, Douglas F. Barofsky, J. A. F. (2004). Quantitative Determination of Fluorotelomer Sulfonates in Groundwater by LC MS/M. Environ. Sci. Technol., 38(6), Merino, N., Qu, Y., Deeb, R. A., Hawley, E. L., Hoffmann, M. R., & Mahendra, S. (2016). Degradation and Removal Methods for Perfluoroalkyl and Polyfluoroalkyl Substances in Water. Environmental Engineering Science, 33(9), ees Miyamoto, S., Martinez, G. R., Medeiros, M. H. G., & Di Mascio, P. (2003). Singlet Molecular Oxygen Generated from Lipid Hydroperoxides by the Russell Mechanism: Studies Using 18 O-Labeled Linoleic Acid Hydroperoxide and Monomol Light Emission Measurements. Journal of the American Chemical Society, 125(20), Mohamed, A., & Rushton, K. (2006). Horizontal wells in shallow aquifers: Field experiment and numerical model. Journal of Hydrology, 329(1 2), Monteagudo, J. M., Durán, A., González, R., & Expósito, A. J. (2015). In situ chemical oxidation of carbamazepine solutions using persulfate simultaneously activated by heat energy, UV light, Fe 2+ ions, and H<inf>2</inf>O<inf>2</inf>. Applied Catalysis B: Environmental, , Moody, C. A., & Field, J. A. (2000). Perfluorinated Surfactants and the Environmental Implications of Their Use in Fire-Fighting Foams Critical Review Perfluorinated Surfactants and the Environmental Implications of Their Use in Fire-Fighting Foams. Environmental Science & Technology, 34(18), Moody, C. A., Hebert, G. N., Strauss, S. H., & Field, J. A. (2003). Occurrence and persistence of perfluorooctanesulfonate and other perfluorinated surfactants in groundwater at a firetraining area at Wurtsmith Air Force Base, Michigan, USA. Journal of Environmental Monitoring, 5(2), Moody, C. a., Kwan, W. C., Martin, J. W., Muir, D. C. G., & Mabury, S. a. (2001). Determination of Perfluorinated Surfactants in Surface Water Samples by Two Independent Analytical Techniques: Liquid Chromatography/Tandem Mass Spectrometry and 19 F NMR. Analytical Chemistry, 73(10), Moreno-castilla, C., Carrasco-marín, F., Maldonado-hódar, F. J., & Rivera-utrilla, J. (1998). Effects of non-oxidant and oxidant acid treatments on the surface properties of an activated carbon with very low ash content. Carbon, 36(1 2), Moreno-Castilla, C., López-Ramón, M. V., & Carrasco-Marín, F. (2000). Changes in surface 101
126 chemistry of activated carbons by wet oxidation. Carbon, 38(14), Ochoa-Herrera, V., & Sierra-Alvarez, R. (2008). Removal of perfluorinated surfactants by sorption onto granular activated carbon, zeolite and sludge. Chemosphere, 72(10), Pabon, M., & Corpart, J. M. (2002). Fluorinated surfactants: Synthesis, properties, effluent treatment. Journal of Fluorine Chemistry, 114(2), Park, S.-J., & Jang, Y.-S. (2002). Pore Structure and Surface Properties of Chemically Modified Activated Carbons for Adsorption Mechanism and Rate of Cr(VI). Journal of Colloid and Interface Science, 249(2), Park, S., Lee, L. S., Medina, V. F., Zull, A., & Waisner, S. (2016). Heat-activated persulfate oxidation of PFOA, 6:2 fluorotelomer sulfonate, and PFOS under conditions suitable for in-situ groundwater remediation. Chemosphere, 145, Paul, A. G., Jones, K. C., & Sweetman, A. J. (2009). Article A First Global Production, Emission, And Environmental Inventory For Perfluorooctane Sulfonate A First Global Production, Emission, And Environmental Inventory For Perfluorooctane Sulfonate. Environmental Science & Technology, 43(2), Peyton, G. R. (1993). The free-radical chemistry of persulfate-based total organic carbon analyzers. Marine Chemistry, 41(1 3), Place, B. J., & Field, J. a. (2012). Identification of Novel Fluorochemicals in Aqueous Film- Forming Foams (AFFF) Used by the US Military. Environ. Sci. Technol., 46(13), Pradhan, B. K., & Sandle, N. K. (1999). Effect of different oxidizing agent treatments on the surface properties of activated carbons. Carbon, 37(8), Qiu, Y., Fujii, S., Tanaka, S., Management, E. Q., & Studies, G. E. (2007). Removal of perfluorochemicals from wastewater by granukar activated carbon adsorption. Environmeantal Engineering Research, 44(23), Rahman, M. F., Peldszus, S., & Anderson, W. B. (2014). Behaviour and fate of perfluoroalkyl and polyfluoroalkyl substances (PFASs) in drinking water treatment: A review. Water Research, 50, Rak, A., & Vogel, C. M. (2009). Increasing regulation of perfluorinated compounds and the potential impacts at Air Force installations, in, Prepared by Noblis for the U.S. Air Force and the Office of the Deputy Under Secretary of Defense Installations and Environment, Chemical and Mater. Ravančić, M. E., & Stanić, M. H.-. (2015). Equilibrium and Kinetics Studies for the Adsorption of Fluoride onto Commercial Activated Carbons Using Fluoride Ion- Selective Electrode, 10, Rodriguez-Freire, L., Balachandran, R., Sierra-Alvarez, R., & Keswani, M. (2015). Effect of sound frequency and initial concentration on the sonochemical degradation of perfluorooctane sulfonate (PFOS). Journal of Hazardous Materials, 300,
127 Roque-Malherbe, R. M. A. (2010). The Physical Chemistry of Materials: Energy and Environmental Applications. Taylor and Francis Group,LLC. Schaefer, C. E., Andaya, C., Urtiaga, A., McKenzie, E. R., & Higgins, C. P. (2015). Electrochemical treatment of perfluorooctanoic acid (PFOA) and perfluorooctane sulfonic acid (PFOS) in groundwater impacted by aqueous film forming foams (AFFFs). Journal of Hazardous Materials, 295, Sedykh, A., Saiakhov, R., & Klopman, G. (2001). META V. A model of photodegradation for the prediction of photoproducts of chemicals under natural-like conditions. Chemosphere, 45(6 7), Senevirathna, S. T. M. L. D., Tanaka, S., Fujii, S., Kunacheva, C., Harada, H., Ariyadasa, B. H. A. K. T., & Shivakoti, B. R. (2010a). Adsorption of perfluorooctane sulfonate (n-pfos) onto non ion-exchange polymers and granular activated carbon: Batch and column test. Desalination, 260(1 3), Senevirathna, S. T. M. L. D., Tanaka, S., Fujii, S., Kunacheva, C., Harada, H., Shivakoti, B. R., & Okamoto, R. (2010b). A comparative study of adsorption of perfluorooctane sulfonate (PFOS) onto granular activated carbon, ion-exchange polymers and non-ion-exchange polymers. Chemosphere, 80(6), Shih, K., & Wang, F. (2013). Adsorption Behavior of Perfluorochemicals (PFCs) on Boehmite: Influence of Solution Chemistry International Symposium on Environmental Science and Technology (2013 ISEST), 18, Siegrist, R. L., Crimi, M., & Simpkin, T. J. (2011). In Situ Chemical Oxidation for Groundwater Remediation. SERDP ESTCP Environmental Remediation Technology Ser. Sinclair, E., & Kannan, K. (2006). Mass loading and fate of perfluoroalkyl surfactants in wastewater treatment plants. Environmental Science and Technology, 40(5), Smithwick, M., Norstrom, R. J., Evans, T. J., Stirling, I. a N., & Taylor, M. K. (2006). Temporal Trends of Perfluoroalkyl Contaminants in Polar Bears (, Steinle-Darling, E., & Reinhard, M. (2008). Nanofiltration for trace organic contaminant removal: Structure, solution, and membrane fouling effects on the rejection of perfluorochemicals. Environmental Science and Technology, 42(14), Stewart, D. I., Bryant, D. E., Barton, C. S., Morris, K., & Csovári, M. (2005). Chapter 7 New barrier materials: the use of tailored ligand systems for the removal of metals from groundwater. Trace Metals and Other Contaminants in the Environment, 7(C), Sundström, M., Bogdanska, J., Pham, H. V., Athanasios, V., Nobel, S., McAlees, A., Bergman, Å. (2012). Radiosynthesis of perfluorooctanesulfonate (PFOS) and perfluorobutanesulfonate (PFBS), including solubility, partition and adhesion studies. Chemosphere, 87(8), Takagi, S., Adachi, F., Miyano, K., Koizumi, Y., Tanaka, H., Watanabe, I., Kannan, K. (2011). Fate of Perfluorooctanesulfonate and perfluorooctanoate in drinking water 103
128 treatment processes. Water Research, 45(13), Talafous, J., Sayre, L. M., Mieyal, J. J., & Klopman, G. (1994). META. 2. A dictionary model of mammalian xenobiotic metabolism. Journal of Chemical Information and Computer Sciences, 34, Tang, C. Y., Shiang Fu, Q., Gao, D., Criddle, C. S., & Leckie, J. O. (2010). Effect of solution chemistry on the adsorption of perfluorooctane sulfonate onto mineral surfaces. Water Research, 44(8), Tang, H., Xiang, Q., Lei, M., Yan, J., Zhu, L., & Zou, J. (2012). Efficient degradation of perfluorooctanoic acid by UV-Fenton process. Chemical Engineering Journal, 184, Thompson, J., Eaglesham, G., Reungoat, J., Poussade, Y., Bartkow, M., Lawrence, M., & Mueller, J. F. (2011). Removal of PFOS, PFOA and other perfluoroalkyl acids at water reclamation plants in South East Queensland Australia. Chemosphere, 82(1), Toledo, L. C., Silva, A. C. B., Augusti, R., & Lago, R. M. (2003). Application of Fenton s reagent to regenerate activated carbon saturated with organochloro compounds. Chemosphere, 50(8), Tsitonaki, A., Petri, B., Crimi, M., Mosbaek, H., Siegrist, R. L., & Bjerg, P. L. (2010). In Situ Chemical Oxidation of Contaminated Soil and Groundwater Using Persulfate: A Review. CRITICAL REVIEWS IN ENVIRONMENTAL SCIENCE AND TECHNOLOGY, 40(1), USEPA. (2012a). Emerging Contaminants Perfluorooctane Sulfonate ( PFOS ) and Perfluorooctanoic Acid ( PFOA ) At a Glance, (May), 6. USEPA. (2012b). Long-Chain Perfluorinated Chemicals (PFCs) Action Plan, USEPA. (2016). Drinking Water Health Advisory for Perfluorooctanoic Acid ( PFOA ), (May), Vecitis, C. D., Park, H., Cheng, J., Mader, B. T., & Hoffmann, M. R. (2009). Treatment technologies for aqueous perfluorooctanesulfonate (PFOS) and perfluorooctanoate (PFOA). Frontiers of Environmental Science and Engineering in China, 3(2), Wang, F., Liu, C., & Shih, K. (2012). Adsorption behavior of perfluorooctanesulfonate (PFOS) and perfluorooctanoate (PFOA) on boehmite. Chemosphere, 89(8), Wang, F., Lu, X., Li, X. Y., & Shih, K. (2015a). Effectiveness and mechanisms of defluorination of perfluorinated alkyl substances by calcium compounds during waste thermal treatment. Environmental Science and Technology, 49(9), Wang, F., Shih, K., & Leckie, J. O. (2015b). Effect of humic acid on the sorption of perfluorooctane sulfonate (PFOS) and perfluorobutane sulfonate (PFBS) on boehmite. Chemosphere, 118(1), Williams, B., Murray, T., Butterworth, C., Burger, Z., Fleming, J., Whitehurst, C., & Farley, J. (2011). Suppression, Detection and Signaling Research and Applications - A Technical Working Conference (SUPDET 2011) March 2011 Orlando, FL, (March),
129 Xu, M., Du, H., Gu, X., Lu, S., Qiu, Z., & Sui, Q. (2014). Generation and intensity of active oxygen species in thermally activated persulfate systems for the degradation of trichloroethylene. RSC Adv., 4(76), Yan, T., Chen, H., Jiang, F., & Wang, X. (2014). Adsorption of Per fl uorooctane Sulfonate and Per fl uorooctanoic Acid on Magnetic Mesoporous Carbon Nitride. Yang, S., Cheng, J., Sun, J., Hu, Y., & Liang, X. (2013). Defluorination of Aqueous Perfluorooctanesulfonate by Activated Persulfate Oxidation. PLoS ONE, 8(10), Yin, C. Y., Aroua, M. K., & Daud, W. M. A. W. (2007). Review of modifications of activated carbon for enhancing contaminant uptakes from aqueous solutions. Separation and Purification Technology, 52(3), Yin, P., Hu, Z., Song, X., Liu, J., & Lin, N. (2016). Activated persulfate oxidation of perfluorooctanoic acid (PFOA) in groundwater under acidic conditions. International Journal of Environmental Research and Public Health, 13(6). You, C., Jia, C. X., & Pan, G. (2010). Effect of salinity and sediment characteristics on the sorption and desorption of perfluorooctane sulfonate at sediment-water interface. Environmental Pollution, 158(5), Yu, J., Lv, L., Lan, P., Zhang, S., Pan, B., & Zhang, W. (2012). Effect of effluent organic matter on the adsorption of perfluorinated compounds onto activated carbon. Journal of Hazardous Materials, , Yu, Q., Zhang, R., Deng, S., Huang, J., & Yu, G. (2009). Sorption of perfluorooctane sulfonate and perfluorooctanoate on activated carbons and resin: Kinetic and isotherm study. Water Research, 43(4), Yuan, Q., Ravikrishna, R., & Valsaraj, K. T. (2001). Reusable adsorbents for dilute solution separation. 5. Photodegradation of organic compounds on surfactant-modified titania. Separation and Purification Technology, 24(1 2), Zhan, H. (1999). Analytical study of capture time to a horizontal well. Journal of Hydrology, 217(1 2), Zhang, Q., Deng, S., Yu, G., & Huang, J. (2011). Removal of perfluorooctane sulfonate from aqueous solution by crosslinked chitosan beads: Sorption kinetics and uptake mechanism. Bioresource Technology, 102(3), Zhao, D., Liao, X., Yan, X., Huling, S. G., Chai, T., & Tao, H. (2013). Effect and mechanism of persulfate activated by different methods for PAHs removal in soil. Journal of Hazardous Materials, (1), Zhao, L., Zhu, L., Yang, L., Liu, Z., & Zhang, Y. (2012). Distribution and desorption of perfluorinated compounds in fractionated sediments. Chemosphere, 88(11), Zhi, Y., & Liu, J. (2015). Adsorption of perfluoroalkyl acids by carbonaceous adsorbents: Effect of carbon surface chemistry. Environmental Pollution, 202, Zhi, Y., & Liu, J. (2016). Surface modification of activated carbon for enhanced adsorption of 105
130 perfluoroalkyl acids from aqueous solutions. Chemosphere, Zhong, H., Brusseau, M. L., Wang, Y., Yan, N., Quig, L., & Johnson, G. R. (2015). In-situ Activation of Persulfate by Iron Filings and Degradation of 1,4-dioxane. Water Research, 83, Zhou, Q., Deng, S., Yu, Q., Zhang, Q., Yu, G., Huang, J., & He, H. (2010a). Chemosphere Sorption of perfluorooctane sulfonate on organo-montmorillonites. Chemosphere, 78(6), Zhou, Q., Deng, S., Zhang, Q., Fan, Q., Huang, J., & Yu, G. (2010b). Sorption of perfluorooctane sulfonate and perfluorooctanoate on activated sludge. Chemosphere, 81(4),
131 APPENDIX A. SUPORTING DATA APPENDIX A.1. SORPTION ISOTHERM OF PFAS ONTO DIFFERENT GAC TYPES (500 MG/L INITIAL CONCENTRATION, 7-DAY REACTION TIME, PH =7.2) Figure A.1. Adsorbability of PFAS onto F400 GAC. Figure A.2. Freundlich isotherm of PFAS onto F400 GAC. 107
132 Figure A.3. Langmuir isotherm of PFAS onto F400 GAC. Figure A.4. Adsorbability of PFAS onto F300 GAC. 108
133 Figure A.5. Freundlich isotherm of PFAS onto F300 GAC. Figure A.6. Langmuir isotherm of PFAS onto F300 GAC. 109
134 Figure A.7. Adsorbability of PFAS onto Jacobi GAC. Figure A.8. Freundlich isotherm of PFAS onto Jacobi GAC. 110
135 Figure A.9. Langmuir isotherm of PFAS onto Jacobi GAC. Figure A.10. Adsorbability of PFAS onto CBC GAC. 111
136 Figure A.11. Freundlich isotherm of PFAS onto CBC GAC. Figure A.12. Langmuir isotherm of PFAS onto CBC GAC. 112
137 APPENDIX A.2. SORPTION ISOTHERM OF PFAS ONTO F400 AND CBC GAC (1 MG/L INITIAL CONCENTRATION, 7-DAY REACTION TIME, PH =7.2) Figure A.13. Adsorbability of PFOA onto F400 and CBC GAC-as an individual compound and in mixture. Figure A.14. Freundlich isotherm of PFOA onto F400 and CBC GAC-as an individual compound and in mixture. 113
138 Figure A.15. Langmuir isotherm of PFOA onto F400 and CBC GAC-as an individual compound and in mixture. Figure A.16. Adsorbability of PFOS onto F400 and CBC GAC-as an individual compound and in mixture. 114
139 Figure A.17. Freundlich isotherm of PFOS onto F400 and CBC GAC-as an individual compound and in mixture. Figure A.18. Langmuir isotherm of PFOS onto F400 and CBC GAC-as an individual compound and in mixture. 115
140 APPENDIX A.3. EDX PATTERNS OF GAC F400_HCl_1 F400_HCl_2 F400_NaOH_1 F400_NaOH_2 F400_PS_1 F400_PS_2 Figure A.19. EDX patterns F400 hydrochloric acid (HCl), sodium hydroxide (NaOH) and persulfate (PS) treated GAC. 116
141 CBC_HCl_1 CBC_HCl_2 CBC_NaOH_1 CBC_NaOH_2 CBC_PS_1 CBC_PS_2 Figure A.20. EDX patterns CBC hydrochloric acid (HCl), sodium hydroxide (NaOH) and persulfate (PS) treated GAC. 117
142 APPENDIX A.4. PRELIMINARY OXIDATION EXPERIMENTS Table A.1. Aqueous PFOA and PFOS degradation with oxidant-activator combinations. Final PFOA PFOS ph Oxidation conditions % Removed* Persulfate (10000 mg/l) + hydrogen peroxide (200 mg/l) Heat-activated persulfate (1000 mg/l) (80 C) Persulfate (1000 mg/l) + Iron activation (200 mg/l) 1.8 < 5 46 Persulfate (1000 mg/l) + Iron activation (200 mg/l) + heat (80 C) Alkaline ph (> 11) activated persulfate (1000 mg/l) 10.7 < 5 13 Alkaline ph (>11) + Fe-activated persulfate (200 mg/l) 7.8 < Control conditions Final Concentration** Control - no oxidant, no activator Control - no oxidant, alkaline ph > Control - no oxidant, heat 80 C *% Difference from control (no-oxidant and no-activator) **Initial concentration as 10 mg/l All samples including controls were collected and analyzed at end of 1 week (slow reaction systems) APPENDIX A.5. EVALUATION OF PH EFFECTS ON PFOA, PFOS, AND FLUORIDE MEASURMEMENTS Table A.2. Changes in aqueous PFOA and PFOS concentration measurements along the changes in ph of the solution. PFOA, µm PFOS, µm ph* average stdev ph* average stdev * ph was adjusted using 0.1M HCl and 0.1M NaOH buffer solutions Table A.3. Changes in fluoride (F - ) concentration measurements along the changes in ph of the solution. ph* F -, mm ** average stdev * ph was adjusted using 0.1M HCl and 0.1M NaOH buffer solutions ** The standard solution was prepared as 5.26mM (100ppm) of F - as NaF with measured initial ph as 4.3; before measuring the concentration using fluoride selective electrode, the sample solution was added with equal volume of TISAB (total ionic strength adjuster buffer) 118

143 Figure A.21. Effects of ph on PFOA, PFOS and F - concentration measurements. Error bars on adjusted concentration values represent the standard errors of the mean estimates. APPENDIX A.6. FLUORIDE ADSORPTION ONTO GAC Figure A.22. Fluoride adsorption onto GAC at different ph values, initial fluoride concentration 5 mg/l, 2 g of GAC. 119
144 Table A.4. Fluoride adsorption onto GAC at different aqueous ph values. ph GAC (20h*) No GAC (20h*) GAC (2h*) No GAC (2h*) GAC (0.5h*) No GAC (0.5h*) GAC (0.25h*) No GAC (0.25h*) *Contact period of fluoride solution (initial 5 mg/l) with GAC (2g) were 0.25, 0.5, 2, 20 hours (a) (b) Figure A.22. (a) Percentage removal of fluoride (5 mg/l), and (b) fluoride adsorption capacity of GAC (at 2 hours) in conditions with and without the presence of sulfate (20 g/l). Table A.5. Effects of sulfate presence on the fluoride sorption onto GAC in different aqueous ph conditions. % removal of fluoride Adsorption capacity of fluoride ph GAC+ Sulfate GAC + No sulfate GAC+ Sulfate GAC + No sulfate

145 APPENDIX A.7. COLUMN DESIGN SPECIFICATIONS Figure A.23. Picture of the column experiment Height of column = 24 cm; Inner diameter = 3.5 cm; Area = 9.62 cm 2 ; Amount of GAC used = 100 g of GAC in each column; Assumed porosity for column design = 0.3. Pore volume: Volume of reactor assumed porosity = 100 cm = 30 cm 3 Flow rate, QQ: Area of column * typical groundwater flow = 9.62cm cm/h = cm 3 /h Packed bed contact time = VV/ QQ For 10 pore volumes = (300 cm 3 ) (12.25 cm 3 /h) = h Synthetic Groundwater Composition: 200 mg/l CaCO 3, 272 mg/l CaSO 4, 252 mg/l NaHCO 3, 194 mg/l 4MgCO 3.Mg(OH 2 ).5H 2 O, 750 mg/l KCl and ph will be adjusted to 7 using 0.1 M HCl and 0.1 M NaOH. 121
Characterization of the Fate and Biotransformation of Fluorochemicals in AFFF-Contaminated Groundwater at Fire/Crash Testing Military Sites (ER-2128)
") Characterization of the Fate and Biotransformation of Fluorochemicals in AFFF-Contaminated Groundwater at Fire/Crash Testing Military Sites (ER-2128) Objective The nature and extent of groundwater contamination
Characterization of the Fate and Biotransformation of Fluorochemicals in AFFF-Contaminated Groundwater at Fire/Crash Testing Military Sites (ER-2128) Objective The nature and extent of groundwater contamination
REGENERATION OF SPENT ADSORBENTS USING ADVANCED OXIDATION (PREPRINT)
") AL/EQ-TP-1993-0307 REGENERATION OF SPENT ADSORBENTS USING ADVANCED OXIDATION (PREPRINT) John T. Mourand, John C. Crittenden, David W. Hand, David L. Perram, Sawang Notthakun Department of Chemical Engineering
AL/EQ-TP-1993-0307 REGENERATION OF SPENT ADSORBENTS USING ADVANCED OXIDATION (PREPRINT) John T. Mourand, John C. Crittenden, David W. Hand, David L. Perram, Sawang Notthakun Department of Chemical Engineering
Boron Treatment Technology for CCR Wastewater, Ash Leachate, and Groundwater
 2017 World of Coal Ash (WOCA) Conference in Lexington, KY - May 9-11, 2017 http://www.flyash.info/ Boron Treatment Technology for CCR Wastewater, Ash Leachate, and Groundwater Allison Kreinberg 1, Bruce
Chemical Oxidation Oxidizing agents
 Chemical Oxidation CENG 4710 Environmental Control Chemical oxidation is used to detoxify waste by adding an oxidizing agent to chemically transform waste compounds. It is capable of destroying a wide
PFAS TREATMENT AND REMEDIATION WEBINAR: TREATMENT OPTIONS FOR SOIL & GROUNDWATER
 PFAS TREATMENT AND REMEDIATION WEBINAR: TREATMENT OPTIONS FOR SOIL & GROUNDWATER MICHELLE CRIMI, PH.D. ASSOCIATE PROFESSOR, INSTITUTE FOR A SUSTAINABLE ENVIRONMENT, CLARKSON UNIVERSITY DECEMBER 14, 2016
Quantitation and Ratio Determination of Uranium Isotopes in Water and Soil Using Inductively Coupled Plasma Mass Spectrometry (ICP-MS)
") Quantitation and Ratio Determination of Uranium Isotopes in Water and Soil Using Inductively Coupled Plasma Mass Spectrometry (ICP-MS) D.N. Kurk, T.E. Beegle, S.C. Spence and R.J. Swatski Report Documentation
Quantitation and Ratio Determination of Uranium Isotopes in Water and Soil Using Inductively Coupled Plasma Mass Spectrometry (ICP-MS) D.N. Kurk, T.E. Beegle, S.C. Spence and R.J. Swatski Report Documentation
USER S GUIDE. ESTCP Project ER
 USER S GUIDE Demonstration of a Fractured Rock Geophysical Toolbox (FRGT) for Characterization and Monitoring of DNAPL Biodegradation in Fractured Rock Aquifers ESTCP Project ER-201118 JANUARY 2016 F.D.
Per and Polyfluoroalkyl Substances (PFAS) in AFFF Formulations and Groundwater
 in AFFF Formulations and Groundwater") Per and Polyfluoroalkyl Substances (PFAS) in AFFF Formulations and Groundwater Jennifer A. Field, Ph.D. Department of Environmental and Molecular Toxicology Oregon State University Corvallis, OR 2 3 3M
Per and Polyfluoroalkyl Substances (PFAS) in AFFF Formulations and Groundwater Jennifer A. Field, Ph.D. Department of Environmental and Molecular Toxicology Oregon State University Corvallis, OR 2 3 3M
A Technique for Determining Total Oxidizable Precursors (TOP) of Perfluoroalkyl Compounds
 of Perfluoroalkyl Compounds") A Technique for Determining Total Oxidizable Precursors (TOP) of Perfluoroalkyl Compounds Chuck Neslund, Technical Director, Eurofins Lancaster Laboratories Environmental, LLC NEMC, Washington, DC August
A Technique for Determining Total Oxidizable Precursors (TOP) of Perfluoroalkyl Compounds Chuck Neslund, Technical Director, Eurofins Lancaster Laboratories Environmental, LLC NEMC, Washington, DC August
Chemical Oxidation Overview. Jim Jacobs Tel:
 Chemical Oxidation Overview Jim Jacobs jimjacobs@ebsinfo.com Tel: 415-381-5195 Chemical oxidation uses reagents to transform, degrade, or immobilize organic wastes. Chemical oxidizers have been used for
CEE 371 Water and Wastewater Systems
 Updated: 22 November 2009 CEE 371 Water and Wastewater Systems Print version Lecture #23 Drinking Water Treatment: Ion Exchange, Adsorption & Arsenic Reading: Chapter 7, pp.262-266 David Reckhow CEE 371
Supporting Information. Treatment of Aqueous Film-Forming Foam by Heat-Activated. Persulfate Under Conditions Representative of
 1 Supporting Information 2 3 4 5 Treatment of Aqueous Film-Forming Foam by Heat-Activated Persulfate Under Conditions Representative of In Situ Chemical Oxidation 6 7 8 9 10 11 Thomas A. Bruton and David
ADVANCES IN POLY- AND PERFLUORALKYL SUBSTANCES (PFAS) ANALYTICAL TECHNIQUES
 ANALYTICAL TECHNIQUES") ADVANCES IN POLY- AND PERFLUORALKYL SUBSTANCES (PFAS) ANALYTICAL TECHNIQUES Implications for Conceptual Site Models Allan Horneman, PhD, Arcadis-U.S. Shawn Burnell, PG, Arcadis-U.S. Jeff Burdick, PG, Arcadis-U.S.
ADVANCES IN POLY- AND PERFLUORALKYL SUBSTANCES (PFAS) ANALYTICAL TECHNIQUES Implications for Conceptual Site Models Allan Horneman, PhD, Arcadis-U.S. Shawn Burnell, PG, Arcadis-U.S. Jeff Burdick, PG, Arcadis-U.S.
Optimization of In-Situ Chemical Oxidation Design Parameters
 Optimization of In-Situ Chemical Oxidation Design Parameters by Amine Dahmani, PhD Director, Site Assessment & Remediation Laboratories Ken Huang, PhD Remediation Laboratory Manager Environmental Research
Physicochemical Processes
 Lecture 3 Physicochemical Processes Physicochemical Processes Air stripping Carbon adsorption Steam stripping Chemical oxidation Supercritical fluids Membrane processes 1 1. Air Stripping A mass transfer
Catalytic Oxidation of CW Agents Using H O in 2 2 Ionic Liquids
 Catalytic Oxidation of CW Agents Using H O in 2 2 Ionic Liquids William M. Nelson,, PhD IL Waste Management & Research Center 2003 Joint Service Scientific Conference on Chemical & Biological Defense Research
REPORT DOCUMENTATION PAGE. Theoretical Study on Nano-Catalyst Burn Rate. Yoshiyuki Kawazoe (Tohoku Univ) N/A AOARD UNIT APO AP
 N/A AOARD UNIT APO AP") REPORT DOCUMENTATION PAGE Form Approved OMB No. 0704-0188 The public reporting burden for this collection of information is estimated to average 1 hour per response, including the time for reviewing instructions,
REPORT DOCUMENTATION PAGE Form Approved OMB No. 0704-0188 The public reporting burden for this collection of information is estimated to average 1 hour per response, including the time for reviewing instructions,
Chemical Oxidation. Jim Harrington, Chief Training and Technical Support Section May 7, 2005
 Chemical Oxidation Jim Harrington, Chief Training and Technical Support Section May 7, 2005 1 From ITRC Internet Seminar What s New with In Situ Chemical Oxidation ITRC Technical and Regulatory Guidance:
Chemical Oxidation and Reduction
 Chemical Oxidation and Reduction Benno Rahardyan FTSL-ITB Taken from : PIERO M. ARMENANTE NJIT What is oxidation? Simply put: The adding of an oxygen atom You are changing the composition of a molecule
REPORT DOCUMENTATION PAGE
 REPORT DOCUMENTATION PAGE Form Approved OMB No. 0704-0188 Public reporting burden for this collection of information is estimated to average 1 hour per response, including the time for reviewing instructions,
Andrew Hart Golder Associates (NZ) Limited. Assessment of ISCO for Remediation of PCP Impacted Soil
 Limited. Assessment of ISCO for Remediation of PCP Impacted Soil") Andrew Hart Golder Associates (NZ) Limited Assessment of ISCO for Remediation of PCP Impacted Soil Overview Introduction to In-Situ Chemical Oxidation (ISCO) Case Study PCP contamination at a timber treatment
Andrew Hart Golder Associates (NZ) Limited Assessment of ISCO for Remediation of PCP Impacted Soil Overview Introduction to In-Situ Chemical Oxidation (ISCO) Case Study PCP contamination at a timber treatment
Opening the analytical black box: Insights into interferences, corrections, and data quality
 Opening the analytical black box: Insights into interferences, corrections, and data quality Dr. Anthony J. Bednar Research Chemist USACE ERDC-EL 29 March 2012 D.M. Sirkis, W.E. Harris, T.J. Kelly USACE-NAP
PREDICTION OF HIGH TEMPERATURE GREASE LIFE USING A DECOMPOSITION KINETIC MODEL
 PREDICTION OF HIGH TEMPERATURE GREASE LIFE USING A DECOMPOSITION KINETIC MODEL In-Sik Rhee, Ph.D., U.S. Army Tank-Automotive Research, Development and Engineering Center, Warren, MI, 48397-5000 76th NLGI
STUDY OF DETECTION LIMITS AND QUANTITATION ACCURACY USING 300 MHZ NMR
 STUDY OF DETECTION LIMITS AND QUANTITATION ACCURACY USING 300 MHZ NMR William R. Creasy EAI Corporation, 1308 Continental Drive, Suite J, Abingdon MD 21009 David J. McGarvey, Jeffrey S. Rice, Richard O'Connor,
Award # N LONG TERM GOALS
 Non-Invasive Characterization Of Small-Scale Patterns Of Benthic Biogenic Structure By Ultrasound: Infaunal Dynamics And Sediment Structure, And Effect Of Sediment Disturbance Donald G. Webb Graduate School
7. PERFORMING ORGANIZATION NAME(S) AND ADDRESS(ES) 8. PERFORMING ORGANIZATION REPORT NUMBER
 AND ADDRESS(ES) 8. PERFORMING ORGANIZATION REPORT NUMBER") REPORT DOCUMENTATION PAGE Form Approved OMB No. 0704-0188 The public reporting burden for this collection of information is estimated to average 1 hour per response, including the time for reviewing instructions,
REPORT DOCUMENTATION PAGE Form Approved OMB No. 0704-0188 The public reporting burden for this collection of information is estimated to average 1 hour per response, including the time for reviewing instructions,
ELECTRON BEAM AND PULSED CORONA PROCESSING OF VOLATILE ORGANIC COMPOUNDS AND NITROGEN OXIDES
 ELECTRON BEAM AND PULSED CORONA PROCESSING OF VOLATILE ORGANIC COMPOUNDS AND NITROGEN OXIDES B. M. Penetrante, M. C. Hsiao, J. N. Bardsley, B. T. Merritt, G. E. Vogtlin and P. H. Wallman Lawrence Livermore
EXPLORING ADSORPTION OF NATURAL ORGANIC MATTER FROM NATURAL WATERS BY SURFACE-MODIFIED ACTIVATED CARBONS
 EXPLORING ADSORPTION OF NATURAL ORGANIC MATTER FROM NATURAL WATERS BY SURFACE-MODIFIED ACTIVATED CARBONS Wei Cheng, Seyed A. Dastgheib, and Tanju Karanfil * Clemson University, Department of Environmental
Volume 6 Water Surface Profiles
 A United States Contribution to the International Hydrological Decade HEC-IHD-0600 Hydrologic Engineering Methods For Water Resources Development Volume 6 Water Surface Profiles July 1975 Approved for
0DVM1+ fm(uw Odin* /I I /)
") 0DVM1+ fm(uw Odin* /I I /) REPORT DOCUMENTATION l*age Public reportina bunten far this collection of infoimason is estimated to average 1 hour per response, indudma the»meter revwwi datansadad ar«leompl«ttivjardrev(«vrfng»tecdl««lo«of
0DVM1+ fm(uw Odin* /I I /) REPORT DOCUMENTATION l*age Public reportina bunten far this collection of infoimason is estimated to average 1 hour per response, indudma the»meter revwwi datansadad ar«leompl«ttivjardrev(«vrfng»tecdl««lo«of
REMEDIATION OF SALT IMPACTED GROUNDWATER WITH ELECTROKINETICS. Paper by: Sean Kelly, Rick Churko, Sean Frisky, Anjum Mullick, Stuart Torr.
 REMEDIATION OF SALT IMPACTED GROUNDWATER WITH ELECTROKINETICS. Paper by: Sean Kelly, Rick Churko, Sean Frisky, Anjum Mullick, Stuart Torr. Alberta Transportation is supporting leading research in the use
Supporting Information
 1 Supporting Information 2 3 Discovery and implications of C 2 and C 3 perfluoroalkyl sulfonates in aqueous film forming foams (AFFF) and groundwater 4 Krista A. Barzen-Hanson a and Jennifer A. Field b*
Class XI Chapter 1 Some Basic Concepts of Chemistry Chemistry
 Question 1.1: Calculate the molecular mass of the following: (i) H 2 O (ii) CO 2 (iii) CH 4 (i) H 2 O: The molecular mass of water, H 2 O = (2 Atomic mass of hydrogen) + (1 Atomic mass of oxygen) = [2(1.0084)
Report Documentation Page
 Report Documentation Page Form Approved OMB No. 0704-0188 Public reporting burden for the collection of information is estimated to average 1 hour per response, including the time for reviewing instructions,
Supplementary Data. Supplementary Table S1.
 Supplementary Data AFFFs AOPs ARPs CEC ISCO ph pzc SA BET TNTs TSS WWTP VSS Decomposition Mineralization Supplementary Table S1. Abbreviations of General Terms, Definitions, and Equations Aqueous film-forming
4. Magnesium has three natural isotopes with the following masses and natural abundances:
 Exercise #1. Determination of Weighted Average Mass 1. The average mass of pennies minted after 1982 is 2.50 g and the average mass of pennies minted before 1982 is 3.00 g. Suppose that a bag of pennies
Microorganisms. Dissolved inorganics. Native vs. Introduced; Oligotrophic vs. Eutrophic Millions to billions per ml or g Complex consortia
 1 Microorganisms Native vs. Introduced; Oligotrophic vs. Eutrophic Millions to billions per ml or g Complex consortia Species makeup: f(t, O 2, ph, nutrients, etc.) Indicators & pathogens Dissolved inorganics
ADSORPTION. Briefly, adsorption is the surface accumulation of material.
 ADSORPTION Briefly, adsorption is the surface accumulation of material. Adsorption is a unit operation in which dissolved constituents are removed from the solvent (water) by transfer to the surfaces of
Attribution Concepts for Sub-meter Resolution Ground Physics Models
 Attribution Concepts for Sub-meter Resolution Ground Physics Models 76 th MORS Symposium US Coast Guard Academy Approved for public release distribution. 2 Report Documentation Page Form Approved OMB No.
Kalinovich, I., Thalheimer. A.H., Loney, B.
 Kalinovich, I., Thalheimer. A.H., Loney, B. Perfluorinated-carbon tail hydrophobic interactions Functional group head electrostatic interactions PFAS = Per- and polyfluorinated alkyl substances Sites Impacted
Hach Method Total Organic Carbon in Finished Drinking Water by Catalyzed Ozone Hydroxyl Radical Oxidation Infrared Analysis
 Hach Method 1061 Total Organic Carbon in Finished Drinking Water by Catalyzed Ozone Hydroxyl Radical Oxidation Infrared Analysis Hach Company Method 1061 Revision 1. December 015 Organic Carbon in Finished
Guide to the Development of a Deterioration Rate Curve Using Condition State Inspection Data
 Guide to the Development of a Deterioration Rate Curve Using Condition State Inspection Data by Guillermo A. Riveros and Elias Arredondo PURPOSE: The deterioration of elements of steel hydraulic structures
Sorption of Contaminants from Solution: Terms & Principles
 PlumeStop Technical Bulletin 2.1 Sorption of Contaminants from Solution: Terms & Principles Quick Reference: Basis of PlumeStop sorption PlumeStop sorption isotherms Significance as a remediation tool
A report (dated September 20, 2011) on. scientific research carried out under Grant: FA
 on. scientific research carried out under Grant: FA") A report (dated September 20, 2011) on scientific research carried out under Grant: FA2386-10-1-4150 First-principles determination of thermal properties in nano-structured hexagonal solids with doping
A report (dated September 20, 2011) on scientific research carried out under Grant: FA2386-10-1-4150 First-principles determination of thermal properties in nano-structured hexagonal solids with doping
Improvements in Modeling Radiant Emission from the Interaction Between Spacecraft Emanations and the Residual Atmosphere in LEO
 Improvements in Modeling Radiant Emission from the Interaction Between Spacecraft Emanations and the Residual Atmosphere in LEO William L. Dimpfl Space Science Applications Laboratory The Aerospace Corporation
Design for Lifecycle Cost using Time-Dependent Reliability
 Design for Lifecycle Cost using Time-Dependent Reliability Amandeep Singh Zissimos P. Mourelatos Jing Li Mechanical Engineering Department Oakland University Rochester, MI 48309, USA : Distribution Statement
Removal of Methylene Blue, Methyl Violet, Acid Blue and Acid Violet Dyes using Blue-Green Algae by Adsorption Technique
 Removal of Methylene Blue, Methyl Violet, Acid Blue and Acid Violet Dyes using Blue-Green Algae by Adsorption Technique By J. Krishnaveni Supervisor Dr. N. Renugadevi Thesis Submitted to Avinashilingam
Optimizing Robotic Team Performance with Probabilistic Model Checking
 Optimizing Robotic Team Performance with Probabilistic Model Checking Software Engineering Institute Carnegie Mellon University Pittsburgh, PA 15213 Sagar Chaki, Joseph Giampapa, David Kyle (presenting),
Lower Sixth Chemistry. Sample Entrance Examination
 Lower Sixth Chemistry Sample Entrance Examination Time allowed: 60 minutes Name: Total : 60 Marks INSTRUCTIONS : Answer all questions Answers should be written in the spaces provided Dictionaries or reference
Crowd Behavior Modeling in COMBAT XXI
 Crowd Behavior Modeling in COMBAT XXI Imre Balogh MOVES Research Associate Professor ilbalogh@nps.edu July 2010 831-656-7582 http://movesinstitute.org Report Documentation Page Form Approved OMB No. 0704-0188
Adsorption of Humic acid on Powdered Activated Carbon (PAC)
") Adsorption of Humic acid on Powdered Activated Carbon (PAC) Department of Civil and Environmental Engineering, MSU, East Lansing, MI, 48824, USA Abstract Removal capacity and rate of Humic Acid (HA) onto
Adsorption of Humic acid on Powdered Activated Carbon (PAC) Department of Civil and Environmental Engineering, MSU, East Lansing, MI, 48824, USA Abstract Removal capacity and rate of Humic Acid (HA) onto
CHEMICAL OXIDATION TECHNIQUES FOR THE IN SITU REMEDIATION OF HYDROCARBON IMPACTED SOILS
 CHEMICAL OXIDATION TECHNIQUES FOR THE IN SITU REMEDIATION OF HYDROCARBON IMPACTED SOILS Cheryl Kluck and Gopal Achari Center for Environmental Engineering Research and Education (CEERE) University of Calgary
CHEMICAL OXIDATION. The use of oxidizing agents without the need of microorganisms for the reactions to proceed
 CHEMICAL OXIDATION The use of oxidizing agents without the need of microorganisms for the reactions to proceed oxidizing agents : O 3, H 2 O 2, Cl 2 or HOCl or O 2 etc catalysts : ph, transition metals,
Drillox Technology. Technology Covered by Patent Application
 Drillox Technology Technology Covered by Patent Application Presentation Outline Calcium Peroxide Properties The Drillox Technology Principle Comparison with other oxidants Testing protocol Lab studies
Thermo-Kinetic Model of Burning for Polymeric Materials
 Thermo-Kinetic Model of Burning for Polymeric Materials Stanislav I. Stoliarov a, Sean Crowley b, Richard Lyon b a University of Maryland, Fire Protection Engineering, College Park, MD 20742 b FAA W. J.
Lect. 2: Chemical Water Quality
 The Islamic University of Gaza Faculty of Engineering Civil Engineering Department M.Sc. Water Resources Water Quality Management (ENGC 6304) Lect. 2: Chemical Water Quality ١ Chemical water quality parameters
IMPROVED SYNTHESIS AND REACTION CHEMISTRY OF FN 3
 IMPROVED SYNTHESIS AND REACTION CHEMISTRY OF FN 3 William W. Wilson,, Karl O. Christe, Ashwani Vij, Ralf Haiges ERC, Inc and Propellants Branch, Propulsion Directorate, Air Force Research Laboratory, Edwards
Perchlorate-Future Regulations and Treatment Alternatives. Bill Persich, P.E.* PNWS AWWA Conference Eugene, OR May *WA, ID, OR
 Perchlorate-Future Regulations and Treatment Alternatives Bill Persich, P.E.* PNWS AWWA Conference Eugene, OR May 7-9 2014 *WA, ID, OR Presentation Summary The Nature of the Beast Where are Perchlorates
DISTRIBUTION A: Distribution approved for public release.
 AFRL-AFOSR-JP-TR-2017-0059 Nanostructured catalytic hybrid materials Kap Seung Yang UNIVERSITY INDUSTRY LIAISON OF CHONNAM NATIONAL UN 08/28/2017 Final Report DISTRIBUTION A: Distribution approved for
CHAPTER 9 CHEMICAL QUANTITIES
 Chemistry Name Hour Chemistry Approximate Timeline Students are expected to keep up with class work when absent. CHAPTER 9 CHEMICAL QUANTITIES Day Plans for the day Assignment(s) for the day 1 Begin Chapter
Science 20 - Solution concentration
 Science 20 - Solution concentration The concentration of a solution is a ratio of the amount of solute dissolved in a specific quantity of solvent. A dilute solution contains a relatively low quantity
Diagonal Representation of Certain Matrices
 Diagonal Representation of Certain Matrices Mark Tygert Research Report YALEU/DCS/RR-33 December 2, 2004 Abstract An explicit expression is provided for the characteristic polynomial of a matrix M of the
Sorptive Remediation of Perfluorooctanoic Acid (PFOA) Using Mixed Mineral and Graphene/Carbon-Based. Materials
 Using Mixed Mineral and Graphene/Carbon-Based. Materials") 1 2 3 10.1071/EN18156_AC CSIRO 2018 Environmental Chemistry 4 5 Supplementary Material 6 7 8 9 Sorptive Remediation of Perfluorooctanoic Acid (PFOA) Using Mixed Mineral and Graphene/Carbon-Based Materials
1 2 3 10.1071/EN18156_AC CSIRO 2018 Environmental Chemistry 4 5 Supplementary Material 6 7 8 9 Sorptive Remediation of Perfluorooctanoic Acid (PFOA) Using Mixed Mineral and Graphene/Carbon-Based Materials
International Advanced Level Chemistry Advanced Subsidiary Unit 2: Application of Core Principles of Chemistry
 Write your name here Surname Other names Pearson Edexcel International Advanced Level Centre Number Candidate Number Chemistry Advanced Subsidiary Unit 2: Application of Core Principles of Chemistry Friday
Report Documentation Page
 Inhibition of blood cholinesterase activity is a poor predictor of acetylcholinesterase inhibition in brain regions of guinea pigs exposed to repeated doses of low levels of soman. Sally M. Anderson Report
Chemical Oxidation - How Oxidants Work
 Chemical Oxidation - How Oxidants Work Charles Blanchard, PE Regional Engineer Groundwater & Environmental Services, Inc. Chemical Oxidation Overview Direct oxidation is a reaction between a compound and
Stuart M. Peters, Tai T. Wong and John G. Agar O Connor Associates Environmental Inc., Calgary, Alberta, CANADA, T2G 0Y2. Abstract
 Field Aspects of Oxidation and Enhanced Biodegradation: Understanding and Controlling Chemical Reactions during the Injection of Hydrogen Peroxide for In Situ Remediation of Petroleum Hydrocarbons Stuart
Materials U.S. Perspective
 Scott Fetter REACH Impact on Aerospace JSF/F-35 Pollution Prevention Activities Progress Update since 2004 ISO Review F-35 Air Systems Integration Environmental Safety and Health Lead Lockheed Martin Aeronautics
Predicting Deformation and Strain Behavior in Circuit Board Bend Testing
 Predicting Deformation and Strain Behavior in Circuit Board Bend Testing by Ronen Aniti ARL-CR-0693 May 2012 prepared by Science and Engineering Apprenticeship Program George Washington University 2121
Key factors for a successful ISCO application with Permanganate
 Key factors for a successful ISCO application with Permanganate Prepared by: Richard W Lewis CPG Program Manager ERM 1, 11/22/2002 1 1 ISCO Treatment Two key issues Does the reaction take place? Competing
Chemical Hydrogeology
 Physical hydrogeology: study of movement and occurrence of groundwater Chemical hydrogeology: study of chemical constituents in groundwater Chemical Hydrogeology Relevant courses General geochemistry [Donahoe]
During photosynthesis, plants convert carbon dioxide and water into glucose (C 6 H 12 O 6 ) according to the reaction:
 according to the reaction:") Example 4.1 Stoichiometry During photosynthesis, plants convert carbon dioxide and water into glucose (C 6 H 12 O 6 ) according to the reaction: Suppose that a particular plant consumes 37.8 g of CO 2
Example 4.1 Stoichiometry During photosynthesis, plants convert carbon dioxide and water into glucose (C 6 H 12 O 6 ) according to the reaction: Suppose that a particular plant consumes 37.8 g of CO 2
Two-Dimensional Simulation of Truckee River Hydrodynamics
 Two-Dimensional Simulation of Truckee River Hydrodynamics by Stephen H. Scott PURPOSE: The purpose of this Coastal and Hydraulics Engineering Technical Note (CHETN) is to demonstrate the use of multidimensional
Chemical Oxidation of MTBE and TBA
 Chemical Oxidation of and Marc Carver (ERM, Inc., Ewing, New Jersey), Richard A. Brown, Ph.D., (ERM, Inc., Ewing, New Jersey) ABSTRACT: Methyl tertiary butyl ether () is a synthetic chemical that was historically
CP Chapter 15/16 Solutions What Are Solutions?
 CP Chapter 15/16 Solutions What Are Solutions? What is a solution? A solution is uniform that may contain solids, liquids, or gases. Known as a mixture Solution = + o Solvent The substance in abundance
SWELL RATIO TESTER REPORT FY 2003
 Indian Head Division IHTR 2654 Naval Surface Warfare Center 24 September 2004 Indian Head, MD 20640-5035 SWELL RATIO TESTER REPORT FY 2003 Ralph Gamba Approved for public release; distribution is unlimited.
12. Lead, Pb (atomic no. 82)
") 12. Lead, Pb (atomic no. 82) - Sources of Pb contamination include mining, metal processing, lead battery manufacturing, chemical and paint manufacturing, and lead wastes. -USEPA drinking water action
12. Lead, Pb (atomic no. 82) - Sources of Pb contamination include mining, metal processing, lead battery manufacturing, chemical and paint manufacturing, and lead wastes. -USEPA drinking water action
INFRARED SPECTROSCOPY OF HYDROGEN CYANIDE IN SOLID PARAHYDROGEN (BRIEFING CHARTS)
") AFRL-MN-EG-TP-2006-7403 INFRARED SPECTROSCOPY OF HYDROGEN CYANIDE IN SOLID PARAHYDROGEN (BRIEFING CHARTS) C. Michael Lindsay, National Research Council, Post Doctoral Research Associate Mario E. Fajardo
AFRL-MN-EG-TP-2006-7403 INFRARED SPECTROSCOPY OF HYDROGEN CYANIDE IN SOLID PARAHYDROGEN (BRIEFING CHARTS) C. Michael Lindsay, National Research Council, Post Doctoral Research Associate Mario E. Fajardo
System Reliability Simulation and Optimization by Component Reliability Allocation
 System Reliability Simulation and Optimization by Component Reliability Allocation Zissimos P. Mourelatos Professor and Head Mechanical Engineering Department Oakland University Rochester MI 48309 Report
TECHNICAL SCIENCE DAS12703 ROZAINITA BT. ROSLEY PUSAT PENGAJIAN DIPLOMA UNVERSITI TUN HUSSEIN ONN MALAYSIA
 TECHNICAL SCIENCE DAS12703 ROZAINITA BT. ROSLEY PUSAT PENGAJIAN DIPLOMA UNVERSITI TUN HUSSEIN ONN MALAYSIA ii TABLE OF CONTENTS TABLE OF CONTENTS... i LIST OF FIGURES... iii Chapter 1... 4 SOLUTIONS...
Nye 179 Poly-oc-Olefin Estimated Vapor Pressure as a Function of Oil Loss at 40 C
 ! Engineering SMC-TR-02-21 AEROSPACE REPORT NO. TR-2002(8565)-3 Nye 179 Poly-oc-Olefin Estimated Vapor Pressure as a Function of Oil Loss at 40 C 20 March 2002 Prepared by D. J. CARRE Space Materials Laboratory
Perfluorinated Alkyl Acids (PFAA) in Water by LC/MS/MS - PBM
 in Water by LC/MS/MS - PBM") Organics Revision Date: July 19, 2017 Perfluorinated Alkyl Acids (PFAA) in Water by LC/MS/MS - PBM Parameter Perfluorinated Alkyl Acids (Perfluorobutane Sulphonate (PFBS), Perflourooctane Sulphonate (PFOS),
Organics Revision Date: July 19, 2017 Perfluorinated Alkyl Acids (PFAA) in Water by LC/MS/MS - PBM Parameter Perfluorinated Alkyl Acids (Perfluorobutane Sulphonate (PFBS), Perflourooctane Sulphonate (PFOS),
Chemical Oxidation Update: New Method for Activating Persulfate. SMART Remediation Vancouver, ON February 11, 2016
 Chemical Oxidation Update: New Method for Activating Persulfate Jean Paré Chemco SMART Remediation Vancouver, ON February 11, 2016 SMART is Powered by: www.vertexenvironmental.ca Chemical Oxidation Update:
Fire Fighting Chemicals Group Standard HSR002573
 Fire Fighting Chemicals Group Standard 2017 - HSR002573 GROUP STANDARD UNDER THE HAZARDOUS SUBSTANCES AND NEW ORGANISMS ACT 1996 Fire Fighting Chemicals Group Standard 2017 Pursuant to clause 5 of Schedule
Part A Answer all questions in this part.
 Part A Directions (1-24): For each statement or question, record on your separate answer sheet the number of the word or expression that, of those given, best completes the statement or answers the question.
Glossary of Common Laboratory Terms
 Accuracy A measure of how close a measured value is to the true value. Assessed by means of percent recovery of spikes and standards. Aerobic Atmospheric or dissolved oxygen is available. Aliquot A measured
NaOH + HCl ---> NaCl + H 2 O
 EXERCISES, LESSON 2 INSTRUCTIONS. Write the word, words, symbols, or numbers that properly completes the statement in the space provided or mark the correct word/phrase from those given. After you complete
Understanding Near-Surface and In-cloud Turbulent Fluxes in the Coastal Stratocumulus-topped Boundary Layers
 Understanding Near-Surface and In-cloud Turbulent Fluxes in the Coastal Stratocumulus-topped Boundary Layers Qing Wang Meteorology Department, Naval Postgraduate School Monterey, CA 93943 Phone: (831)
Analysis of South China Sea Shelf and Basin Acoustic Transmission Data
 DISTRIBUTION STATEMENT A: Approved for public release; distribution is unlimited. Analysis of South China Sea Shelf and Basin Acoustic Transmission Data Ching-Sang Chiu Department of Oceanography Naval
In Situ Chemical Oxidation (ISCO) Overview
 Overview") In Situ Chemical Oxidation (ISCO) Overview presentation for TEMADAG VINTERMØDE 2010 Vingstedcentret, Vejle, Denmark by: Prasad Kakarla In-Situ Oxidative Technologies, Inc. (ISOTEC SM ) West Windsor, New
In Situ Chemical Oxidation (ISCO) Overview presentation for TEMADAG VINTERMØDE 2010 Vingstedcentret, Vejle, Denmark by: Prasad Kakarla In-Situ Oxidative Technologies, Inc. (ISOTEC SM ) West Windsor, New
An Observational and Modeling Study of Air-Sea Fluxes at Very High Wind Speeds
 An Observational and Modeling Study of Air-Sea Fluxes at Very High Wind Speeds Kerry Emanuel Room 54-1620, MIT 77 Massachusetts Avenue Cambridge, MA 02139 phone: (617) 253-2462 fax: (425) 740-9133 email:
STUDY ON THE IMPROVEMENT OF THE REDUCTION CAPACITY OF ACTIVATED CARBON FIBER
 STUDY ON THE IMPROVEMENT OF THE REDUCTION CAPACITY OF ACTIVATED CARBON FIBER Chen Shuixia, Zeng Hanmin Materials Science Institute, Zhongshan University, Guangzhou 51275, China Key Laboratory for Polymeric
3. Organic Geochemisty Organic Chemistry is the chemistry... of Carbon -Morrison and Boyd
 3. Organic Geochemisty Organic Chemistry is the chemistry... of Carbon -Morrison and Boyd Definitions, Nomenclature Organic Compound Solubility Octanol-Water Partition Coefficient Organic Compound Sorption
Properties of Compounds
 Chapter 6. Properties of Compounds Comparing properties of elements and compounds Compounds are formed when elements combine together in fixed proportions. The compound formed will often have properties
Curating and Maintenance of the Sediment Library and Dredge Collection
 Curating and Maintenance of the Sediment Library and Dredge Collection Gerard C. Bond Lamont-Doherty Earth Observatory Deep-Sea Sample Repository of Columbia University Palisades, New York 10964 Phone:
Chapter 02 The Chemical Basis of Life I: Atoms, Molecules, and Water
 Chapter 02 The Chemical Basis of Life I: Atoms, Molecules, and Water Multiple Choice Questions 1. The atomic number of an atom is A. the number of protons in the atom. B. the number of neutrons in the
Use of Wijsman's Theorem for the Ratio of Maximal Invariant Densities in Signal Detection Applications
 Use of Wijsman's Theorem for the Ratio of Maximal Invariant Densities in Signal Detection Applications Joseph R. Gabriel Naval Undersea Warfare Center Newport, Rl 02841 Steven M. Kay University of Rhode
Supporting Information. Mass Balance of Perfluorinated Alkyl Acids in a Pristine Boreal Catchment
 Supporting Information Mass Balance of Perfluorinated Alkyl Acids in a Pristine Boreal Catchment Marko Filipovic 1, Hjalmar Laudon 2, Michael S. McLachlan 1, Urs Berger 1,3, * 1 Stockholm University, Department
REPORT DOCUMENTATION PAGE
 REPORT DOCUMENTATION PAGE Form Approved OMB No. 0704-0188 The public reporting burden for this collection of information is estimated to average 1 hour per response, including the time for reviewing instructions,
Predicting Tropical Cyclone Formation and Structure Change
 Predicting Tropical Cyclone Formation and Structure Change Patrick A. Harr Department of Meteorology Naval Postgraduate School Monterey, CA 93943-5114 Telephone: (831)656-3787 FAX:(831)656-3061 email: