High Temperature Water Gas Shift Reaction in Zeolite Membrane Reactors
|
|
|
- Paulina Boone
- 5 years ago
- Views:
Transcription
1
2 High Temperature Water Gas Shift Reaction in Zeolite Membrane Reactors A dissertation submitted to the Division of Graduate Studies and Research of the University of Cincinnati in partial fulfillment of the requirements of the degree of Doctor of Philosophy (Ph.D.) In the Department of Chemical and Materials Engineering of the College of Engineering Fall 2011 By Seok-Jhin Kim B.S. Chemical Engineering, Yonsei University, 1999 M.S. Chemical Engineering, Yonsei University, 2001 Committee: Dr. Junhang Dong (Chair) Dr. Panagiotis Smirniotis Dr. Joo-Youp Lee Dr. Henk Verweij
3 Abstract The water gas shift (WGS) reaction is a key operation in the production of hydrogen from fossil fuels (primarily coal and natural gas), biomass, and organic wastes through high temperature gasification processes. WGS reaction in hydrogen permselective membrane reactors has the potential to achieve both near-completion conversion and H 2 separation in a single unit operation that may significantly simplify and intensify the process and ultimately lead to dramatic cost reduction. Ideal membranes for such high temperature WGS reaction should possess perfect H 2 selectivity over the coexisting small molecules such as 2,, H 2 O, etc., large H 2 permeance, and long term material stability in sulfur-containing gases under high temperature hydrothermal conditions. However, such ideal membranes do not exist at present. In the literature, research and development efforts have been concentrated on membranes with high H 2 -selectivity, mainly the Pd-alloy and molecular sieve amorphous silica membranes. However, these membranes have serious issues of material instability in the conditions of syngas WGS reactions: the Pd-based membranes are readily damaged by sulfur-poisoning and the amorphous membranes degrade quickly due to hydrothermal condensation of silica. This dissertation investigates high temperature water gas shift reaction in MFI-type zeolite membrane reactors (MR). The research includes extensive experimental and simulation studies on WGS membrane reaction in a temperature range of o C and a reaction pressure range of 2 6 atm. The MFI-type zeolite membranes have extraordinary thermal and chemical stabilities in the syngas WGS conditions but have relatively low H 2 -selectivity over the small molecules in the reaction stream. The goal of this research is to understand the effects of membrane properties, i.e. selectivity and permeance, and WGS MR operation conditions on the conversion in the membrane reactor and evaluate the feasibility i
4 of the zeolite MR for achieving nearly complete conversion at high temperatures. Macroporous α-alumina disc supported MFI zeolite membranes have been synthesized from Al-free precursors and modified by a novel on-stream catalytic cracking deposition (CCD) method previously developed in our laboratory to reduce the effective zeolitic pore size for improved H 2 selectivity without large decrease in permeance. Modified MFI-type zeolite disc membranes with different membrane quality in terms of H 2 selectivity and permeance were prepared and tested for high temperature WGS reaction using a cerium-doped ferrite (Fe/Ce) catalyst. It was found that increasing reaction pressure in the MR benefits the enhancement of the χ and dramatically reduce the undesirable side reactions of methanation. Both the enhancement of the χ and the inhibition of methanation in the MR are attributed to the more effective removal of H 2 from the catalyst bed at higher pressures, because H 2 is a product of WGS reaction and meanwhile a reactant for methanation reactions. The results of this study indicate that membranes with reasonable H 2 selectivity can still be effective for χ enhancement at high operation temperature but will compromise the effectiveness in simultaneous H 2 purification in the MR. The zeolite membranes used in this work had moderate H 2 / 2 selectivity and H 2 permeance values, but χ in the MR exceeded the equilibrium conversion (, e χ ) at >450 o C and the χ enhancement became greater at higher temperature and pressure. However, for porous membrane with imperfect H 2 selectivity, the R H2 and y H2,p exhibit opposite trends with pressure, namely increasing R H2 but decreasing y H2,p with raising reaction pressure, because the relative amount of 2 in the membrane flux increases when H 2 is depleted in the reaction side at high H 2 recovery. The zeolite membrane and the Fe/Ce catalyst also showed good stability and tolerance to high concentration H 2 S in high temperature WGS reaction. ii
5 The modified MFI-type zeolite membrane showed long term (tested for >4000 h) stability in high temperature WGS conditions, which is so far the best compared to other membranes in literature reports. It is clear that the improvement of the WGS MR depends not only on the development of better membrane and catalyst but also on the optimization of the operation conditions. A simple one-dimension PFR model has been established for simulation of the WGS reaction performance in the zeolite disc MR. The model gives good results in quantitatively describing the WGS MR performance and predicting the relationships between the conversion and membrane properties as well as the performance dependences on operation conditions. The simulation also demonstrates the feasibility of using the modified MFI-type zeolite membrane reactors to achieve conversion above 99.5% under realistic operation conditions. In general, the modeling work showed that for a given zeolite membrane with specific H 2 selectivity and permeance, the χ in the MR increases with temperature and pressure increases initially, then levels off at certain point. These predictions are consistent with the experimental observations. On the other hand, for a membrane of a specific selectivity, the χ also shows a maximum as permeance increases and the specific maximum values depending on the operating temperature and pressure. This is because of the fact that permeance increases simultaneously when H 2 permeance increases at a fixed selectivity. Thus excessive permeation of unreacted would occur when the membrane permeance is too high. Results of this dissertation research prove that the modified siliceous MFI zeolite membranes, because of their chemical and thermal stabilities, are potentially useful as MR to achieve nearly complete conversion ( χ >99.5%) and dramatically reduced methanation by single unit operation but will compromise in H 2 recovery and purity in the permeate stream. Because of the imperfect H 2 selectivity, the iii
6 zeolite MR must be operated under conditions, i.e. high temperature and pressure, where fast react rate is achieved in the reactor to prevent excessive permeation of unreacted. The optimal operation conditions for WGS in a zeolite MR, and porous membranes in general, depend on the membrane quality. iv
7 v
8 Acknowledgements First I sincerely thank my advisor, Professor Junhang Dong for his long-time encouragement and thoughtful guidance during my PhD study. Under his guidance I overcame many difficulties and learned a lot not only in the technical area of membrane science and technology but also on method of scientific research. I am also grateful to my committee members, Prof. Panagiotis Smirniotis, Prof. Joo-Youp Lee, and Prof. Henk Verweij, for their insightful reviews and helpful suggestions. I would also like to thank Dr. Zhong Tang for his great help with membrane modification process at the beginning of this research work, my group members Ms. Xiling Tang, Mr. Justin Provenzano, Mr. Zhi Xu, Ms. Hongmin Jiang, Mr. Shaowei Yang, Mr. Ruidong Yang, Dr. Jian Zhang and Mr. Kurtis Remmel for their help on general lab facilities during my PhD study. Our collaborators, Prof. Peter Smirniotis and Dr. Krishna Reddy provided the high temperature WGS catalyst that made the HT WGS membrane reaction test possible. I remain greatly indebted to my family my mother Gilja Kim, my wife Ella Oh, my parents-in-law s family and my aunts family for their big supports. Very importantly, this research was financially supported by the U.S. Department of Energy (DE-FG36-GO15043), the Ohio Air Quality Development Authority (AY08-09-C21), and in part by the National Science Foundation (CBET ). vi
9 Table of Content ABSTRACT... I ACKNOWLEDGEMENTS... VI LIST OF FIGURES... IX LIST OF TABLES... XIV CHAPTER 1 INTRODUCTION AND LITERATURE REVIEW INTRODUCTION Hydrogen Production and WGS Membrane Reaction Objective of Dissertation Research Dissertation Arrangement LITERATURE REVIEW Zeolites and Zeolite Membranes Zeolite membrane reactors CHAPTER 2 SYNTHESIS AND MODIFICATION OF MFI-TYPE ZEOLITE MEMBRANES EXPERIMENTAL SECTION Synthesis of MFI-Type Zeolite Powders Synthesis of MFI-Type Zeolite Membranes Modification of MFI-Type Zeolite Membranes RESULTS AND DISCUSSION Synthesis of MFI-Type Zeolite Powders Synthesis of MFI-Type Zeolite Membranes Modification of MFI-Type Zeolite Membranes SUMMARY CHAPTER 3 HIGH TEMPERATURE WATER GAS SHIFT REACTION IN MICROPOROUS ZEOLITE MEMBRANE REACTORS vii
10 3.1 EXPERIMENTAL The Membrane Reactor WGS Reaction RESULTS AND DISCUSSION WGS Reaction in M01-A WGS Reaction in M01-B Long-Term Membrane Stability SUMMARY CHAPTER 4 MODELING AND SIMULATION OF HIGH TEMPERATURE WATER GAS SHIFT REACTION IN MFI ZEOLITE MEMBRANE REACTOR MODEL FOR WGS MR SIMULATIONS Kinetic Equations Membrane Reactor Model Establishment WGS MR SIMULATION Comparison between Simulation and Experimental Data Simulation of WGS MR in M01-A for Mixture Feeds Simulation Study of the Effects of Membrane Quality and Operation Conditions on WGS MR Performance SUMMARY CHAPTER 5 SUMMARY REFERENCES APPENDIX BIBLIOGRAPHY OF SEOK-JHIN KIM viii
11 List of Figures Figure 1. 1 Schematic showing the principle of operation of the WGS MR Figure 1. 2 Pore size and Si/Al ratios of some commonly used zeolites [13]... 7 Figure 1. 3 Schematic depiction of the zeolite membrane formation on a porous substrate, (a) nucleation on surface and (b) crystal growth into continuous polycrystalline membrane [21]... 9 Figure 2. 1 Topological structures of the 10-member ring MFI zeolite pore openings Figure 2. 2 Schematic diagram of membrane separation and modification apparatus [125] Figure 2. 3 SEM images of zeolite powders synthesized by in-situ crystallization Figure 2. 4 XRD patterns for (a) P01 (CH with Si/Al =111), (b) P02 (MH with Figure 2. 5 SEM images of zeolite powders synthesized by secondary growth methods using template-free precursors Figure 2. 6 XRD spectra of (a) P05 (CH with Si/Al =111), (b) P06 (MH with Si/Al =111), (c) P07 (CH with Si/Al = ), (d) P08 (MH with Si/Al = ), and P09 (MH with Si/Al =111) Figure 2. 7 SEM images of the membranes M01 and M02 (left cross section, right surface) Figure 2. 8 SEM images of silicalite seed layer and M03 (left cross section, right surface) Figure 2. 9 Separation of the equimolar H 2 / 2 mixture during CCD modification (Sample M03) Figure Separation for an equimolar H 2 / 2 mixture during CCD modification (M01-A) Figure Separation for an equimolar H 2 / 2 mixture during CCD modification for M01-B Figure Single gas permeance as a function of feed pressure at 500 o C with atmospheric pressure in permeate side: ( ) H 2, ( ) 2, ( ) ix
12 Figure 3. 1 Schematic showing the membrane reaction system and the MR configuration Figure 3. 2 Results of WGS reaction in the disc MR compared with data of TR and tube MR in reference [136]: (a) The χ and (b) R H2 and y H2,p Figure 3. 3 Effect of reaction pressure and temperature on χ, R H2 and y H2,p in the disc MR: (a) χ vs. p feed at 400 o C, (b) χ vs. p feed at 450 o C, (c) χ vs. p feed at 500 o C, and (d) χ vs. p feed at 550 o C, (e) R H2 and y H2,p as a function of p feed, and (f) χ as a function of temperature Figure 3. 4 Effect of feed R H2O/ on χ and R H2 at 550 o C and WHSV of 7,500 h -1 under different pressures Figure 3. 5 Effect of WHSV on (a) the χ and (b) R H2 and y H2,P Figure 3. 6 Effect of N 2 sweeping flow rate on χ and R H2 for a fixed WHSV=7,500 h -1 at 500 o C Figure 3. 7 Methane selectivity in the MR and TR under a fixed WHSV of 7,500 h 1 and R H2O/ of Figure 3. 8 Results of WGS reaction in the MR for a feed containing 40%, 30% H 2 and 30% Figure 3. 9 Methane selectivity for the -H 2-2 mixture feed in the MR and TR under a fixed WHSV of 7,500 h 1 and R H2O/ of Figure WGS membrane reaction with and without H 2 S in feed at a fixed WHSV=7,500 h -1 : (a) χ as a function of temperature at a R H2O/ of 3.5, and (b) χ as a function of R H2O/ at 550 o C Figure The χ vs. WGS reaction time for a feed containing 1,000ppm H 2 S Figure Results of membrane separation mixture of 1% H 2 S Figure Effect of reaction pressure and temperature on χ, R H2 and y H2,p in the disc MR: (a) χ vs. p feed at 400 o C, (b) χ vs. p feed at 450 o C, (c) χ vs. p feed at 500 o C, and (d) χ vs. p feed x
13 at 550 o C, (e) R H2 and y H2,p as a function of p feed, and (f) χ as a function of temperature. (membrane: M01-B) Figure Effect of feed R H2O/ on χ and R H2 at 550 o C and WHSV of 7,500 h -1 under different pressures. (membrane: M01-B) Figure Effect of WHSV on (a) the χ and (b) R H2 and y H2,P. (membrane: M01-B) Figure Effect of N 2 sweeping flow rate on χ and R H2 for a fixed WHSV=7,500 h -1 at 500 o C. (membrane: M01-B) Figure Results of WGS reaction in the disc MRs (M01-A and M01-B) compared with data of TR and tube MR in reference [136]: (a) The χ and (b) R H2 and y H2,p Figure Comparison of χ, R H2, and y H2,p between M01-A and M01-B at 400 o C (a and b) and 550 o C (c and d) Figure 4. 1 Results of WGS reaction over Fe/Ce catalyst in TR: (a) reaction rates vs. gas partial pressures; and (b) Arrhenius plot of reaction kinetic coefficient Figure 4. 2 The MR models: (a) CSTR and (b) PFR Figure 4. 3 Comparison of χ between experimental data and model calculations (a) PFR, (b) CSTR ( WHSV of 7,500 h -1, R H2O/ of 3.5, P p of 1 atm and F N2 of 20 cm 3 /min) Figure 4. 4 Comparison of experimental and simulated χ in M01-A (WHSV = 7,500 h -1, R H2O/ = 3.5, F N2 = 20 cm 3 /min, and P p of 1 atm): (a) 400 o C, (b) 450 o C, (c) 500 o C, and (d) 550 o C Figure 4. 5 Comparison of experimental and simulated χ in M01-B and TR (WHSV = 7,500 h -1, R H2O/ = 3.5, F N2 = 20 cm 3 /min, and P p of 1 atm): (a) 400 o C, (b) 450 o C, (c) 500 o C, and (d) 550 o C xi
14 Figure 4. 6 Comparison between the simulated and experimental χ as a function of R H2O/ in M01-B and TR at reaction pressure of 2 and 6 atm, respectively (T = 550 o C, WHSV = 7,500 h -1, 550 o C, p p = 1 atm, F N2 = 20 cm 3 /min): (a) 2 atm and (b) 6 atm Figure 4. 7 Effect of WHSV on χ in M01-B and TR at 550 o C, R H2O/ of 3.5, permeate pressure of 1 atm, and F N2 of 20 cm 3 /min. (a) at p feed of 2 atm and (b) at p feed of 6 atm Figure 4. 8 Effect of N 2 sweeping flow rate on χ in M01-B membrane reaction and TR operation at 550 o C, WHSV of 7,500 h -1, permeate pressure of 1 atm, and F N2 of 20 cm 3 /min: (a) at p feed of 2 atm and (b) p feed of 6 atm Figure 4. 9 Comparison of simulated and experimental χ for /H 2 / 2 mixture feed in M01-A (MR) and TR (R H2O/2 of 3.5 and WHSV of 7,500 h -1 ): (a) 400 o C, (b) 450 o C, (c) 500 o C, and (d) 550 o C Figure Comparison of simulated and experimental χ as a function of R H2O/2 for /H 2 / 2 mixture feed in M01-A (MR) and TR (at 550 o C and WHSV of 7,500 h -1 ): (a) 2 atm and (b) 6 atm Figure Comparison of simulated and experimental χ as a function of WHSV for /H 2 / 2 mixture feed in M01-A (MR) and TR (at 550 o C and R H2O/2 of 3.5): (a) 2 atm and (b) 6 atm.108 Figure Comparison of simulated and experimental χ as a function of F N2 for /H 2 / 2 feed in M01-A (MR) and TR (at 550 o C, WHSV of 7,500 h -1, and R H2O/2 of 3.5): (a) 2 atm and (b) 6 atm Figure χ as functions of operation temperature and pressure in (a) M01-A and (b) M01-B xii
15 Figure Effect of α H2/ and P m,h2 on χ (WHSV of 7,500 h -1, R H2O/ of 3.5, the reaction pressure of 2 atm, P p of 1 atm, and F N2 of 20 cm 3 /min): (a) 400 o C, (b) 450 o C, (c) 500 o C, and (d) 550 o C Figure Effect of H 2 permeance on χ under WHSV of 7,500 h -1, R H2O/ of 3.5, the reaction pressure of 2 atm, P p of 1 atm, and F N2 of 20 cm 3 /min Figure Effect of reaction pressure and catalyst load on χ at various temperatures in M01-A (WHSV = 7,500 h -1, R H2O/ = 3.5, the reaction pressure of 2 atm, P p of 1 atm, and F N2 of 20 cm 3 /min): (a) 400 o C, (b) 450 o C, (c) 500 o C, and (d) 550 o C Figure Effect of the catalyst load on χ for M01-A under WHSV of 7,500 h -1, R H2O/ of 3.5, reaction pressure of 2 atm, P p of 1 atm and F N2 of 20 cm 3 /min Figure Effect of feed R H2O/ on χ for M01-A at WHSV of 7,500 h -1, the reaction pressure of 2 atm, P p of 1 atm and F N2 of 20 cm 3 /min under different temperatures: (a) 450 o C and (b) 500 o C120 Figure Effect of N 2 sweeping flow rate on χ under WHSV of 7,500 h -1, R H2O/ of 3.5, the reaction pressure of 2 atm, and the P p of 1 atm Figure Simulated χ for M01-B as a function of catalyst load at 550 o C and three different reaction pressures (R H2O/ =5.0 and WHSV=7,500 h -1 ) xiii
16 List of Tables Table 2. 1 Sample numbers and synthesis conditions Table 2. 2 Results of BET measurements for zeolite particles synthesized by in-situ method Table 2. 3 Sample numbers and synthesis conditions Table 2. 4 Results of BET measurements for zeolite particles synthesized by secondary growth Table 2. 5 Sample numbers and synthesis conditions Table 2. 6 H 2 selectivity and permeance for MFI zeolite membranes Table 2. 7 Membrane properties for M01-A and M01-B before and after CCD modification Table 3. 1 Basic properties of the Ce/Fe high temperature WGS catalyst [139] Table 3. 2 WGS membrane reaction conditions Table 3. 3 H 2 selectivity and permeance for M01-A measured at 500 o C and different points Table 3. 4 H 2 selectivity and permeance for M01-B measured at 500 o C and different points Table 4. 1 WGS membrane reaction conditions used in the experiment and the simulation Table 4. 2 permeation properties for the zeolite membrane at 500 o C Table 4. 3 Comparison between experimental and simulation results by PFR and CSTR models* xiv
17 Chapter 1 Introduction and Literature Review 1.1 Introduction Hydrogen Production and WGS Membrane Reaction Hydrogen is a clean energy carrier which can be used for future transportation and stationary power generation. [1] The growing challenges imposed by accelerated consumption of oil reserves and the increasing concerns on fossil fuel related environmental problems have led to the proposed concept of hydrogen economy. [2] It was reported that hydrogen production will need to increase by several orders of magnitude from today s level in order to support the proposed hydrogen economy. [3] Currently, the annual production of hydrogen is around 30 trillion standard cubic feet (SCF) of which more than 90% is generated from fossil fuels, mainly by steam reforming of natural gas and coal gasification followed by water gas shift reactions. [2] Although industrial production of hydrogen from fossil fuels has been well established, the current technologies are very costly for the production of high purity hydrogen at the envisioned massive scale. This has motivated worldwide efforts in improving efficiencies of H 2 production, minimizing cost and harnessing renewable sources for H 2 production. [4] The choice of the H 2 production method relies on the production cost and local source availability. Coal is the most abundant fossil fuel in the world and might last for centuries based on current usage rates. [5-7] The high rate of greenhouse gas emissions associated with current combustion-based use of coal leads to major concerns of worsening climate changes. Alternative clean-coal technologies have being sought to reduce emission from coal firing power plants. Coal gasification with subsequent water gas shift reactions is the main technology for coal-to-hydrogen conversion. H 2 production involves natural gas 1
18 steam reforming or coal gasification to produce syngas, which consists of hydrogen and carbon monoxide () and impurities. The syngas generation is carried out by the following high temperature chemical reactions: Steam-methane reforming: CH 4 + H 2O + 3H 2 (1.1) Coal gasification: C + H2O + H2 (1.2) In conventional industrial processes, subsequent gas separations are needed to obtain hydrogen of high purity for down streams applications. Since the 1980s, most hydrogen plants recover and purify hydrogen to purity levels above 99.9%. [8] Conventional industrial technologies for H 2 purification include pressure swing adsorption (PSA), [9] cryogenic fractionation, and dense metallic membrane permeation. [10] PSA and fractional/cryogenic distillation systems are in commercial operation and can be economically justified when the H 2 is used to produce high value chemicals. However, these existing commercial methods are not cost-effective for producing H 2 as fuel to compete against petrol fuels on per gallon-equivalent basis. Therefore, innovative separation technologies with higher efficiency and lower cost need to be developed for production of H 2 at an unprecedented vast scale. To date, substantial efforts have been made to develop H 2 -permselective membranes, particularly inorganic membranes, for H 2 separation from various reaction product streams. [2,11] Inorganic membranes generally possess high thermal resistance and mechanical strength allowing high temperature and high pressure operations. [12,13] Therefore, inorganic membranes have the potential to work directly with the gas reformer or catalytic reactors without the energy consuming cooling and re-heating processes. The membrane separation may thus lead to substantial simplifications of the process and reduction of energy consumption for H 2 2
19 production. [10] After gasification, the in the syngas is subsequently converted to 2 and H 2 generating more H 2 via water gas shift (WGS) reaction: WGS: + H 2O 2 + H 2 (1.3) The WGS reaction is an equilibrium-limited reaction, and conversion is favored at lower temperatures due to its exothermic nature. In current industrial processes, the WGS conversion is carried out in two reactors of different reaction temperatures: a high temperature reactor operating between 350 and 500 o C for large throughput (fast reaction), and a low temperature reactor operating at o C for high conversion. [4] After the high temperature reaction, an outlet stream with a concentration between 1 and 5% is typically obtained and the concentration is reduced to less than 0.5% after the low temperature reaction step. Further reduction of and 2 to acceptable levels for PEMFC and other applications requires more rigorous H 2 clean-up processes. A concentration of <2 ppm is required for the Pt catalyst in PEMFC. [14,15] The multistage WGS reaction systems together with the necessary post-reaction 2 separation processes are energy intensive and economically disadvantageous. The search for high temperature H 2 separation membranes has also been driven by the idea to develop WGS membrane reactors (MR) for hydrogen production. [16,17] The principle of WGS membrane reaction is shown in Figure 1.1. The primary benefits offered by a MR generally include (1) enhancing the conversion rate and yield for reactions that are subjected to thermodynamic equilibrium limitations and (2) simultaneously achieving reaction and product separation in one unit. A WGS MR operates by 3
20 selectively extracting H 2 product from the catalyst bed through a H 2 permselective membrane that overcomes the WGS thermodynamic equilibrium barrier. Therefore, it is possible to achieve complete conversion by a single-stage operation in a MR under the thermodynamically unfavorable but kinetically favorable high temperature condition. [18-20] Furthermore, high pressure operation has a positive effect on the conversion in the MR because the pressurization facilitates the H 2 permeation through the membrane. [21] Feed: + H 2 O Catalyst Bed Catalyst bed + H 2 O H Retentate: 2 Membrane Membrane H 2 Permeate:H 2 Figure 1. 1 Schematic showing the principle of operation of the WGS MR. Many inorganic membranes have been considered as candidates for WGS MR applications in high temperature conditions. The dense palladium (Pd) alloy membranes and the microporous amorphous silica and zeolite membranes have been in the center of recent research and development for high temperature H 2 separation. The Pd-based membranes offer nearly perfect H 2 selectivity and reasonable permeance at high temperature but are easily poisoned by sulfur compounds and having embrittlement issues in water vapor at high temperatures. [22-24] The amorphous molecular sieve silica membranes offer both good selectivity and high permeance for hydrogen separation but they suffer serious material instability in hydrothermal conditions where the silanol condensation reactions are thermodynamically favored. The highly siliceous zeolite membranes are attracting growing interest because they are 4
21 hydrothermally stable and intrinsically resistant to sulfur compounds due to the crystalline structure that make them potentially useful for WGS MR. The highly siliceous MFI-type zeolite membranes, including the aluminum-free silicalite and high Si/Al ratio ZSM-5 membranes, because of the ease of membrane synthesis and extraordinary thermal and chemical stabilities. However, there is a major challenge for MFI zeolite membranes that is the relatively large pore size (diameter of 0.56 nm) which provides only limited H 2 selectivity over 2 and Objective of Dissertation Research The goal of this research is to develop modified MFI-type zeolite membrane reactors for WGS reaction at high temperature of >400 o C and elevated pressures of 2 to 6 atm for enhancing -conversion. The specific technical objectives of this research include (1) to synthesize MFI-type zeolite membranes by in-situ crystallization and seeded secondary growth methods, (2) to modify the pore size of the MFI-type zeolite membranes by the on-stream catalytic cracking deposition (CCD) method for high H 2 selectivity with high permeance at >400 o C, (3) to investigate the modified zeolite membranes for high temperature high pressure WGS reactions, and (4) to performing MR modeling work for further understanding the relationships between the WGS MR performance and the membrane quality and operation conditions Dissertation Arrangement Chapter 1 (this Chapter) includes introductions to the background of this research and the main objectives of this dissertation. A literature review regarding the current status of research and development in inorganic membranes and membrane reactors is presented, particularly on zeolite 5
22 membranes. Chapter 2 reports the synthesis and characterization of MFI zeolite powders and membranes. MFI type zeolite powders were synthesized by in-situ crystallization and seeded secondary growth methods. The morphology, microstructure, and the crystalline orientation of the membranes are characterized by SEM, XRD, and BET techniques. After hydrothermal synthesis, the zeolite channels of the MFI-type zeolite membrane were modified by the CCD method to improve the performance in high temperature separation of H 2 from other small molecule gases such as 2, CH 4,, and N 2, etc. In chapter 3, a water gas shift (WGS) membrane reactor system was constructed using the modified zeolite disc membranes. The zeolite membrane reactor is combined with a high temperature Fe/Ce WGS catalyst. The membrane reactor has been tested for WGS reaction in a pressure range of 2 6 atm and in a temperature range of o C. The zeolite membrane reactor has obtained -conversion ( χ ) well above that obtained in the traditional packed-bed reactor and it significantly exceeded the thermodynamic limit at >500 o C. In chapter 4, the simulation of the modified zeolite membrane reactor for WGS reaction is carried out using a simple one-dimensional, isothermal model developed in this work. The model utilizes the gas permeation properties of the modified MFI zeolite membrane and the apparent kinetic parameters determined for the high temperature Fe/Ce catalyst in the same reactor. The effects of the operational conditions, such as pressure, temperature, steam-to- ratio, weight hourly space velocity, sweeping gas flow rate, and catalyst loading, and membrane quality (i.e. the H 2 -selectivity and permeance) on the MR performance, were extensively examined. Chapter 5 presents a brief summary of the dissertation work. 6

23 1.2 Literature Review Zeolites and Zeolite Membranes Zeolites are microporous crystalline aluminosilicates, composed of TO 4 tetrahedra (T = Si, Al) with O atoms connecting neighboring tetrahedra. The tetrahedra are linked to each other by shared oxygen atoms, to give cavities or cages, forming openings with defined size and shape. [25] For a completely siliceous structure the framework is electrically neutral with no extraframework ion compensators. When aluminum ions are incorporated into the silica framework, the substitution of the Si 4+ by the Al 3+ makes the framework negatively charged that requires the presence of extraframework cations within the structure to keep the overall electrical neutrality. The cations are mobile and can be exchanged. There are over 170 distinct zeolite structures that have been identified so far. Some typical pore structures and pore sizes are illustrated in Figure 1.2. Figure 1. 2 Pore size and Si/Al ratios of some commonly used zeolites [13] 7
24 The supported polycrystalline zeolite membranes offer great potential for energy efficient separation of gas and liquid mixtures. [26] Common membrane supports include macroporous and mesoporous ceramic, stainless steel, glass plates and tubes. [4,27-29] The supports are normally in the disc or tubular shape and provide mechanical strength for zeolite membranes. In the past 3 decades, various types of zeolite membranes have been synthesized and tested for various molecular separations, [30-33] for example the MFI, [34] FAU, [35] MOR, [36,37] FER, [38] SAPO-34, [39] P zeolite, [40] zeolite T, [41,42] BEA [43] and mesoporous UTD-1. [44] The pore sizes of the 8-member ring LTA, 10-member ring MFI, and 12-member ring FAU are about 0.41, 0.56, and 0.74 nm, respectively. These three types of zeolite membranes are probably the most extensively studied structures because their pore sizes are suitable for accommodating a large number of molecules important to the chemical and energy industry. Zeolite membranes are commonly synthesized by hydrothermal treatment of the substrate surfaces in liquid phase aluminosilicate precursors. The precursor can be in the form of clear solution, sol or gel depending on the chemical composition. The crystallization of zeolites and the resultant crystal structure are sensitive to the precursor composition, the use of structure directing agents (SDA), the specific route of precursor preparation, and the synthesis temperature and duration. Undesirable impurity crystal phases may be present in the zeolite films especially when synthesizing from precursors of low Si/Al ratios. The impurity crystals can affect the membrane morphology, integrity, and structural and chemical stability. SDAs are often employed to direct crystal structure and facilitate the crystallization process. [45] The general process for synthesis of polycrystalline zeolite membranes on porous substrates is schematically depicted in Figure 1.3. In an in-situ crystallization process, zeolite nuclei form on the surface either by heterogeneous nucleation or by deposition of nuclei generated in the bulk solution. In 8


25 the seeded secondary growth method, the zeolite seed layer, frequently consisting of submicron zeolite crystals, is pre-coated using separately synthesized zeolite suspensions. The discrete layer of nuclei or seed crystals is subsequently evolving into a continuous film by crystal growth in a synthesis solution. The final zeolite membrane consists of inter-grown crystals with minimized intercrystalline spaces. The intercrystalline spaces are considered as microdefects because they are larger than the zeolitic pores and can cause significant decrease in molecular separation selectivity. Furthermore, when a SDA is used, the intercrystalline spaces may be created or enlarged due to changes in lattice parameters associated with the removal of template from the zeolite cavities. [46] (a) (b) Figure 1. 3 Schematic depiction of the zeolite membrane formation on a porous substrate, (a) nucleation on surface and (b) crystal growth into continuous polycrystalline membrane [21] The chemical and structural stability of the membrane is another important aspect in high temperature environments containing water vapor, acidic compounds and other corrosive impurities, which are often encountered in practical applications like WGS reaction. The Si/Al ratio is an important characteristic of zeolite materials. The amount of Al within the framework can vary over a wide range to give Si/Al from 1 to. The thermal stability of zeolite structure increases with increasing the Si/Al ratio in the framework. The all-silica MFI zeolite is by far the most stable structure with thermal stability up to 9
26 1000 o C in gases containing sulfuric acid vapors. [47] Zeolites with low Si/Al ratios in the framework are generally not suitable for use in high temperature moist atmosphere because of their long-term instability. The surface properties of zeolites can be adjusted by varying the Si/Al ratio and types of extra framework alkali cations. More cations are required to balance the framework charge as the Si/Al ratio decreases. As the Si/Al ratio of the framework increases, the hydrothermal stability as well as the hydrophobicity increases. However, the catalytic activity and the ion-exchange capacity decrease as the Si/Al ratio increases. In-situ Synthesis: In the past decades, much efforts have been directed toward developing advanced synthesis techniques, such as in-situ crystallization, [48] and seeded secondary growth [49] for fabricating good quality zeolite membranes. In-situ crystallization is commonly used for the preparation of MFI [50,51] and ZSM-5 membranes. [52] In this method, a membrane support is brought in direct contact with the synthesis mixture in the absence or presence of SDAs under controlled hydrothermal conditions in order to nucleate and grow a continuous zeolite film on the support surface. During the synthesis, a suitable support is placed in a Teflon cup and a precursor solution or gel is poured into the cup, which is installed in an autoclave for the hydrothermal reaction. Then, the zeolite film is grown on the support under hydrothermal conditions via four possible processes [53] : (1) nucleation and growth occurring in the bulk solution, followed by seed crystal deposition on the support surface; (2) nucleation occurring in the bulk solution followed by seed attachment and growth on the support surface; (3) direct nucleation on the support surface followed by growth; (4) formation of a gel layer on the support surface, followed by nucleation and growth in the gel. 10
27 The in-situ crystallization method has the advantage of simplicity in the synthesis process and does not include an extra step for coating the seed layer as needed in the secondary growth approach. Many experimental parameters, such as the synthesis temperature, synthesis time, the number of hydrothermal treatment cycles, the synthesis mixture composition and ph value, support material, support orientation and even how synthesis mixture is brought in contact with the support surface can affect the quality of the final zeolite membranes and should be carefully controlled. [13] Therefore, making good quality zeolite membranes by in-situ crystallization method requires many trials to optimize synthesis conditions. The calcination step should also be carefully controlled because intercrystalline gaps, which impair the separation properties of zeolite membranes, have the tendency to form during calcination step due to thermal stress produced by the difference in thermal expansion coefficients between the zeolite film and the support. [46] Also, multiple times of hydrothermal synthesis may be needed to minimize microdefects in the polycrystalline structure which significantly increases the consumption of expensive chemicals, manufacturing time, and operation cost. Moreover, when directly growing zeolite membranes by in-situ crystallization, the membrane quality is affected by the substrate properties. Substrate materials that lack active nucleation sites may result in poor coverage of the membrane [10,40] and the substrate surface defects such as roughness and pinholes may propagate through the membrane and lower the separation selectivity. Secondary Growth Synthesis: The seeded secondary growth method has been used for the preparation of various types of zeolite membranes, such as ZSM-5, silicalite-1, NaA, FAU, and ZSM-48. [54-59] The seeded secondary growth method includes two steps: (i) seed layer coating and (ii) the seed 11
28 crystal growth to form continuous polycrystalline films. Small sub-micron zeolite seed crystals are first synthesized and deposited on a porous support. The seed layer then grows into a continuous zeolite film in a fresh synthesis mixture under hydrothermal conditions. Many techniques have been developed for depositing the seeds on the substrate surface, such as surface modification combined with electrostatic attraction, [48,60,61] vacuum seeding, [57,62] and dip-coating. [63] The simple dip-coating technique has been widely used in synthesis of zeolite membranes. [64-66] The seeded secondary growth method has several advantages over the in-situ synthesis route. First, by applying a seed layer, which is frequently composed of zeolite nanocrystals, the influence of the base substrate can be eliminated to allow for much better reproducibility and control of the final membrane quality. Second, by controlling the orientation of the crystals in the seed layer, the precursor chemistry, and the synthesis conditions, the crystal orientation of the resultant zeolite membrane can be controlled to enhance mass transport efficiency and/or shape selectivity. [49,67] Third, because of the ability of the seed crystals to define the crystal structure of the subsequently grown zeolite film, some zeolite membranes (e.g. MFI type) that require SDA to synthesis may be obtained from template free precursors. The template-free synthesis not only reduces the consumption of expensive SDA but also avoids the template removal step, which may enlarge the undesirable nano-scale intercrystalline boundaries. [46,63,68] Therefore, template-free seeded secondary growth is highly promising for developing zeolite membranes with better separation properties as compared to those prepared by the in-situ crystallization and template seeded secondary growth methods. 12
29 1.2.2 Zeolite membrane reactors In the last three decades, membrane reactors (MR) has been studied worldwide, which is summarized in several articles. [69-89] A MR is an engineering apparatus that selectively removes a product from or introduces a reactant into the reaction system for achieving better performance than a traditional reactor (TR). H 2 -permselective membranes have been actively sought for MR which has the potential to simultaneously perform a reaction and a separation in a single stage operation. [90,91] A MR has the following advantages over a TR: (1) MR can enhance the conversion of equilibrium-limited reactions as well as the hydrogen yield and hydrogen selectivity, (2) MR can achieve the same performance attained in the TR at milder operating conditions or, instead, better performance at the same operating conditions as in the TR. (3) MR can reduce capital costs due to the combination of reaction and separation in only one system, i.e. multi-functionalizing and process intensification. To date, the development of WGS MR have been largely concentrated on the dense Pd-alloy membranes [92-100] and the microporous amorphous silica-based microporous membranes. [10,101] The Pd-alloy membranes have perfect H 2 selectivity to produce nearly pure H 2 on the permeate side but the membranes have issues of sulfur poisoning, hydrothermal embrittlement and prohibitive costs. [8,23,102] The Pd membranes can be adversely affected by H 2 S, even at lower ppm concentration levels. Exposure of the Pd membrane to H 2 S has been shown to not only reduce the permeability, but to also result in the formation of an irreversible grey surface scale of palladium sulfide or crack. [69,103,104] The amorphous silica-based membranes have good H 2 selectivity and high permeance but the well-known instability of amorphous silica membranes in hydrothermal conditions still remains a challenge. [21, ] 13
30 In these days, zeolite membranes are considered promising candidates for WGS MR. Due to their crystalline structure, zeolite membranes have well-defined, uniform pore systems of molecular dimensions. The MFI-type zeolite membranes of high silica content, i.e. silicalite and ZSM-5 with high Si/Al ratio, are hydrothermally stable and intrinsically resistant to sulfur compounds due to the crystalline structure that make them potentially useful for WGS MR. [2,26, ] The practical application of zeolite MR for WGS reaction depends on the ability to fabricate zeolite membranes with high selectivity, high permeance, good hydrothermal stability, strong chemical resistance against impurities, and low cost. [110,111] Brunetti et al. calculated the ratio of the required catalyst volume of an MR and a TR as a function of feed pressure. [103] It was found that the ratio of the catalyst volume decreased with increasing feed pressure that reduces the cost. For example, the MR reactor volume was only 25% of TR reactor volume at a feed pressure of 15 atm when conversion was 80%. Because of its thermal resistance and mechanical strength, the MFI-type zeolite membranes can be operated at high temperature and high pressure. [12,13] Therefore, high-pressure operation with the MFI-type zeolite MR may drastically reduce the catalyst amount leading to significant cost reduction. 14
31 Chapter 2 Synthesis and Modification of MFI-Type Zeolite Membranes MFI type zeolite membranes are often prepared in hydrothermal conditions by either in-situ crystallization or secondary growth of pre-coated MFI zeolite seed layers. [34,65, ] Organic agents, commonly tetrapropylammonium hydroxide (TPAOH) or tetrapropylammonium bromide (TPABr), are used to direct the MFI crystal structure and facilitate crystallization. [40, ] In order to remove organic template and free up the zeolite micropores, a step of calcination in air at >450 o C is needed after the membrane synthesis. The calcination process should be carefully controlled because intercrystalline spaces, which impair the separation properties of zeolite membranes, have the tendency to form during calcination due to the difference in thermal expansion coefficients between the zeolite film and the support. The in-situ crystallization method has the advantage of simplicity due to its not requiring an extra step for coating the seed layer as needed in the secondary growth approach. However, in order to minimize microdefects in the polycrystalline structure, multiple times of hydrothermal synthesis may be needed that can significantly increase the consumption of expensive chemicals and manufacturing time. Figure 2.1 presents the topological structure of the zeolite framework and pore openings in different directions. Figure 2. 1 Topological structures of the 10-member ring MFI zeolite pore openings. 15
32 The seeded secondary growth method has several unique advantages over the in-situ synthesis route: (1) MFI membranes can be obtained from precursors without SDA because the seed crystals define the crystal structure of the subsequently grown zeolite film. The template-free synthesis not only reduces the use of expensive SDA but also avoids the template removal step, which may enlarge the undesirable nanometer scale intercrystalline boundaries. (2) The influence of the base substrate can be eliminated to allow much better reproducibility and control of the final membrane quality due to a seed layer, which is often composed of zeolite nanocrystals. [63,67] (3) By controlling the orientation of the crystals in the seed layer, the precursor chemistry, and the synthesis conditions, the crystal orientation of the resultant zeolite membrane can be controlled to enhance mass transport efficiency and/or shape selectivity. [67,118,120] The synthesis of the MFI-type zeolite powders was conducted by in-situ crystallization and seeded secondary growth methods using conventional heating (CH) and microwave heating (MH) techniques. The following three factors were investigated firstly on zeolite powder synthesis; (1) the influence of heating sources (CH and MH), (2) the usage of template tetrapropylammonium (TPAOH), (3) the aluminum content on the MFI zeolite microstructure. 2.1 Experimental section Synthesis of MFI-Type Zeolite Powders The chemicals used in this work included fumed silica powders (99.8%, Aldrich), tetraethylorthosilicate (TEOS, 98%, Acros), tetrapropylam monium hydroxide (TPAOH, 1M solution, 16
33 Aldrich), aluminum sulfate (Al 2 (SO 4 ) 3 18H 2 O, >98%, Aldrich), and sodium hydroxide (99.998%, pellet, Aldrich). For conventional heating, a temperature-programmable box oven was used. For microwave heating, a MARS-5 microwave synthesis oven (CEM Corp.) was used. The MARS-5 had a maximum full power of 1600 W by IEC microwave at 2.45 GHz. The turntable in the oven chamber accommodates 14 cylindrical Teflon vessels (I.D. of 32 mm and depth of 10 cm) mounted vertically and symmetrically to receive uniform irradiation under rotation. In all synthesis experiments, a full MW power of 400 W was used for the temperature ramping period and a full MW power of 240 W was used for holding the set temperature during the period of hydrothermal reaction. [121] The zeolite powders were characterized by SEM, XRD and BET, respectively. In BET measurements, N 2 physisorption and desorption was performed at 77K by a microporosimeter (Micromeritics ASAP 2020). The surface area, pore volume, and pore size distribution of the corresponding zeolite powders synthesized by various conditions were examined. A. Zeolite Powder Synthesis by In-situ Crystallization: The procedure for in-situ synthesis of the MFI zeolite powder is given below: (1) Prepare precursor (Si/Al= ) by mixing 0.2g NaOH + 15 ml TPAOH (1M solution) + 75 ml DI water under vigorous stirring at 80 C in a water bath until a clear solution is obtained. (add 0.22g Al 2 (SO 4 ) 3 18H 2 O for Si/Al=111) (2) Add 14 ml TEOS drop by drop to get a silica sol. (4) Keep stirring for 3~4 h. 17
34 (5) Pour the precursor into a Teflon cup and place it in a stainless steel autoclave. (7) Close the autoclave and place it in the synthesis oven which is pre-heated to 180 C. (8) Perform hydrothermal reaction for 10 h by conventional heating. (4 h by microwave heating) (9) Quench in water to room temperature and recover the zeolites in the fume hood. (10) Wash the powers with DI water and dry in oven. B. Zeolite Powder Synthesis by Secondary Growth: The procedure for secondary growth synthesis of the MFI zeolite powder is as follows: (1) Prepare precursor (Si/Al= ) by mixing 1.9g NaOH ml DI water under vigorous stirring at 80 C in a water bath until a clear solution is obtained; add 0.25g Al 2 (SO 4 ) 3 18H 2 O obtain a Si/Al ratio of 111) (2) Add 5g SiO 2 into the solution under slow stirring to get a silica sol. (3) Add 8~10 drops of seed suspension (40 wt%) into the solution. (4) Keep stirring for 3~4 h. (5) Put the Teflon flask in an ultrasonic bath for 30min to achieve uniform dispersion. (6) Transfer the precursor into a Teflon cup and place it into a stainless steel autoclave. (7) Close the autoclave and place it in the synthesis oven which is pre-heated to 180 C. (8) Perform hydrothermal reaction for 10 h by conventional heating. (4 h by microwave heating) (9) Quench to room temperature and recover zeolite particles in the fume hood. (10) Wash the powers with DI water and dry in oven. 18
35 The powders were prepared by both CH and MH methods. The hydrothermal synthesis temperature and duration were varied in order to identify proper condition for zeolite synthesis Synthesis of MFI-Type Zeolite Membranes Based on the zeolite powder synthesis methods, the synthesis of MFI-type zeolite membranes by in-situ crystallization and seeded secondary growth method using conventional heating techniques were studied. The following influencing factors were studied: (1) the usage of template, (2) the silica sources (i.e. fumed silica and TEOS). The membrane substrates used in this study were home-made porous α-alumina discs (2mm-thick and 25mm in diameter) prepared from α-alumina powders (SG-16, Almatis) by dry pressing and sintering process. The porosity and mean pore size of the substrates were about ~30% and 0.07~0.1µm, respectively. The substrates were polished with #600 SiC sandpapers. After being cleaned in an ultrasonic bath and dried, the sides and edges of the polished discs were sealed with glass coatings. The active membrane area was 2.54 cm 2 after sealing the edges of the disc. 1) Membrane Synthesis by In-situ Crystallization The procedure for conventional in-situ synthesis of the MFI zeolite membrane is similar to that reported literature [112,122] : (1) Prepare precursor by mixing 0.42g NaOH + 6g SiO ml TPAOH (1M) + 3ml DI water under vigorous stirring at 80 C until a clear solution is obtained. (0.09g NaOH ml TEOS ml TPAOH (1M) ml DI water when TEOS is used as a silica source) (2) Place the final solution for 4 h at room temperature. 19
36 (3) Filtrate the solution with 0.8 um Millipore filter to remove any particulate impurities. (4) Place the disc substrate horizontally at the bottom of the autoclave with the polished side facing upward; and transferring the precursor solution into the autoclave. (5) Perform hydrothermal reaction at 180 C for 4 h. (150 C for 17 h when TEOS is used.) (6) Quench to room temperature in water and recover the disc from reactor in fume hood. (7) Wash the synthesized membranes with DI water and then immerse it in DI water for 24 h; dry the membrane at 40 o C for overnight. (8) Calcine the membranes in air at 550 C for 6 h with heating rate of 0.3 C/min and cooling rate of 0.5 C/min. 2) Membrane Synthesis by Seeded Secondary Growth The seeded secondary growth synthesis process includes two steps: first, coating silicalite nanoparticle seeds on the substrate by dip-coating; and second, seed growth to form dense continuous membranes by hydrothermal treatment using conventional heating or microwave heating. Synthesis of Silicalite Nanoparticles: The silicalite nanoparticle seeds were prepared by CH or MH methods. The precursor solution had a molar ratio of 0.33(SiO 2 ): 0.1(TPAOH): 0.035(NaOH): 5.56(H 2 O). The precursor was aged at room temperature for 4 h before hydrothermal treatment. The hydrothermal synthesis temperature and duration were varied in order to identify proper conditions for producing silicalite particles with uniform size smaller than 100nm. The size of the silicalite nanoparticles was determined by SEM observations. 20
37 Zeolite Seed Layer Coating: The silicalite nanoparticles were dispersed in DI water and peptized by 1M HNO 3 solution. Hydroxylpropyl cellulose (HPC, Mw=100,000, Aldrich) was used as a binder as well as a suspension viscosity controller. The final stable colloidal silicalite suspension had a ph of 3~4 and contained 0.5wt% of silicalite dry particles and 0.1wt% of HPC. The silicalite nanoparticle seed layer was coated on the polished side of the disc substrate by dip-coating technique performed in a bench-top clean box. The contacting time of the dip-coating process was 5 s. After dip-coating, the disc was dried at 40 o C for 24 h in an oven under a controlled relative humidity of 60%. The seed layer coated disc was then calcined in air at 450 o C for 8 h with heating and cooling rates of 0.5 o C/min. The dip-coating process was repeated once to eliminate possible defects. Secondary Growth Synthesis: The method used for secondary growth membrane synthesis using fumed silica-derived precursor is similar to that previously developed in our group. [121] The precursor solution for secondary growth was prepared in a Teflon beaker by dissolving fumed silica and aluminum sulfate hydrate in a NaOH solution at 80 o C under rigorous stirring. The precursor solution, which contained no template or alcohol, was visually clear with a Si/Al ratio of 111. After aging for 4h at room temperature, the precursor was transferred into the Teflon lined synthesis vessels. The seeded alumina disc was placed vertically at the bottom of the vessel and completely immersed in the synthesis solution about 1 cm below the liquid surface. The complete procedure for membrane preparation is as following: (1) Prepare precursor by mixing 1.535g NaOH g Al 2 (SO 4 ) 3 18H 2 O + 10g SiO ml DI water under vigorous stirring at 80 C to get a viscous silica sol. (2) Cool down to room temperature under stirring (~1.5 h) 21
38 (3) Put the Teflon flask in an ultrasonic bath and ultrasonicate for 30min. (4) Put the calcined samples on the bottom of Teflon cup in a stainless steel autoclave with the silicalite-seeded side upwards, (5) Gently transfer the precursor solution into the autoclave and put it in an oven at 180 ºC for 4 h. (5) After cooling down to room temperature, take out the membrane samples, wash with water for 10min, then dry them at 40ºC Modification of MFI-Type Zeolite Membranes Hydrogen selectivity through microporous membranes at high temperatures, where adsorption is negligible, relies primarily on size exclusion effect and diffusivity difference. [31] The pore size needs to be close to the molecular size of hydrogen (2.9 Å) in order to achieve high H 2 -selectivity over slightly larger molecules like 2 and CH 4. The MFI zeolite pore size is much bigger than the kinetic sizes of the molecules involved in the coal-gasification and WGS reaction systems. At high temperature, gases such as H 2, 2, and permeate through the MFI zeolite membranes by gaseous diffusion mechanism which results in low H 2 selectivity of around Knudsen factors. In order to enhance the H 2 selectivity, various surface modification techniques have been developed by a number of research groups. [2,123] Masuda et al. [123] reported catalytic cracking of silane in the zeolite channels to modify the effective pore size of MFI zeolite membranes. The modification was done by pre-loading methyldiethoxysilane (MDES) in the MFI zeolite pores followed by a calcination step to decompose MDES and deposit mono silica inside the zeolite channels. After modification, the H 2 /N 2 separation factor at 383 K increased from 1.5~4.5 to 90~140, but the permeation through the modified 22
39 membrane decreased to mol/m 2.s.Pa which is 10% of its original value. Hong et al. [124] modified boron-substituted ZSM-5 (B-ZSM-5) by thermal decomposition of pre-loaded MDES. Higher hydrogen selectivity was achieved for separation of H 2 / 2 and H 2 /N 2 but the hydrogen permeance was also found to be decreased an order of magnitude. The dramatic loss of H 2 permeance was attributed to the deposition of excessive silica due to fully loaded MDES precursor that caused the whole channel length to be reduced in size. The studies from both groups [123,124] on the modifications of MFI-type zeolite membranes showed the potential for tuning the pore size to enhance H 2 separation from small gases at high temperatures. However, the modification process must be better controlled to avoid excessive deposition that causes unacceptable loss in gas permeability. In this work, we use an on-stream MDES vapor deposition approach to modify α-alumina supported MFI membranes during the permeation of H 2 / 2 gas mixture at 450 o C. This membrane modification method was recently developed in our group. [125] The membrane modification effect is continuously monitored through online measurement of H 2 / 2 separation results. This allows effective control of the modification process. By the real-time monitored on-stream modification process, excessive silica deposition can be avoided while successfully reducing the effective zeolitic pore size. The avoidance of excessive silica deposition relies on the limited number of active sites in the zeolite channels where MDES molecules can be catalytically decomposed to deposit mono silica species at a temperature low enough to avoid non-catalytic thermal decomposition of MDES. [31] The MFI-type zeolite membranes were synthesized on home-made porous α-alumina discs by in-situ hydrothermal crystallization (sample M01) and secondary growth method (sample M03), respectively. Figure 2.2 shows the schematic diagram of membrane permeation system used for both gas separation 23
40 and membrane modification experiments. A disc-shaped zeolite membrane was mounted in a stainless steel module. The membrane was sealed in the cell with soft graphite gaskets. The membrane module was placed in a temperature-programmable furnace. The feed and sweep gas flow rates were controlled by mass flow controllers (Aalborg, GFC17). Vent MDES Membrane Graphite gasket 3-Way valves To GC H 2 2 He Gas cylinders Mass flowrate controllers Furnace (Membrane cell) Figure 2. 2 Schematic diagram of membrane separation and modification apparatus [125] The permeate products were analyzed by online gas chromatography (Agilent, 6890N) equipped with a thermal conductivity detector (TCD) and a Hayesep DB packed column (Alltech). The permeate gas during the CCD modification process was also examined by the online GC-mass spectrometer (MS, Agilent, 5975B). The feed flow rates of H 2 and 2 were both 10 cm 3 /min giving a total feed flow rate of 20 cm 3 /min and the helium sweep gas flow rate was 20 cm 3 /min. During membrane modification, the equimolar H 2 / 2 mixture was saturated by MDES (96%, Aldrich) vapor at 23 o C before introduced into the membrane cell. The modification process started with permeation of the equimolar H 2 / 2 dry gas mixture at room temperature (23 o C) for 90 min. Then, the temperature was raised at a rate of 0.5 o C/min to 450 o C where 24
41 the separation was stabilized for 150 min. The temperature was held at 450 o C afterwards, and the H 2 / 2 feed stream was switched to flow through the silane saturator. The dynamic size of the MDES molecule is 0.4nm 0.9nm, which can enter the zeolite pores (diameter ~0.56nm) because of the molecule s linear shape. The feed gas was switched back to dry feeding route to end the modification when the H 2 / 2 separation factor plateaued. 2.2 Results and Discussion Synthesis of MFI-Type Zeolite Powders Table 2.1 presents the zeolite powders synthesized by in-situ crystallization under various conditions to investigate the effects of heating method (CH and MH), aluminum content, and synthesis duration on particle properties. Table 2. 1 Sample numbers and synthesis conditions Sample number Silica source Template Si/Al ratio Heating method Synthesis temperature Synthesis duration P01 TEOS TPAOH 111 CH 180 o C 10 h P02 TEOS TPAOH 111 MH 180 o C 4 h P03 TEOS TPAOH CH 180 o C 10 h P04 TEOS TPAOH MH 180 o C 4 h A typical MFI zeolite crystal shape (sample P01) was obtained when TPAOH was used under CH as shown in Figure 2.3. In the literature, the effect of aluminum content on the membrane formation has been investigated. [126,127] The MFI crystals have been reported to grow faster when the synthesis 25
, well developed individual crystals were")


42 precursor contains aluminum. For the same precursor, when MH was used (sample P02), well developed individual crystals were also obtained. The crystals from Al-free precursors showed little different between CH and MH. But for the Al-containing precursor, the crystal size was larger and the surface was smoother for particles obtained by MH as compared to those synthesized under CH. For both precursors, the crystallization process was much faster under MH. The fast crystallization under MH was attributed to the more effective dissolution of gel particles under microwave irradiation and more uniform and rapid heating effect throughout the reactor volume. [128] P01 P02 P03 P04 Figure 2. 3 SEM images of zeolite powders synthesized by in-situ crystallization. 26
43 Table 2.2 presents the results of BET examinations for the MFI zeolite particles synthesized in different conditions. The test of each sample was repeated at least for once for the entire process from particle synthesis to BET measurement and the variations in BET surface area (S BET ), pore volume (V P ), median pore width (d p ) were within ±5%. The S BET, V P, and d p of all MFI zeolite samples were found to be in the normal ranges of literature values. [79, ] The results of powders obtained by MH were close to those obtained using CH. XRD characterization (Figure 2.4) confirmed that all samples obtained were of pure MFI-type zeolite phase without appreciable impurity crystal phases. Table 2. 2 Results of BET measurements for zeolite particles synthesized by in-situ method Sample number S BET (m 2 /g) V p (cm 3 /g) Median pore width (Å) P ± P ± P ± P ± P04 a.u. P03 P02 P theta Figure 2. 4 XRD patterns for (a) P01 (CH with Si/Al =111), (b) P02 (MH with Si/Al =111), (c) P03 (CH with Si/Al = ), and (d) P04 (MH with Si/Al = ). 27
44 In secondary growth, MFI-type zeolite powders were synthesized without organic templates. Table 2.3 presents the zeolite powders synthesized by seeded secondary growth under various conditions to investigate the effects of heating method (CH and MH), aluminum content, and synthesis duration. Table 2. 3 Sample numbers and synthesis conditions Sample number Silica source Template Si/Al ratio Heating method Synthesis temperature Synthesis duration NAOH Treatment P05 P06 P07 P08 P09 Fumed silica Fumed silica Fumed silica Fumed silica Fumed silica none 111 CH 180 o C 10 h none none 111 MH 180 o C 4 h none none CH 180 o C 10 h none none MH 180 o C 4 h none none 111 MH 180 o C 4 h 0.025M Figure 2.4 show the zeolite powders synthesized by secondary growth. Without the use of SDA, the zeolite crystals had little growth and the individual crystals were much smaller than those synthesized using SDA. It is expected that amorphous silica exists in the resultant zeolite samples, on surface or inside the crystals, when template is not used. A NaOH aqueous solution (0.025M) was used to treat sample P05. After sample P05 were washed with the NaOH aqueous solution (sample after washing is denoted as P09), the small particles, which are likely amorphous silica, disappeared and the BET surface area and pore volume increased (see Table 2.4). These suggest that amorphous phases present at the surface of and maybe inside the crystal. [66] 28


45 P05 P06 P07 P08 P09 Seed particles Figure 2. 5 SEM images of zeolite powders synthesized by secondary growth methods using template-free precursors. 29
46 Table 2.4 presents the results of BET examinations for sample P05~P09. All samples displayed lower pore volumes and smaller BET surface areas than the samples synthesized using template (sample P01~P04). Since there was no template in the synthesis solution, zeolite growth might be limited to silicalite seed crystals [128] and amorphous silica particles and deposition are likely to form. The S BET of silicalite-1 (sample P07 and P08) were lower than that of ZSM-5 (sample P05 and P06). This suggests that the particles obtained from the aluminum-free precursor did not crystallize effectively and the pore volume and micropore surface areas are mainly from the zeolite seeds. After the zeolite powder (sample P06) was treated with NaOH aqueous solution (samples P09), the S BET slightly increased, and pore volume also increased to the level of the zeolite synthesized with template. It is possible that the larger pore size and volume were created by dissolving amorphous silica or aluminosilicate from the mesopore defects in the crystals by the alkaline solution. Table 2. 4 Results of BET measurements for zeolite particles synthesized by secondary growth Sample number S BET (m 2 /g) Pore volume (cm 3 /g) Median pore width (Å) P ± P ± P ± P ± P ± Note: samples were dried at 350 o C for overnight; identical degassing process used (350 o C for 20 h) before BET measurements. XRD spectra of zeolite powders synthesized without templates (sample P05~P08) are shown in Figure 2.6. The XRD peak intensities and peak broadness of the zeolite powders indicate lower 30
47 crystallinity and/or smaller crystallite sizes than the zeolite samples synthesized with template. There were little differences in XRD peaks between CH and MH. The peaks of the powders treated with NaOH solution became stronger, indicating the removal of amorphous materials from the sample. Recent research has revealed that amorphous phases presenting at the boundary of the crystallites could be dissolved by NaOH-treatment. [59] P09 P08 a.u. P07 P06 P theta Figure 2. 6 XRD spectra of (a) P05 (CH with Si/Al =111), (b) P06 (MH with Si/Al =111), (c) P07 (CH with Si/Al = ), (d) P08 (MH with Si/Al = ), and P09 (MH with Si/Al =111) Synthesis of MFI-Type Zeolite Membranes 1) Membranes Synthesized by In-Situ Crystallization Table 2.5 presents the zeolite membranes synthesized by in-situ crystallization and secondary growth method. The effect of silica source on the quality of MFI zeolite membrane was observed for membranes obtained by in-situ crystallization approach. No aluminum was used in the in-situ growth membrane synthesis by CH methods. It was reported that the sources of silica and alumina could 31
48 influence the physico-chemical and catalytic properties of zeolite catalysts, which in this study can affect the CCD modification. [132] The nucleation and crystallization rates depend on the dissolution of the silica precursors. The synthesis of zeolite membrane using fumed silica was performed at 180 o C for 4 h while the membrane synthesis using TEOS was performed at 150 o C for 17 h. The reason of using such different conditions was because the thickness of zeolite membrane synthesized from TEOS-derived precursor was too thick when synthesizing at 180 o C for 4 h. Table 2. 5 Sample numbers and synthesis conditions Sample number Silica source Template Si/Al ratio Heating method Synthesis temperature Synthesis duration Method Treatment M01 Fumed silica TPAOH CH 180 o C 4 h In-situ M02 TEOS TPAOH CH 150 o C 17 h In-situ M03 Fumed silica None 111 CH 180 o C 4 h Secondary growth Figure 2.7 shows the surface and the cross-section SEM images of the zeolite membranes obtained by CH method. The individual crystal size in the membrane obtained from fumed silica-derived precursor under CH (sample M01) was smaller than that in the membrane obtained from the TEOS-derived precursor (M02). The former also had a smaller thickness (~2 µm) than the later (5~7 µm). The morphologies of the crystals in the two membranes are also different. The membrane synthesized from the TEOS-derived precursor had surface crystals free of twins and appeared to develop certain level of oblique orientation while the other membrane had surface crystals grown with twins and were clearly of random orientation. 32
.")


![lab. [121] The silicalite particles obtained by CH and MH had a similar spherical](/docs-images/85/92452036/images/49-3.jpg "shape.")
49 M01 M01 M02 M02 Figure 2. 7 SEM images of the membranes M01 and M02 (left cross section, right surface). 2) Membrane Synthesis by Seeded Secondary Growth Silicalite nanocrystals with an average particle size of ~80 nm were obtained by CH and MH methods with excellent reproducibility. This result is consistent with the original work by Vroon. [121,122] The MH synthesis process was the same as that previous developed in our lab. [121] The silicalite particles obtained by CH and MH had a similar spherical shape. The silicalite particles synthesized by both methods were used for coating the seed layers, and they showed no appreciable differences in the 33


![[121] In this work, the secondary growth synthesis for zeolite membrane was performed at](/docs-images/85/92452036/images/50-3.jpg "180 o C for 4 h. The membrane had a large thickness of ~ 10 µm (M03 showing in Figure 2.")
50 later membrane formation by secondary growth. Figure 2.8 shows the SEM pictures of a typical silicalite seed layer obtained by a two-time coating process. The seed layer had a thickness of ~ 1.5 µm and a smooth surface with no pinholes or cracks observed by SEM. The precursor with a Si/Al ratio of 111 and was used in the secondary growth membrane synthesis based on the previous work. [121] In this work, the secondary growth synthesis for zeolite membrane was performed at 180 o C for 4 h. The membrane had a large thickness of ~ 10 µm (M03 showing in Figure 2.8). Silicalite seed layer Silicalite seed layer M03 M03 Figure 2. 8 SEM images of silicalite seed layer and M03 (left cross section, right surface). 34
51 2.2.3 Modification of MFI-Type Zeolite Membranes Table 2.6 summarizes the H 2 permeances and H 2 / 2 selectivities in the MFI-type zeolite membranes reported in literatures. The as-synthesized membrane M01-A and M01-B had H 2 / 2 gas permeation properties generally consistent with the literature data on similar MFI zeolite membranes. Table 2. 6 H 2 selectivity and permeance for MFI zeolite membranes 25 o C 200 o C 450 o C Reference M01-A M01-B Silicalite-1 Silicalite-1 Silicalite-1 Silicalite-1 ZSM-5 B-ZSM-5 α H 2 / 2 P m,h2 (mol/m 2.s.Pa) α H 2 / 2 P m,h2 (mol/m 2.s.Pa) α H 2 / 2 P m,h2 (mol/m 2.s.Pa) α H 2 / 2 P m,h2 (mol/m 2.s.Pa) o α H 2 / P m,h2 (mol/m 2.s.Pa) o α H 2 / P m,h2 (mol/m 2.s.Pa) o α H 2 / P m,h2 (mol/m 2.s.Pa) α H 2 / 2 P m,h2 (mol/m 2.s.Pa) P m,h2 (mol/m 2.s.Pa) This work This work [125] [31] [133] [134] [135] [124] 35
52 At room temperature, both M01-A and M01-B were selective toward 2 because the preferentially adsorbed 2 limited the access of H 2 molecules to the zeolite pores. When temperature was raised, both the permeance of H 2 and H 2 / 2 selectivities increased and the MFI membranes became H 2 selective at high temperature where 2 adsorption became minimal. Online Monitored Modification of Membrane from Secondary Growth: Figure 2.9 represents the CCD modification of the MFI zeolite membrane synthesized by secondary growth (sample M03). It was found that both the H 2 and 2 permeance increased during the heating process and the H 2 / 2 separation factor decreased gradually from 3.0 to 2.7. After modification at 450 o C for 6 h, H 2 permeance was ~ mol/m 2.s.Pa, 2 was ~ mol/m 2.s.Pa and H 2 / 2 separation factor was ~2.7, showing there was no modification effect in this membrane. The modification failed to improve the membrane in H 2 separation likely because of the lack of catalytic sites in the zeolite layer which had virtually no Al content. The incorporation of Al into the zeolite during hydrothermal synthesis in an Al-free precursor depends on the slight dissolution of alumina support surface. In the in-situ crystallization process, zeolite film grows from the precursor solution directly at the alumina surface that takes the dissolved Al ions into the framework. However, due to the separation of the growing zeolite film from the support surface, the incorporation of the Al content into the top layer zeolite become much less effective. Thus Al-induced catalytic sites are much less in the seeded-secondary growth membranes that resulted in ineffective CCD modification. 36
53 6.0E-7 0.5C/min 450C CCD 6h Permeances, mol/m 2 -s-pa 4.0E-7 2.0E-7 25C H2 permeance 2 permeance H2/2 separation factor H2/2 Separation Factor 2 0.0E Time, h Figure 2. 9 Separation of the equimolar H 2 / 2 mixture during CCD modification (Sample M03). Online Monitored Modification of Membranes from In-situ crystallization: The membrane synthesized by in-situ crystallization using fumed silica-derived precursor (sample M01-A) was used for CCD modification. Figure 2.10 shows the H 2 / 2 separation results monitored during the CCD modification process. It was found that the 2 permeance decreased while H 2 permeance increased during the heating process. The separation factor of H 2 / 2 increased gradually from 0.78 ( 2 selective) at room temperature to 3.8 at 450 o C. The permeances for H 2 and 2 at 450 o C were about and mol/m 2.s.Pa, respectively. After MDES vapor was introduced, the H 2 and 2 permeance both dropped. The H 2 / 2 separation factor increased from 3.8 to 9.0 after 10 h of contacting with MDES vapor and then stabilized. The 37
54 second modification (not shown in the figure) had a moderate improvement in H 2 / 2 separation factor to 11 which was not as significant as our previous findings. [31] The membrane might have mesoporous defects, either intercrystalline pores or pores in the sealing parts, lowering the separation factor. After CCD modification, 1/16 MDES feed tube and connections to the membrane cell were almost blocked by silica deposits. Thus, it seemed that the MDES precursor was largely consumed in its way through the small tube likely because the SS tube surface turned into catalytically active, e.g. iron oxides formed after long time CCD and WGS operation. This might also contributed to the low effectiveness of modification. 4.0E C/mi 450C CCD 10h 10 Permeances, mol/m 2 -s-pa 3.0E-7 2.0E-7 1.0E-7 25C H2 permeance 2 permeance H2/2 separation factor H2/2 Separation Factor 2 0.0E Time, h 0 Figure Separation for an equimolar H 2 / 2 mixture during CCD modification (M01-A). A second in-situ synthesized MFI membrane was then CCD method (sample M01-B) with the following conditions changed from the previous operation for M01-A: a new high temperature membrane cell and new 1/8 tubing were used. The larger diameter of 1/8 tubes and their new stainless steel surface allows MDES vapor to more effectively reach the membrane surface without reacting on 38
55 the tube and cell surface. More importantly, the M01-B showed better quality than M01-A before modification as indicated by the H 2 / 2 separation data before modification in Table 2.7. M01-B had significantly better 2 -selectivity ( α H 2 / 2 =0.38) and lower H 2 permeance ( mol/m 2.s.P) than those of the M01-A ( α H 2 / 2 =0.78 and P m,h2 = mol/m 2.s.P). Table 2. 7 Membrane properties for M01-A and M01-B before and after CCD modification 25 o C 450 o C 450 o C Before After M01-A M01-B Ref [125] (Disc) Ref [136] (Tube) α H 2 / 2 P m,h2 (mol/m 2.s.Pa) α H 2 / 2 P m,h2 (mol/m 2.s.Pa) α H 2 / 2 P m,h2 (mol/m 2.s.Pa) α H 2 / 2 P m,h2 (mol/m 2.s.Pa) Figure 2.11 shows CCD modification result for sample M01-B. The CCD modification was performed in same temperature and flow conditions as used in modification of M01-A. During the first modification period at 450 o C for 8 h, the H 2 permeance decreased from to mol/m 2.s.Pa whereas the H 2 / 2 separation factor increased from 5 to 18. The H 2 permeance increased to mol/m 2.s.Pa and the H 2 / 2 separation factor stabilized ~16 after being kept for 10 h under the flow of 39
56 dry H 2 / 2 mixture. The high temperature dry gas permeation process likely caused further decomposition of the remaining MDES and intermediate deposits inside the zeolitic pores. The second modification session at 450 o C for 6 h resulted in further increase of H 2 / 2 separation factor from 18 to 36, with a moderate decrease of H 2 permeance to mol/m 2.s.Pa. After another 10 h of dry gas permeation, a third time modification at 450 o C for 8 h was performed. The H 2 / 2 separation factor increased only slightly from 36 to 39 and H 2 permeance remained nearly unchanged at ~ mol/m 2.s.Pa. The H 2 permeance stabilized at mol/m 2.s.Pa and H 2 / 2 separation factor ~34 in 5 h of gas permeation without MDES. This indicates that the two-step modification is sufficient. 3.0E C/min 450C Permeances, mol/m 2 -s-pa 2.0E-7 1.0E-7 25C CCD 8h CCD 6h CCD 8h H2 permeance 2 permeance H2/2 Separation Factor 0.0E+0 H2/2 separation Time, h Figure Separation for an equimolar H 2 / 2 mixture during CCD modification for M01-B. The stabilizing H 2 selectivity and gas permeance suggests that the modification in zeolite channels was likely completed in the first couple of hours and further CCD of MDES could block the entrances of 40
57 zeolite channels, most probably at the zeolite/alumina support interface. The modified M01-B had much higher H 2 selectivity and similar H 2 permeance compared to M01-A. The main cause is the difference of membrane quality before modification. Apparently, high H 2 selectivity is achievable only on membranes with minimal defects before modification. Properties of the modified membrane: Single gas permeance was measured at 500 o C as a function of feed pressure. N 2 was used as sweeping gas. The results are shown in Figure The overall gas permeance through the membrane may include contributions of activated diffusion and gaseous diffusion through the zeolitic pores and intercrystal spaces, which are pressure-independent, and viscous flow through minimal defects in the membrane and/or sealing materials, which has linear dependency on operation pressure. The P m,h2 increased very slightly when increasing the feed pressure indicating that H 2 transport was primarily through diffusion in the zeolitic pores while the viscous flow through the defects was an insignificant contribution. The permeance of 2 and showed slight increases with increasing the feed pressure because the small amounts of viscous flow of 2 and through the defects could account for greater portions of their overall very low fluxes as compared to H 2. [125] 12 P m, 10-8, mol/m 2.s.Pa P feed, atm 41
58 Figure Single gas permeance as a function of feed pressure at 500 o C with atmospheric pressure in permeate side: ( ) H 2, ( ) 2, ( ). 2.3 Summary MFI-type zeolite powders and membranes were synthesized by in-situ crystallization and seeded secondary growth methods. It is concluded from this study that, to obtain highly H 2 -selective membranes through CCD modification, the original membranes must be of high quality, namely minimized defects and contain certain amount of catalytically active sites provided by aluminum content. Both the M01-A and M01-B membranes modified in this study will be used in later WGS membrane reaction test to study the effect of membrane quality on the MR performance. Pure MFI type zeolite particles and membranes on alumina disc substrates were obtained. The CCD membrane modification results have shown that the membranes obtained by seeded secondary growth method were not suitable for membrane modification because the membrane do not have sufficient population of Al-induced catalytic sites for CCD of MDES. However, it is possible that the Al-content can be adjusted in the secondary growth membranes via adding Al sources into the precursor to make the membranes suitable for CCD modification. 42
59 Chapter 3 High Temperature Water Gas Shift Reaction in Microporous Zeolite Membrane Reactors The WGS reaction is moderately exothermic as shown in equation (3.1). + H +, 2O 2 H 2 Θ H. 15 K 298 = 41.2kJ/mol (3.1) Thus, the reaction is kinetically favored at high temperature where the equilibrium -conversion ( χ ) is thermodynamically disadvantageous. High temperature membrane reaction is theoretically, e possible to achieve both nearly-complete 2 conversion and H 2 purification in one-step operation. The benefit of using WGS MR is not limited to the potential combined function of complete -conversion and H 2 purification. The ability of high temperature MR to intensify the production process and reduce the equipment size, complexity and capital investment is also important to the economic viability of hydrogen production from coal and biomass. This research studies the influence of membrane H 2 selectivity and permeance and WGS membrane reaction conditions on the zeolite MR performance. High temperature (>400 o C) WGS membrane reaction is practically attractive because of the fast reaction rate which provides high throughput and high χ if the membrane can effectively remove H 2 to overcome the low equilibrium conversion limit at high temperature. It is also advantageous in energy efficiency because the syngas exiting from conventional gasifiers is at high temperature (>600 o C) and high pressure (>200 Psia). However, reports on high temperature and high pressure WGS MR has been so far very limited. [101] Although the χ of the equimolar WGS reaction is theoretically independent, e of pressure in TR, increasing the reaction pressure is expected to enhance the χ in the MR. At high 43
60 temperature, where reaction kinetics is not a limiting factor, higher reaction pressure results in greater H 2 partial pressure and thus creates larger driving force for faster transport of H 2 through the membrane. [ ] In our recent studies, the CCD modified MFI membrane achieved high H 2 / 2 separation factor and was tested for WGS membrane reaction at near atmospheric pressure and high temperatures of o C. [136] The modified membrane exhibited good stability in the WGS reaction conditions and χ in the zeolite MR exceeded the equilibrium limit of TR ( χ ) at >500 o C., e In this work, we use the two modified MFI-type zeolite disc membranes (M01-A and M01-B) to study the effect of reaction pressure on the WGS membrane reaction at high temperatures between 400 and 550 o C and evaluate the MR stability in the presence of high concentration H 2 S. Because the two membranes are largely different in H 2 selectivity, the experimental data are also used to investigate the membrane quality on the WGS MR performance. 3.1 Experimental The Membrane Reactor After modification, H 2 and 2 single gas permeation and H 2 / 2 binary gas separation were measured for M01-A and M01-B at o C. The membrane permeance for gas component i is defined as P = Qi, ( i H 2, 2 ) A P (3.2) m, i = K m i where Q i (mol) is the amount of gas permeated over a time period of t (s); A m (m 2 ) is the active membrane area which is 2.54 cm 2 excluding the area sealed by the graphite gasket; and Pi (Pa) is the 44
61 transmembrane pressure, P i = ( Pi ) f ( Pi ) p, where P i ) f ( and ( P i ) p are the partial pressures of i in the feed and permeate sides, respectively. The H 2 / 2 perm-selectivity (a o H2/2) is defined as the ratio of pure gas permeance: P o m,h2 α H 2 / 2 = (3.3) P m,2 The H 2 / 2 separation factor (α H2/2 ) for the binary mixture is given by ( y H 2 / y2 ) permeate α H 2 / 2 = (3.4) ( y / y ) H 2 2 feed where y H2 and y 2 are mole fractions of H 2 and 2, respectively. The high temperature WGS catalyst was provided by Dr. Peter Smirniotis group. The catalyst was a cerium-doped ferrite (Fe 1.82 Ce 0.18 O 3 ), denoted as Fe/Ce catalyst, which had a Fe:Ce atomic ratio of 9:1. The Fe/Ce catalyst was prepared by the co-precipitation method. The details of preparation and characterization of the Fe/Ce catalyst have been reported elsewhere and briefly explained as following. [139,140] The calculated amounts of iron nitrates and cerium nitrate were first dissolved separately in deionized water and then mixed together. Dilute aqueous ammonia was added dropwise to the mixed solutions under vigorous stirring until precipitation was complete at ph level of 8.5. The precipitate gel was aged overnight and recovered by filtration. The resulting solid was dried at 80 o C for 12 h and calcined at 500 o C for 3 h in an inert environment using heating and cooling rates of 0.3 o C/min. The fresh catalyst in the hematite form (α-fe 2 O 3 ) was transformed into magnetite form (Fe 3 O 4 ) through controlled reduction of α-fe 2 O 3 into Fe 3 O 4 in a flow of process gas mixture containing 33.3% 45
62 , 25.0% 2, 25.0% H 2, and 16.7% steam. The process gas was allowed to flow through the catalyst bed for 4 h at 400 o C. Care was taken to properly control the temperature because significant amount of heat is released by the exothermic reactions involved, which could damage the catalyst. It is also important to avoid over-reduction and formation of FeO, Fe 2 C and metallic iron phases, which catalyze undesired side reactions such as methanation and disproportionation. For this particular WGS catalyst, the optimal reduction factor (R) in the process gas mixture was found to be R = 1.4, where R = [() + (H 2 )]/[( 2 ) +(H 2 O)]. [139] This Fe/Ce has been demonstrated to have good sulfur tolerance in high temperature WGS reaction. [141] The basic properties of the Ce/Fe catalyst used in this study are provided in Table 3.1. Table 3. 1 Basic properties of the Ce/Fe high temperature WGS catalyst [139] Catalyst Fe 1.82 Ce 0.18 O 3 The BET surface area (m 2 /g) 95.9 Average pore diameter (nm) 7.72 XRD phase Fe2O3 (hematite) TEM grain size (nm) 5 8 The WGS membrane reactor system is schematically shown in Figure 3.1 which is similar to that used our previous study [136] except for the membrane module. The disc membrane was mounted in a stainless steel cell sealed by soft graphite gaskets (Mercer Gasket & Shim). A total amount of 200 mg Fe/Ce catalyst powders were spread evenly over the zeolite membrane surface forming a thin catalyst bed. The catalyst bed was covered with a carbon cloth sheet and then a quartz wool pad on top. When 46
63 mounted in cell, this quartz-carbon cloth pad presses to fix the catalyst bed. The Carbon cloth/quartz wool blanket also served as a gas diffusion layer for the feed stream. The external gas tightness of the membrane cell and the tubing connections were verified by soap bubble test when the system was charged with 2-Psig helium gas. The internal membrane sealing effect was checked by measuring the H 2 / 2 gas separation at o C. Figure 3. 1 Schematic showing the membrane reaction system and the MR configuration WGS Reaction In the WGS reaction experiments, the pressure on the reaction side was controlled by a backpressure regulator connected to the exit of the retentate side of the MR. The permeate side was swept by a N 2 flow 47
64 at atmospheric pressure. The flow rates of and N 2 were controlled by mass flow controllers (GFC, Aalborg) and the flow rate of water was controlled by a precision syringe pump (KDS 410, KD Scientific). The liquid water was vaporized at ~150 o C by a heating jacket prior to entering the preheating coiling located in the furnace. Preheating coils were employed for both the feed and sweeping gases to ensure that the gases reach the set temperature before entering the reactor. The outlet streams from retentate and permeate sides passed through an ice bath to remove most of the water vapor. The flow rates of the streams exiting the MR were frequently checked by a soap film flow meter after the ice traps. The retentate and permeate gases were analyzed by an online GC (Agilent, 6890N) equipped with an Alltech Hayesep DB packed column and a thermal conductivity detector (TCD). A heating or cooling rate of 0.3 o C/min was used when switching the reaction temperature. Before taking data at each of the set conditions, the membrane reaction was allowed to stabilize for 1 h which was found to be sufficient at high temperatures. The online sampling and GC analysis of the retentate and permeate streams were typically performed twice for each point of operation with 30 minutes in between the two sampling actions. The data reported in this paper were averaged from the values of the two samples. Normally, results of the two samples had relative deviations within ±2% in GC peak areas. In rare cases, the relative deviation between the first two samples was greater then 2% then a third sample was taken. Byproducts of side reactions such as methane and carbon deposits were not appreciable for this Fe/Ce catalyst in the WGS reaction at >400 o C and atmospheric pressure. [137,139,140] However, methanation reactions are associated with volume reduction which is thermodynamically favored at high pressure. [137] In this work, the reaction products were analyzed by the mass spectrometer (MS) to more closely observe the influence of operation conditions on reaction selectivity. The methane selectivity was found to be far 48
65 less than 1% in most of the tested conditions in this study. Therefore, the -conversion ( χ calculated based on the feed flow rate ( F ) and the rates of 2 ( F 2 ) and CH 4 ( F in out out CH ) was 4 ) exiting the reactor and confirmed by the value calculated using the amounts of entering and exiting the reactor: out out F + FCH F 2 4 χ = 1 (3.5) F F in out in The approximation in equation (3.5), i.e. neglecting F out CH 4, was assumed in most cases except for in TR mode at >500 o C and > 2 atm where CH 4 selectivity exceeded 0.1%. The H 2 -recovery (R H2 ) is defined as R H 2 = (Amount of H 2 in permeate) (Total amount of H 2 generated by reaction) (3.6) The permeate side H 2 concentration (y H2,P ) is defined on dry gas basis by y J H 2 H P = (3.7) 2, J H + J CH + J + J where J H2, J 2, J CH4 and J are respectively the H 2, 2, CH 4 and fluxes permeating through the membrane. The reaction selectivity of methanation (S CH4 ) is calculated by Moles of CH 4 in exiting streams of both sides S CH = (3.8) 4 Moles of reacted The carbon balance (ζ C ) was checked for each reaction condition based on the actually measured gas flow rates and GC analyzed compositions: (F + F2 + FCH4 ) out + (F + F2 + FCH4 ) retentate, permeate,our ζ = 1 (3.9) C (F + F ) 2 feed,in In general, the carbon balance was quite good with ζ C values typically in a range of 3% to 2% which may be attributed mainly to the errors of flow rate measurement and GC analysis as well as minor carbon formation on the oxidized stainless steel tubing and reactor surface. Carbonization on the catalyst surface 49
66 was not observed in our previous studies. [137,139,140] When the membrane-mounted cell was used in TR operation mode, the entering sweeping gas was removed and the exit of the reaction side was connected to the original sweeping inlet. The gas stream from the reaction side thus passed through the permeate chamber to exit from the permeate side. The main operating conditions of the WGS MR are given in Table 3.2. Table 3. 2 WGS membrane reaction conditions Reaction Temperature, o C 400 ~ 550 Reaction pressure at exit, atm 2 ~ 6 Permeate pressure, atm 1 Steam-to- ratio, R H2O/, mol/mol 1.0 ~ 3.5 Hourly space velocity (WHSV*), h -1 7,500 ~ 60,000 N 2 sweeping flow rate, F N2, cm 3 (STP)/min 0 ~ 40 Fe/Ce catalyst load (m cat ), g 0.2 Catalyst packing density (ρ cat ), g/cm H 2 2 H 2O H 2 2 * WHSV = ( v + v + v + v ) /( m / ρ ) ; v, v, v, and feed feed feed feed cat. cat feed feed feed v 2 are volumetric flow rates of components in feed streams at STP. H O feed A series of WGS experiments were carried out in both the MR and TR operation modes. The effect of reaction pressure on -conversion has been studied for various temperatures, steam-to- ratios, WHSV and sweep flow rates. The effects of reaction pressure on the undesirable methanation were also investigated under the MR and TR operations. The WGS reaction experiments were further performed for a simulated syngas containing H 2, and 2 as well as for feed streams containing H 2 S which is a 50
67 major contaminant in coal-derived syngas. The membrane s long term stability was evaluated based on its H 2 permeance and selectivity over 2 and other gases which were measured at different points of the high temperature operations, including WGS reaction and dry gas separations. 3.2 Results and Discussion WGS Reaction in M01-A 1) Low Pressure WGS Reaction. The disc zeolite MR was first examined for WGS reactions at o C with feed side pressure of 2 atm, N 2 sweep flow rate of 20 cm 3 (STP)/min, WHSV of 7,500 h -1, and R H2O/ of 3.5. The results of WGS membrane reaction are presented in Figure 3.2 in comparison with data of TR operation mode and results of our previous study on a tube MR under similar operation conditions. [136] The tube membrane was also modified by the CCD process, which had slightly larger H 2 permeance of 1.0 ~ mol/m 2.s.Pa but significantly higher H 2 / 2 separation factor (α H2/2 = 38 ~ 45) compared to the present disc membrane. The tube MR was packed with the same Fe/Ce catalyst at same load of 79 mg-catalyst/cm 2 -membane. As can be seen in Figure 3.2 (b), the H 2 molar concentration in the permeate stream (y H2,p ) of the disc MR was notably lower than that in the tube MR because the disc MR had a much lower H 2 / 2 selectivity. The H 2 recovery in the disc MR was only slightly less than that in the tube MR because of the small difference in H 2 permeance between the two membranes. The disc MR had lower χ than the tubular MR but the difference of χ between the two MRs diminished when the reaction temperature was raised to above 500 o C. 51
68 100 χ, % MR, ref[136] MR, M01A TR T, o C (a) yh2 Ref[136] M01A RH2, %; yh2, % RH2 M01A Ref[136] T, o C Figure 3. 2 Results of WGS reaction in the disc MR compared with data of TR and tube MR in (b) reference [136] : (a) The χ and (b) R H2 and y H2,p. 52
69 Because the two membranes had similar H 2 permeances, the main cause of the lower χ in the disc MR is likely to be its low H 2 selectivity which allows for larger permeation of. At relatively low temperature, the slow reaction keeps the partial pressure high in the feed side that causes more permeation under the same WHSV. Thus, the H 2 selectivity has a greater impact on the χ of the MR at relatively low temperature. In contrast, at high temperature, the fast reaction rate dramatically reduces the amount of unreacted in the feed side that lowers the driving force for permeation and thus reduces the effect of H 2 selectivity on χ of the MR. The fast reaction at high temperature also increases the 2 permeation through the membrane that reduces the y H2,p ; however, the removal of 2 from the catalyst bed also enhances the χ just the same as does the removal of H 2. These findings suggest that membranes with moderate H 2 selectivity can still be effective for χ enhancement at high operation temperature but will compromise the effectiveness of simultaneous H 2 purification in the MR. However, the reduction of χ caused by the permeation of and H 2 O could become a serious issue for low R H2O/ feeds if the H 2 selectivity of the membrane is too low. The present disc membrane had H 2 / and H 2 /H 2 O permselectivities of about 14 and 3.0, respectively, after 1,800 h of gas permeation and WGS reaction at >400 o C. 2) Effect of Pressures. The WGS reaction experiments were performed with feed side pressures varying from 2 to 6 atm. The permeate side was swept by N 2 flow at atmospheric pressure and the WHSV and R H2O/ were fixed at 7,500 h -1 and 3.5, respectively. Figure 3.3 compares the χ between MR and TR operation modes. The R H2 and y H2,P in MR are also presented in the Figure 3.3 (e) as a function of 53
70 pressure at temperatures of 400, 450, 500, and 550 o C, respectively. 100 χ,e 90 χ, % χ, MR χ, TR P feed, atm (a) χ, MR χ,e χ, % χ, TR P feed, atm (b) 54
71 χ, MR χ, TR χ,e χ, % P feed, atm (c) χ, MR χ, TR χ,e χ, % P feed, atm (d) 55
72 100 RH2, %; yh2,p, % C 500 C 450 C 400 C 550 C 500 C 450 C 400 C R H2 y H2,p P feed, atm (e) , % 80 Eq 2 atm 3 atm 70 4 atm 5 atm 6 atm T, o C (f) Figure 3. 3 Effect of reaction pressure and temperature on χ, R H2 and y H2,p in the disc MR: (a) χ vs. p feed at 400 o C, (b) χ vs. p feed at 450 o C, (c) χ vs. p feed at 500 o C, and (d) χ vs. p feed at 550 o C, (e) R H2 and y H2,p as a function of p feed, and (f) χ as a function of temperature. 56
73 The χ of the MR is much higher than that of the TR and increases with reaction pressure (feed side, p feed ) at all temperatures. The χ in the TR exhibited a slight increase with reaction pressure which is probably caused by more effective utilization of internal surface in the nanocrystalline catalyst bed under high pressure. In the MR, a higher reaction pressure leads to higher H 2 partial pressure in the feed side that creates greater driving force ( P = P ) ( P ) H 2 ( H 2 f H 2 p ) for H 2 membrane transport when the permeate side pressure is kept relatively constant by sweep flow. Thus, H 2 is removed more efficiently at large p feed to shift the WGS reaction (1) towards the right side and meanwhile achieve in higher H 2 recovery in the permeate stream as shown in Figure 3.3 (e). However, the enhanced H 2 removal leads to a smaller value of ( y H 2 / y 2 ) feed in the reaction side because of H 2 depletion. Also the α H 2/ 2 is rather insensitive to pressure at high temperature where the gases are essentially non-adsorbing in the membrane and exhibit ideal gas behavior. [31] Thus, based on equation (3.4), reducing ( y H 2 / y 2 ) feed decreases the value of ( y H 2 / y 2 ) permeate ( H 2/ 2 ( y H 2 / y2) feed = α ), that explains the trend of y H2,p decreasing with increasing R H2 and χ under higher feed pressures. At a given WHSV, overcoming the equilibrium limit χ by H, e 2 removal in the MR may be realized by increasing the H 2 partial pressure in the reaction side through raising temperature for faster H 2 generation (thus approaching equilibrium state faster) and/or increasing reaction pressure. Results in Figures 3.3 (a~d) demonstrate that the necessary temperature for surpassing the χ can be lowered, e by increasing the reaction pressure. Figure 3.3 (f), on the other hand, shows that the reaction pressure necessary for overcoming the χ can be reduced when temperature is raised., e 57
74 It is also observed that χ tends to level off after certain points in both cases of increasing pressure at a fixed temperature and increasing temperature under a fixed pressure. The χ in a MR depends on multiple factors including membrane performance, catalyst properties, and operation conditions. The level-off behavior indicates that adjusting or improving one individual factor alone is insufficient for achieving nearly complete -conversion. For example, at 550 o C and 6 atm, a high χ of 98% was achieved at a R H2 of 64%, where concentration became very low and is no longer able to rapidly generate H 2 and create high H 2 partial pressure even under high pressure and temperature. In this case, unless the permeate side H 2 is completely removed and the overall H 2 transport resistance is near zero, further increasing the χ is difficult. Moreover, for complete conversion, the H 2 selectivity of the membrane must be high enough to prevent permeation of unreacted which directly reduces the χ. The current disc membrane is not expected to achieve complete conversion due to its moderate H 2 selectivity. At 500 o C, the amount of in the permeate side was only 29% of the total unreacted exiting the MR at 2 atm; this percentage increased to 45% when pressure rose to 6 atm because raising the operation pressure increases membrane fluxes for all components. 3) Steam-to- Ratio (R H2O/ ). The ability to achieve high χ with low R H2O/ is an important advantage of WGS MR because lowering R H2O/ reduces the reactor size and energy consumption for steam recycling. A low R H2O/ is also desired for minimizing the adverse effect of H 2 dilution by excessive steam in the reaction zone and thus maintaining high efficiency of H 2 transport through the membrane. [122] A perfect H 2 -selective membrane like the dense Pd-alloy membrane, which is impermeable to H 2 O and, can theoretically achieve nearly complete -conversion even for feed 58
75 with stoichiometric R H2O/ of 1. However, permeation of steam and is inevitable in porous membranes because their molecular sizes are very close to H 2. The permeance of H 2 O is much greater than because the molecular size of H 2 O is smaller than that of. The loss of steam from a feed with R H2O/ of 1.0 would be directly translated into the same amount of decrease in χ. The current disc membrane had a rather modest H 2 /H 2 O selectivity of 3.0 and thus steam loss may become an issue under high pressure and low R H2O/. The WGS reaction in the MR was studied at 550 o C for R H2O/ of 1.0, 1.5, 2.0, and 3.5, respectively. Figure 3.4 presents the experimental χ as a function of R H2O/ at WHSV of 7,500 h -1 and feed pressure of 2 atm and 6 atm, respectively χ, 6atm χ, 2atm R H2, 6atm χ, %; RH2, % R H2, 2atm χ,e R H2O/ Figure 3. 4 Effect of feed R H2O/ on χ and R H2 at 550 o C and WHSV of 7,500 h -1 under different pressures. The results show that χ increases with R H2O/ at both feed pressures because the excessive steam favors χ and high steam pressure enhances the reaction rate. [136] It is also seen in Figure 3.4 that, e the enhancement of χ is more pronounced for a R H2O/ increase from 1 to 1.5 than for an increase 59
76 from 2 to 3.5. Changing the R H2O/ from 1 to 1.5 in the MR operation not only thermodynamically and kinetically favors the χ but also avoids the stoichiometric steam deficit (R H2O/ < 1) caused by the H 2 O permeation at R H2O/ of 1. Although, further increasing the R H2O/ leads to greater χ, it causes, e more H 2 dilution in the reaction side to hinder the H 2 transfer from the catalyst bed to the permeate side. The countering effects of high R H2O/ on H 2 transfer is evidenced by the nearly unchanged R H2 with increasing R H2O/ as shown in Figure ) Effect of WHSV. Figure 3.5 presents the results of WGS reaction in the disc MR and TR at 550 o C under reaction pressures of 2 atm and 6 atm, respectively. The WHSV value was varied from 7,500 h -1 to 60,000 h -1 at a fixed R H2O/ of 3.5. At both operation pressures, χ in the MR increased with decreasing WHSV because of longer residence time for reaction and H 2 permeation at smaller WHSV. The χ can be enhanced by simultaneously increasing feed pressure and lowering the WHSV. Also, when WHSV decreased from 60,000 to 7,500 h -1 at 6atm, the R H2 was found to increase from 41 to 64% while H 2 purity had a rather moderate decrease over the range of WHSV. However, increasing pressure compromises y H2,p as shown by Figure 3.5 (b) due to relatively larger 2 flux when H 2 in the reaction side depleted under high R H2. 60
77 eq. 6 atm 2 atm χ, % WHSV, h -1 (a) atm 6 atm y H2 RH2, %; yh2, % R H2 6 atm 2 atm WHSV, h -1 (b) Figure 3. 5 Effect of WHSV on (a) the χ and (b) R H2 and y H2,P. 61
78 5) Effect of Sweep Flow (F N2 ). The permeate side sweep gas flow rate affects the H 2 membrane flux (J H2 ) by changing the driving force ( p H 2 ): J = P p = P ( p p ) = P p (1 p / p ) (3.9) H 2 m, H 2 H 2 m, H 2 H 2, f H 2, p m, H 2 H 2, f H 2, p H 2, f Figure 3.6 shows χ and R H2 as a function of N 2 sweeping flow rate (F N2 ) at feed pressures of 2 and 6atm, respectively. The F N2 was varied from 5 to 40cm 3 /min at 500 o C under a fixed WHSV of 7,500 h -1 and R H2O/ of 3.5. Increasing the sweeping flow rate reduces the permeate side H 2 partial pressure p H, p 2 that increases J H2 (i.e. rate of H 2 removal) and consequently enhances the χ. On the other hand, the p H, f 2 increases with reaction pressure; therefore, the χ is less sensitive to the H 2 p variation p, or change of sweeping flow rate at high reaction pressure. This explains why χ in the MR is more sensitive to F N2 at an operation pressure of 2 atm than at 6 atm. In Figure 3.6, both χ and R H2 level off as F N2 reaches certain levels, more noticeably for reaction pressure of 2 atm. The permeate side H 2 partial pressure is only one of the many factors influencing the overall rate of H 2 removal from catalyst surface to the permeate stream, including the transport resistances in the catalyst layer, between the catalyst and membrane surface, through the membrane pores, the substrate, and from membrane to permeate. The plateau of χ and R H2 in Figure 3.6 indicate that p H2,p is no longer a significant factor of the overall mass transfer resistance and obtaining a higher χ and R H2 will rely on simultaneously addressing other steps of the transport process. 62
79 100 eq. 6 atm 2 atm 80 χ χ, %; RH2, % R H2 6 atm 2 atm F N2, cm 3 /min Figure 3. 6 Effect of N 2 sweeping flow rate on χ and R H2 for a fixed WHSV=7,500 h -1 at 500 o C. 6) Methanation. Methane is one of the main undesirable byproducts of WGS reaction. [137, ] Methanation reactions in the WGS reaction system are endothermic and involve overall volume decrease which are therefore thermodynamically favored at high pressure and high temperature. Following are the possible methanation reactions: + 3 H 2 CH 4 + H 2O (3.11) H 2 CH 4 + 2H 2O (3.12) 2H + C CH (3.13) 2 4 The selectivity of methanation was examined under both MR and TR operation modes at pressures of 2 6 atm and temperatures of 500 and 550 o C, respectively. The WHSV and R H2O/ were fixed at 7,500 h 1 and 3.5, respectively. The amounts of methane in permeate and retentate streams were 63
80 analyzed by GC/MS due to the same quantity. Figure 3.7 presents the comparison of methane selectivity (S CH4 ) between TR and MR operations. As expected, in all cases, S CH4 increased with operation temperature and pressure. At 550 o C, the S CH4 was much larger than at 500 o C. The S CH4 increased rapidly from 0.02% to 0.92% under the TR operation mode when the feed pressure increased from 2 to 6 atm. The methane selectivity at 550 o C in the MR was dramatically reduced to 0.01% at 2 atm and 0.03% at 6 atm, respectively. The inhibition of methanation in the MR is attributed to the removal of H 2, a reactant for methane formation, from the catalyst surface. The ability of the MR to inhibit methanation is an important advantage for WGS MR because methanation consumes the useful H 2 and creates undesirable CH 4 impurity in the product. SCH4, % TR, 500 C TR, 550 C MR, 500 C MR, 550 C P feed, atm Figure 3. 7 Methane selectivity in the MR and TR under a fixed WHSV of 7,500 h 1 and R H2O/ of ) -H 2-2 Mixture Feed. The disc MR was tested for WGS reaction for a feed mixture containing 40%, 30% H 2 and 30% 2. The experiments were performed with a fixed WHSV of 7,500 h -1 and a R H2O/ of 3.5 in temperature and pressure ranges of o C and 2 6 atm, respectively. The results are shown in Figure 3.8. In general, the temperature and pressure dependences of χ, R H2 and 64
81 y H2,p for the ternary mixture feed were similar to those for the pure feed. The χ in the MR exceeded the χ at >450 o C and the enhancement of, e χ in the MR became more significant as temperature and reaction pressure increased. The R H2 and y H2,p had opposite trends with changing pressure, namely the R H2 increased while y H2,p decreased upon raising the reaction pressure. The causes of these distinct pressure-dependences of R H2 and y H2,p have been explained in section (2). Increasing the feed side pressure creates greater p H 2 that leads to higher rate of H 2 removal and H 2 recovery. On the other hand, the 2 mole fraction in the reaction side becomes larger as more H 2 being removed that results in an increase of 2 in the membrane permeation to lower the H 2 concentration in the permeate stream. χ, % χ, % χ, % χ, % o C equilibrium MR TR o C equilibrium MR TR o C 60 equilibrium MR TR o C equilibrium MR TR p feed, atm 65
82 80 70 y H2,p 550 o C 500 o C 450 o C 400 o C RH2 or yh2,p, % R H2 550 o C 500 o C 450 o C 400 o C P feed, atm Figure 3. 8 Results of WGS reaction in the MR for a feed containing 40%, 30% H 2 and 30% 2. The methanation selectivity in WGS reaction of mixture feed was also examined and the results are shown in Figure 3.9. The methane selectivity S CH4 for the mixture feed was higher than that for the pure feed because of the large amounts of preexisting 2 and H 2 which are reactants of methanation reactions. The MR was again able to dramatically reduce the methanation reactions as compared to the TR operation. At reaction pressure of 6 atm and temperature of 550 o C, the S CH4 values were ~1.5% in TR operation and ~0.07% in the membrane reaction, respectively. SCH4, % TR, 500 C TR, 550 C MR, 500 C MR, 550 C P feed, atm Figure 3. 9 Methane selectivity for the -H 2-2 mixture feed in the MR and TR under a fixed WHSV of 7,500 h 1 and R H2O/ of
83 8) Stability in H 2 S. H 2 S is a major impurity in coal-derived syngas, which is poisonous to the WGS catalysts and Pd-based membranes. [31,101] The zeolite membrane reactor was tested for WGS reaction with a feed containing 400 ppm H 2 S. The WGS membrane reaction was performed under two general conditions: the first was at a reaction pressure of 2 atm and a fixed R H2O/ of 3.5 with temperature varying from 400 to 550 o C; and the second was at a reaction pressure of 2 atm and a fixed temperature of 550 o C while varying the R H2O/ from 1 to 3.5. The WGS reaction with the H 2 S-containing feed was allowed for 4 h of stabilization at each reaction condition before taking data. The results are presented in Figure 3.10, which shows essentially no difference in χ between feeds with and without H 2 S χ, % Eq No H2S 400 ppm H2S T, oc (a) 67
84 χ, % Eq No H2S 400 ppm H2S R H2O/ (b) Figure WGS membrane reaction with and without H 2 S in feed at a fixed WHSV=7,500 h -1 : (a) χ as a function of temperature at a R H2O/ of 3.5, and (b) χ as a function of R H2O/ at 550 o C. The MR was then further tested for WGS reaction with 1,000 ppm H 2 S in the feed stream for an extended time of 100 h. The reaction was conducted at 500 o C with a fixed WHSV of 7,500 h -1 and a R H2O/ of 3.5. Prior to introducing the H 2 S, the membrane WGS reaction was stabilized for 3 h with sulfur-free feed stream. Figure 3.11 shows the resultant χ versus time-on-stream. The χ in the MR was quite stable with only 1.5% decrease after 100 h of operation. This result indicates that modified MFI-type membrane is chemically resistant to H 2 S and the Fe/Ce catalyst is tolerant to high H 2 S content at high reaction temperature. 68
85 χ, % Time, h Figure The χ vs. WGS reaction time for a feed containing 1,000ppm H 2 S. Also, during the WGS reaction with 1,000 ppm H 2 S, H 2 S (kinetic diameter ~0.36 nm) was not appreciable in the permeate stream by GC analysis while a large H 2 S peak was found in the GC spectrum for the retentate sample. This suggests that the membrane also has good separation for H 2 and H 2 S. The separation of H 2 /H 2 S was then examined for the membrane using gas mixture containing 1% H 2 S and balance H 2 at temperatures from 25 to 550 o C. Figure 3.12 presents the H 2 /H 2 S separation factor and individual gas permeance as a function of temperature. Both H 2 and H 2 S permeance increased with increasing temperature because of the activated diffusion mechanism in the modified zeolite pores. However, the magnitude of H 2 permeance increase was greater than that of H 2 S when temperature rose from 25 to 550 o C. One possible reason for the more rapid increase of H 2 permeance is the reduction of H 2 S adsorption at the membrane surface and pore entrance at high temperature that increased the permeation of the non-adsorbing H 2. At 550 o C, the membrane showed H 2 permeance of
86 mol/m 2.s.Pa, H 2 S permeance of mol/m 2.s.Pa and a high H 2 /H 2 S separation factor of ~ Pm, 10-8, mol/m 2 -s-pa 8 4 H 2/H 2 S separation factor H 2 permeance H 2S permeance αh2/h2s T, o C Figure Results of membrane separation mixture of 1% H 2 S WGS Reaction in M01-B Membrane M01-B had a much higher H 2 / 2 separation factor ( α = 38.6) but similar H 2 H 2 / 2 permeance (P m,h2 = mol/m 2.s.Pa) as compared to M01-A ( α = 11 and P m,h2 = H 2 / 2 mol/m 2.s.Pa). The gas separation performance of M01-B was very similar to that reported by Tang et al. [136] WGS reaction experiments were performed on M01-B membrane reactor under the same conditions used for testing the M01-A MR. The results of WGS reaction in M01-B are presented in Figures 3.13 to As expected, the dependences of χ, y H2,p, and H 2 recovery (R H2 ) on the operation conditions including temperature, pressure, R H2O/, HWSV, and sweep flow F N2, are generally the same as those observed on M01-A. 1) Effect of Pressures. 70
87 100 χ,e 90 χ, % χ, MR χ, TR P feed, atm (a) χ, MR χ,e χ, % χ, TR P feed, atm (b) 71
88 χ, MR χ, TR χ,e χ, % P feed, atm (c) χ, MR χ, TR χ,e χ, % P feed, atm (d) 72
89 C 500 C 450 C 400 C y H2,p 80 RH2, %; yh2,p, % C 500 C 450 C 400 C R H P feed, atm (e) χ, % 80 Eq 2 atm 3 atm 70 4 atm 5 atm 6 atm T, o C (f) Figure Effect of reaction pressure and temperature on χ, R H2 and y H2,p in the disc MR: (a) χ vs. p feed at 400 o C, (b) χ vs. p feed at 450 o C, (c) χ vs. p feed at 500 o C, and (d) χ vs. p feed at 550 o C, (e) R H2 and y H2,p as a function of p feed, and (f) χ as a function of temperature. (membrane: M01-B) 73
90 2) Steam-to- Ratio χ, 6atm χ, 2atm R H2, 6atm χ, %; RH2, % R H2, 2atm χ,e R H2O/ Figure Effect of feed R H2O/ on χ and R H2 at 550 o C and WHSV of 7,500 h -1 under different pressures. (membrane: M01-B) 3) Effect of WHSV eq. 6 atm 2 atm χ, % WHSV, h -1 (a) 74
91 atm 6 atm y H2 RH2, %; yh2, % R H2 6 atm 2 atm WHSV, h -1 (b) Figure Effect of WHSV on (a) the χ and (b) R H2 and y H2,P. (membrane: M01-B) 4) Effect of Sweep Flow χ eq. 6 atm 2 atm 6 atm χ, %; RH2, % R H2 2 atm F N2, cm 3 /min Figure Effect of N 2 sweeping flow rate on χ and R H2 for a fixed WHSV=7,500 h -1 at 500 o C. (membrane: M01-B) 75
92 5) Effect of membrane quality on WGS MR performance The M01-B membrane had high temperature H 2 separation performance very similar to the membrane reported by Tang et al. [136] (Ref: P m,h2 = 1.0 ~ mol/m 2.s.Pa and α H2/2 = 38 ~ 45). Thus the WGS reaction outcomes are nearly identical for M01-B and that in the reference [136] as shown by the data of low pressure operation in Figure 3.2. The -conversion was higher in M01-B than was in M01-A likely because more unreacted permeated through the less selective M01-A membrane χ, % MR, ref[136] MR, M01B 60 MR, M01A TR T, o C (a) 76
93 yh2 Ref[136] M01B M01A RH2, %; yh2, % RH2 M01B M01A Ref[136] T, o C Figure Results of WGS reaction in the disc MRs (M01-A and M01-B) compared with data of TR (b) and tube MR in reference [136] : (a) The χ and (b) R H2 and y H2,p. The WGS reaction data in M01-A and M01-B are also compared at temperatures of 400 and 550 o C as functions of operation pressure in Figure At all pressures, M01-B outperformed M01-A (Figure 3.18 a and c) in χ because more unreacted leaked through the less H 2 -selective M01-A membrane. The difference of χ between the two MRs is less significant at 550 o C and decreasing with increasing pressure as well. These observations again suggest that the influence of membrane H 2 selectivity on the WGS MR performance becomes less significant at high temperature and pressure in terms of χ. The reason is that the reaction to rapidly consume the at high temperature leaving less to permeating through the membrane. On the other hand, the R H 2 increased and y H 2, p decreased with increasing reaction side pressure (Figure 3.18 b and d). The causes of such R H 2 and y H, p 2 dependences on the feed (reaction) pressure are that the H 2 flux through the membrane increases 77
94 with increasing the driving force ( p H 2 = p feed yh 2, f p permeate yh 2, p ) while the membrane permeation of 2 also increase with feed side pressure. The increase in 2 flux at R H 2, which results in small hydrogen partial pressure, leads to lower y H 2, p. 100 χ,e 90 χ, % M01-B 60 M01-A T=400 o C P feed, atm (a) M01-B y H2,p RH2, %; yh2,p, % M01-A R H M01-B M01-A T=400 o C P feed, atm (b) 78
95 M01-B M01-A χ,e χ, % T=550 o C P feed, atm (c) M01- B M01-A y H2,p 80 RH2, %; yh2,p, % M01-B R H2 40 M01-A T=550 o C P feed, atm (d) Figure Comparison of χ, R H2, and y H2,p between M01-A and M01-B at 400 o C (a and b) and 550 o C (c and d). 79
96 3.2.3 Long-Term Membrane Stability The long term stability of the CCD modified MFI-type zeolite membranes was evaluated based on their H 2 separation performance measured at various time points during the high temperature gas permeation and WGS reaction processes. Table 3.3 presents the data on M01-A. The M01-A lost 24.5% in α H 2/ 2 separation factor and 21.8% in Pm,H 2 hydrogen permeance after the first 1,800 h of operation at >400 o C (600 h WGS and 1,200 dry gas permeation); and further lost 7.2% in α H 2/ 2 and 14.4% in P m,h 2 after 2,200 h of continued operation at >400 o C (800 h WGS operation and 1,400 h of dry gas permeation). For M01-B, a 7.2% loss in α H 2/ 2 and a 10.4% loss of P m,h 2 after 900 h of continued operation at >400 o C (300 h WGS operation and 600 h of dry gas permeation). The two membranes had similar stability in terms of losses in α H 2/ 2 and P m,h 2 per 100 h, which are respectively, 1.36%/100h α H 2/ 2 and 1.21%/100h Pm,H 2 for M01-A, and 1.42%/100h α H 2/ 2 and 1.15%/100h Pm,H 2 for M01-B. These per 100 h loss of membrane performance in WGS MR conditions are the best compared to current literature reports on any other types of membrane, especially with the presence of H 2 S. Table 3. 3 H 2 selectivity and permeance for M01-A measured at 500 o C and different points Measurement points * Time on-stream α ** H 2 / 2 α o H 2 / 2 α o H 2 / α o H 2 / H 2O P m,h2, 10-7 mol/m 2.s.Pa #1 0 h #2 1,800 h #3 4,000 h * #1: Fresh modified membrane #2: After 1,800 h high temperature operations, including 600 h of WGS and 1,200 h of dry gas separation / overnight permeation during off-work hours and weekends. 80
97 #3: After additional 2,200 h high temperature operations in the presence of H 2 S including 800 h of actual WGS reaction with and without H 2 S and 1,400 h of dry gas separation / overnight permeation during off-work hours and weekends. ** α H 2 / 2 measured using an equimolar H 2 / 2 binary gas mixture feed at 2 atm and sweep at atmospheric pressure. Table 3. 4 H 2 selectivity and permeance for M01-B measured at 500 o C and different points Measurement points * Time on-stream α ** H 2 / 2 α o H 2 / 2 α o H 2 / α o H 2 / H 2O P m,h2, 10-7 mol/m 2.s.Pa #1 0 h #2 900 h * #1: Fresh modified membrane #2: After 900 h high temperature operations including 300 h of WGS reaction and 600 h of dry gas separation / overnight permeation during off-work hours and weekends. ** α H 2 / 2 measured using an equimolar H 2 / 2 binary gas mixture feed at 2 atm. 3.3 Summary The two modified MFI-type zeolite disc membranes (M01-A and M01-B) were tested for high temperature WGS reaction using a cerium-doped ferrite (Fe/Ce) catalyst. It was found that increasing reaction pressure in the MR benefits the enhancement of the χ and dramatically reduce the undesirable side reactions of methanation. Both the enhancement of χ and the inhibition of methanation in the MR are attributed to the more effective removal of H 2 from the catalyst bed at higher pressures, because H 2 is a product of WGS reaction but a reactant for methanation reactions. The results of this study indicate that membranes with moderate H 2 selectivity can still be effective for χ enhancement at high operation temperature but will compromise the effectiveness of simultaneous H 2 purification in the MR. The zeolite membrane used in this work had moderate H 2 / 2 selectivity and 81
98 H 2 permeance, χ in the MR exceeded the, e χ at >450 o C and the χ enhancement became greater at higher temperature and pressure. However, for porous membrane with imperfect H 2 selectivity, the R H2 and y H2,p exhibit opposite trends with pressure, namely increasing R H2 but decreasing y H2,p with raising reaction pressure, because the relative amount of 2 in the membrane flux increases when H 2 is depleted in the reaction side at high H 2 recovery. The zeolite membrane and the Fe/Ce catalyst also showed good stability and tolerance to high concentration H 2 S in high temperature WGS reaction. The modified MFI-type zeolite membrane showed long term stability in high temperature WGS conditions, which is so far the best compared to literature reports. It is clear that the improvement of the WGS MR depends not only on the development of better membrane and catalyst but also on the optimization of the operation conditions. 82
99 Chapter 4 Modeling and Simulation of High Temperature Water Gas Shift Reaction in MFI Zeolite Membrane Reactor In the literature, most of the simulation works use steady-state, one-dimensional (1D) models [ ] and some recent research employed two-dimensional (2D) models which consider both axial and radial concentration gradients. [ ] Ma and Lund developed a 1D microkinetic model for the high-temperature WGS MR. [155] Adrover et al. used a pseudohomogenous 1D model to describe the steady-state operation of the MR. [156] The effect of pressure on the performance of a MR was investigated and they found that an increase in the reaction pressure led to an improvement in conversion. Hermann et al. proposed a 1D non-isothermal model considering the pressure drops along the catalytic bed in a Pd Ag composite membrane reactor. [149] Brunetti et al. analyzed the WGS reaction in a Pd alloy MR by a 1D non-isothermal model. [103,157] The influence of feed side pressure was evaluated in terms of conversion. They reported that conversion was always higher in the MR than in TR; also conversion exceeding the equilibrium limit could be obtained at temperature higher than 250 o C and feed pressure greater than 400 kpa. Two-dimensional models are expected to give better simulation of the MR performance because they consider mass transfer resistance in the radial direction. [158] Koukou et al. used two models to simulate the WGS reaction in an adiabatic MR: (i) the simplified model assuming plug flow conditions and (ii) the dispersion model considering the non-ideal flow effects on the WGS MR. The conversion and the H 2 recovery predicted by the dispersion model were much lower than the values calculated by the simplified 83
100 plug flow model. The dispersion effects may influence the performance of the large industrial-scale membrane reactors significantly. [159] Markatos et al. used 2D models to investigate mass and heat dispersion effects on the performance of large-scale MR modules. It was concluded that the mass and heat dispersion effects cannot be neglected and their impact on the membrane reactor operation depends on the process characteristics. [152] Oyama et al. studied the 1D and 2D model analyses in methane steam reforming reactors. Both models predicted the experimental data well, but the 2D model agreed better to the experimental data than 1D model especially at high pressures. This was because the 2D model correctly predicted a decrease in partial pressures of hydrogen which lowers the driving force for permeation of hydrogen and thus reduces calculated methane conversions. [158] Francesconi et al. used an 1D pseudohomogeneous steady-state model and compared to a 2D model which considering mass and temperature gradients in both the axial and radial directions of the reactor tube. They found that differences due to radial variation were negligible, and that the 1D model is sufficient for steady-state considerations. [160] In this Chapter, simple, 1D models are established for simulating the WGS reaction the zeolite disc membrane reactor. The influences of membrane H 2 separation and WGS reaction conditions on the reactor performance are investigated through model calculations in comparisons with experimental results. 4.1 Model for WGS MR Simulations 84
101 4.1.1 Kinetic Equations The conditions utilized for the experiment and the simulation are listed in Table 4.1. The WGS reaction in a TR was also simulated for validation of the kinetic models. The specific MR and TR operating conditions are given in Table 4.1. Table 4. 1 WGS membrane reaction conditions used in the experiment and the simulation Parameter Experiment Simulation Temperature range, o C 400 ~ ~ 550 Retentate pressure at exit, atm 2 ~ 6 2 ~ 50 Permeate pressure, atm 1 1 Feed steam-to- ratio (R H2O/ ), mol/mol 1.0 ~ ~ 10.0 Weight hourly space velocity (WHSV), h -1 7,500 ~ 60,000 7,500 ~ 60,000 N 2 sweeping flow rate (F N2 ), cm 3 (STP)/min 0 ~ 40 0 ~ 100 The weight of Fe/Ce catalyst, mg ~ 2,000 Fe/Ce catalyst load, mg-catalyst/cm 2 -membane ~ 790 H 2 permeance, 10-7 mol/m 2.s.Pa 0.83 ~ ~ 10.3 H 2 / permselectivity 12.6 ~ ~ 100 The membrane permeance at different temperatures for gases involved in the WGS reaction are obtained by the following equation fitted from experimental data based on the activated diffusion mechanism [31] : 85
102 P m, i o E, i = P, exp( a m i ) ( i = H 2, 2, ) (4.1) RT The gas permeation properties of the disc MFI zeolite membranes for simulation are listed in table 4.2 for temperature of 500 o C as an example. Table 4. 2 permeation properties for the zeolite membrane at 500 o C Membrane H 2 H 2 O 2 N 2 d k, nm M w, g/mol M01-A: P m, 10-7 mol/m 2.s.Pa o M01-A: α H 2/ i E a,i, kj/mol M01-B: P m, 10-7 mol/m 2.s.Pa o M01-B: α H 2/ i E a,i, kj/mol The WGS reaction rate r A (mol/m 2.s.Pa) is given by the power law equation: p p 1 p p a b H 2O 2 H 2 A = k 1 c d p 2 ph 2 Ke ph 2O p r and exp Ea k = k0 RT (4.2) where P i is the partial pressure of the component i in the reaction system (Pa), K e is the overall reaction equilibrium constant, k 0 is the pre-exponential factor, E a is the activation energy (kj mol -1 ), R is kj mol -1 K -1, T is the reaction temperature (K), and a, b, c, and d are reaction order of, 86
103 H 2 O, 2, H 2, respectively. [161] The equilibrium constant (K e ) of the reaction is given by K e p p 2 H 2O p p H 2 e and Er K e = K o exp (4.3) RT where the subscript e denotes equilibrium state. The energy constant E r of the exothermic WGS reaction is a positive value, i.e. E r = kjmol -1 with K o = Thus K e decreases as temperature increases. [162,163] To obtain kinetic parameters in the power-law form rate equation (4.2), a series of experiments have been carried out in the TR packed with the Fe/Ce catalyst in the temperature ranges of o C and atmospheric pressure. Based on the experimental data, the plots of ln[wgs reaction rate] versus ln[component partial pressure] were obtained at each temperature as shown in Figure 4.1 (a). The slope of each straight line in the log log plots was used to determine the apparent reaction order for each individual component. For the Fe/Ce catalyst, the rate of the WGS reaction was approximately proportional to the concentration (i.e., a is ~1). The H 2 O concentration affects the reaction rate positively (d is slightly positive) because of the relatively low value of R H2O/ used unlike in the case of very largely excessive steam used in the literatures. [161] 87
104 -11.5 ln (reaction rate), mol/g.s H 2 ln P, kpa H 2 O 2 H2 H2O (a) ln(k) E a =-121kJ/mol /T. K -1 Figure 4. 1 Results of WGS reaction over Fe/Ce catalyst in TR: (a) reaction rates vs. gas partial (b) pressures; and (b) Arrhenius plot of reaction kinetic coefficient. 88
105 To obtain the activation energy (E a ) and the pre-exponential factor (k 0 ), experiments were carried out when temperature was varied from 450 to 500 o C. Figure 4.1 (b) presents the WGS reaction rates vs. inverse temperature values. The values of slopes (-E a /R) of the linear plots were determined through linear least-square-fitting, and the obtained activation energy was found to be 121 kj mol -1. The final power-law reaction rate expression for the WGS reaction over the current Fe/Ce catalyst was thus obtained: r A = ± ± 1.00 exp( ) P 3 10 RT 1.05± 0.05 P 0.07± 0.03 H 2O P 0.06± P 0.04± 0.02 H K e P P 2 P P H 2 H 2O (4.4) Membrane Reactor Model Establishment The membrane reactor modeling is based on the following assumptions: i. The reactor operates isothermally at steady-state; ii. The mixture is treated as ideal gas and permeance is independent of pressure; iii. The mass transport resistances in the thin layer (<0.06mm) of packed catalyst are negligible; mass-transfer resistance through the macropore α-alumina support is also negligible; iv. Based on (iii), the one-dimension model applies, i.e. no concentration gradient along the small thickness of the catalyst layer; v. To simulate the reaction behavior, two flow configurations are considered: (1) Plug flow reactor (PFR) and (2) continuous stirred-tank reactor (CSTR). [164] For PFR model, both 89
106 feed/reaction side and permeate side are of plug flow condition; and for CSTR both sides of the membrane have uniform concentrations. (a) CSTR n = V ρ ν r i B i A F i, in F i, out Catalyst bed Zeolite Membrane Support Q = AP P i m, i i (b) PFR δ dz L dn = L( dz) δρ ν r i B i A F i, in F i, out Catalyst bed Zeolite Membrane Support dq = L( dz) P P i m, i i L dz Figure 4. 2 The MR models: (a) CSTR and (b) PFR. For CSTR model in Figure 4.2 (a), The mass balance equations are given below. In the feed side: In the permeate side: F F = n Q = V ρ ν r AP P (4.5) i, out i, in i i B i A m, i i 90
107 Q = AP P (4.6) i m, i i where F i is the molar flow rate in the feed side (mol/s), n i is the molar flow rate produced in the reactor (mol/s), V is the volume of the catalyst bed (m 3 ), ρ B is the bulk density of catalyst bed (g/m 3 ), v i is the stoichiometric coefficient of species i (-1 for and H 2 O, +1 for 2 and H 2, and 0 for N 2 ), r A is the reaction rate for WGS reaction (mol/g.s), A is the membrane area (m 2 ), P m,i is the permeance of component i (mol/m 2.s.Pa), P i is the partial pressure difference of specie i between the feed side and the permeate side (Pa), and Q i is the molar flow rate in the permeate side (mol/s). For PFR model depicted in Figure 4.2 (b), because of the small membrane area, the membrane is treated in rectangular shape of equivalent area. The differential mass balance equations are following: In the feed side: df i = F F = dn dq i z+dz i z i i =ν i r A ρ B (Lδ)dz P m,i ( P i )Ldz (4.7) In the permeate side: dq = LdzP P (4.8) i m, i i where F i is the molar flow rate in the feed side (mol/s), dn i is the reaction rate (mol/s), L is the length of the catalyst-bed fragment (m), δ is the height of the catalyst bed (m), dz is the differential length of catalyst bed (m), ρ B is the density of catalyst bed (g/m 3 ), v i is the stoichiometric coefficient of species i, r A is the reaction rate for WGS reaction (mol/g.s), P i is the partial pressure difference of specie i between the feed side and the permeate side (Pa), dq i is the molar flow rate through the permeate (mol/s) and P m,i is the permeance of component i (mol/m 2.s.Pa). For CSTR, equations 4.5 and 4.6 are solved by an iterative process. For the PFR, equations 4.7 and 4.8 are solved numerically using a large matrix number of 150 by Matlab R2011a. By setting Q i = 0 (or 91
108 P m,i = 0) in equations 4.5 and 4.7, these two equations describe CSTR traditional reactor and PFR traditional reactor, respectively. The schematic diagrams of the reactor model, mass balance equations, kinetic equations, simulation algorisms, and computer programs are provided in the Appendix. The comparison between PFR and CSTR is made based on the deviations between the calculated and experimental data of χ. The calculations were performed for WGS reaction at 500 and 550 o C and reaction pressures of 2 and 6 atm, respectively. The relative deviations for the PFR and CSTR models are given in Table 4.3 and the calculated and experimental χ values are also shown in Figure 4.3. As presented in Table 4.3, the results simulated by the PFR model were much better than the results of CSTR model. The relative deviations for the PFR model calculation was in a range of -0.7 to 3.0% but the deviations for the CSTR model ranged from to -0.5%. The PFR model performed better than the CSTR model because of large aspect ratio of (δ/z), i.e. (Reactor-length)/(Catalyst-layer-thickness), which leads to large concentration or partial pressure gradient along the flow direction (Z). Table 4. 3 Comparison between experimental and simulation results by PFR and CSTR models* Relative deviation, % Pressure Temperature PFR CSTR (atm) ( o C) MR TR MR TR * WHSV of 7,500 h -1, R H2O/ of 3.5, the permeate side pressure of 1 atm and sweep flow rate of 20 cm 3 /min 92
109 χ, % T=550 o C P feed, atm Eq MR EXP MR SIM TR EXP TR SIM (a) χ, % T=550 o C Eq MR EXP MR SIM TR EXP TR SIM P feed, atm (b) Figure 4. 3 Comparison of χ between experimental data and model calculations (a) PFR, (b) CSTR ( WHSV of 7,500 h -1, R H2O/ of 3.5, P p of 1 atm and F N2 of 20 cm 3 /min). 93
110 4.2 WGS MR Simulation The one-dimensional isothermal PFR model was employed for simulation of WGS reaction in the zeolite disc MR. First, model calculations were conducted using the actual membrane properties of M01-A and M01-B and operation conditions used in the experiments to compare the theoretical and experimental results. Second, model simulations were performed to examine the effects of membrane performance (H 2 separation factor and permeance) and the operation conditions (temperature and pressure) on χ in the MR. Third, the effects of operational parameters including the feed side pressure, R H2O/, WHSV, F N2, and the catalyst load were investigated for the membranes developed in this study Comparison between Simulation and Experimental Data Simulation of the WGS MR performance was conducted by the one dimensional PFR model. The actual membrane properties including H 2 selectivity and gas permeance of M01-A and M01-B were used in the model calculations of χ to compare with the experimental values of χ in the two MRs. Effects of temperature and pressure. Figure 4.4 present the χ for M01-A as a function of reaction pressure at different temperatures. The simulation results agreed satisfactorily with the experimental data. At all temperatures, the deviation is larger at low pressure. This is likely because of the slow reaction with low partial pressures of reactants that results in relatively high partial pressure and more permeation through the membrane. Another possible cause is the assumption of negligible mass transport resistances in the catalyst bed and alumina substrate. At low pressure, the actual mass transport 94
111 resistances may have greater influence on the H 2 -removal efficiency under small driving force. The under estimated mass transport resistance may also cause the MR to perform below the model prediction. 100 X co,e 90 χ, % T = 400 o C MR EXP MR SIM P feed, atm (a) 100 X co,e 90 χ, % T = 450 o C MR EXP MR SIM P feed, atm (b) 95
112 X co,e χ, % T = 500 o C MR EXP MR SIM P feed, atm (c) X co,e χ, % T = 550 o C MR EXP MR SIM P feed, atm (d) Figure 4. 4 Comparison of experimental and simulated χ in M01-A (WHSV = 7,500 h -1, R H2O/ = 3.5, F N2 = 20 cm 3 /min, and P p of 1 atm): (a) 400 o C, (b) 450 o C, (c) 500 o C, and (d) 550 o C. 96
113 Figure 4.5 shows the comparison between the simulated and experimental χ values for M01-B and corresponding TR. The model simulated results agreed very well with the experimental data. The deviation between simulated and experimental χ in M01-B is smaller than is in M01-A. This may be explained by taking into account the difference in membrane quality. Membrane M01-B had much higher H 2 selectivity than M01-A and thus much less permeation of through the membrane. The under estimation of permeation through the membrane at low pressure is therefore insignificant in M01-B χ, % T=400 o C P feed, atm Eq MR EXE MR SIM TR EXE TR SIM (a) 97
114 χ, % T=450 o C P feed, atm Eq MR EXE MR SIM TR EXE TR SIM (b) χ, % T=500 o C P feed, atm Eq MR EXP MR SIM TR EXP TR SIM (c) 98
115 χ, % T=550 o C P feed, atm Eq MR EXP MR SIM TR EXP TR SIM (d) Figure 4. 5 Comparison of experimental and simulated χ in M01-B and TR (WHSV = 7,500 h -1, R H2O/ = 3.5, F N2 = 20 cm 3 /min, and P p of 1 atm): (a) 400 o C, (b) 450 o C, (c) 500 o C, and (d) 550 o C. Effect of R H2O/. Figure 4.6 presents the simulated χ as a function of R H2O/ in M01-B and TR in comparison with the experimental data. The model predicted the right trends of χ in response to changes in R H2O/ and the deviations between the simulated and experimental data are quite small at both 2 atm and 6 atm of operation pressure especially in the TR. The model however, slightly under predicted the χ at low R H2O/ (e.g. R H2O/ = 1 ~ 1.5). One possible cause of this under-predicted χ might come from overestimated and H 2 O permeation at low R H2O/. The model considers χ = 0 when the feed first contacting the membrane surface. However, in actual process, the feed side 99
116 stream needs to go through the catalyst bed to reach the membrane surface at very beginning. Thus, at the membrane surface near feed entrance, the model simulation uses much higher and H 2 O concentration/partial pressures than in real situation that leads to over predicted and H 2 O leaking. This over prediction of reactant permeation has greater influence on the calculated χ when R H2O/ is low, especially near stoichiometric ratio of 1. This analysis can be supported by the fact that χ was not under estimated by the model in the TR χ, % T = 550 o C P feed = 2.0 atm R H2O/ Eq MR EXP MR SIM TR EXP TR SIM (a) 100
117 χ, % T = 550 o C P feed = 6.0 atm Eq MR EXP MR SIM TR EXP TR SIM R H2O/ (b) Figure 4. 6 Comparison between the simulated and experimental χ as a function of R H2O/ in M01-B and TR at reaction pressure of 2 and 6 atm, respectively (T = 550 o C, WHSV = 7,500 h -1, 550 o C, p p = 1 atm, F N2 = 20 cm 3 /min): (a) 2 atm and (b) 6 atm. Effect of WHSV. Figure 4.7 shows the simulated and experimental results on the effect of WHSV on χ in the MR and the TR from 7,500 h -1 to 60,000 h -1 under fixed R H2O/ of 3.5 and temperature of 550 o C. The simulated χ agreed well with the experimental findings for both MR (M01-B) and TR. In the MR case however, the simulated χ tend to be lower than the experimental values at both 2 and 6 atm of reaction pressures while such underestimation by the model was not observed for the TR. 101
118 χ, % T=550 o C Pfeed=2 atm WHSV, h -1 Eq MR EXP MR SIM TR EXP TR SIM (a) 100 χ, % T=550 o C Pfeed=6 atm Eq MR EXP MR SIM TR EXP TR EXP WHSV, h -1 (b) Figure 4. 7 Effect of WHSV on χ in M01-B and TR at 550 o C, R H2O/ of 3.5, permeate pressure of 1 atm, and F N2 of 20 cm 3 /min. (a) at p feed of 2 atm and (b) at p feed of 6 atm. 102
119 Effect of F N2. The sweep flow rate F N2 changes the driving force for gas membrane permeation. In Figure 4.8, the χ in the MR and the TR as a function of F N2 were compared between the simulated and experimental values. The simulation and experimental conditions are fixed WHSV of 7,500 h 1, R H2O/ of 3.5 and temperature of 500 o C. The χ in the MR increased with raising F N2 because higher F N2 decreased the H 2 partial pressure and generated higher driving force for H 2 transport through the membrane. The predicted χ from modeling was found to be in excellent agreement with the experimental results. 100 χ, % T=500 o C R H2O/ =3.5 Pfeed=2atm F N2, cm 3 /min Eq MR EXP MR SIM TR EXP TR SIM (a) 103
120 100 χ, % T=500 o C R H2O/ =3.5 Pfeed=6atm F N2, cm 3 /min Eq MR EXP MR SIM TR EXP TR SIM (b) Figure 4. 8 Effect of N 2 sweeping flow rate on χ in M01-B membrane reaction and TR operation at 550 o C, WHSV of 7,500 h -1, permeate pressure of 1 atm, and F N2 of 20 cm 3 /min: (a) at p feed of 2 atm and (b) p feed of 6 atm Simulation of WGS MR in M01-A for Mixture Feeds For the 40%+30%H 2 +30% 2 mixture feed, model simulations were performed for membrane reaction in M01-A and TR. The results are presented in Figures 4.9 to Figure The simulated data are in good agreement with the experimental results, indicating that the simple one dimensional PFR model is capable of quantitative calculation of the zeolite disc membrane reactor. 104
121 χ, % T=400 o C P feed, atm Eq MR EXE MR SIM TR EXE TR SIM (a) χ, % T=450 o C P feed, atm Eq MR EXE MR SIM TR EXE TR SIM (b) 105
122 χ, % T=500 o C P feed, atm Eq MR EXP MR SIM TR EXP TR SIM (c) χ, % T=550 o C P feed, atm Eq MR EXP MR SIM TR EXP TR SIM (d) Figure 4. 9 Comparison of simulated and experimental χ for /H 2 / 2 mixture feed in M01-A (MR) and TR (R H2O/2 of 3.5 and WHSV of 7,500 h -1 ): (a) 400 o C, (b) 450 o C, (c) 500 o C, and (d) 550 o C. 106
123 χ, % T = 550 o C P feed = 2.0 atm R H2O/ Eq MR EXP MR SIM TR EXP TR SIM (a) χ, % T = 550 o C P feed = 6.0 atm Eq MR EXP MR SIM TR EXP TR SIM R H2O/ (b) Figure Comparison of simulated and experimental χ as a function of R H2O/2 for /H 2 / 2 mixture feed in M01-A (MR) and TR (at 550 o C and WHSV of 7,500 h -1 ): (a) 2 atm and (b) 6 atm. 107
124 χ, % 60 T=550 o C Pfeed=2 atm Eq MR EXP MR SIM TR EXP TR SIM WHSV, h -1 (a) χ, % 60 T=550 o C Pfeed=6 atm Eq MR EXP MR SIM TR EXP TR SIM WHSV, h -1 (b) Figure Comparison of simulated and experimental χ as a function of WHSV for /H 2 / 2 mixture feed in M01-A (MR) and TR (at 550 o C and R H2O/2 of 3.5): (a) 2 atm and (b) 6 atm. 108
125 100 χ, % T=500 o C R H2O/ =3.5 Pfeed=2atm F N2, cm 3 /min Eq MR EXP MR SIM TR EXP TR SIM 100 (a) χ, % T=500 o C R H2O/ =3.5 Pfeed=6atm F N2, cm 3 /min (b) Eq MR EXP MR SIM TR EXP TR SIM Figure Comparison of simulated and experimental χ as a function of F N2 for /H 2 / 2 feed in M01-A (MR) and TR (at 550 o C, WHSV of 7,500 h -1, and R H2O/2 of 3.5): (a) 2 atm and (b) 6 atm. 109
126 4.2.3 Simulation Study of the Effects of Membrane Quality and Operation Conditions on WGS MR Performance Effects of Reaction Temperature and Pressure. Model calculations were made based on the membrane properties of M01-A and M01-B to study the effects of operation temperature and pressure on the MR performance in terms of χ. The simulations used a catalyst load of 200 mg (78.7 mg/cm 2 -membrane), WHSV of 7,500 h -1, R H2O/ of 3.5 for M01-A and M01-B, respectively. The simulated χ are presented in 3-D plots of Figure 4.13 as functions of temperature and pressure. In both membranes, the χ increases with increasing temperature and reaction pressure due to the faster reaction at higher temperature and greater H 2 flux at higher reaction pressure (constant permeate side pressure). The simulation results indicate that for the current membrane of moderate H 2 selectivity and permeance, high χ can still be achieved by operating at sufficiently high temperature and pressure. The M01-B MR is able to obtain χ higher than that in M01-A at all conditions due to the reduced loss in M01-B which had higher H 2 -selectivity. However, the χ tends to level off after temperature and pressure reach certain points. Thus, from the standpoint of energy and cost effectiveness, the operation temperature and pressure need to be optimized. 110

 M01-A and (b)")
127 (a) M01-A (b) M01-B Figure χ as functions of operation temperature and pressure in (a) M01-A and (b) M01-B. 111
128 Effects of Membrane Quality. Simulation study of the effect of membrane quality on the WGS membrane reaction was carried out by evaluating the χ as functions of separation factor ( a H 2 / 2 ) and H 2 permeance (P m,h2 ). The simulations used a catalyst load of 200 mg (78.7 mg/cm 2 -membrane), WHSV of 7,500 h -1, R H2O/ of 3.5 at reaction pressure of 2 atm and atmospheric pressure in permeate. The simulated χ are presented as functions of H 2 / 2 a and H 2 permeance (P m,h2 ) in Figure In both membranes, the χ increases with increasing a H 2 / 2 and H 2 permeance. The χ starts to level off when a H 2 / 2 exceeds certain level at any given P m,h2 because the H 2 removal efficiency also depends on the flux. A high H 2 selectivity though always favors conversion enhancement by reducing the permeation of and H 2 O. However, the continuous increase of P m,h2 leads to a maximum χ at certain point after which further increasing the P m,h2 can cause slight decrease in χ. Figure 4.15 gives better observation of the reducing χ when permeance gets too high for the zeolite membrane. This is caused by the increasing permeation of unreacted or H 2 O through the imperfect membrane when the permeance is very high. Results of this simulation study indicate that improvements of a H 2 / 2 and H 2 permeance need to be sought together and individual property enhancement may have limited influence on WGS MR performance. 112

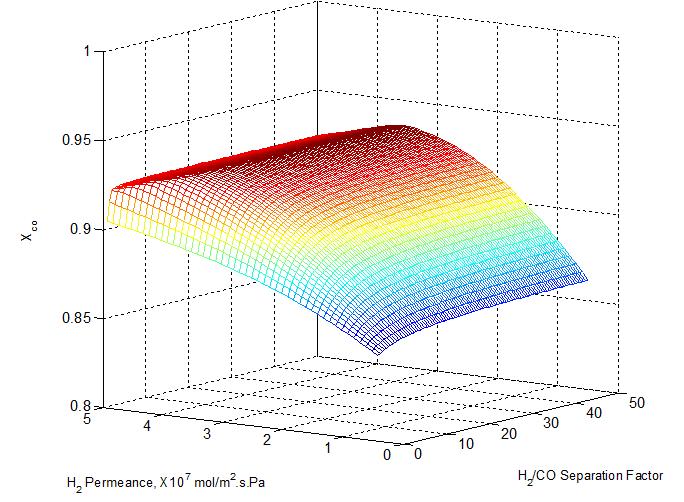
129 (a) (b) 113


130 (c) (d) Figure Effect of α H2/ and P m,h2 on χ (WHSV of 7,500 h -1, R H2O/ of 3.5, the reaction pressure of 2 atm, P p of 1 atm, and F N2 of 20 cm 3 /min): (a) 400 o C, (b) 450 o C, (c) 500 o C, and (d) 550 o C. 114
131 100 X co,e χ, % P feed = 2atm 500 o C a H2/ 10 SF SF SF J H2 /J 0 H2 Figure Effect of H 2 permeance on χ under WHSV of 7,500 h -1, R H2O/ of 3.5, the reaction pressure of 2 atm, P p of 1 atm, and F N2 of 20 cm 3 /min. Effect of Catalyst Load. In principle, the MR works at high efficiency when the actual rate of H 2 production by reaction matches the rate of H 2 permeation through the membrane. This ratio of (H 2 -production)/(h 2 -permetion) depends on the catalyst loading defined by (m: mg-cat./cm 2 -membrane; m o is 78.7 mg-cat./cm 2 -membrane used in this study). Figure 4.16 shows the simulation results of χ as functions of catalyst load and reaction pressure at various temperatures because the (H 2 -production) and (H 2 -permetion) are dependent of temperature, pressure and catalyst amount. It should be noted that the mass transport resistance changes under different catalyst loads are not considered in the model calculations. In Figure 4.17, it is clear that increasing the catalyst load enhances the χ but the enhancement tends to plateau at certain level depending on the specific reaction pressure. 115

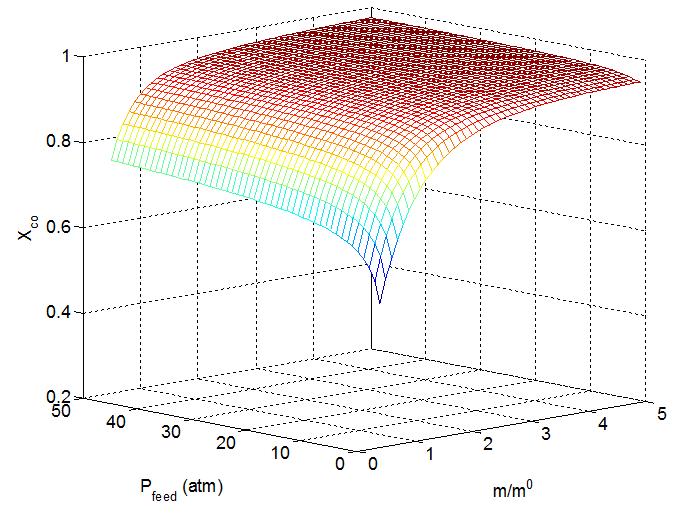
132 (a) (b) 116
: (a) 400 o C, (b) 450 o C, (c) 500 o C, and (d) 550 o C. 117")
133 (c) (d) Figure Effect of reaction pressure and catalyst load on χ at various temperatures in M01-A (WHSV = 7,500 h -1, R H2O/ = 3.5, the reaction pressure of 2 atm, P p of 1 atm, and F N2 of 20 cm 3 /min): (a) 400 o C, (b) 450 o C, (c) 500 o C, and (d) 550 o C. 117
Synthesis of Zeolite Composite Membranes for CO2 Separation
 Synthesis of Zeolite Composite Membranes for CO2 Separation April. 10. 2003 Sang Hoon Hyun, Dong Wook Shin, Young Eun Lee, Moon Hee Han*, and Churl Hee Cho* School of Materials Science & Engineering Yonsei
Hydrothermal Stability Analysis of Carbonised Template Molecular Sieve Silica Membranes
 Refereed Proceedings Separations Technology VI: New Perspectives on Very Large-Scale Operations Engineering Conferences International Year 2004 Hydrothermal Stability Analysis of Carbonised Template Molecular
Adsorption Processes. Ali Ahmadpour Chemical Eng. Dept. Ferdowsi University of Mashhad
 Adsorption Processes Ali Ahmadpour Chemical Eng. Dept. Ferdowsi University of Mashhad Contents Introduction Principles of adsorption Types of adsorption Definitions Brief history Adsorption isotherms Mechanism
Synthesis of Mesoporous ZSM-5 Zeolite Crystals by Conventional Hydrothermal Treatment
 Synthesis of Mesoporous ZSM-5 Zeolite Crystals by Conventional Hydrothermal Treatment Ming Zhou,* Ali A. Rownaghi, and Jonas Hedlund,* *Chemical Technology, Luleå University of Technology, SE-971 87 Luleå,
A Study on the Hydrothermal Synthesis of the Zeolite DDR
 A Study on the Hydrothermal Synthesis of the Zeolite DDR A Thesis submitted to the Division of Graduate Studies and Research of the University of Cincinnati in partial fulfillment of the requirements of
Technologies and Approaches of CO 2 Capture
 Southwest Regional Partnership Project Technologies and Approaches of CO 2 Capture Liangxiong Li, Brian McPherson, Robert Lee Petroleum Recovery Research Center New Mexico Institute of Mining and Technology,
Aviation Fuel Production from Lipids by a Single-Step Route using
 Aviation Fuel Production from Lipids by a Single-Step Route using Hierarchical Mesoporous Zeolites Deepak Verma, Rohit Kumar, Bharat S. Rana, Anil K. Sinha* CSIR-Indian Institute of Petroleum, Dehradun-2485,
Synthesis of highly b-oriented zeolite MFI films by suppressing. twin crystal growth during the secondary growth
 Supplementary Information Synthesis of highly b-oriented zeolite MFI films by suppressing twin crystal growth during the secondary growth Xianming Li, a Yong Peng, a Zhengbao Wang,* a and Yushan Yan a,
Be prepared to discuss the quantitative comparison method in the oral exam.
 Subject: Ring Experiment III 8 Shell and Tube Heat Exchanger Control The shell and Tube Heat Exchanger has two control valves: one on the process fluid flowing to the tubes and one on the cooling water
Synthesis of a Zeolite Column with a Monolithic Microhoneycomb Structure Using the Ice Template Method
 Synthesis of a Zeolite Column with a Monolithic Microhoneycomb Structure Using the Ice Template Method Shin R. Mukai, Shinya Murata, Kazufusa Onodera and Izumi Yamada *1 Graduate School of Engineering,
Synthesis and Properties of Zeolitic Membranes
 17 Synthesis and Properties of Zeolitic Membranes Sankar Nair* and Michael Tsapatsis University of Massachusetts Amherst, Amherst, Massachusetts, U.S.A. I. INTRODUCTION Zeolite-based separations involve
College of Mechanical Engineering, Yangzhou University, Yangzhou , China; 2
 Proceedings Light-Assisted Room-Temperature NO2 Sensors Based on Black Sheet-Like NiO Xin Geng 1,2,3, Driss Lahem 4, Chao Zhang 1, *, Marie-Georges Olivier 3 and Marc Debliquy 3 1 College of Mechanical
Template-Free Synthesis of Beta Zeolite Membranes on Porous α-al 2 O 3 Supports
 Electronic Supplementary Material (ESI) for ChemComm. This journal is The Royal Society of Chemistry 2014 Electronic Supplementary Information for Template-Free Synthesis of Beta Zeolite Membranes on Porous
Characterization of zeolites by advanced SEM/STEM techniques
 SCIENTIFIC INSTRUMENT NEWS 2016 Vol. 7 SEPTEMBER Technical magazine of Electron Microscope and Analytical Instruments. Article Characterization of zeolites by advanced SEM/STEM techniques Toshiyuki Yokoi
Hydrothermal Synthesis of Nanocrystalline Zeolite using Clear Solution
 Hydrothermal Synthesis of Nanocrystalline Zeolite using Clear Solution Syaifullah Muhammad 1 *, Izarul Machdar 1, Sofyana 1, Aris Munandar 1, Tuty Emilia Agustina 3 Edy Saputra 2, Shaobin Wang 4 and Moses
MASTER'S THESIS. Synthesis of NaX coated honeycombs in a continuous flow reactor
 MASTER'S THESIS 2010:076 Synthesis of NaX coated honeycombs in a continuous flow reactor Antoine Kinder Luleå University of Technology Master Thesis, Continuation Courses Chemical and Biochemical Engineering
Asian Journal on Energy and Environment
 As. J. Energy Env. 2006, 7(01), 241-245 Asian Journal on Energy and Environment ISSN 1513-4121 Available online at www.asian-energy-journal.info Hydrogen Production from Carbon Dioxide Reforming of Methane
Supplementary Information. Experimental Methods
 Extremely thin Pd-silica mixed-matrix membranes with nano-dispersion for improved hydrogen permeability Masakoto Kanezashi, Mitsunori Sano, Tomohisa Yoshioka, and Toshinori Tsuru Department of Chemical
Supporting Information. Nanoscale Kirkendall Growth of Silicalite-1 Zeolite Mesocrystals with. Controlled Mesoporosity and Size
 Electronic Supplementary Material (ESI) for ChemComm. This journal is The Royal Society of Chemistry 2015 Supporting Information Nanoscale Kirkendall Growth of Silicalite-1 Zeolite Mesocrystals with Controlled
Supporting information
 Supporting information Hierarchical Macro-meso-microporous ZSM-5 Zeolite Hollow Fibers With Highly Efficient Catalytic Cracking Capability Jia Liu, a Guiyuan Jiang,* a Ying Liu, a Jiancheng Di, b Yajun
Supplementary Information. Fluoride-free synthesis of Sn-BEA catalyst by dry gel conversion
 Electronic Supplementary Material (ESI) for Green Chemistry. This journal is The Royal Society of Chemistry 2015 Supplementary Information of Fluoride-free synthesis of Sn-BEA catalyst by dry gel conversion
DICP Course - Dalian, 2012 Preparation of solid catalysts Part 8 Supported by the Chinese Academy of Sciences
 DICP Course - Dalian, 2012 Preparation of solid catalysts Part 8 Supported by the Chinese Academy of Sciences Charles Kappenstein, Professor Emeritus, University of Poitiers, France Preparation of catalysts
Pressure Swing Adsorption: A Gas Separation & Purification Process
 Pressure Swing Adsorption: A Gas Separation & Purification Process Pressure swing adsorption is an adsorption-based process that has been used for various gas separation and purification purposes. Separation
Materials development for inorganic membrane layers at ECN
 Materials development for inorganic membrane layers at ECN B.C. Bonekamp Presented at XXV EMS Summerschool, Leuven, Belgium, September ECN-M--09-062 May Materials Development for Inorganic Membrane Layers
Supporting Information
 Supporting Information Tetraethylammonium hydroxide (35 wt.%) (TEAOH), aluminum powder, fumed silica, zinc acetate dehydrate, Ludox HS-40, pure silica MCM-41, and tetraethylammonium fluoride were purchased
Synthesis of zeolite crystallites for diffusion measurements
 Synthesis of zeolite crystallites for diffusion measurements Xiaobo Yang, Jürgen Caro Institut für Physikalische Chemie und Elektrochemie Leibniz Universität Hannover Main Activities in Previous Synthesis
Multi-stage synthesis of nanopore NaA zeolite membranes for separation of water/ethanol mixtures
 International Journal of Research in Engineering and Innovation Vol-1, Issue-6 (2017), 42-46 International Journal of Research in Engineering and Innovation (IJREI) journal home page: http://www.ijrei.com
Strategic use of CuAlO 2 as a sustained release catalyst for production of hydrogen from methanol steam reforming
 Electronic Supplementary Material (ESI) for ChemComm. This journal is The Royal Society of Chemistry 2018 Electronic Supplementary Information Strategic use of CuAlO 2 as a sustained release catalyst for
Design and Manufacturing of Catalytic Membrane Reactors by Developing New Nano-architectured Catalytic and Selective Membrane Materials
 Design and Manufacturing of Catalytic Membrane Reactors by Developing New Nano-architectured Catalytic and Selective Membrane Materials This project is supported by the European Community s Seventh Framework
Molecular Sieves Principles of Synthesis and Identification
 Molecular Sieves Principles of Synthesis and Identification Second Edition R. SZOSTAK Clark Atlanta University Atlanta, GA USA V D BLACKIE ACADEMIC & PROFESSIONAL An Imprint of Chapman & Hail London Weinheim
OMICS Group International is an amalgamation of Open Access publications
 About OMICS Group OMICS Group International is an amalgamation of Open Access publications and worldwide international science conferences and events. Established in the year 2007 with the sole aim of
MISCELLANEOUS SOLID-STATE COMPOUNDS
 Inorganic Syntheses, Volume 30 Edited by Donald W. Murphy, Leonard V. Interrante Copyright 1995 by Inorganic Syntheses, Inc. Chapter Six MISCELLANEOUS SOLID-STATE COMPOUNDS 43. ZEOLITE MOLECULAR SIEVES
Sustainable Energy Technologies
 Sustainable Energy Technologies Molecular Heterogeneous Catalysis Hydrogen Technology Renewable feedstocks Fuel cell catalysis Prof. Dr. Emiel Hensen Prof. Dr. Peter Notten Prof. Dr. Jaap Schouten Chemical
Electronic Supplementary Information (ESI) Efficient synthesis of the Cu-SSZ-39 catalyst for DeNOx applications
 Efficient synthesis of the Cu-SSZ-39 catalyst for DeNOx applications") Electronic Supplementary Material (ESI) for ChemComm. This journal is The Royal Society of Chemistry 2015 Electronic Supplementary Information (ESI) Efficient synthesis of the Cu-SSZ-39 catalyst for DeNOx
Electronic Supplementary Material (ESI) for ChemComm. This journal is The Royal Society of Chemistry 2015 Electronic Supplementary Information (ESI) Efficient synthesis of the Cu-SSZ-39 catalyst for DeNOx
m WILEY- ADSORBENTS: FUNDAMENTALS AND APPLICATIONS Ralph T. Yang Dwight F. Benton Professor of Chemical Engineering University of Michigan
 ADSORBENTS: FUNDAMENTALS AND APPLICATIONS Ralph T. Yang Dwight F. Benton Professor of Chemical Engineering University of Michigan m WILEY- INTERSCIENCE A JOHN WILEY & SONS, INC., PUBLICATION Preface xi
Research on Bipolar Membrane Electrodialysis for Ion Exchange of Molecular Sieves
 Scientific Research China Petroleum Processing and Petrochemical Technology 2018, Vol. 20, No. 2, pp 1-5 June 30, 2018 Research on Bipolar Membrane for Ion Exchange of Molecular Sieves Chen Beiyan 1 ;
Lecture 1: Vapour Growth Techniques
 PH3EC2 Vapour Growth and Epitaxial Growth Lecturer: Dr. Shinoj V K Lecture 1: Vapour Growth Techniques 1.1 Vapour growth The growth of single crystal materials from the vapour phase. Deposition from the
UT-3 Hydrogen Separation Process Mass Flow Rate Characterization and. Selection of Zirconium Silica Hydrogen Separator Membrane
 Chilton 1 UT-3 Hydrogen Separation Process Mass Flow Rate Characterization and Selection of Zirconium Silica Hydrogen Separator Membrane November 9, 2011 Lauren Chilton Abstract The thermochemical UT-3
Synthesis and Characterization of high-performance ceramic materials for hightemperature
 Synthesis and Characterization of high-performance ceramic materials for hightemperature CO 2 capture and hydrogen production. Location: Institute for Energy Technology (IFE), Kjeller, Norway Department
How Silica Aerogels Are Made
 Page 1 of 7 How Silica Aerogels Are Made Back to the Table of Contents The discussion below relies upon the following terms: Hydrolysis: The reaction of a metal alkoxide (M-OR) with water, forming a metal
RECENT DEVELOPMENT IN THE ZEOLITE MEMBRANE SYNTHESIS
 RECENT DEVELOPMENT IN THE ZEOLITE MEMBRANE SYNTHESIS L. GÓRA, J.C. JANSEN, A.W.C. van den BERG and Th. MASCHMEYER Laboratory for Applied Organic Chemistry and Catalysis, DelftChemTech, Delft University
Synthesis gas production via the biogas reforming reaction over Ni/MgO-Al 2 O 3 and Ni/CaO-Al 2 O 3 catalysts
 Synthesis gas production via the biogas reforming reaction over Ni/MgO-Al 2 O 3 and Ni/CaO-Al 2 O 3 catalysts N.D. Charisiou 1,2, A. Baklavaridis 1, V.G. Papadakis 2, M.A. Goula 1 1 Department of Environmental
Process Design Decisions and Project Economics Prof. Dr. V. S. Moholkar Department of Chemical Engineering Indian Institute of Technology, Guwahati
 Process Design Decisions and Project Economics Prof. Dr. V. S. Moholkar Department of Chemical Engineering Indian Institute of Technology, Guwahati Module - 2 Flowsheet Synthesis (Conceptual Design of
PREPARATION OF MCM-48 MESOPOROUS MOLECULAR SIEVE INFLUENCE OF PREPARATION CONDITIONS ON THE STRUCTURAL PROPERTIES
 Digest Journal of Nanomaterials and Biostructures Vol. 11, No. 1, January - March 2016, p. 271-276 PREPARATION OF MCM-48 MESOPOROUS MOLECULAR SIEVE INFLUENCE OF PREPARATION CONDITIONS ON THE STRUCTURAL
Supporting Information High Activity and Selectivity of Ag/SiO 2 Catalyst for Hydrogenation of Dimethyloxalate
 Supporting Information High Activity and Selectivity of Ag/SiO 2 Catalyst for Hydrogenation of Dimethyloxalate An-Yuan Yin, Xiao-Yang Guo, Wei-Lin Dai*, Kang-Nian Fan Shanghai Key Laboratory of Molecular
CHAPTER 4. SYNTHESIS, CHARACTERIZATION OF TiO 2 NANOTUBES AND THEIR APPLICATION IN DYE SENSITIZED SOLAR CELL
 93 CHAPTER 4 SYNTHESIS, CHARACTERIZATION OF TiO 2 NANOTUBES AND THEIR APPLICATION IN DYE SENSITIZED SOLAR CELL 4.1 INTRODUCTION TiO 2 -derived nanotubes are expected to be applicable for several applications,
Synthesis of Zeolite Monolith with Hierarchical Micro/Macropores by Ice-Templating and Steam-Assisted Crystallization
 A publication of 259 CHEMICAL ENGINEERING TRANSACTIONS VOL. 32, 213 Chief Editors: Sauro Pierucci, Jiří J. Klemeš Copyright 213, AIDIC Servizi S.r.l., ISBN 978-88-9568-23-5; ISSN 1974-9791 The Italian
Synthesis of ordered microporous carbons via template technique
 Synthesis of ordered microporous carbons via template technique Zhou Ying, Yao Qimei, Qiu Jieshan *, Guo Hongchen, Sun Zongwei Carbon Research Laboratory, Center for Nano Materials and Science, School
CONVERSION OF ETHANOL TO OLEFINS OVER HZSM-5 CATALYSTS
 CONVERSION OF ETHANOL TO OLEFINS OVER HZSM-5 CATALYSTS P. R. S. SALBEGO *1, G. S. N. M. CENTENARO 1, R. KLAIC 1, N. I. CANABARRO 1, T. K. MULLER 1, M. A. MAZUTTI 1, E. L. FOLETTO 1, S. L. JAHN 1 1 Universidade
Electronic Supplementary Information (ESI)
") Electronic Supplementary Information (ESI) Cu-SSZ-39, an active and hydrothermally stable catalyst for the selective catalytic reduction of NOx Manuel Moliner, *a Cristina Franch, a Eduardo Palomares,
Electronic Supplementary Information (ESI) Cu-SSZ-39, an active and hydrothermally stable catalyst for the selective catalytic reduction of NOx Manuel Moliner, *a Cristina Franch, a Eduardo Palomares,
Electronic Supplementary Information
 Electronic Supplementary Information Designed Copper-amine Complex as an Efficient Template for One-pot Synthesis of Cu-SSZ-13 Zeolite with Excellent Activity for Selective Catalytic Reduction of NOx by
Report on Preparation of Nanotemplates for mab Crystallization
 Deliverable number D2.1 Due date 30/09/2017 Deliverable title Report on Preparation of Nanotemplates for mab Crystallization Issue date 21/09/2017 WP number WP2 Author(s) J. Heng, W. Chen, H. Yang Lead
Solvent-free Synthesis of Zeolites from Solid Raw Materials
 Solvent-free Synthesis of Zeolites from Solid Raw Materials Limin Ren, Qinming Wu, Chengguang Yang, Longfeng Zhu, Caijin Li, Pengling Zhang, Haiyan Zhang, Xiangju Meng,*, Feng-Shou Xiao*, Department of
Rapid and Mass Production of Porous Materials Using a Continuous Microwave Equipment
 Rapid and Mass Production of Porous Materials Using a Continuous Microwave Equipment Dae Sung Kim, Ji Man Kim, Jong-San Chang, and Sang-Eon Park* Catalysis Center for Molecular Engineering, Korea Research
Dry-gel conversion synthesis of Cr-MIL-101 aided by grinding: High surface area high yield synthesis with minimum purification
 Electronic Supporting Informations (ESI): Dry-gel conversion synthesis of Cr-MIL-101 aided by grinding: High surface area high yield synthesis with minimum purification Jun Kim, Yu-Ri Lee and Wha-Seung
Lecture (9) Reactor Sizing. Figure (1). Information needed to predict what a reactor can do.
 Reactor Sizing. Figure (1). Information needed to predict what a reactor can do.") Lecture (9) Reactor Sizing 1.Introduction Chemical kinetics is the study of chemical reaction rates and reaction mechanisms. The study of chemical reaction engineering (CRE) combines the study of chemical
Lecture (9) Reactor Sizing 1.Introduction Chemical kinetics is the study of chemical reaction rates and reaction mechanisms. The study of chemical reaction engineering (CRE) combines the study of chemical
MetE 215 Sol-Gel Processing
 MetE 215 Sol-Gel Processing 1. Introduction 1.1 Glass from liquid precursors: What is sol-gel? Glasses are usually prepared by mixing the different oxides precursors (carbonates, nitrates, sulfates, oxides..)
John Falconer Richard Noble
 DOE/MC/27 15-95/C478 Zeolite Membranes for Gas Separations uthors: John Falconer Richard Noble Con tractor: University of Colorado at Boulder Department of Chemical Engineering Boulder, Colorado 839-424
CO 2 capture by Adsorption Processes: From Materials to Process Development to Practical Implementation
 CO 2 capture by Adsorption Processes: From Materials to Process Development to Practical Implementation Paul A. Webley Dept. of Chemical Engineering Talloires, July 2010 Outline Adsorption for Post-Combustion
Electronic Supplementary Information
 Electronic Supplementary Material (ESI) for CrystEngComm. This journal is The Royal Society of Chemistry 2017 Electronic Supplementary Information Engineering Growth Defects: A New Route Towards Hierarchical
Propylene: key building block for the production of important petrochemicals
 Propylene production from 11-butene and ethylene catalytic cracking: Study of the performance of HZSMHZSM-5 zeolites and silicoaluminophosphates SAPO--34 and SAPOSAPO SAPO-18 E. Epelde Epelde*, *, A.G.
Characterization of NaA Zeolite Oxygen Permeable Membrane on TiO 2 / -Al 2 O 3 Composite Support
 Characterization of NaA Zeolite Oxygen Permeable Membrane on TiO 2 / -Al 2 Composite Support ZHU Mengfu 1,a*, SU Hongbo 1,b, DENG Cheng 1,c, YUWEN Linlin 1,d and JIANG Mingming 1,e 1 Institute of Medical
Electronic Supporting Information
 Electronic Supplementary Material (ESI) for Journal of Materials Chemistry A. This journal is The Royal Society of Chemistry 2015 Electronic Supporting Information 3D ordered macroporous TiO 2 -supported
SINOPEC MTP and MTX technologies
 COPYRIGHT@SUNJUNNAN COPYRIGHT@SUNJUNNAN 18-19 th, July, 2016, Parsian Azadi Hotel, Tehran, Iran Methanol+Toluene to Xylenes SINOPEC MTP and MTX technologies July 18 th, 2016 CONTENT MTP Introduction S-MTP
BAE 820 Physical Principles of Environmental Systems
 BAE 820 Physical Principles of Environmental Systems Catalysis of environmental reactions Dr. Zifei Liu Catalysis and catalysts Catalysis is the increase in the rate of a chemical reaction due to the participation
Precious Metal-free Electrode Catalyst for Methanol Oxidations
 Electronic Supplementary Material (ESI) for Energy & Environmental Science. This journal is The Royal Society of Chemistry 2015 Supporting information SnO 2 Nanocrystals Decorated-Mesoporous ZSM-5 Spheroidicity
EXECUTIVE SUMMARY. especially in last 50 years. Industries, especially power industry, are the large anthropogenic
 EXECUTIVE SUMMARY Introduction The concentration of CO 2 in atmosphere has increased considerably in last 100 years, especially in last 50 years. Industries, especially power industry, are the large anthropogenic
GCSE CHEMISTRY REVISION LIST
 GCSE CHEMISTRY REVISION LIST OCR Gateway Chemistry (J248) from 2016 Topic C1: Particles C1.1 Describe the main features of the particle model in terms of states of matter and change of state Explain, in
PREPARATION OF ACTIVATED CARBON FROM PULP AND PAPER MILL WASTES TO BE TESTED FOR THE ADSORPTION OF VOCS
 PREPARATION OF ACTIVATED CARBON FROM PULP AND PAPER MILL WASTES TO BE TESTED FOR THE ADSORPTION OF VOCS A. GREGÓRIO *, A. GARCIA-GARCIA #, D. BOAVIDA *, I. GULYURTLU * AND I. CABRITA * * Department of
Electronic Supplementary Information (ESI)
") Electronic Supplementary Information (ESI) Experimental details 1. Preparation of KIT-6 mesoporous silica: Conc. HCl solution (37 wt%) and Pluronic P123 were dissolved in water. After the dissolution,
Electronic Supplementary Information (ESI) Experimental details 1. Preparation of KIT-6 mesoporous silica: Conc. HCl solution (37 wt%) and Pluronic P123 were dissolved in water. After the dissolution,
Chapter 8: Summary and Conclusions. This thesis is the result of two separate pieces of zeolite science research that address
 204 Chapter 8: Summary and Conclusions 1. Summary and Conclusions This thesis is the result of two separate pieces of zeolite science research that address different issues in the development of new synthetic
Gas Permeation Study Using Porous Ceramic Membranes
 Energy and Environment Research; Vol. 4, No. 3; 2014 ISSN 1927-0569 E-ISSN 1927-0577 Published by Canadian Center of Science and Education Gas Permeation Study Using Porous Ceramic Membranes Mohammed N.
Comparison of acid catalysts for the dehydration of methanol to dimethyl ether
 Proceedings of European Congress of Chemical Engineering (ECCE-6) Copenhagen, 16-2 September 27 Comparison of acid catalysts for the dehydration of methanol to dimethyl ether I. Sierra, J. Ereña, A. T.
Carbon dioxide removal processes by alkanolamines in aqueous organic solvents Hamborg, Espen Steinseth
 University of Groningen Carbon dioxide removal processes by alkanolamines in aqueous organic solvents Hamborg, Espen Steinseth IMPORTANT NOTE: You are advised to consult the publisher's version (publisher's
Modeling of Electrochemical Cells: HYD Lecture 08. Composite Membranes
 Modeling of Electrochemical Cells: Proton Exchange Membrane Fuel Cells HYD7007 01 Lecture 08. Composite Membranes Dept. of Chemical & Biomolecular Engineering Yonsei University Spring, 2011 Prof. David
Supplementary Figure 1. SEM and TEM images of the metal nanoparticles (MNPs) and metal oxide templates.
 and metal oxide templates.") Supplementary Figure 1. SEM and TEM images of the metal nanoparticles (MNPs) and metal oxide templates. (a) 13 nm Au, (b) 60 nm Au, (c) 3.3 nm Pt, (d) ZnO spheres, (e) Al 2O 3 spheres and (f) Cu 2O cubes.
Supplementary Figure 1. SEM and TEM images of the metal nanoparticles (MNPs) and metal oxide templates. (a) 13 nm Au, (b) 60 nm Au, (c) 3.3 nm Pt, (d) ZnO spheres, (e) Al 2O 3 spheres and (f) Cu 2O cubes.
Edexcel Chemistry Checklist
 Topic 1. Key concepts in chemistry Video: Developing the atomic model Describe how and why the atomic model has changed over time. Describe the difference between the plum-pudding model of the atom and
SUPPORTING INFORMATION
 Nucleation of FAU and LTA Zeolites from Heterogeneous Aluminosilicate Precursors Matthew D. Oleksiak 1, Jennifer A. Soltis 2,4, Marlon T. Conato, 1,3 R. Lee Penn 2, Jeffrey D. Rimer 1* 1 University of
PRODUCTION HYDROGEN AND NANOCARBON VIA METHANE DECOMPOSITION USING Ni-BASED CATALYSTS. EFFECT OF ACIDITY AND CATALYST DIAMETER
 MAKARA, TEKNOLOGI, VOL. 9, NO. 2, NOPEMBER 25: 48-52 PRODUCTION HYDROGEN AND NANOCARBON VIA METHANE DECOMPOSITION USING BASED CATALYSTS. EFFECT OF ACIDITY AND CATALYST DIAMETER Widodo W. Purwanto, M. Nasikin,
Experimental details. General
 Experimental details General TiO 2 P25 was purchased from Degussa; methyl methacrylate (MMA, 99%), 2,2 -azobis(2- methylpropionamidine) dihydrochloride (97%), titanium (IV) isopropoxide (97%), concentrated
MANUFACTURING OF MICROPOROUS CERAMIC MEMBRANES FOR ENVIRONMENTAL APPLICATIONS I. CO 2 -free power plants II. Fuel cells
 Mitglied der Helmholtz-Gemeinschaft Innovation for Sustainable Production i-sup 2008 Congrescentrum Oud Sint-Jan, Brugge 21. 24. April 2008 MANUFACTURING OF MICROPOROUS CERAMIC MEMBRANES FOR ENVIRONMENTAL
Adsorption (Ch 12) - mass transfer to an interface
 - mass transfer to an interface") Adsorption (Ch 12) - mass transfer to an interface (Absorption - mass transfer to another phase) Gas or liquid adsorption (molecular) onto solid surface Porous solids provide high surface area per weight
Adsorption (Ch 12) - mass transfer to an interface (Absorption - mass transfer to another phase) Gas or liquid adsorption (molecular) onto solid surface Porous solids provide high surface area per weight
Polymers 2017; doi: 1. Structural Characterisation of the Prepared Iniferters, BDC and SBDC
 S1/S15 Supplementary Materials: Optimisation of surfaceinitiated photoiniferter-mediated polymerisation under confinement, and the formation of block copolymers in mesoporous films Jessica C. Tom 1, Robert
Kinetic, Thermodynamic and Regeneration Studies for CO 2 Adsorption onto Activated Carbon
 International Journal of Advanced Mechanical Engineering. ISSN 50-334 Volume 4, Number 1 (014), pp. 7-3 Research India Publications http://www.ripublication.com/ijame.htm Kinetic, Thermodynamic and Regeneration
INTRODUCTION TO CATALYTIC COMBUSTION
 INTRODUCTION TO CATALYTIC COMBUSTION R.E. Hayes Professor of Chemical Engineering Department of Chemical and Materials Engineering University of Alberta, Canada and S.T. Kolaczkowski Professor of Chemical
International Journal of Scientific Research and Modern Education (IJSRME) ISSN (Online): (www.rdmodernresearch.com) Volume I, Issue I,
 ISSN (Online): (www.rdmodernresearch.com) Volume I, Issue I,") OXYGEN CONCENTRATORS A STUDY Mohammed Salique*, Nabila Rumane**, RohanBholla***, Siddharth Bhawnani**** & Anita Kumari***** Chemical Engineering Department, Thadomal Shahani Engineering College, Off Linking
OXYGEN CONCENTRATORS A STUDY Mohammed Salique*, Nabila Rumane**, RohanBholla***, Siddharth Bhawnani**** & Anita Kumari***** Chemical Engineering Department, Thadomal Shahani Engineering College, Off Linking
Performance of Palladium Diffusers for Reliable Purification of Hydrogen
 Performance of Palladium Diffusers for Reliable Purification of Hydrogen By Ed Connor, GC Product Specialist, Peak Scientific Instruments Ltd Performance of Palladium Diffusers for Reliable Purification
Monte Carlo Simulation of Long-Range Self-Diffusion in Model Porous Membranes and Catalysts
 Monte Carlo Simulation of Long-Range Self-Diffusion in Model Porous Membranes and Catalysts Brian DeCost and Dr. Sergey Vasenkov College of Engineering, University of Florida Industrial processes involving
Supplementary Figure S1: Solution NMR spectra for D-glucose with a 4:1 sugar:sb molar ratio in H 2 O. a) 13 C NMR of D-(1-13 C)glucose, b) 13 C NMR
 13 C NMR of D-(1-13 C)glucose, b) 13 C NMR") a c b d Supplementary Figure S1: Solution NMR spectra for D-glucose with a 4:1 sugar:sb molar ratio in H 2 O. a) 13 C NMR of D-(1-13 C)glucose, b) 13 C NMR of D-glucose, c) 11 B NMR, d) 1 H NMR a c b d
a c b d Supplementary Figure S1: Solution NMR spectra for D-glucose with a 4:1 sugar:sb molar ratio in H 2 O. a) 13 C NMR of D-(1-13 C)glucose, b) 13 C NMR of D-glucose, c) 11 B NMR, d) 1 H NMR a c b d
SUPPORTING INFORMATION
 Electronic Supplementary Material (ESI) for Nanoscale. This journal is The Royal Society of Chemistry 2014 SUPPORTING INFORMATION Materials Graphite powder (SP-1 graphite) was obtained from Bay carbon.
DICP Course - Dalian, 2012 Preparation of solid catalysts Part 5 Supported by the Chinese Academy of Sciences
 DICP Course - Dalian, 2012 Preparation of solid catalysts Part 5 Supported by the Chinese Academy of Sciences Charles Kappenstein, Professor Emeritus, University of Poitiers, France Preparation of catalysts
Supplementary Figure S1 Reactor setup Calcined catalyst (0.40 g) and silicon carbide powder (0.4g) were mixed thoroughly and inserted into a 4 mm
 and silicon carbide powder (0.4g) were mixed thoroughly and inserted into a 4 mm") Supplementary Figure S1 Reactor setup Calcined catalyst (.4 g) and silicon carbide powder (.4g) were mixed thoroughly and inserted into a 4 mm diameter silica reactor (G). The powder mixture was sandwiched
Supplementary Figure S1 Reactor setup Calcined catalyst (.4 g) and silicon carbide powder (.4g) were mixed thoroughly and inserted into a 4 mm diameter silica reactor (G). The powder mixture was sandwiched
Gas Chromatography Separation of H 2 -D 2 -Ar Using Pd/K
 Gas Chromatography Separation of H 2 -D 2 -Ar Using Pd/K FTP/P1-06 X. J. Qian 1), D. L. Luo 1), C. Qin 1), G. Q. Huang 1), W. Yang 1) 1) China Academy of Engineering Physics, Mianyang, SiChuan, P.R.China
Synthesis of nano-sized anatase TiO 2 with reactive {001} facets using lamellar protonated titanate as precursor
 Supporting Information Synthesis of nano-sized anatase TiO 2 with reactive {001} facets using lamellar protonated titanate as precursor Liuan Gu, Jingyu Wang *, Hao Cheng, Yunchen Du and Xijiang Han* Department
GRIGNARD REACTION Synthesis of Benzoic Acid
 1 GRIGNARD REACTION Synthesis of Benzoic Acid In the 1920 s, the first survey of the acceleration of chemical transformations by ultrasound was published. Since then, many more applications of ultrasound
Synthesis of Zeolite A Membrane from Rice Husk Ash
 Journal of Metals, Materials and Minerals, Vol.19 No.2 pp.79-83, 2009 Chayakorn BHAVORNTHANAYOD and Pesak RUNGROJCHAIPON * Department of Chemistry, Faculty of Science, King Mongkut s Institute of Technology
PREPARATION, CHARACTERIZATION OF OXIDATION-REDUCTION PROPERTIES AND APPLICATION OF Fe-ZSM-5 CATALYSTS
 PREPARATION, CHARACTERIZATION OF OXIDATION-REDUCTION PROPERTIES AND APPLICATION OF Fe-ZSM-5 CATALYSTS D. Szalay*, G. Horváth**, J. Halász** and I. Kiricsi** Department of Environmental Engineering, Széchenyi
Synthesis of micro- and mesoporous materials
 Synthesis of micro- and mesoporous materials Jean-Philippe Tessonnier Fritz Haber Institute of the Max Planck Society, Berlin, Germany Outline Basic concepts on porosity and importance in catalysis Porous
Desalination by Reverse Osmosis on Zeolite Membranes
 Desalination by Reverse Osmosis on Zeolite Membranes Junhang Dong and Robert Lee Petroleum Recovery Research Center (PRRC) Department of Petroleum and Chemical Engineering New Mexico Tech., Socorro, New
SYNTHESIS OF CADMIUM SULFIDE NANOSTRUCTURES BY NOVEL PRECURSOR
 Nanomaterials: Applications and Properties (NAP-2011). Vol. 1, Part I 107 SYNTHESIS OF CADMIUM SULFIDE NANOSTRUCTURES BY NOVEL PRECURSOR M. Salavati Niasari 1,2* 1 Department of Inorganic Chemistry, Faculty