Fabrication Facility. 1. Turn on the. the power. For. - polystyrene. - Do. -Quartz quivette. quivette -Low
|
|
|
- Oliver Davidson
- 5 years ago
- Views:
Transcription
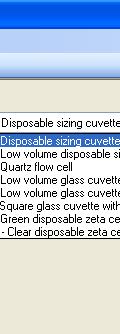
1 SOP for DLS and Zeta potential using Malvern Zetasizer Nano ZS 1. Turn on the zetasizerr 30 minutes prior to measurement using switch at the back (C). the power 2. Sample preparation: For size measurement: -Prepare 0.5-2ml depending on the quivette used -Test several sample concentration to make sure the range r is correct -In case organic buffers are used do not use plastic quivette - Do not use polystyrenee quivette above 50C! - Fill the cell slowly to avoid air bubbles being created Appropriate cells: From right to left: -Quartz quivette - polystyrene quivette -Low volume polystyrene quivette (400 l) 1


2 Inserting the cell: -Press on button 1: the door will open -Insert cell with the small triangle towards the button -Close the lid For zeta measurement: -Prepare 1ml of sample 2
3 -Salt concentration should be low (Maximumm sample conductivityc y 200mS/cm) -No organic solvents can be used -Rinse the folded capillary cell thoroughly with ethanol -Rinse thoroughly with RO water -Rinse with your sample dispersant (optional) -Filll the cell with the sample for measurement using a syringe and tilting the cell sideways Orientation and Insertion of Capillary Cell 3. Start the Zetasizer software 4. Create a measurement file This is the file in which the t results would be saved Select File->New->Measurement file Save as: file name.dts 3
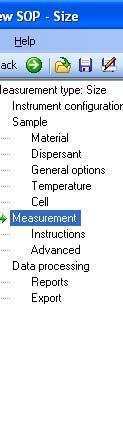
4 5. Create an SOP file. SOP file can be used for all samples that share samplee materialss and dispersant ensuring similar measurement conditions To create a new measurement file: Select File->New. A dialogue will appear allowing thee new measurement file to be named and Specify wheree it will be saved. SOP Editor Tree Menu View: Measurement Type Sample Allows the measurement record too be named 4

) Absorption -Clicking on")

5 All measurements made using thiss SOP are given the sample name entered in the SOP by default, but there iss the option of changing this when the measurement is started Sample Material -Allows the optical properties of the sample material too be set Refractivee Index (RI)) Absorption -Clicking on the button accesses the Material Properties Manager -You can add sample materials that are not listed in the databasee but you should supply their RI and absorption 5


")


6 Sample Dispersant -Allows the physical properties of the dispersant to be entered Refractivee index (RI)) Viscosity -Clicking on the button accesses the Dispersant Propertiess Managerr Sample - Dispersant - Dispersants s Manager (1) -From the list displayed, an available dispersant can be selectedd for inclusion into the SOP -Alternatively, a dispersant can bee added, modified or deleted from the list -To add a new dispersant, press the Add button and choose either Simple Dispersant or Solvent Complex Solvent 6
7 Sample - Dispersant - Dispersants s Manager (2) -On selection of a Simple dispersant or solvent, the Dispersant properties dialogue will appear allowing new dispersants to be defined -The dispersant name, refractive r index and viscosity must all be specified -Malvern defined dispersants include a built in viscosity calculation that determines the correct viscosity off the dispersant at any sample temperature Sample - General Options -Allows the Mark-Houwink parameters to be entered enabling a molecular weight to be calculated based on the DLS data -The sample viscosity options are useful for customising the viscosity parameters 7


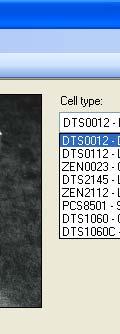
8 Sample Temperature -Allows the measurement temperature and any equilibration timee to be defined -The equilibration time adds a delay before the start off each measurement to ensure that the sample temperature is equal to the cell area temperature Sample - Cell -Allows selection of the appropriate cell from the list -The software will automatically determine the optimumm measurement position for the cell type selected in a backk scatter system 8


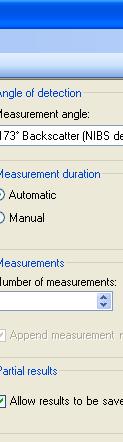
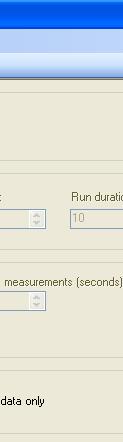


9 Measurement -Measurement angle -Measurement duration -Number of repeat measurementss (I recommend 4) -Dual angle (13 and 173o) -173o Backscatter NIBS (default) -13o Forwardscatter 9


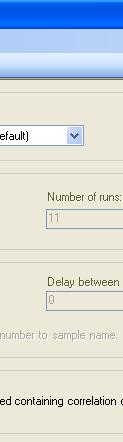
10 Measurement - Measurements -The Measurements option allowss the number of repeat measurements on a sample to be defined -A delay between measurements can be specified by adding a a time in the appropriate box Saving the SOP Once the SOP has been completed, it can be saved either by clicking on File > Save or on the Disk icon on the toolbar 10


 Save")


11 This will bring up a window which will allow the SOP too be namedd and saved into an appropriate sub-directory, e.g. Size (but you can also save it with your measurement data) Save as: SOP_name.sop To open an existing SOP file: Select File->Open. A dialogue will appear allowing selection of a measurement file. Select Open. 6. Measuring a sample -Create a measurementt file (detailed above) 11


12 -Make sure you choose the correct workspace: size/zeta -Start the appropriate SOP by choosing: Measure-> Start SOP -You can add sample name and press OK -A Measurement Display Window will open -Insert the sample as detailed above close the lid and press startt 12
13 -After 2 min of equilibration there is adjustment of optics and the will begin mesuarment The multi view tab offers view of the following: For size: The Multi-View tab consists of 3 display areas, each of which cann be manually defined by clicking the right r mousee button and selecting from a list of plots Count Rate Correlation Functionn Intensity PSD Volume PSD Number PSD For Zeta: 13
14 The Multi-View tab consists of 3 display areas, each of which cann be manually defined by clicking the right r mousee button and selecting from a list of plots Zeta Potential Distribution Electrophoretic Mobility Distribution Count Rate Trace Phase Plot The Expert advice tab: -The Expert Tab is a live report of the quality of the data being generated for both a single measurement and a series of repeat measurements -Comments are given about variability in the results from changes in the sample as a result of, for example, aggregation or dissolution, orr where the first measurement is different because the sample hass not had time to thermally equilibrate. 14
15 7. Viewing your resultss The following tabs can be viewed using the measurement file: Record view- summarizes data obtained from all measurementss in a table thatt can be exported to xls file (details below) Intensity PSD Section 1 gives details of parameters relating to the sample: sample and SOP name, the file name where the record is saved, the t record number, sample and dispersant refractive r indices and viscosities and the date and time t when the measurementt was made. Section 2 gives details on instrument settings for this particular p measurement. Specifically, these are the measured temperature at the start of the measurement. The average countt rate for the measurement in kilo counts per second of k c p s for short. The cell type used to makee the measurement. The duration of the measurement usedd in the analysis of the result inn seconds. The measurement position in the cuvette used to makee the measurement and the attenuator position used to make the measurement. The measurementt position will be fixed for 90 degree. Section 3 gives the results of the measurement. Section 4 shows the result in graphical form. The result shown iss a plot of,, on the Y axis, the relative intensity of f light scattered by particles in various size classes, on the X-axis. This plot iss therefore known as an intensity particle size distribution. The z-average diameter is the mean hydrodynamic diameter based upon the intensity of scattered light. The P D I, the polydispersity index, is a dimensionless estimatee of the width of the distributiond n. These will be discussed in more detail in a later training module. The intercept is the amplitude of the correlation function at time zero. For a good measurement this will between zero point eight five and zero point nine five. 15
16 Correlation Functions: -The correlogram showss the correlation coefficients displayed in each delay time channel and provides information about the sample -The shape of the curve will show some obvious problems that may be present -The correlogram oughtt to be checked for noise contained withinn the data Noisy data can result for various reasons; count rate too low, instability of the t sample or external effects such ass vibration or interference from another source 16

17 Time when decay starts ind icates mean size Intercept Gradien nt indicates the pol ydispersity of sample Baseline Cumulants and Distribution Fits -The cumulants fit report shows the quality of the cumulants fit too the measured data indicating whetherr the z-average diameter and polydispersity obtained for a particularr measurement are reliable -The multimodal fit report shows the quality of the fit off the data with either the general purpose or multiple narrow modes analysis indicating whether the intensity size distribution obtained is reliablee or not -Fit errors of less than are considered good 8. Exporting your dataa -Mark requested lines in the records view -File-> export 17


18 -The following dialogue -Specify file name and r -The format can be eithe -The file can be opened To export images: -Go to the tab with the r -Edit-> copy graph
Zetasizer Nano-ZS User Instructions
 Zetasizer Nano-ZS User Instructions 1. Activate the instrument computer by logging in to CORAL. If needed, log in to the local instrument computer Username: zetasizer. Password: zetasizer. 2. Instrument
ZS90. The ultimate in desktop particle characterization. Particle size. Zeta potential. Molecular weight
 Particle size Zeta potential Molecular weight ZS90 The ultimate in desktop particle characterization detailed specifications from www.malvern.com/zetasizernano A routine analysis system for particle characterization
Measuring NP Aggregation Propensities
 Project: Measuring NP Aggregation Propensities Measuring the NP stability against aggregation as a function of time and buffers with batch-mode DLS AUTHORED BY: DATE: Luigi Calzolai 22-09-2015 REVIEWED
The ultimate in desktop particle characterization
 Particle size Zeta potential Molecular weight ZS The ultimate in desktop particle characterization detailed specification from www.malvern.com/zetasizernano The Zetasizer Nano ZS brings you the practicality
Surface Zeta Potential Cell (ZEN1020)
") Surface Zeta Potential Cell (ZEN1020) MAN0483 Issue 1.0 September 2011 English Copyright Malvern Instruments Ltd. 2011 Malvern Instruments makes every effort to ensure that this document is correct. However,
Surface Zeta Potential Cell (ZEN1020) MAN0483 Issue 1.0 September 2011 English Copyright Malvern Instruments Ltd. 2011 Malvern Instruments makes every effort to ensure that this document is correct. However,
The ultimate in desktop particle characterization
 Particle size Zeta potential Molecular weight ZS The ultimate in desktop particle characterization detailed specification from www.malvern.com/zetasizernano The Zetasizer Nano ZS brings you the practicality
The Diffusion Barrier Technique, Practical Aspects and Data interpretation
 The Diffusion Barrier Technique, Practical Aspects and Data interpretation Introduction The diffusion barrier technique is a method for reliably measuring the electrophoretic mobility of proteins by minimising
Waters GPC User Guide and Tutorial for Using the GPC in the Reynolds Research Group 2 nd Edition: April 2012
 Waters GPC User Guide and Tutorial for Using the GPC in the Reynolds Research Group 2 nd Edition: April 2012 Georgia Institute of Technology School of Chemistry & Biochemistry School of Materials Science
Zetasizer Nano ZSP: A Perfect Tool For Life Science Applications
 Zetasizer Nano ZSP: A Perfect Tool For Life Science Applications Dr Mike Kaszuba Technical Support Manager E-mail: michael.kaszuba@malvern.com Contents Zetasizer Nano ZSP Software Enhancements Protein
Jasco V-670 absorption spectrometer
 Laser Spectroscopy Labs Jasco V-670 absorption spectrometer Operation instructions 1. Turn ON the power switch on the right side of the spectrophotometer. It takes about 5 minutes for the light source
You w i ll f ol l ow these st eps : Before opening files, the S c e n e panel is active.
 You w i ll f ol l ow these st eps : A. O pen a n i m a g e s t a c k. B. Tr a c e t h e d e n d r i t e w i t h t h e user-guided m ode. C. D e t e c t t h e s p i n e s a u t o m a t i c a l l y. D. C
Amended Specifications as per the Pre Bid meeting held on in Chapter 4
 NIPER-G/PUR/GLOBAL/2018/06 Tender Specification for Nano Particle Size (DLS based), Zeta Potential, Molecular weight, Micro rheology measurement A proven complete system should have the measurement facility
ENV/JM/MONO(2015)17/PART1/ANN2
17/PART1/ANN2") Unclassified ENV/JM/MONO(2015)17/PART1/ANN2 ENV/JM/MONO(2015)17/PART1/ANN2 Unclassified Organisation de Coopération et de Développement Économiques Organisation for Economic Co-operation and Development
Unclassified ENV/JM/MONO(2015)17/PART1/ANN2 ENV/JM/MONO(2015)17/PART1/ANN2 Unclassified Organisation de Coopération et de Développement Économiques Organisation for Economic Co-operation and Development
Kinetics of Crystal Violet Bleaching
 Kinetics of Crystal Violet Bleaching Authors: V. C. Dew and J. M. McCormick* From Update March 12, 2013 with revisions Nov. 29, 2016 Introduction Chemists are always interested in whether a chemical reaction
Size Determination of Gold Nanoparticles using Mie Theory and Extinction Spectra
 Size Determination of Gold Nanoparticles using Mie Theory and Extinction Spectra OUTLINE OF THE PROCEDURE A) Measure the extinction spectra of each of your samples. B) Model the extinction spectrum of
Nanoparticle Analyzer
 Nanoparticle Analyzer Industry's Widest Range and Highest Precision Measurement Instrument for Nano-particle Characterization nano partica SZ-100 A highly advanced analyzer solves the mysteries of the
Protocol Particle size distribution by centrifugal sedimentation (CPS)
") Protocol Particle size distribution by centrifugal sedimentation (CPS) 1. Method The CPS Disc Centrifuge separates particles by size using centrifugal sedimentation in a liquid medium. The sedimentation
Protocol Particle size distribution by centrifugal sedimentation (CPS) 1. Method The CPS Disc Centrifuge separates particles by size using centrifugal sedimentation in a liquid medium. The sedimentation
Determination of the Equivalent Weight and the K a or K b for a Weak Acid or Base
 INTRODUCTION Determination of the Equivalent Weight and the K a or K b for a Weak Acid or Base Chemists frequently make use of the equivalent weight (eq. wt.) as the basis for volumetric calculations.
Measuring Zeta Potential
 Project: Measuring Zeta Potential Zeta potential determination of nanoparticles in aqueous dispersions by PALS AUTHORED BY: DATE: Fanny Caputo 10-08-2015 REVIEWED BY: DATE: Matthias Roesslein 11.08.2015
v Prerequisite Tutorials GSSHA WMS Basics Watershed Delineation using DEMs and 2D Grid Generation Time minutes
 v. 10.1 WMS 10.1 Tutorial GSSHA WMS Basics Creating Feature Objects and Mapping Attributes to the 2D Grid Populate hydrologic parameters in a GSSHA model using land use and soil data Objectives This tutorial
Computer simulation of radioactive decay
 Computer simulation of radioactive decay y now you should have worked your way through the introduction to Maple, as well as the introduction to data analysis using Excel Now we will explore radioactive
Ti-Pure TITANIUM DIOXIDE. DETERMINATION OF PARTICLE SIZE DISTRIBUTION OF RPS ( Horiba (LA-900) Procedure) METHOD: T WP
 Procedure) METHOD: T WP") Ti-Pure TITANIUM DIOXIDE DETERMINATION OF PARTICLE SIZE DISTRIBUTION OF RPS ( Horiba (LA-900) Procedure) METHOD: T4400.274.03WP 1 TITANIUM DIOXIDE (Ti-Pure ) Determination of Particle Size Distribution
Ti-Pure TITANIUM DIOXIDE DETERMINATION OF PARTICLE SIZE DISTRIBUTION OF RPS ( Horiba (LA-900) Procedure) METHOD: T4400.274.03WP 1 TITANIUM DIOXIDE (Ti-Pure ) Determination of Particle Size Distribution
Lasentec Product Group
 Document Number: 004-0043 Window Reference Procedure - M500/600 P Probes, version 6.0 and higher FBRM CI Software The Window Reference Procedure is the standard calibration procedure used to reference
Reference Manual. Program Help for Electrophoretic Buffer Studies. Version 1.3. Copyright 2001 ANALIS sa/nv
 PHoEBuS Version 1.3 Program Help for Electrophoretic Buffer Studies Reference Manual By Ph. Morin, E. Vangrevelinghe and S. Mayer, Orleans (France), 1996, 1997-2001. Recording Number: IDDN.FR.001.270019.00.R.P.1996.000.30625.
Particle Analysis at the Touch of a Button. Litesizer series
 Particle Analysis at the Touch of a Button Litesizer series Particle systems can be complex The size and stability of nanoparticles and microparticles are crucial to their function, as well as to their
RATE LAW DETERMINATION OF CRYSTAL VIOLET HYDROXYLATION
 Rate Law Determination of Crystal Violet Hydroxylation Revised 5/22/12 RATE LAW DETERMINATION OF CRYSTAL VIOLET HYDROXYLATION Adapted from "Chemistry with Computers" Vernier Software, Portland OR, 1997
Cerno Application Note Extending the Limits of Mass Spectrometry
 Creation of Accurate Mass Library for NIST Database Search Novel MS calibration has been shown to enable accurate mass and elemental composition determination on quadrupole GC/MS systems for either molecular
Technical Procedure for Glass Refractive Index Measurement System 3 (GRIM 3)
") Technical Procedure for Glass Refractive Index Measurement System 3 (GRIM 3) 1.0 Purpose - This technical procedure shall be followed for the operation of the GRIM 3. 2.0 Scope - This procedure applies
Technical Procedure for Glass Refractive Index Measurement System 3 (GRIM 3) 1.0 Purpose - This technical procedure shall be followed for the operation of the GRIM 3. 2.0 Scope - This procedure applies
Getting started with BatchReactor Example : Simulation of the Chlorotoluene chlorination
 Getting started with BatchReactor Example : Simulation of the Chlorotoluene chlorination 2011 ProSim S.A. All rights reserved. Introduction This document presents the different steps to follow in order
Instytut Fizyki Doświadczalnej Wydział Matematyki, Fizyki i Informatyki UNIWERSYTET GDAŃSKI
 Instytut Fizyki Doświadczalnej Wydział Matematyki, Fizyki i Informatyki UNIWERSYTET GDAŃSKI Experiment 20 : Studying light absorption in terphenyl I. Background theory. 1. 2. 3. 4. 5. 6. 7. Electromagnetic
Lasentec Product Group
 Prepared by: Gregor Hsiao Approved on: ECN# 3506 Effective Date: 1/14/2008 Title: Window Reference Procedure for Version 6.0.0 and Higher Purpose: Lasentec D600 Probes and FBRM/Raman Probes using version
Building Inflation Tables and CER Libraries
 Building Inflation Tables and CER Libraries January 2007 Presented by James K. Johnson Tecolote Research, Inc. Copyright Tecolote Research, Inc. September 2006 Abstract Building Inflation Tables and CER
WMS 10.1 Tutorial GSSHA Applications Precipitation Methods in GSSHA Learn how to use different precipitation sources in GSSHA models
 v. 10.1 WMS 10.1 Tutorial GSSHA Applications Precipitation Methods in GSSHA Learn how to use different precipitation sources in GSSHA models Objectives Learn how to use several precipitation sources and
Fluorescence Spectrophotometry
 Chemistry 422L Manual Page 27 I. Introduction Fluorescence Spectrophotometry Ru(bpy) 3 2+, where bpy = 2, 2' bipyridine, has been one of the most widely studied metal complexes in recent years. Interest
Rate Law Determination of the Crystal Violet Reaction. Evaluation copy
 Rate Law Determination of the Crystal Violet Reaction Computer 30 In this experiment, you will observe the reaction between crystal violet and sodium hydroxide. One objective is to study the relationship
Measuring Lysozyme Monomer at 0.1 mg/ml Concentration. Equipment used : Sample Preparation and Measurement :
 Application Report #001 Measuring Lysozyme Monomer at 0.1 mg/ml Concentration Equipment used : ALV-NIBS / HPPS High Sensitivity Version, Lysozyme (MERCK), 0.1 molar Sodium-Acetate buffer (ph 4.25), syringe
Lab 1 Uniform Motion - Graphing and Analyzing Motion
 Lab 1 Uniform Motion - Graphing and Analyzing Motion Objectives: < To observe the distance-time relation for motion at constant velocity. < To make a straight line fit to the distance-time data. < To interpret
Protocol for Use of BCMP Jasco J-815 Circular Dichroism Spectropolarimeter
 Protocol for Use of BCMP Jasco J-815 Circular Dichroism Spectropolarimeter Getting Started 1. Turn on the nitrogen: Open the valve on the nitrogen tank (max 10 psi) so that the pressure gauge on the left
Introduction. Concepts Kinetics Order of reaction Reaction rate Colorimetry. Background
 Introduction Phenolphthalein is a dye that is used as an acid-base indicator. It is colorless in acidic or neutral solutions and turns bright red-violet (fuschia) as the solution becomes basic. In strongly
Soil Cation Analysis Using High-Performance Capillary Zone Electrophoresis Last Modified: October 20, 2006
 Soil Cation Analysis Using High-Performance Capillary Zone Electrophoresis Last Modified: October 20, 2006 Introduction: Capillary electrophoresis (CE) is a relatively new, but rapidly growing separation
MASSACHUSETTS INSTITUTE OF TECHNOLOGY Physics Department. Experiment 03: Work and Energy
 MASSACHUSETTS INSTITUTE OF TECHNOLOGY Physics Department Physics 8.01 Fall Term 2010 Experiment 03: Work and Energy Purpose of the Experiment: In this experiment you allow a cart to roll down an inclined
Litesizer Sheet 1. [Home]
![Litesizer Sheet 1. [Home]](/thumbs/77/75555830.jpg "Litesizer Sheet 1. [Home]") Litesizer 500 15.01.15 Sheet 1 [Home] The Product: Litesizer 500 Measurement Modes Particle Size & Distribution Dynamic light scattering (DLS) Zeta Potential Electrophoretic light scattering (ELS) Molecular
Litesizer 500 15.01.15 Sheet 1 [Home] The Product: Litesizer 500 Measurement Modes Particle Size & Distribution Dynamic light scattering (DLS) Zeta Potential Electrophoretic light scattering (ELS) Molecular
SPECIALIZED LABORATORY of pharmaceuticals manufacturing
 SPECIALIZED LABORATORY of pharmaceuticals manufacturing Department of organic technology (111) Solid dosage forms testing: Dissolution test Supervisors: Laboratory location: S25b Introduction Ensuring
Hydration of Propionaldehyde by Temperature-Jump Relaxation 1
 1 Hydration of Propionaldehyde by Temperature-Jump Relaxation 1 Purpose: Determine the rate constants for the reversible hydration of propionaldehyde using temperature-jump relaxation. Pre-lab Reading:
UV-Vis optical fiber assisted spectroscopy in thin films and solutions
 UV-Vis optical fiber assisted spectroscopy in thin films and solutions Description UV-Visible absorption and transmission spectra provide fundamental information for all experiments related to the attenuation
1. Prepare the MALDI sample plate by spotting an angiotensin standard and the test sample(s).
.") Analysis of a Peptide Sequence from a Proteolytic Digest by MALDI-TOF Post-Source Decay (PSD) and Collision-Induced Dissociation (CID) Standard Operating Procedure Purpose: The following procedure may
Analysis of a Peptide Sequence from a Proteolytic Digest by MALDI-TOF Post-Source Decay (PSD) and Collision-Induced Dissociation (CID) Standard Operating Procedure Purpose: The following procedure may
Experiment C-10 Titration of a Strong Acid and a Strong Base
 1 Experiment C-10 Titration of a Strong Acid and a Strong Base Objectives To study the titration process. To follow changes in the ph during the titration process while adding a strong base to a strong
Bioanalytical Chem: 4590: LC-MSMS of analgesics LC-MS Experiment Liquid Chromatography Mass Spectrometry (LC/MS)
") Liquid Chromatography Mass Spectrometry (LC/MS) Prelab Questions: Questions to be answered before doing the experiment. The answers are due at the beginning of each experiment without exception (the questions
Liquid Chromatography Mass Spectrometry (LC/MS) Prelab Questions: Questions to be answered before doing the experiment. The answers are due at the beginning of each experiment without exception (the questions
ZETASIZER NANO Series PERFORMANCE, SIMPLICITY, VERSATILITY
 ZETASIZER NANO Series PERFORMANCE, SIMPLICITY, VERSATILITY Performance, Simplicity, Versatility ZETASIZER NANO SERIES Research Performance, Operational Simplicity, Application Versatility The Zetasizer
An area chart emphasizes the trend of each value over time. An area chart also shows the relationship of parts to a whole.
 Excel 2003 Creating a Chart Introduction Page 1 By the end of this lesson, learners should be able to: Identify the parts of a chart Identify different types of charts Create an Embedded Chart Create a
Sample measurements to demonstrate Zetasizer specifications (Zetasizer Nano, Zetasizer APS, Zetasizer μv)
") Sample measurements to demonstrate Zetasizer specifications (Zetasizer Nano, Zetasizer APS, Zetasizer μv) Contents Size using Non-Invasive back-scatter (NIBS) optics Zetasizer Nano S/ZS...2 Minimum size
Sample measurements to demonstrate Zetasizer specifications (Zetasizer Nano, Zetasizer APS, Zetasizer μv) Contents Size using Non-Invasive back-scatter (NIBS) optics Zetasizer Nano S/ZS...2 Minimum size
Operation Manual. SPECTRO-NANO4 Nucleic Acid Analyzer PLEASE READ THIS MANUAL CAREFULLY BEFORE OPERATION
 Operation Manual SPECTRO-NANO4 Nucleic Acid Analyzer PLEASE READ THIS MANUAL CAREFULLY BEFORE OPERATION 3, Hagavish st. Israel 58817 Tel: 972 3 5595252, Fax: 972 3 5594529 mrc@mrclab.com MRC. 4.18 Foreword
The Determination of an Equilibrium Constant
 The Determination of an Equilibrium Constant Computer 10 Chemical reactions occur to reach a state of equilibrium. The equilibrium state can be characterized by quantitatively defining its equilibrium
iworx Sample Lab Experiment GB-2: Membrane Permeability
 Experiment GB-2: Membrane Permeability Exercise 1: Movement of Small Positive Ions Across a Membrane Aim: To determine if small, positively charged, hydrogen ions can move across a membrane from a region
Introduction to Spectroscopy: Analysis of Copper Ore
 Introduction to Spectroscopy: Analysis of Copper Ore Using a Buret and Volumetric Flask: 2.06 ml of solution delivered 2.47 ml of solution delivered 50.00 ml Volumetric Flask Reading a buret: Burets are
10 REASONS THAT THE ZETASIZER NANO IS CHOSEN FOR SCIENTIFIC SUCCESS
 10 REASONS THAT THE ZETASIZER NANO IS CHOSEN FOR SCIENTIFIC SUCCESS Abstract: New components and measurement techniques continue to be introduced for the Zetasizer Nano. New to the system are a Surface
MALVERN ADVANCED GPC/SEC DETECTORS SETTING THE STANDARD MOLECULAR WEIGHT MOLECULAR SIZE MOLECULAR STRUCTURE
 MOLECULAR WEIGHT MOLECULAR SIZE MOLECULAR STRUCTURE MALVERN ADVANCED GPC/SEC DETECTORS SETTING THE STANDARD Setting the Standard WHAT CAN ADVANCED GPC/SEC DETECTION OFFER YOU? A modern research environment
Measuring ph with Smart Cuvettes
 1 Measuring ph with Smart Cuvettes Hardware Setup for ph Measurements ph is measured in Absorbance mode. Configure your spectroscopy components for Absorbance measurements. Sample Absorbance setups for
The Determination of an Equilibrium Constant
 LabQuest 10 The equilibrium state of a chemical reaction can be characterized by quantitatively defining its equilibrium constant, Keq. In this experiment, you will determine the value of Keq for the reaction
Electrochemical Techniques: Cyclic Voltammetry
 Electrochemical Techniques: Cyclic Voltammetry Cyclic Voltammetry of Ferrocene Carboxylic Acid 1. Aims To use cyclic voltammetry to investigate the solution electrochemistry of a simple redox couple. 2.
Gel Permeation Chromatography
 Gel Permeation Chromatography Polymers and Coatings Laboratory California Polytechnic State University Gel permeation chromatography (GPC) has become the most widely used technique for determination of
1. Starting of a project and entering of basic initial data.
 PROGRAM VISIMIX TURBULENT SV. Example 1. Contents. 1. Starting of a project and entering of basic initial data. 1.1. Opening a Project. 1.2. Entering dimensions of the tank. 1.3. Entering baffles. 1.4.
Optical density measurements automatically corrected to a 1-cm pathlength with PathCheck Technology
 APPLICATION NOTE Optical density measurements automatically corrected to a 1-cm pathlength with PathCheck Technology Introduction UV/VIS spectrophotometers and microplate readers differ fundamentally in
10 samples per second
 The Conductivity sensor is designed to measure conductivity of liquids and solutions capable of measuring the entire range of 0-20 millisiemens (ms). Conductivity is one of the most basic tests conducted
ON SITE SYSTEMS Chemical Safety Assistant
 ON SITE SYSTEMS Chemical Safety Assistant CS ASSISTANT WEB USERS MANUAL On Site Systems 23 N. Gore Ave. Suite 200 St. Louis, MO 63119 Phone 314-963-9934 Fax 314-963-9281 Table of Contents INTRODUCTION
The solution for all of your
 The solution for all of your nanoparticle sizing and zeta potential needs. DelsaNano Series Blood Banking Capillary Electrophoresis Cell Analysis Centrifugation Genomics Lab Automation Lab Tools Particle
Tutorial Number 18: Heat transfer analysis of a teapot
 Tutorial Number 18: Heat transfer analysis of a teapot Stefano Morlacchi September 2014 T. 01608 811777 F. 01608811770 E.info@ssanalysis.co.uk W. www.ssanalysis.co.uk 1. Introduction In this tutorial,
AAG TPoint Mapper (Version 1.40)
") AAG TPoint Mapper (Version 1.40) AAG_TPointMapper works together with Maxim DL, Pinpoint, TheSky6 and TPoint to automate the process of building a TPoint model for a GOTO telescope connected to TheSky6.
AAG TPoint Mapper (Version 1.40) AAG_TPointMapper works together with Maxim DL, Pinpoint, TheSky6 and TPoint to automate the process of building a TPoint model for a GOTO telescope connected to TheSky6.
Become a Microprobe Power User Part 2: Qualitative & Quantitative Analysis
 Become a Microprobe Power User Part 2: Qualitative & Quantitative Analysis Mike Spilde Spring IOM Seminar February 5, 2008 Qualitative Analysis Why use qualitative scans? Elemental ID (especially trace
WMS 9.0 Tutorial GSSHA Modeling Basics Infiltration Learn how to add infiltration to your GSSHA model
 v. 9.0 WMS 9.0 Tutorial GSSHA Modeling Basics Infiltration Learn how to add infiltration to your GSSHA model Objectives This workshop builds on the model developed in the previous workshop and shows you
This sensor is now also available with a sturdier flat electrode which enables testing even smaller samples than the conventional electrode.
 ph sensor with electrode ENPH-A016 ph sensor with flat electrode ENPH-F052 The ph sensor replaces the traditional ph meter adding powerful capabilities such as collecting the ph data and displaying the
Appendix B Microsoft Office Specialist exam objectives maps
 B 1 Appendix B Microsoft Office Specialist exam objectives maps This appendix covers these additional topics: A Excel 2003 Specialist exam objectives with references to corresponding material in Course
ICM-Chemist How-To Guide. Version 3.6-1g Last Updated 12/01/2009
 ICM-Chemist How-To Guide Version 3.6-1g Last Updated 12/01/2009 ICM-Chemist HOW TO IMPORT, SKETCH AND EDIT CHEMICALS How to access the ICM Molecular Editor. 1. Click here 2. Start sketching How to sketch
Operation of the Bruker 400 JB Stothers NMR Facility Department of Chemistry Western University
 Operation of the Bruker 400 JB Stothers NMR Facility Department of Chemistry Western University 1. INTRODUCTION...3 1.1. Overview of the Bruker 400 NMR Spectrometer...3 1.2. Overview of Software... 3 1.2.1.
Center of Mass. Evaluation copy
 Center of Mass Experiment 19 INTRODUCTION In the most of the previous experiments you have examined the motion of a single object as it underwent a variety of motions. You learned that an object subject
ZETASIZER NANO SERIES ACCESSORIES GUIDE MOLECULAR WEIGHT
 Malvern Instruments Limited Grovewood Road, Malvern Worcestershire, WR14 1XZ, UK Tel +44 1684 892456 Fax +44 1684 892789 www.malvern.com PARTICLE SIZE ZETA POTENTIAL MAN0487 MRK1854_ZNS_basic_guide.indd
Connect the Vernier spectrometer to your lap top computer and power the spectrometer if necessary. Start LoggerPro on your computer.
 Connect the Vernier spectrometer to your lap top computer and power the spectrometer if necessary. Start LoggerPro on your computer. The screen shown in Fig. 1 may be displayed. If status line displays
Virtual Beach Building a GBM Model
 Virtual Beach 3.0.6 Building a GBM Model Building, Evaluating and Validating Anytime Nowcast Models In this module you will learn how to: A. Build and evaluate an anytime GBM model B. Optimize a GBM model
Fog Monitor 100 (FM 100) Extinction Module. Operator Manual
 Extinction Module. Operator Manual") Particle Analysis and Display System (PADS): Fog Monitor 100 (FM 100) Extinction Module Operator Manual DOC-0217 Rev A-1 PADS 2.7.3, FM 100 Extinction Module 2.7.0 5710 Flatiron Parkway, Unit B Boulder,
Particle Analysis and Display System (PADS): Fog Monitor 100 (FM 100) Extinction Module Operator Manual DOC-0217 Rev A-1 PADS 2.7.3, FM 100 Extinction Module 2.7.0 5710 Flatiron Parkway, Unit B Boulder,
Sodium Sealed Electrode Sensor Bundle Product Number: ENSOD051
 imagine explore learn Sodium Sealed Electrode Sensor Bundle Product Number: ENSOD051 Overview Sodium is highly abundant in the lithosphere (Earth s outer shell) where it occurs as rock salt deposits as
Photoluminescence Spectrometer (FLS980)
") Photoluminescence Spectrometer (FLS980) Instrument Summary: The Edinburgh Instruments FLS980 photoluminescence spectrometer offers both steady state and time resolved (lifetime) fluorescence spectroscopy
Photoluminescence Spectrometer (FLS980) Instrument Summary: The Edinburgh Instruments FLS980 photoluminescence spectrometer offers both steady state and time resolved (lifetime) fluorescence spectroscopy
ITC Expert User s Manual
 ITC Expert User s Manual 1 Section 1: ITC Expert Background... 3 Minimal Heats and Injections... 3 C Parameter... 3 C Limitations... 4 High C... 4 Low C... 6 Concentrations Ratio... 6 Section 2: ITC Expert
ECE 220 Laboratory 4 Volt Meter, Comparators, and Timer
 ECE 220 Laboratory 4 Volt Meter, Comparators, and Timer Michael W. Marcellin Please follow all rules, procedures and report requirements as described at the beginning of the document entitled ECE 220 Laboratory
Information Dependent Acquisition (IDA) 1
 1") Information Dependent Acquisition (IDA) Information Dependent Acquisition (IDA) enables on the fly acquisition of MS/MS spectra during a chromatographic run. Analyst Software IDA is optimized to generate
Information Dependent Acquisition (IDA) Information Dependent Acquisition (IDA) enables on the fly acquisition of MS/MS spectra during a chromatographic run. Analyst Software IDA is optimized to generate
Jaguar DFT Optimizations and Transition State Searches
 Jaguar DFT Optimizations and Transition State Searches Density Functional Theory (DFT) is a quantum mechanical (QM) method that gives results superior to Hartree Fock (HF) in less computational time. A
DustMon A Standard Operating Procedure From the Microtrac Particle Analysis Laboratory (PAL) SL-AN-44 Revision C
 SL-AN-44 Revision C") DustMon A Standard Operating Procedure From the Microtrac Particle Analysis Laboratory (PAL) SL-AN-44 Revision C Introduction This operating procedure is provided to assist the user of the Dustmon in obtaining
DustMon A Standard Operating Procedure From the Microtrac Particle Analysis Laboratory (PAL) SL-AN-44 Revision C Introduction This operating procedure is provided to assist the user of the Dustmon in obtaining
VISIMIX TURBULENT. TACKLING SAFETY PROBLEMS OF STIRRED REACTORS AT THE DESIGN STAGE.
 VISIMIX TURBULENT. TACKLING SAFETY PROBLEMS OF STIRRED REACTORS AT THE DESIGN STAGE. This example demonstrates usage of the VisiMix software to provide an Inherently Safer Design of the process based on
Application Note TABLE OF CONTENTS
 Application Note 25 Making optical density measurements automatically corrected to a 1 cm pathlength in the SPECTRAmax PLUS microplate spectrophotometer (The three P s of Pathcheck : Principle, Procedures
Athena Visual Software, Inc. 1
 Athena Visual Studio Visual Kinetics Tutorial VisualKinetics is an integrated tool within the Athena Visual Studio software environment, which allows scientists and engineers to simulate the dynamic behavior
Remember that C is a constant and ë and n are variables. This equation now fits the template of a straight line:
 CONVERTING NON-LINEAR GRAPHS INTO LINEAR GRAPHS Linear graphs have several important attributes. First, it is easy to recognize a graph that is linear. It is much more difficult to identify if a curved
Fluoride Sealed Electrode Sensor Bundle Product Number: ENFLU049
 imagine explore learn Fluoride Sealed Electrode Sensor Bundle Product Number: ENFLU049 Overview Fluoride is often added to drinking water and to toothpaste to prevent dental decay. In high concentrations,
Determining the Concentration of a Solution: Beer s Law
 Determining the Concentration of a Solution: Beer s Law Vernier Spectrometer 1 The primary objective of this experiment is to determine the concentration of an unknown copper (II) sulfate solution. You
Tutorial 23 Back Analysis of Material Properties
 Tutorial 23 Back Analysis of Material Properties slope with known failure surface sensitivity analysis probabilistic analysis back analysis of material strength Introduction Model This tutorial will demonstrate
Presenting Tree Inventory. Tomislav Sapic GIS Technologist Faculty of Natural Resources Management Lakehead University
 Presenting Tree Inventory Tomislav Sapic GIS Technologist Faculty of Natural Resources Management Lakehead University Suggested Options 1. Print out a Google Maps satellite image of the inventoried block
Spectrometer User s Guide
 Spectrometer User s Guide (Order Codes: V-SPEC, SPRT-VIS, SP-VIS, SP-UV-VIS, ESRT-VIS) The spectrometer is a portable light spectrophotometer, combining a spectrometer and a light source/cuvette holder.
Experiment 2: The Beer-Lambert Law for Thiocyanatoiron (III)
") Chem 1B Saddleback College Dr. White 1 Experiment 2: The Beer-Lambert Law for Thiocyanatoiron (III) Objectives To use spectroscopy to relate the absorbance of a colored solution to its concentration. To
Chem 1B Saddleback College Dr. White 1 Experiment 2: The Beer-Lambert Law for Thiocyanatoiron (III) Objectives To use spectroscopy to relate the absorbance of a colored solution to its concentration. To
Predictor Assay Setup Guide on the BMG LABTECH CLARIOstar Microplate Readers
 Page 1 of 18 Predictor Assay Setup Guide on the BMG LABTECH CLARIOstar Microplate Readers The BMG LABTECH CLARIOstar Microplate Readers were tested for compatibility with Life Technologies' Predictor herg
Predictor Assay Setup Guide on the Tecan Safire 2 Microplate Reader
 Page 1 of 16 Predictor Assay Setup Guide on the Tecan Safire 2 Microplate Reader NOTE: The Tecan Safire 2 Microplate Reader was tested for compatibility with Invitrogen's Predictor herg FP Assay (PV5365)
Spatial Data Analysis in Archaeology Anthropology 589b. Kriging Artifact Density Surfaces in ArcGIS
 Spatial Data Analysis in Archaeology Anthropology 589b Fraser D. Neiman University of Virginia 2.19.07 Spring 2007 Kriging Artifact Density Surfaces in ArcGIS 1. The ingredients. -A data file -- in.dbf
TIMEZERO PROFESIONAL V3.2
 TIMEZERO PROFESIONAL V3.2 Main New Features TIMEZERO PROFESIONAL V3.2-1 - WASSP G3 (S3 and F3) Compatibility:... - 3 - Misc. Features:... - 7 - TIMEZERO PROFESIONAL V3.2-2 - TIMEZERO Professional (with