Report of the Inter-laboratory Comparison Project 2004 on Wet Deposition
|
|
|
- Milo Horton
- 5 years ago
- Views:
Transcription
1 The Network Center for the Acid Deposition Monitoring Network in East Asia Report of the Inter-laboratory Comparison Project 2004 on Wet Deposition 7th Attempt November 2005 Acid Deposition and Oxidant Research Center
2 Contents 1. INTRODUCTION 1 2. PROCEDURE Participating Laboratories Dispatched Rainwater Samples Analytical Parameters Analytical Method Data Checking Procedures RESULTS Comparison by Sample Sample No.041(higher concentrations) 9 Sample No.042(lower concentrations) Evaluation Analytical Parameter 13 ph. 13 EC SO NO Cl Na K Ca Mg NH Overall Evaluation Circumstances of Sample Analysis.. 24 Methods Used.. 24 Number of staff in charge of measurement 26 Years of experience 27 The number of flagged data in laboratories 28 Water temperature at measurement COMPARISON OF 1 st,2 nd,3 rd,4 th,5 th,6 th and 7 th SURVEY FOR IMPROVEMENT OF MEASUREMENT PRECISIONS REFERENCES CONTACT INFORMATION. 35 APPENDIX 1 Contact addresses of participating laboratories.. i APPENDIX 2 Original data... iii APPENDIX 3 Normalized values by prepared value v
3 1. INTRODUCTION This inter-laboratory comparison project (round robin analysis survey of uniformly prepared artificial rainwater samples) was conducted among the analytical laboratories in participating countries of the Acid Deposition Monitoring Network in East Asia (EANET), based on the Quality Assurance / Quality Control (QA/QC) Program of EANET. The purposes of this project are, through the evaluation of analytical results, analytical equipment and its operating condition and other practices, (i) to recognize the analytical precision and accuracy of the measurement in each participating laboratory, and give an opportunity to improve the quality of the analysis on wet deposition monitoring, and (ii) to improve reliability of analytical data through the assessment of suitable analytical methods and techniques. Artificial rainwater samples contained major ions were prepared and distributed by the Network Center (NC) at the end of All of the participating laboratories submitted their analytical data to NC. Obtained data for ph, EC and concentrations of SO 4 2-, NO 3 -, Cl -, Na +, K +, Ca 2+, Mg 2+ and NH 4 + were compared with prepared values and statistically treated. List of the participating laboratories, individual analytical data with their laboratory s short name, and various statistical parameters are included in this report. * Figure in parenthesis shows the number of laboratories of each country (28 laboratories from 12 countries) Fig.1 Laboratories participated in the Inter-comparison project 2004 of the EANET 1
4 2. PROCEDURE 2.1 Participating Laboratories Twenty-eight laboratories in charge of chemical analysis in 12 countries of EANET participated in this survey. The Network Center (NC) shipped the artificial rainwater samples to all of these 28 laboratories, and almost all of them submitted their analytical data to NC. The names and contact addresses of the participating laboratories are presented in APPENDIX Dispatched Rainwater Samples Two kinds of artificial rainwater samples (of both higher concentration and lower concentration) were distributed to the laboratories (See Table 1). The information on the analytical precision and accuracy on individual parameters can be obtained through the statistical treatment of submitted analytical data of 100 times diluted samples. Table 1 Outline of artificial rainwater samples Artificial rainwater samples No.041 (higher concentration) No.042 (lower concentration ) Amount of each sample Approximately 150ml Container Poly-propyl ene bottle 250ml Number of samples One bottle each Note Known amount of reagents are dissolved in deionized water Before the measurement, each laboratory should accurately dilute distributed samples by 100 times under the specified procedure.
5 2.3 Analytical Parameters All participating laboratories were expected to measure samples and submit the data with the units listed in Table 2 on ten parameters: ph, Electric Conductivity (EC), concentrations of sulfate, nitrate, chloride, sodium-ion, potassium-ion, calcium-ion, magnesium-ion and ammonium. The participating laboratories were informed that concentration of each parameter was within range described in Table 3. Table 2 Reporting units of analytical parameters Analyte Reporting Units ph ph Unites - EC milli siemens/meter ms/m 2- SO 4 micro mole/liter µmol/l - NO 3 micro mole/liter µmol/l Cl - micro mole/liter µmol/l Na + micro mole/liter µmol/l K + micro mole/liter µmol/l Ca 2+ micro mole/liter µmol/l Mg 2+ micro mole/liter µmol/l + NH 4 micro mole/liter µmol/l Table 3 Concentration range of the artificial rainwater samples* Parameter Range Parameter Range ph EC SO 4 2- NO 3 - Cl - * For 100 times diluted samples ms/m 5 100µmol/L 5 100µmol/L 5 100µmol/L Na + K + Ca 2+ Mg 2+ NH µmol/L 1 50µmol/L 1 50µmol/L 1 50µmol/L 1 50µmol/L
6 2.4 Analytical Method Participating laboratories were expected to use analytical methods and data checking procedures that are specified in the Technical Manual for Wet Deposition Monitoring in East Asia and Quality Assurance/Quality Control (QA/QC) Program for Wet Deposition Monitoring in East Asia. Analytical methods specified in the manual are described in Table 4. Table 4 Analytical methods specified in the manual Parameter ph EC SO 4 2- NO 3 - Cl - Na + K + Ca 2+ Mg 2+ NH 4 + Analytical method Glass Electrode Conductivity Cell Ion Chromatography Spectrophotometry Ion Chromatography Atomic Absorption/Emission Spectrometry Ion Chromatography Spectrophotometry (Indophenol Blue)
7 2.5 Data Checking Procedures a) Calculation of ion balance (R 1 ) (1) Total anion (A) equivalent concentration (µeq /L) is calculated by summing the concentrations of all anions (C: mµol /L). A (µeq /L) = S n C Ai (mµol /L) = 2C (SO 4 2- ) + C (NO 3 - ) + C (Cl - ) C Ai : electric charge of ion and concentration (µmol /L) of anion i. (2) Total cation (C) equivalent concentration (µeq /L) is calculated by summing the concentrations of all cations (C: µmol /L). C (µeq /L) = S n C Ci (µmol /L) = 10 (6-pH) + C (NH 4 + ) + C (Na + ) + C (K + ) + 2C (Ca 2+ ) + 2C (Mg 2+ ) C Ci : electric charge of ion and concentration (µmol /L) of cation i. (3) Calculation of ion balance (R 1 ) R 1 = 100 (C-A) / (C+A) (4) R 1, which is calculated using the above equation, should be compared with standard values in Table 5. If R 1 is out of the range, re-measurement, check with standard solutions, and/or inspection of calibration curves should be undertaken. Table 5 Allowable ranges for R 1 in different concentration ranges C+A (µ eq/ L) R 1 (%) < ~ 100 > ~ ~ ~ - 8 (Reference) Technical Documents for Wet Deposition Monitoring in East Asia (2000)
8
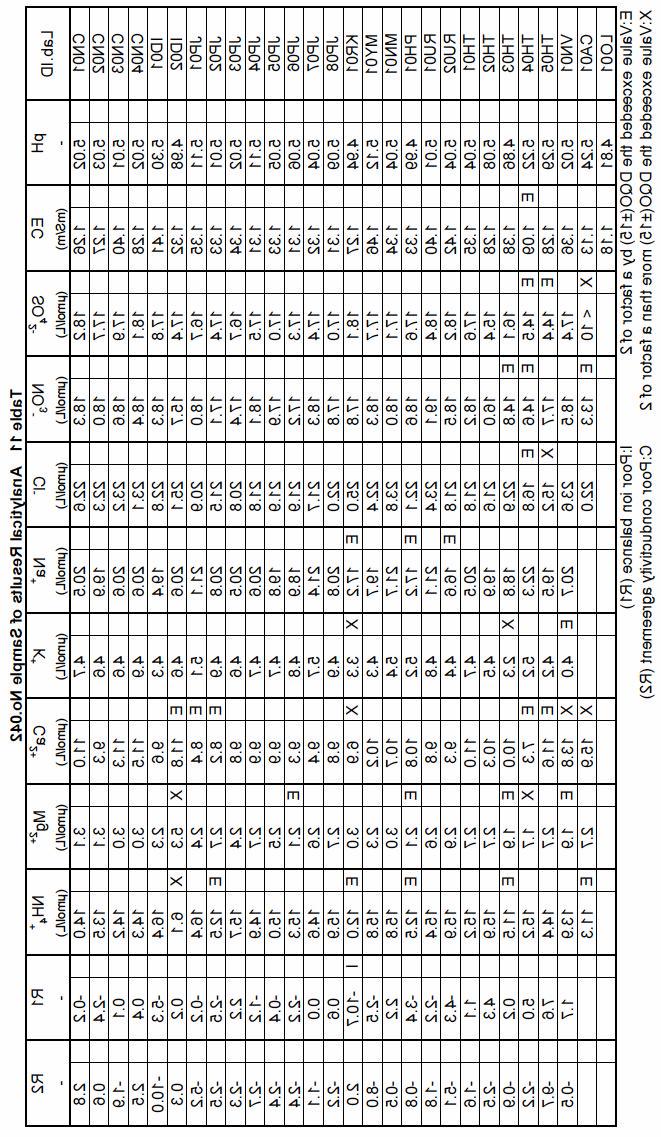
9 3. RESULTS The Network Center shipped artificial rainwater samples to 28 laboratories in the participating countries of EANET, and received the data on analytical results from all laboratories. Obtained data are summarized in Table 7. Statistics were calculated for each constituent of the artificial rainwater samples such as: Average, Minimum (Min.), Maximum (Max.), Standard deviation (S.D.), and Number of data (N). Outlying data, which are apart from the Average greater than a factor of 3 of S.D. were not included for this calculation. As shown in Table 7, averages of submitted data were fairly well agreed with the prepared values/concentrations within a range of 5.7%(K + ) to 1.0%(Ca 2+ ) for the sample No.041, and 5.3%(K + ) to 1.1%(pH) for the sample No.042. But there are a few laboratories that submitted measured values of considerable differences with prepared concentrations. Table 7 Constituents Summary of analytical results of the artificial rainwater samples (Reported data after removing of outliers) Prepared (Vp) Average (Va)?V/Vp (%) S.D. N Min. Max. [Sample No.041] ph EC(µmS/m) SO ( 4 µ - mol/l) NO - 3 (µmol/l) Cl - (µmol/l) Na + (µmol/l) K + (µmol/l) Ca 2+ (µmol/l) Mg 2+ (µmol/l) NH + 4 (µmol/l) [Sample No.042] ph EC(mS/m) SO 2-4 (µmol/l) NO - 3 (µmol/l) Cl - (µmol/l) Na + (µmol/l) K + (µmol/l) Ca 2+ (µmol/l) Mg 2+ (µmol/l) NH + 4 (µmol/l) (Note) Prepared: Value or concentration, which was calculated from the amount of chemicals, used for the preparation of samples.?v : Average(Va) - Prepared (Vp)
10 The Data Quality Objectives (DQOs) of EANET was specified for every constituent as ±15% by the QA/QC program of the EANET. In this report, analytical data on the artificial rainwater samples were compared with the prepared value/concentration and evaluated by the excess of DQOs value: the flag "E" was put to the data that exceed DQOs by a factor of 2 (±15%~±30%), and the flag "X" was put to the data that exceed DQOs more than a factor of 2 (<-30% or >30%). A set of data for each sample was evaluated by the data checking procedures described in chapter 2.5. The flag I and the flag C show a poor ion balance data sets, and a poor conductivity agreement data sets respectively. The results were evaluated by the three aspects : i) comparison of concentration dependence sample No.041 (higher concentrations) and No.042 (lower concentrations), ii) comparison of individual parameters, iii) comparison of circumstances of analysis in each participating laboratory. Evaluation of data on both the sample No.041 and No.042 is presented in 3.1 Comparison by Sample, evaluation of data for each constituent is presented in 3.2 Analytical Parameter, and evaluation of data by the circumstances of analysis such as analytical method used, experience of personnel, and other analytical condition is presented in 3.3 Circumstance of Sample Analysis.
11 3.1 Comparison by Sample Sample No.041 (higher concentrations) Table 8 Numbers of flagged data for the Sample No.041 (higher concentrations) Flag ph EC 2- SO 4 - NO 3 Cl - Na + K + Ca 2+ Mg 2+ + NH 4 Total E X Data within DQOs Flagged(%) *E : Value exceeded the DQO by a factor of 2 *X : Value exceeded the DQO more than a factor of 2 (Total data=270) For sample No.041 (higher concentrations), 23 analytical data out of 270 exceeded the DQOs by a factor of 2 and flagged by "E". 6 analytical data out of 270 exceeded the DQOs more than a factor of 2 and flagged by "X. Data flagged by "E" and "X" were 29 out of 270, shared about 10.7 percents of all reported data for sample No.041 (Fig.2). Especially measured values of K + and NH 4 + have many results with flags. (Table9) Comparing the results in 2004 with that in 2003, especially the ratio of flagged data in Na + decreased. On the other hand, the ratio of flagged data in K + increased. E 8.5% X 2.2% Data within DQOs 89.3% Fig.2 Percentage of flagged data for Sample No.041

12
13 Sample No.042 (lower concentrations) Table 10 Number of flagged data for the Sample No.042 (lower concentrations) Flag ph EC SO 4 2- NO 3 - Cl - Na + K + Ca 2+ Mg 2+ + NH 4 Total E X Data within DQOs Flagged(%) (Total data=270) *E : Value exceeded the DQO by a factor of 2 *X : Value exceeded the DQO more than a factor of 2 For sample No.042 (lower concentrations), 25 analytical data out of 270 exceeded the DQOs by a factor of 2 and flagged by "E". 10 analytical data out of 270 exceeded the DQOs more than a factor of 2 and flagged by "X". Data flagged by E and X were 35 analytical data out of 270, shared up to 13.0 percents of all reported data for sample No.042 (Fig.3).Many data on Ca 2+, Mg 2+ and NH 4 + were marked with flags E or flags X (Table 11). Comparing the results in 2004 with that in 2003, the ratio of flagged data of 8 constituents decreased. Especially the ratio of K + decreased significantly. On the other hand, the ratio of Ca 2+ increased. E 9.3% X 3.7% Data within DQOs 87.0% Fig.3 Percentage of flagged data for Sample No.042 Evaluation The ratio of the flagged data for sample No.041 was 10.7 percent, and the No.031 (2003) was 14.3 percent. Both of them had almost same concentration for each ion. For the sample with low concentration, the ratio of flagged data in the sample No.042 was 13.0 percent and the No.032 (2003) was 18.2 percent. In general terms, this indicates the difficulty of the analysis would depend on the concentration in the sample especially on the trace analysis.
14
15 3.2 Analytical Parameter The general overviews of data were presented below in Figures and Tables for each analytical parameter. The results received from each laboratory were normalized by prepared values to evaluate their deviation. The numbers of flagged data were indicated in table for each analytical parameter. ph 60 % 45 % 30 % 15 % 0 % -15 % KH01 ID01 CN01 JP01 JP03 TH05 CN03 JP05 JP07 MY01 RU02 TH02 PH01 TH04 CN02 CN04 ID02 JP02 JP04 JP06 JP08 MN01 RU01 TH01 TH03 VN01 LA01 KR01-30 % -45 % -60 % Sample No.041 Sample No.042 Fig.4 Distribution of ph data normalized by prepared value Table 12 Analytical method and flagged data of ph Analytical Method ph meter and electrode 28/28 Flagged data E X Flagged (%) Sample No Sample No All participating laboratories used ph meter with glass electrode for measurement of ph. Most of the obtained data satisfied the DQOs of the QA/QC program of the EANET. Many laboratories submitted slightly higher ph values than prepared value. The relative standard deviations of the ph values for sample No.041 and No.042 were good to be 1.4% and 2.1%.
16 EC 60 % 45 % 30 % 15 % 0 % -15 % -30 % ID01 RU02 JP01 JP05 MY01 CN03 TH03 KR01 CN01 JP03 JP07 PH01 TH01 VN01 JP06 ID02 JP08 CN02 JP02 JP04 MN01 RU01 TH02 TH05 LA01 CN04 TH04 KH01-45 % -60 % Sample No.041 Sample No.042 Fig.5 Distribution of EC data normalized by prepared value Table 13 Analytical method and flagged data of EC Analytical Method Conductivity meter and cell 28/28 Flagged data E X Flagged (%) Sample No Sample No All participating laboratories used conductivity cell for the measurement of EC. Obtained data almost satisfied the DQOs of the QA/QC program of the EANET. However, Lab.TH04 reported the data flagged by E in both sample. It had some problem in a calibration for the measurement. 13 of 28 laboratories reported lower data than prepared value for both sample No.041 and No.042.
17 SO % 45 % 30 % 15 % 0 % -15 % -30 % CN01 CN03 ID01 JP04 JP07 MY01 RU01 JP01 TH01 TH03 TH05 * KH01 CN02 CN04 JP03 KR01 PH01 JP05 MN01 VN01 JP02 JP08 RU02 ID02 JP06 TH04 TH02-45 % -60 % Sample No.041 Sample No.042 * : the value of KH01 data in No.042 sample was submitted <10 (µ mol/l ) Fig.6 Distribution of SO 4 2- data normalized by prepared concentration Table 14 Analytical method and flagged data of SO 4 2- Analytical Method Ion chromatography 25/27 Spectrophotometry 1/27 Nephelometry 1/27 Flagged data E X Flagged (%) Sample No Sample No All of the participating laboratories used ion chromatography for the determination of SO 4 2- except for two laboratories. One laboratory (RU02) used Nephelometry and another laboratory (KH01) used Spectrophotometry. Results of TH05 had E flag for both of samples and one s from TH04 flagged in the sample No.042. Both laboratories reported lower data than the prepared value.
18 NO 3-60 % 45 % 30 % 15 % 0 % -15 % -30 % -45 % JP07 PH01 CN02 CN04 ID02 JP02 JP04 JP06 JP08 MY01 RU01 VN01 TH01 TH03 CN03 JP05 ID01 MN01 CN01 JP01 JP03 TH05 RU02 KR01 TH02 TH04 KH01-60 % Sample No.041 Sample No.042 Fig.7 Distribution of NO 3 - data normalized by prepared concentration Table 15 Analytical method and flagged data of NO 3 - Analytical Method Ion chromatography 25/27 Spectrophotometry 1/27 Colorymetry 1/27 Flagged data E X Flagged (%) Sample No Sample No All of the participating laboratories used ion chromatography for the determination of NO 3 - except for two laboratories. One laboratory (RU02) used Colorymetry and another laboratory (KH01) used Spectrophotometry. Almost all of the laboratories reported lower data than prepared value for both sample No.041 and No.042. The ratio of flagged data was decreased approximately twice as much as the project 2003 for the sample with higher concentration. The data of the Lab.TH04 (obtained with ion chromatography) were flagged in sample No.041 and No.042.
19 Cl - 60 % 45 % 30 % 15 % 0 % -15 % -30 % PH01 KR01 CN02 ID02 JP05 MN01 RU01 CN04 JP03 JP07 TH01 TH03 CN01CN03 JP08 ID01 JP02 JP04 JP01 RU02 TH02 JP06 MY01 TH04 VN01 KH01-45 % TH05-60 % Sample No.041 Sample No.042 Fig.8 Distribution of Cl - data normalized by prepared concentration Table 16 Analytical method and flagged data of Cl - Analytical Method Ion chromatography 25/27 Titration 2/27 Flagged data E X Flagged (%) Sample No Sample No Same as for analysis of SO 4 and NO - 3, 25 laboratories used ion chromatography for the determination of Cl -. The Lab.RU02 and KH01 used titration method. Lab.TH05 reported the data flagged by X. The ratio of the flagged data in the higher concentration sample is higher than that in the lower concentration as same as the data in last year. The data of Lab.TH05 exceeded 30% for both sample No.041 and No.042. Inappropriate analytical condition seemed to be one of the possible causes on checking IC chromatogram.
20 Na + 60 % 45 % 30 % 15 % 0 % -15 % -30 % TH04 CN01 JP04 MN01 CN04 JP02 JP07 KR01 RU01 VN01 TH01 CN03 JP01 JP03 JP05 JP08 CN02 MY01 TH02 ID01 TH05 JP06 ID02 PH01 TH03 RU02-45 % -60 % Sample No.041 Sample No.042 Fig.9 Distribution of Na + data normalized by prepared concentration Table 17 Analytical method and flagged data of Na + Analytical Method Ion chromatography 22/26 Atomic absorption spectrometry 3/26 Flame (emission) spectrometry 1/26 Flagged data E X Flagged (%) Sample No Sample No laboratories used ion chromatography, 3 laboratories used atomic absorption spectrometry (Lab. KR01 PH01, RU01), and 1 Laboratory used flame (emission) photometry (Lab.RU02) for the determination of Na +. The concentrations of the sample No.041 and No.042 were 1.5 times higher than that of the sample No.031 and No.032 respectively. There was no flag in the sample No.041. And for the sample No.042 the ratio of flagged data decreased a little..
21 K + 60 % KR01 45 % 30 % JP07 MN01 15 % 0 % CN01 CN04 CN03 ID02 JP04 JP06 PH01 TH02 TH04 VN01-15 % -30 % CN02 ID01 JP02 JP03 JP01 JP05 JP08 MY01 RU01 TH01 RU02 TH05-45 % -60 % TH03 Sample No.041 Sample No.042 Fig.10 Distribution of K + data normalized by prepared concentration Table 18 Analytical method and flagged data of K + Analytical Method Ion chromatography 22/26 Atomic absorption spectrometry 3/26 Flame (emission) spectrometry 1/26 Flagged data E X Flagged (%) Sample No Sample No laboratories used ion chromatography for the determination of K +, 3 laboratories used atomic absorption spectrometry and one laboratory used flame (emission) photometry. The ratio of flagged data in the sample of higher concentration is higher than the one of lower concentration. Comparing the ratio of flagged data with 2003 project, it was decreased significantly for the sample No.042. Otherwise the number of flagged data in the sample No.041 was increased. The concentration K + of deionized water in Lab. MN01 was higher and this seemed to affect on analytical data. Lab.TH03 reported the values approximately of a half of the prepared value for the sample No.042.
22 Ca % 45 % 30 % 15 % 0 % -15 % -30 % -45 % VN01 JP03 TH02 CN03 ID02 CN04 TH05 CN01 TH01 JP08 MN01 RU01 TH03 JP05 MY01 KH01 CN02 ID01 PH01 JP04 JP07 RU02 JP01 JP06 JP02 TH04 KR01-60 % Sample No.041 Sample No.042 Fig.11 Distribution of Ca 2+ data normalized by prepared concentration Table 19 Analytical method and flagged data of Ca 2+ Analytical Method Ion chromatography 22/27 Atomic absorption photometry 5/27 Flagged data E X Flagged (%) Sample No Sample No laboratories used ion chromatography, and 5 laboratories used atomic absorption spectrometry for the determination of Ca 2+. The ratio of flagged data in the sample No.041 decreased a little. 8 laboratories had flagged data of the lower concentration sample in this year. There were many flagged data in the samples No.041. The concentration of Ca 2+ (10.0 µ mol/l) in the sample No.042 was 2 times higher than that of the project However the ratio of flagged data increased. This indicates the analysis of Ca 2+ is difficult and should be carried out with particular attention to analytical condition of the equipments, preparation of standard solution and so on.
23 Mg % 45 % ID02 30 % 15 % CN02 CN04 TH02 RU01 RU02 TH05 KH01 0 % -15 % -30 % -45 % -60 % CN01 CN03 ID01 JP02 JP04 JP01 JP05 JP03 JP06 JP08 MN01 JP07 KR01 MY01 PH01 TH01 TH03 TH04 VN01 Sample No.041 Sample No.042 Fig.12 Distribution of Mg 2+ data normalized by prepared concentration Table 20 Analytical method and flagged data of Mg 2+ Analytical Method Ion chromatography 22/27 Atomic absorption spectrometry 5/27 Flagged data E X Flagged (%) Sample No Sample No Ion chromatography and atomic absorption spectrometry were used in the analysis of Mg 2+. The flagged ratio for the higher concentration sample decreased almost twice and for the lower concentration sample less than in last project. The data of Lab.TH05 exceeded 30% for both sample No.041 and No.042. Lab.ID02 reported the values approximately twice higher than the prepared concentration of the sample No.042. The flagged data for ID02 would be cased by the preparation of standard solution.
24 NH % 45 % 30 % 15 % 0 % -15 % -30 % -45 % -60 % ID01 CN01 CN03 CN04 CN02 ID02 RU02 MN01 JP01 JP03 JP08 TH02 JP06 TH04 VN01 JP04 MY01 JP07 RU01 TH01 TH05 JP02 JP05 KR01 PH01 TH03 KH01 Sample No.041 Sample No.042 Fig.13 Distribution of NH 4 + data normalized by prepared concentration Table 21 Analytical method and flagged data of NH 4 + Analytical Method Ion chromatography 22/27 Spectrometry (Indophenol blue) 2/27 Other method (Spectrometry) 1/27 Other method (Colorymetry) 2/27 Flagged data E X Flagged (%) Sample No Sample No laboratories used recommended analytical method of EANET for the determination of NH 4 + : 22 laboratories used ion chromatography; two laboratories used spectrometry (Indophenol blue). One laboratory used spectrometry without using indophenol blue method; Two laboratories used Colorymetry. Although the concentration of sample No.042 (15.1mol/ L) was same as the sample No.032 (project 2003), the ratio of flagged data in sample No.042 were lower than that in the project 2003.
25 Overall Evaluation The concentrations of anions in the samples No.041 were approximately the same as of project 2003 sample except Ca 2+. The concentration of ions in the sample No.042 with low concentration was the same as the project in the range of ratio 0.76 to times except K + and Ca 2. The relative standard deviation (R.S.D) of the sample No.041 and No.042 are shown in the figure 14. The R.S.D of each parameter was same or less comparing to the project 2003 except Mg 2+ of the sample No.42. Comparing the ratio of the flagged data, the ratios of the sample No.031 (2003) and the sample No.041 (with higher concentration) were 14.3% and 10.7% respectively. The ratio of the sample No.032 (2003) and No.042 (with lower concentration) were 18.2% and 13.0% respectively. As reported in the Report of the Inter-laboratory Comparison Project 2003 on Wet Deposition the ratio of flagged data was affected by the concentration of the ions. In this project, as same as project 2003, there are some laboratories having problems in the determination of the ions and the measurement of ph and EC. Main reasons of the flagged data were an incorrect deriving of the calibration curve. The person in charge of analysis should confirm the calibration curve drown on the chart. And before the analysis of the rain samples, the reliability of the calibration should be examined by using the working standard. This practice would avoid the acquisition of low-trust data relative standerd diviation (%) ph EC SO42- NO3- Cl- Na+ K+ Ca2+ Mg2+ NH4+ No.041 No.042 Fig.14 Relative standard deviation of each constituent data (Relative standard deviation (%) = (Standard deviation / Average) x100; Reported data after removing the outliers)
26 3.3 Circumstance of Sample Analysis Methods Used As shown in Fig.15, the most of participating laboratories used recommended methods of EANET. There are 25/27 laboratories used ion chromatography for the determination of anions. One laboratory used Spectrophotmetry in the determination of SO 4 2- and NO 3 -. and another laboratory used Nephelometry(*), or Colorymetry(*). And two laboratories used Titration in the determination of Cl -. As for determination of the cations, 22 of 26 laboratories used ion chromatography. 3 (Na +, K + ) and 4 (Ca 2+, Mg 2+ ) laboratories used Atomic Absorption Spectrometry. One laboratory used Emission Spectrometry (Na +, K + ). Regarding the NH 4 +, two laboratories used Indophenol Spectrophotometry, one laboratory used Spectrophotometry, and two laboratories used the Colorymetry. *:Nephelometry and Colorimetry are included in Spectrophotometry ph EC SO42- NO3- Cl- Na+ K+ Ca2+ Mg2+ NH4+ 0% 20% 40% 60% 80% 100% Recomended methods Other methods Fig.15 Ratio of recommended method used in the project
27 Table 22 List of methods Code Method 0 ph meter with electrode 1 Conductivity cell 2 Titration 3 Atomic Absorption Spectrometry 4 Emission Spectrometry 5 Ion chromatography 6 Inductively Coupled Plasma - Atomic Emission Spectrometry (ICP - AES) 7 Spectrophotometry 8 Indophenol Spectrophotometry (NH + 4 ) 9 Inductively Coupled Plasma - Mass Spectrometry (ICP - MS) 10 Graphite Furnace Atomic Absorption spectrometry (GFAA) 11 Other method SampleNo.041 Method ph EC 2- SO 4 - NO 3 Cl - Na + K + Ca 2+ Mg 2+ + NH (1) 1 28(2) 2 2(1) 3 3 3(1) 5(1) 5(1) (1) 25(2) 25(3) 22 22(4) 22(3) 22(2) 22(2) 6 7 2(1) 2(1) 3(2) 8 2(1) Flagged E Flagged X Sample No.042 Method ph EC 2- SO 4 - NO 3 Cl - Na + K + Ca 2+ Mg 2+ + NH (1) (2) 3(1) 5(2) 4(1) 4 1(1) (2) 25(2) 25(2) 22 22(2) 22(6) 22(5) 22(3) 6 7 2(1) 2(1) 3(1) 8 2(2) Flagged E Flagged X Table 23 Number of laboratories used different analytical method Reverse mesh is recommended method of EANET ( ): Number of data flagged by E or X
28 Number of staff in charge of measurement The number of staff in charge of measurement on rainwater samples is described in Table 24. In 18 laboratories only one person carried out measurement of rainwater samples. In 5 laboratories two persons carried it. Three persons carried it in 4 laboratories. And four persons made measurements in one. In the laboratories where 3 persons carried out measurement, their responsibilities were separated according to the methods used for analysis such as ph-ec, anions and cations (CN02, MY01, TH05), ph-ec-nh 4 +, anions and cations (RU01). In PH01, 4 persons carried out measurement and their responsibilities were separated ph-ec, anions, cations and NH 4 +. Table 24 Staff in charge of measurement Lab.ID Total ph EC SO42- NO3- Cl- Na+ K+ Ca2+ Mg2+ NH4+ CN01 1 A A A A A A A A A A CN02 3 A A B B B C C C C C CN03 1 A A A A A A A A A A CN04 1 A A A A A A A A A A ID01 2 A A A A A B B B B B ID02 1 A A A A A A A A A A JP01 1 A A A A A A A A A A JP02 1 A A A A A A A A A A JP03 1 A A A A A A A A A A JP04 1 A A A A A A A A A A JP05 1 A A A A A A A A A A JP06 1 A A A A A A A A A A JP07 1 A A A A A A A A A A JP08 1 A A A A A A A A A A KR01 1 A A A A A A A A A A MY01 3 A A B B B C C C C C MN01 2 A B B B B A A A A A PH01 4 A A B B B C C C C D RU01 3 A A B B B C C C C A RU02 1 A A A A A A A A A A TH01 2 A B B B B A A A A A TH02 1 A A A A A A A A A A TH03 1 A A A A A A A A A A TH04 1 A A A A A A A A A A TH05 3 A A B B B C C C C C VN01 2 A A B B B A A A A A KH01 2 A A A B A B LA01 1 A A A, B, C, and D represent individuals of staff in each laboratory who are in charge of measurement. Reverse mesh: Flagged data of E or X in sample No.041 and/or sample No.042. Reverse mesh with dark are flagged data of both sample No.041 and No.042
29 Years of experience (Acid rain) According to information obtained through this project, clear evidence of data quality improvement was not found in terms of years of experience of the staff, same as previous surveys. In the Lab. JP02, JP06 and MY01 this year project was the first experience for the staff. The average of the years of the experience in each analysis was in the range from 5.98 (EC) to 6.98 (anions). The average in 2003 project was the range from 5.11 to The reason why the average in this year was about one year higher than that in last year was that there were the cases that same person analyzed in almost the laboratories. Table 25 Years of experience Lab.ID ph EC SO4 2- NO3 - Cl - Na + K + Ca 2+ Mg 2+ NH4 + CN CN CN CN ID ID JP JP JP JP JP JP JP JP KR MY MN PH RU RU TH TH TH TH TH VN KH LA Unit: year Reverse mesh: Flagged data of E or X in sample No.041 and/or sample No.042 Reverse mesh with dark are flagged date of both sample No.041 and No year means experience with one year or less
30 The number of flagged data in laboratories. The rate of laboratories 45% 40% 35% 30% 25% 20% 15% 10% 5% 0% The number of flagged data Fig.16 The distribution of laboratories with the number of flagged data Table 26 Number of flagged data in each laboratory. Number of flagged data Number of laboratories Share % % 2 2 7% 3 1 4% % 5 0 0% 6 2 7% 7 1 4% 8 0 0% 9 0 0% % % % % % % % In this project, the total number of flagged data was 64 (E48, X16) among the whole set of 540 data. The attribution of flagged data in each laboratory was presented in Table 26. The number of excellent laboratories without flagged data was 12, which was equivalent to about 43% of the all-participating laboratories. The number of laboratories that submitted less than 2 flagged data were 17(60%)during the comparison test carried out in 2003, but there were 17 (63%) laboratories this time. There was one laboratory that produced more than 10 flagged data. One laboratory should make more efforts for preparing standard solutions and also for the operation of the equipment.
31 Water temperature at measurement (ph and EC) As described in Table 27, most of the participating laboratories measured ph and EC at temperature around 25 C as recommended condition by EANET. Unfortunately, even though measure temperature was around 25 C, one laboratory had the flagged data in ph measurement and two laboratories had the flagged data in EC measurement. Table 27 Water temperature at measurement (ph and EC) ph EC lab.id No.041 No.042 No.041 No.042 CN CN CN CN ID ID JP JP JP JP JP JP JP JP KR MY MN PH RU RU TH TH TH TH TH VN KH LA Reverse mesh with light are flagged data of E Reverse mesh with dark are flagged date of X Unit: degrees centigrade
32 4. COMPARISON OF 1 st, 2 nd, 3 rd, 4 th, 5 th, 6 th AND 7 th SURVEY The inter-laboratory comparison surveys were carried out 7 times, so far their results with the ratios of flagged data are shown in Fig. 17. The rate of data that satisfied the required data quality objectives (DQOs) increased from 75-78% to 84-93% until the 4 th (2001) survey. The data quality seemed to be improved by accumulating experiences. But on the 5 th project (2002), both DQOs on the higher concentration sample and the lower concentration sample decreased because the ion concentrations were a half of their content in the samples of previous projects (Table 28). In both the higher concentration sample (correspond to the sample NO.041 on 7 th project) and the lower concentration sample (correspond to the sample NO.042 on 7 th project), the number of data within DQOs increased in 7 th project. Especially for the sample No.42, the number of data within DQOs was the best among all surveys. It seems that the quality of the ion analysis was improved in many laboratories. 100% % % 60% % 60% % % % 20% 0% 1st. 2nd. 3rd. 4th. 5th. 6th. 7th. 0% 1st. 2nd. 3rd. 4th. 5th. 6th. 7th. higher concentration sample lower concentration sample Fig. 17 Comparison of 1 st, 2 nd, 3 rd, 4 th, 5 th, 6 th and 7 th inter-laboratory comparison project
33 Table 28 The prepared values of each parameter of artificial rainwater of inter laboratory comparison projects of EANET ph EC 2- SO 4 - NO 3 Cl - Na + K + Ca 2+ Mg 2+ + NH 4 ( - ) (ms/m) (µmol/l) (µmol/l) (µmol/l) (µmol/l) (µmol/l) (µmol/l) (µmol/l) (µmol/l) No No No No No No No No No No No No No No
34 5. FOR IMPROVEMENT OF MEASUREMENT PRECISIONS The following fundamental matters should be taken into account in measurement, analysis, and data control processes. 5.1 Fundamental measurement and analysis matters Clearance from contamination of the apparatus, materials and reagents used for measurement and analysis must be confirmed beforehand. Blank values of target substances should be as low as possible. Measurement and analysis should be conducted by persons who are well trained. To maintain high analytical quality, SOPs (Standard operating procedures) must be prepared for the management of apparatus, reagents, and procedure of operation. Other details on measurement and analysis of samples are as follows. 1) Deionized water Water with a conductivity less than 0.15mS/m is acceptable for measurements, analyses, dilution of precipitation samples and cleaning. 2) Reference Materials In order to assure the reliability and traceability of measurements, the reference materials should be used as much as possible. 3) Pretreatment of samples at analytical laboratory Conductivity and ph should be measured as soon as possible after sample receiving, and checking agreement of samples and sample list. Effort should be made to start analysis of the other parameters within a week of sample arrival in the laboratory and to complete the data sets by measuring EC, ph and all other chemical parameters. 4) Adjustment of analytical instruments Each of the analytical instruments must be calibrated when they are used, and they should be adjusted as appropriate. 5.2 Evaluation of reliability 1) Sensitivity fluctuation of analytical instruments While numerous samples are measured, measurements should be continued after confirming that the sensitivity fluctuation is within the prescribed range. a) For example, Ion chromatography A new calibration should be performed not more than 30-sample measurements. Reference materials should be measured after the calibration. It should also be done once or twice before the next calibration. Control charts should be applied for the measurement of the reference materials. Standard solutions and reference solutions must be prepared from different stock solutions in order to be independent. If the analytical results of reference materials are outside of 3 standard deviations, or out of 15 % from the expected value, the reasons should be found and corrections will be made, and reference materials will be measured again. If the retention time changes slowly while the separator column is deteriorating, then adequate actions could be taken as appropriate. If it changes significantly in a relatively short time, the reasons should be found and removed, then the reference
35 material must be measured again. 5.3 Data control 1) Data check in analysis organizations When the sensitivity of instruments is not stable, or when R1 and/or R2 (See page 5, 6) is out of allowable range, measurement should be repeated since reliability is low. When samples seem to be obviously contaminated, these data should be treated as unrecorded data. Abnormal or unrecorded data can corrupt research results. So, careful checks are needed to avoid data of inadequate quality. When abnormal or unrecorded data appear, the process should be carefully reviewed to prevent the occurrence of the same problem in the future.
36 6. REFERENCES 1) Guidelines for Acid Deposition Monitoring in East Asia March 2000 adopted at: The Second Interim Scientific Advisory Group Meeting of Acid Deposition Monitoring Network in East Asia. 2) Technical Documents for Wet Deposition Monitoring in East Asia Technical Manual for Wet Deposition Monitoring in East Asia Quality Assurance / Quality Control (QA/QC) Program for the Preparatory-Phase Wet Deposition Monitoring in East Asia, March 2000 adopted at: The Second Interim Scientific Advisory Group Meeting of Acid Deposition Monitoring Network in East Asia. 3) Report of the Inter-laboratory Comparison Project 1998 (Round robin analysis survey 1 st Attempt) November ) Report of the Inter-laboratory Comparison Project 1999 (Round robin analysis survey 2 nd Attempt) October ) Report of the Inter-laboratory Comparison Project 2000 (Round robin analysis survey 3 rd Attempt) October ) Report of the Inter-laboratory Comparison Project 2001 (Round robin analysis survey 4 th Attempt) November ) Report of the Inter-laboratory Comparison Project 2002 (Round robin analysis survey 5 th. Attempt) November ) Report of the Inter-laboratory Comparison Project 2003 (Round robin analysis survey 6 th Attempt) November 2004
37 7. CONTACT INFORMATION Please address all inquiries, comments and suggestions about this report to: Acid Deposition and Oxidant Research Center (ADORC) 1182, Sowa, Niigata-shi, , Japan Tel Fax URL Contact persons: Name Mr. Shinji NAKAYAMA (EANET QA/QC Manager) Mr. Hideto ABE Dr. Tsuyoshi OHIZUMI Department & address Dept. Head, Data Management Department Researcher, Data Management Department Dept. Head, Atmospheric Research Department
Report of the Inter-laboratory Comparison Project 2004 on Inland Aquatic Environment
 The Network Center for the Acid Deposition Monitoring Network in East Asia Report of the Inter-laboratory Comparison Project 2004 on Inland Aquatic Environment 5 th Attempt November 2005 Acid Deposition
Report of the Inter-laboratory Comparison Project 2011
 Acid Deposition Monitoring Network in East Asia ( EANET ) Report of the Inter-laboratory Comparison Project 211 14 th Inter-laboratory Comparison Project on Wet Deposition 7 th Inter-laboratory Comparison
Report of the Inter-laboratory Comparison Project 2012
 Acid Deposition Monitoring Network in East Asia ( EANET ) Report of the Inter-laboratory Comparison Project 212 15 th Inter-laboratory Comparison Project on Wet Deposition 8 th Inter-laboratory Comparison
Acid Deposition and Oxidant Research Center (ADORC)
") Standard Operating Procedures for H measurement Acid Deposition and Oxidant Research Center (ADORC) Introduction - What is SOPs? - Objectives of SOPs - Major Items to be included in the SOPs in wet deposition
Standard Operating Procedures for H measurement Acid Deposition and Oxidant Research Center (ADORC) Introduction - What is SOPs? - Objectives of SOPs - Major Items to be included in the SOPs in wet deposition
Anion and Cation analysis with Professional IC - automatic dilution and sample preparation with SPM
 IC Application Work AW CH6-1048-012011 Anion and Cation analysis with Professional IC - automatic dilution and sample preparation with SPM Branch: Chemical industry; Water, wastewater, environmental protection,
10 th UILI ILP Cations and Anions in Natural Water INSTRUCTION SHEET
 Pag. : 1/7 March 14, 2016 1. Name of the proficiency test 10 th UILI Interlaboratory Practice 2016 Cations and Anions in Natural Water Aimed as a global exercise for laboratories in different countries
ICP Waters report 129/2016
 REPORT S.NO. 7081-2016 ICP Waters report 129/2016 Intercomparison 1630: ph, Conductivity, Alkalinity, NO3-N, Cl, SO4, Ca, Mg, Na, K, TOC, Al, Fe, Mn, Cd, Pb, Cu, Ni and Zn The international Cooperative
Problems related to measurements of low values of total alkalinity
 EU/UN ECE - International Co-operative Programme on Assessment and Monitoring of Air Pollution Effects on Forests Working Group on QA/QC in Laboratories Meeting of the Heads of the Laboratories Zadar,
Precision of ion chromatographic analyses compared with that of other analytical techniques through intercomparison exercises
 JOURNAt. OF CHROMATOGRAPHY A ELSEVIER Journal of Chromatography A, 706 (1995) 13-19 Precision of ion chromatographic analyses compared with that of other analytical techniques through intercomparison exercises
Intercomparison 0923: ph, Cond, HCO3, NO3+NO2, Cl, SO4, Ca, Mg, Na, K, TOC, Al, Fe, Mn, Cd, Pb, Cu, Ni and Zn.
 Convention on Long-Range Transboundary Air Pollution International Cooperative Programme on Assessement and Monitoring of Acidification of Rivers and Lakes ICP Waters Report 98/2009 Intercomparison 0923:
Intercomparison 0620: ph, Cond, HCO3, NO3+NO2, Cl, SO4, Ca, Mg, Na, K, Fe, Mn, Cd, Pb, Cu, Ni, and Zn
 Convention on Long-range Transboundary Air Pollution International Cooperative Programme on Assessement and Monitoring of Acidification of Rivers and Lakes 86/2006 Intercomparison 0620: ph, Cond, HCO3,
Test Method: CPSC-CH-E
 UNITED STATES CONSUMER PRODUCT SAFETY COMMISSION DIRECTORATE FOR LABORATORY SCIENCES DIVISION OF CHEMISTRY 10901 DARNESTOWN RD GAITHERSBURG, MD 20878 Test Method: CPSC-CH-E1001-08 Standard Operating Procedure
Understanding and Interpreting Soil and Plant Tissue Lab Reports
 Understanding and Interpreting Soil and Plant Tissue Lab Reports Dirk Holstege Director, UC Davis Analytical Laboratory dmholstege@ucdavis.edu 530-752-0148 224 Hoagland Hall UC Davis Anlab.ucdavis.edu
Glossary of Common Laboratory Terms
 Accuracy A measure of how close a measured value is to the true value. Assessed by means of percent recovery of spikes and standards. Aerobic Atmospheric or dissolved oxygen is available. Aliquot A measured
Intercomparison 0822: ph, Cond, HCO 3 , NO 3 +NO 2. , Cl, SO 4. , Ca, Mg, Na, K, Fe, Mn, Cd, Pb, Cu, Ni and Zn.
 Convention on Long-Range Transboundary Air Pollution International Cooperative Programme on Assessement and Monitoring of Acidification of Rivers and Lakes ICP Waters Report 93/2008 Intercomparison 0822:
atomic absorption spectroscopy general can be portable and used in-situ preserves sample simpler and less expensive
 Chapter 9: End-of-Chapter Solutions 1. The following comparison provides general trends, but both atomic absorption spectroscopy (AAS) and atomic absorption spectroscopy (AES) will have analyte-specific
SPECIMEN L2. Level 1/2 Cambridge National Certificate in R075/02 SCIENCE IN THE WORKPLACE. Duration: 1 hour. Candidate Forename.
 SPECIMEN L2 Level 1/2 Cambridge National Certificate in R075/02 SCIENCE IN THE WORKPLACE R075: How scientific data is used (Level 2) Candidates answer on the question paper OCR Supplied Materials: None
UNIVERSITI SAINS MALAYSIA. Second Semester Examination Academic Session 2004/2005. March KAA 502 Atomic Spectroscopy.
 UNIVERSITI SAINS MALAYSIA Second Semester Examination Academic Session 2004/2005 March 2005 KAA 502 Atomic Spectroscopy Time: 3 hours Please make sure this paper consists of FIVE typed pages before answering
SeCtiOn 7 [STOCK AND CUSTOM] Ion Chromatography Single and Multi-Element Standards
![SeCtiOn 7 [STOCK AND CUSTOM] Ion Chromatography Single and Multi-Element Standards](/thumbs/86/93303672.jpg "SeCtiOn 7 [STOCK AND CUSTOM] Ion Chromatography Single and Multi-Element Standards") SeCtiOn 7 [STOCK AND CUSTOM] Ion Chromatography Single and Multi-Element Standards Your Science is Our Passion. Ion Chromatography Standards As with SPEX CertiPrep s Assurance Standards, every IC Standard
SeCtiOn 7 [STOCK AND CUSTOM] Ion Chromatography Single and Multi-Element Standards Your Science is Our Passion. Ion Chromatography Standards As with SPEX CertiPrep s Assurance Standards, every IC Standard
Simplified Analysis for Soil Samples with Compact Water Quality Meter <LAQUAtwin>
 Feature Article Simplified Analysis for Soil Samples with Compact Water Quality Meter Measurement of exchangeable calcium ion and potassium ion in soil Keiko KUWAMOTO Exchangeable calcium ion
USGS Troy WSC Laboratory Inductively Coupled Plasma- NH4Cl Soil Extracts SOP 425 Jordan Road Rev. No. 2.0 Troy, NY Date: 03/16/2012 Page 1 of 7
 Troy, NY 12180 Date: 03/16/2012 Page 1 of 7 USGS District Laboratory, Troy, NY Inductively Coupled Plasma Optical Emission Spectrometry Standard Operating Procedure 1. Scope and Application 1.1 Analytes
Laboratory Techniques 100: Back To Basics. Carol Injasoulian Lab Manager City of Bay City April 29,2015
 Laboratory Techniques 100: Back To Basics Carol Injasoulian Lab Manager City of Bay City April 29,2015 QA/QC for Environmental Measurement What is quality assurance (QA)? Broad plan to maintain quality
ICP Waters Report 134/2017 Intercomparison 1731: ph, Conductivity, Alkalinity, NO3-N, Cl, SO4, Ca,Mg, Na, K, TOC, Al, Fe, Mn, Cd, Pb, Cu, Ni, and Zn
 RAPPORT L.NR. 7207-2017 Photo: NIVA ICP Waters Report 134/2017 Intercomparison 1731: ph, Conductivity, Alkalinity, NO3-N, Cl, SO4, Ca,Mg, Na, K, TOC, Al, Fe, Mn, Cd, Pb, Cu, Ni, and Zn International Cooperative
METHOD 9252A CHLORIDE (TITRIMETRIC, MERCURIC NITRATE)
") METHOD 9252A CHLORIDE (TITRIMETRIC, MERCURIC NITRATE) 1.0 SCOPE AND APPLICATION 1.1 This method is applicable to ground water, drinking, surface, and saline waters, and domestic and industrial wastes.
METHOD 9252A CHLORIDE (TITRIMETRIC, MERCURIC NITRATE) 1.0 SCOPE AND APPLICATION 1.1 This method is applicable to ground water, drinking, surface, and saline waters, and domestic and industrial wastes.
Tex-620-J, Determining Chloride and Sulfate Contents in Soil
 Contents in Soil Contents: Section 1 Overview...2 Section 2 Sample Preparation...3 Section 3 Ion Chromatography Method...5 Section 4 Wet Chemical Method...9 Section 5 Archived Versions...15 Texas Department
UNIVERSITY OF CAMBRIDGE INTERNATIONAL EXAMINATIONS General Certificate of Education Advanced Subsidiary Level and Advanced Level
 UNIVERSITY OF CAMBRIDGE INTERNATIONAL EXAMINATIONS General Certificate of Education Advanced Subsidiary Level and Advanced Level *4827396477* CHEMISTRY 9701/35 Advanced Practical Skills October/November
EXPERIMENT 7. Determination of Sodium by Flame Atomic-Emission Spectroscopy
 EXPERIMENT 7 Determination of Sodium by Flame Atomic-Emission Spectroscopy USE ONLY DEIONIZED WATER (NOT DISTILLED WATER!) THROUGHOUT THE ENTIRE EXPERIMENT Distilled water actually has too much sodium
During photosynthesis, plants convert carbon dioxide and water into glucose (C 6 H 12 O 6 ) according to the reaction:
 according to the reaction:") Example 4.1 Stoichiometry During photosynthesis, plants convert carbon dioxide and water into glucose (C 6 H 12 O 6 ) according to the reaction: Suppose that a particular plant consumes 37.8 g of CO 2
Example 4.1 Stoichiometry During photosynthesis, plants convert carbon dioxide and water into glucose (C 6 H 12 O 6 ) according to the reaction: Suppose that a particular plant consumes 37.8 g of CO 2
18 th UILI ILP Cations and Anions in Natural Water INSTRUCTION SHEET
 Pag. : 1/7 May 23, 2017 1. Name of the proficiency test 18 th UILI Interlaboratory Practice 2018 Cations and Anions in Natural Water Aimed as a global exercise for laboratories in different countries of
Flushing Out the Moles in Lab: The Reaction of Calcium Chloride with Carbonate Salts
 Flushing Out the Moles in Lab: The Reaction of Calcium Chloride with Carbonate Salts Pre-lab Assignment: Reading: 1. Chapter sections 3.3, 3.4, 3.7 and 4.2 in your course text. 2. This lab handout. Questions:
Determination of the inorganic ion composition of standing surface water
 2. Experiment Determination of the inorganic ion composition of standing surface water Objectives All the biologically important inorganic chemical parameters of standing surface water are called halobity.
METHOD 9210 POTENTIOMETRIC DETERMINATION OF NITRATE IN AQUEOUS SAMPLES WITH ION-SELECTIVE ELECTRODE
 METHOD 9210 POTENTIOMETRIC DETERMINATION OF NITRATE IN AQUEOUS SAMPLES WITH ION-SELECTIVE ELECTRODE 1.0 SCOPE AND APPLICATION 1.1 This method can be used for measuring total solubilized nitrate in drinking
Persulfate Digestion Method Method to 25.0 mg/l N (LR) Test N Tube Vials
 Test N Tube Vials") Nitrogen, Total DOC316.53.01086 Persulfate Digestion Method Method 10071 0.5 to 25.0 mg/l N (LR) Test N Tube Vials Scope and application: For water and wastewater. Test preparation Instrument-specific
Nitrogen, Total DOC316.53.01086 Persulfate Digestion Method Method 10071 0.5 to 25.0 mg/l N (LR) Test N Tube Vials Scope and application: For water and wastewater. Test preparation Instrument-specific
Persulfate Digestion Method Method to 150 mg/l N (HR) Test N Tube Vials
 Test N Tube Vials") Nitrogen, Total DOC316.53.01085 Persulfate Digestion Method Method 10072 2 to 150 mg/l N (HR) Test N Tube Vials Scope and application: For water and wastewater. Test preparation Instrument-specific information
Nitrogen, Total DOC316.53.01085 Persulfate Digestion Method Method 10072 2 to 150 mg/l N (HR) Test N Tube Vials Scope and application: For water and wastewater. Test preparation Instrument-specific information
Standard Operating Procedure for: Conductivity Using Cole-Parmer Traceable Portable Conductivity Meter. Missouri State University.
 Standard Operating Procedure for: Conductivity Using Cole-Parmer Traceable Portable Conductivity Meter Missouri State University and Ozarks Environmental and Water Resources Institute (OEWRI) Prepared
Cambridge International Examinations Cambridge International Advanced Subsidiary and Advanced Level
 Cambridge International Examinations Cambridge International Advanced Subsidiary and Advanced Level *9763634822* CHEMISTRY 9701/36 Paper 3 Advanced Practical Skills 2 October/November 2014 2 hours Candidates
Sodium Chloride - Analytical Standard
 Sodium Chloride - Analytical Standard Determination of Total Mercury Former numbering: ECSS/CN 312-1982 & ESPA/CN-E-106-1994 1. SCOPE AND FIELD OF APPLICATION The present EuSalt Analytical Standard describes
Chem 130 Name Exam 2 October 11, Points Part I: Complete all of problems 1-9
 Chem 130 Name Exam October 11, 017 100 Points Please follow the instructions for each section of the exam. Show your work on all mathematical problems. Provide answers with the correct units and significant
2 SPECTROSCOPIC ANALYSIS
 2 SPECTROSCOPIC ANALYSIS 2.1 Introduction Chemical analysis falls into two basic categories: qualitative what is present quantitative how much is present Spectroscopy is capable of both types of analysis,
Speciation of Bromine Compounds in Ozonated Drinking Water using Ion Chromatography and Inductively Coupled Plasma Mass Spectrometry
 APPLICATION NOTE Speciation of Bromine Compounds in Ozonated Drinking Water using Ion Chromatography and Inductively Coupled Plasma Mass Spectrometry AN43227 Antonella Guzzonato 1, Shona McSheehy Ducos
Cambridge International Examinations Cambridge International Advanced Subsidiary and Advanced Level
 Cambridge International Examinations Cambridge International Advanced Subsidiary and Advanced Level CHEMISTRY 9701/31 Paper 3 Advanced Practical Skills 1 May/June 2014 2 hours Candidates answer on the
Determinations by Atomic Absorption Spectroscopy and Inductively Coupled Plasma-Atomic Emission
 0 chapter Sodium and Potassium Determinations by Atomic Absorption Spectroscopy and Inductively Coupled Plasma-Atomic Emission Spectroscopy 67 S. S. Nielsen (ed.), Food Analysis Laboratory Manual Springer
Europe and North America
 97/2009 NIVA REPORT SNO 5844-2009 RAPPORT L.NR. 6910-2015 NIVA: Norway s leading centre of competence in aquatic environments NIVA provides government, business and the public with a basis for preferred
LEAD (Colorimetric) 2. Muffle Furnace: Equipped with pyrometer and capable of operating at controlled temperatures up to 500 C
 2. Muffle Furnace: Equipped with pyrometer and capable of operating at controlled temperatures up to 500 C") LEADX.01-1 LEAD (Colorimetric) PRINCIPLE SCOPE Organic matter in the sample is destroyed by ignition in the presence of sulfuric acid. The residue is dissolved in dilute acid, and the lead is complexed
LEADX.01-1 LEAD (Colorimetric) PRINCIPLE SCOPE Organic matter in the sample is destroyed by ignition in the presence of sulfuric acid. The residue is dissolved in dilute acid, and the lead is complexed
V. LAB REPORT. PART I. ICP-AES (section IVA)
") V. LAB REPORT The lab report should include an abstract and responses to the following items. All materials should be submitted by each individual, not one copy for the group. The goal for this part of
V. LAB REPORT The lab report should include an abstract and responses to the following items. All materials should be submitted by each individual, not one copy for the group. The goal for this part of
SECTION D.2 AMMONIA NITROGEN
 SECTION D.2 AMMONIA NITROGEN CEDR Method Code: NH4F L01 a) Scope and Application i) This method describes the determination of low-level ammonia nitrogen concentrations in filtered samples taken from fresh
Chem 321 Name Answer Key D. Miller
 1. For a reversed-phase chromatography experiment, it is noted that the retention time of an analyte decreases as the percent of acetonitrile (CH 3 CN) increases in a CH 3 CN/H 2 O mobile phase. Explain
Cambridge International Examinations Cambridge Ordinary Level
 Cambridge International Examinations Cambridge Ordinary Level *6377602299* CHEMISTRY 5070/42 Paper 4 Alternative to Practical October/November 2015 1 hour Candidates answer on the Question Paper. No Additional
Cambridge International Examinations Cambridge International Advanced Subsidiary and Advanced Level
 *3682053586* Cambridge International Examinations Cambridge International Advanced Subsidiary and Advanced Level CHEMISTRY 9701/31 Paper 3 Advanced Practical Skills 1 May/June 2015 Candidates answer on
UNIVERSITY OF CAMBRIDGE INTERNATIONAL EXAMINATIONS General Certifi cate of Education Advanced Subsidiary Level and Advanced Level
 XtremePapers.com UNIVERSITY OF CAMBRIDGE INTERNATIONAL EXAMINATIONS General Certifi cate of Education Advanced Subsidiary Level and Advanced Level *8383886562* CHEMISTRY 9701/34 Advanced Practical Skills
Application note. Determination of exchangeable cations in soil extracts using the Agilent 4100 Microwave Plasma-Atomic Emission Spectrometer
 Determination of exchangeable cations in soil extracts using the Agilent 4100 Microwave Plasma-Atomic Emission Spectrometer Application note Agriculture Authors Annie Guerin INRA, Laboratoire d Analyses
Draft Method proposal: determination of glucoheptonic acid (HGA) in fertilizers.
 in fertilizers.") Draft Method proposal: determination of glucoheptonic acid (HGA) in fertilizers. 1 Scope This document describes a chromatographic method which allows the identification as well as the determination of
Draft Method proposal: determination of glucoheptonic acid (HGA) in fertilizers. 1 Scope This document describes a chromatographic method which allows the identification as well as the determination of
Determination of Total Bromine and Iodine Emission Spectrometric Method (ICP-OES) EuSalt/AS
 EuSalt/AS") Determination of Total Bromine and Iodine Page 2 of 5 1. SCOPE AND FIELD OF APPLICATION The present EuSalt Analytical Standard describes an inductively coupled plasma optical emission spectrometry method
Determination of Total Bromine and Iodine Page 2 of 5 1. SCOPE AND FIELD OF APPLICATION The present EuSalt Analytical Standard describes an inductively coupled plasma optical emission spectrometry method
Properties of Compounds
 Chapter 6. Properties of Compounds Comparing properties of elements and compounds Compounds are formed when elements combine together in fixed proportions. The compound formed will often have properties
RAPID KJELDAHL BENCHNOTES
 RAPID KJELDAHL BENCHNOTES Methodology for the Determination of Alcohol in a Mixture by Direct Distillation with the RapidStill II Principle: This method covers the determination of percent alcohol in distilled
Nitrogen, Total Inorganic
 Nitrogen, Total Inorganic DOC316.53.01090 Titanium Trichloride Reduction Method Method 10021 0.2 to 25.0 mg/l N Test N Tube Vials Scope and application: For water, wastewater and seawater. Test preparation
INTERNATIONAL STANDARD
 INTERNATIONAL STANDARD First edition 1989-l l-1 5 - Water quality - Determination of chloride - Silver nitrate titration with chromate indicator (Mohr s method) Qualit de l eau - D osage des chiorures
B410U10-1 S16-B410U10-1. CHEMISTRY Component 1 The Language of Chemistry, Structure of Matter and Simple Reactions
 Surname Centre Number Candidate Number Other Names 2 GCE AS NEW AS B410U10-1 S16-B410U10-1 CHEMISTRY Component 1 The Language of Chemistry, Structure of Matter and Simple Reactions A.M. FRIDAY, 27 May
Protocol for the design, conducts and interpretation of collaborative studies (Resolution Oeno 6/2000)
") Protocol for the design, conducts and interpretation of collaborative studies (Resolution Oeno 6/2000) INTRODUCTION After a number of meetings and workshops, a group of representatives from 27 organizations
Protocol for the design, conducts and interpretation of collaborative studies (Resolution Oeno 6/2000) INTRODUCTION After a number of meetings and workshops, a group of representatives from 27 organizations
STANDARD OPERATING PROCEDURES SOP: 1828 PAGE: 1 of 14 REV: 0.0 DATE: 05/12/95 ANALYSIS OF METHYL PARATHION IN CARPET SAMPLES BY GC/MS
 PAGE: 1 of 14 1.0 SCOPE AND APPLICATION 2.0 METHOD SUMMARY CONTENTS 3.0 SAMPLE PRESERVATION, CONTAINERS, HANDLING AND STORAGE 4.0 INTERFERENCES AND POTENTIAL PROBLEMS 5.0 EQUIPMENT/APPARATUS 6.0 REAGENTS
CHEMISTRY HIGHER LEVEL
 *P15* PRE-LEAVING CERTIFICATE EXAMINATION, 2009 CHEMISTRY HIGHER LEVEL TIME: 3 HOURS 400 MARKS Answer eight questions in all These must include at least two questions from Section A All questions carry
Experiment 3: Acids, Bases, and Buffers
 Experiment 3: Acids, Bases, and Buffers Reading: Chemistry the Central Science, Chapter 16.1-16.7 Introduction: The reaction of an acid and a base is a neutralization reaction. The technique of accurately
Cambridge International Examinations Cambridge International Advanced Subsidiary and Advanced Level
 Cambridge International Examinations Cambridge International Advanced Subsidiary and Advanced Level CHEMISTRY 9701/33 Paper 3 Advanced Practical Skills 1 May/June 2014 2 hours Candidates answer on the
Bloomington in particular, the local soil contains CaCO 3, which donates a carbonate (CO 2-3 ) ion to help
 ion to help") Introduction Blake Dircksen Standardization of HCl and Buffer Capacity Determination of Local Water Samples Acid rain has been a problem around the world since the Industrial Revolution. The ph of natural
Introduction Blake Dircksen Standardization of HCl and Buffer Capacity Determination of Local Water Samples Acid rain has been a problem around the world since the Industrial Revolution. The ph of natural
Determination of Nutrients. Determination of total phosphorus. Extraktion with aqua regia, reflux method. Introduction
 Determination of Nutrients Determination of total phosphorus Extraktion with aqua regia, reflux method Introduction This document is developed in the project Horizontal. It is the result of desk studies
Perfluorinated Alkyl Acids (PFAA) in Water by LC/MS/MS - PBM
 in Water by LC/MS/MS - PBM") Organics Revision Date: July 19, 2017 Perfluorinated Alkyl Acids (PFAA) in Water by LC/MS/MS - PBM Parameter Perfluorinated Alkyl Acids (Perfluorobutane Sulphonate (PFBS), Perflourooctane Sulphonate (PFOS),
Organics Revision Date: July 19, 2017 Perfluorinated Alkyl Acids (PFAA) in Water by LC/MS/MS - PBM Parameter Perfluorinated Alkyl Acids (Perfluorobutane Sulphonate (PFBS), Perflourooctane Sulphonate (PFOS),
Page 2. Q1.A student investigated food dyes using paper chromatography. This is the method used.
 Q1.A student investigated food dyes using paper chromatography. This is the method used. 1. Put a spot of food colouring X on the start line. 2. Put spots of four separate dyes, A, B, C and D, on the start
UNIVERSITY OF CAMBRIDGE INTERNATIONAL EXAMINATIONS General Certificate of Education Advanced Subsidiary Level and Advanced Level
 UNIVERSITY OF CAMBRIDGE INTERNATIONAL EXAMINATIONS General Certificate of Education Advanced Subsidiary Level and Advanced Level * 8 2 6337145 4* CHEMISTRY 9701/33 Paper 31 Advanced Practical Skills May/June
Learn to do quantitative titration reactions. Observe the mole ratios of several simple chemical reactions.
 CHAPTER 6 Stoichiometry of Reactions in Solution Objectives The objectives of this laboratory are to: Learn to do quantitative titration reactions. Observe the mole ratios of several simple chemical reactions.
STANDARD OPERATING PROCEDURES
 PAGE: 1 of 12 CONTENTS 1.0 SCOPE AND APPLICATION 2.0 METHOD SUMMARY 3.0 SAMPLE PRESERVATION, CONTAINERS, HANDLING, AND STORAGE 4.0 INTERFERENCES AND POTENTIAL PROBLEMS 5.0 EQUIPMENT/APPARATUS 6.0 REAGENTS
c. K 2 CO 3 d. (NH 4 ) 2 SO 4 Answer c
 2 SO 4 Answer c") Chem 130 Name Exam 2, Ch 4-6 July 7, 2016 100 Points Please follow the instructions for each section of the exam. Show your work on all mathematical problems. Provide answers with the correct units and
Chem 130 Name Exam 2, Ch 4-6 July 7, 2016 100 Points Please follow the instructions for each section of the exam. Show your work on all mathematical problems. Provide answers with the correct units and
(a) Complete Figure 9 by placing one tick in each row to show whether the salt is soluble or insoluble. salt soluble insoluble.
 Complete Figure 9 by placing one tick in each row to show whether the salt is soluble or insoluble. salt soluble insoluble.") 1 The method used to prepare a salt depends on its solubility in water. (a) Complete Figure 9 by placing one tick in each row to show whether the salt is soluble or insoluble. ammonium chloride salt soluble
1 The method used to prepare a salt depends on its solubility in water. (a) Complete Figure 9 by placing one tick in each row to show whether the salt is soluble or insoluble. ammonium chloride salt soluble
Nitrogen, ammonia, colorimetry, salicylate-hypochlorite, automated-segmented flow
 1. Application Nitrogen, ammonia, colorimetry, salicylate-hypochlorite, automated-segmented flow Parameters and Codes: Nitrogen, ammonia, dissolved, I-2522-90 (mg/l as N): 00608 Nitrogen, ammonia, total-in-bottom-material,
UNIVERSITY OF CAMBRIDGE INTERNATIONAL EXAMINATIONS General Certifi cate of Education Advanced Subsidiary Level and Advanced Level
 *0257891118* UNIVERSITY OF CAMBRIDGE INTERNATIONAL EXAMINATIONS General Certifi cate of Education Advanced Subsidiary Level and Advanced Level CHEMISTRY 9701/32 Advanced Practical Skills 2 May/June 2013
Name Date Period Ionic Bonding Puzzle Activity
 Name Date Period Ionic Bonding Puzzle Activity Introduction When metals and non-metals chemically react, the atoms will tend to form ions or charged atoms. Ions form because electrons are either gained
UNIVERSITY OF CAMBRIDGE INTERNATIONAL EXAMINATIONS General Certifi cate of Education Advanced Subsidiary Level and Advanced Level
 *0974901356* UNIVERSITY OF CAMBRIDGE INTERNATIONAL EXAMINATIONS General Certifi cate of Education Advanced Subsidiary Level and Advanced Level CHEMISTRY 9701/31 Advanced Practical Skills 1 May/June 2013
Exercise 6: Determination of Hardness of Water
 Fundamentals of Analytical Chemistry, CHC014011L Exercise 6: Determination of Hardness of Water Introduction: Hardness in water is generally caused by the presence of dissolved calcium and magnesium carbonates
Total, active and effective alkali
 Accepted April 1985 White and green liquors Total, actie and effectie alkali Potentiometric titration 0 Introduction This SCAN-test Method has been deeloped for use in laboratories employing electrometric
ISO INTERNATIONAL STANDARD. Soil quality Determination of ph. Qualité du sol Détermination du ph. Second edition
 INTERNATIONAL STANDARD ISO 10390 Second edition 2005-02-15 Soil quality Determination of ph Qualité du sol Détermination du ph Reference number ISO 10390:2005(E) ISO 2005 ISO 10390:2005(E) Provläsningsexemplar
Cambridge International Examinations Cambridge International Advanced Subsidiary and Advanced Level
 Cambridge International Examinations Cambridge International Advanced Subsidiary and Advanced Level *4147278659* CHEMISTRY 9701/34 Paper 3 Advanced Practical Skills 2 May/June 2015 2 hours Candidates answer
UNIVERSITY OF CAMBRIDGE INTERNATIONAL EXAMINATIONS General Certificate of Education Advanced Subsidiary Level and Advanced Level
 UNIVERSITY OF CAMBRIDGE INTERNATIONAL EXAMINATIONS General Certificate of Education Advanced Subsidiary Level and Advanced Level * 5803539249 * CHEMISTRY 9701/35 Paper 31 Advanced Practical Skills May/June
LEAD(II) AND COBALT(III) HEPTHYLDITHIOCARBAMATES AS NEW COFLOTATION REAGENTS FOR PRECONCENTRATION OF CADMIUM BEFORE ITS ETAAS DETERMINATION
 AND COBALT(III) HEPTHYLDITHIOCARBAMATES AS NEW COFLOTATION REAGENTS FOR PRECONCENTRATION OF CADMIUM BEFORE ITS ETAAS DETERMINATION") LEAD(II) AND COBALT(III) HEPTHYLDITHIOCARBAMATES AS NEW COFLOTATION REAGENTS FOR PRECONCENTRATION OF CADMIUM BEFORE ITS ETAAS DETERMINATION TRAJČE STAFILOV, GORICA PAVLOVSKA AND KATARINA ČUNDEVA Institute
LEAD(II) AND COBALT(III) HEPTHYLDITHIOCARBAMATES AS NEW COFLOTATION REAGENTS FOR PRECONCENTRATION OF CADMIUM BEFORE ITS ETAAS DETERMINATION TRAJČE STAFILOV, GORICA PAVLOVSKA AND KATARINA ČUNDEVA Institute
Shigeya SnTO and SUIIllO UCHIKAWA. Faculty of Education, Kumamoto University, Kurokami, Kumamoto 860
 ANALYTICAL SCIENCES FEBRUARY 1986, VOL. 2 47 Extraction-Spectrophotometric Determination of Antimony(V) with 2-Hydroxyisocaproic Acid and Citrate, with Application to Differential Determination of Antimony(V)
Determination of trace anions in concentrated hydrofluoric acid
 APPLICATION NOTE 78 Determination of trace anions in concentrated hydrofluoric acid Authors Archava Siriraks Thermo Fisher Scientific, Sunnyvale, CA Keywords HF, ICS-5000 +, IonPac AS10, IonPac AC10, ion
Development and validation of the test guideline on agglomeration behavior of nanomaterials in different aquatic media.
 Development and validation of the test guideline on agglomeration behavior of nanomaterials in different aquatic media. Report on the validation of nanomaterials agglomeration behavior in various aquatic
Unit 4a: Solution Stoichiometry Last revised: October 19, 2011 If you are not part of the solution you are the precipitate.
 1 Unit 4a: Solution Stoichiometry Last revised: October 19, 2011 If you are not part of the solution you are the precipitate. You should be able to: Vocabulary of water solubility Differentiate between
Subject: Ionic Analysis of PrintedCircuit Boards, Printed board Assemblies and Materials, Ion Chromatography Method
 Method: 2.3.28 Subject: Ionic Analysis of PrintedCircuit Boards, Printed board Assemblies and Materials, Ion Chromatography Method Date: 09-1905/04 Revision: AC Originating Task Group: Ionic Conductivity/Ion
Chemistry 20 Final Review Solutions Checklist Knowledge Key Terms Solutions
 Chemistry 20 Final Review Solutions Checklist Have you mastered the concepts, applications, and skills associated with the following items? Check them off when you are confident in your understanding.
Cambridge International Examinations Cambridge International Advanced Subsidiary and Advanced Level
 Cambridge International Examinations Cambridge International Advanced Subsidiary and Advanced Level *7333871663* CHEMISTRY 9701/35 Paper 3 Advanced Practical Skills 1 May/June 2015 2 hours Candidates answer
METHODS FOR DETERMINATIONS OF ELECTROLYTES AND BLOOD GASES
 METHODS FOR DETERMINATIONS OF ELECTROLYTES AND BLOOD GASES ELECTROCHEMISTRY Basic principle Electrodes are used to selectively measure particular ions Instruments utilizing electrodes measure the potential
Quantitative analysis of Na, K and Ca in milk and yogurt using the MH-5000 Ultra Compact Elemental Analyzer
 Application Note [A00190E] 1 / 11 Quantitative analysis of Na, K and Ca in milk and yogurt using the MH-5000 Ultra Compact Elemental Analyzer Introduction This application note describes the quantitative
A Global Assessment of Precipitation Chemistry and Deposition
 A Global Assessment of Precipitation Chemistry and Deposition A project of the World Meteorological Organization s Global Atmosphere Watch Scientific Advisory Group for Precipitation Chemistry Robert Vet
METHOD 9035 SULFATE (COLORIMETRIC, AUTOMATED, CHLORANILATE)
") METHOD 9035 SULFATE (COLORIMETRIC, AUTOMATED, CHLORANILATE) 1.0 SCOPE AND APPLICATION 1.1 This automated method is applicable to ground water, drinking and surface waters, and domestic and industrial wastes
METHOD 9035 SULFATE (COLORIMETRIC, AUTOMATED, CHLORANILATE) 1.0 SCOPE AND APPLICATION 1.1 This automated method is applicable to ground water, drinking and surface waters, and domestic and industrial wastes
Hach Method Spectrophotometric Measurement of Free Chlorine (Cl 2 ) in Finished Drinking Water
 in Finished Drinking Water") Hach Method 1041 Spectrophotometric Measurement of Free Chlorine (Cl ) in Finished Drinking Water Hach Company Method 1041 Revision 1. November 015 Spectrophotometric Measurement of Free Cl in Finished
Hach Method 1041 Spectrophotometric Measurement of Free Chlorine (Cl ) in Finished Drinking Water Hach Company Method 1041 Revision 1. November 015 Spectrophotometric Measurement of Free Cl in Finished
Chlorphosphonazo Colorimetric Method Method to 1000 µg/l Ca and Mg as CaCO 3 (ULR) Solution Pillow. Instrument Adapter Sample cell
 Solution Pillow. Instrument Adapter Sample cell") Hardness DOC316.53.01044 Chlorphosphonazo Colorimetric Method Method 8374 8 to 1000 µg/l Ca and Mg as CaCO 3 (ULR) Solution Pillow Scope and application: For boiler and ultrapure water. Test preparation
Hardness DOC316.53.01044 Chlorphosphonazo Colorimetric Method Method 8374 8 to 1000 µg/l Ca and Mg as CaCO 3 (ULR) Solution Pillow Scope and application: For boiler and ultrapure water. Test preparation
 UNIVERSITY OF CAMBRIDGE INTERNATIONAL EXAMINATIONS General Certificate of Education Advanced Subsidiary Level and Advanced Level *7382672438* CHEMISTRY 9701/33 Advanced Practical Skills October/November
UNIVERSITY OF CAMBRIDGE INTERNATIONAL EXAMINATIONS General Certificate of Education Ordinary Level
 UNIVERSITY OF CAMBRIDGE INTERNATIONAL EXAMINATIONS General Certificate of Education Ordinary Level *4711189762* CEMISTRY 5070/41 Paper 4 Alternative to Practical October/November 2013 1 hour Candidates
DR/4000 QUATERNARY AMMONIUM COMPOUNDS PROCEDURE. 2. The display will show: 3. Fill a sample cell (the blank) with 25 ml of deionized water.
 with 25 ml of deionized water.") Method 8337 Powder Pillows DR/4000 TT PROCEDURE QUATERNARY AMMONIUM COMPOUNDS Direct Binary Complex Method (0 to 5.00 mg/l as CTAB) Scope and Application: For cooling tower and pool/spa water. The estimated
Method 8337 Powder Pillows DR/4000 TT PROCEDURE QUATERNARY AMMONIUM COMPOUNDS Direct Binary Complex Method (0 to 5.00 mg/l as CTAB) Scope and Application: For cooling tower and pool/spa water. The estimated
Cyanide and sulfide analysis using amperometric detection and Metrosep A Supp /4.0
 Metrosep A Supp 10-100 /4.0 Branch Environment, Food, Beverages Keywords IC; 850; 858; Metrosep A Supp 10-100/4.0; Cyanide; Sulfide; 2.850.9110; DC Mode Summary The determination of sulfide and cyanide
Application Note No. 310/2018
 Application Note No. 310/2018 Nitrogen determination in compound fertilizer according to Devarda KjelFlex K-360 with Devarda Splash Protector, Metrohm Titrino 877 www.buchi.com Quality in your hands 1.