Faculté Polytechnique
|
|
|
- Derek Harmon
- 5 years ago
- Views:
Transcription
 aqueous solutions for the CO2 capture by")


 Prof.")
1 Faculté Polytechnique Vapour-liquid equilibrium of 1,3-diaminopropane (DAP) aqueous solutions for the CO2 capture by absorption-regeneration Experiments and modeling Master s Thesis Realized at the Norwegian University of Science and Technology Presented at the University of Mons in fulfillment for the degree of Master of Engineering Science in Chemistry and Material Science Sophie MAERTEN Supervisors : Prof. Hallvard Fjøsne SVENDSEN (NTNU) Prof. Diane THOMAS (UMons) Co-supervisors : Ardi HARTONO (NTNU) Dr. Lionel Dubois (UMons) Juin 2014
2 ii
3 Vapour-liquid equilibrium of 1,3-diaminopropane (DAP) aqueous solutions for the CO2 capture by absorption-regeneration : experiments and modeling Master's thesis Maerten Sophie Supervisors: Prof. H. Svendsen (NTNU), Prof. D. Thomas (UMons) Co-supervisors: A. Hartono (NTNU), Dr. L. Dubois (UMons) Mons, Belgium, June 2014 iii
4 Abstract Emission of greenhouse gases, especially CO2, has become a major environmental issue. In order to control and reduce the releases, Carbon Capture and Storage (CCS) is certainly a promising tool. For this purpose, post-combustion capture by absorption in aqueous alkanolamine solutions is the most mature technology, but the process still need to be optimized for example by using novel solvents requiring less energy for their regeneration. Although diamines aren't good candidates looking at this property, they could be used together with other compounds as absorption enhancers. This first need a study of their characteristics. New experimental data for vapour-liquid equilibrium (VLE) of CO2 loaded aqueous solutions of 1M (7.6 wt%) and 3M (22.7 wt%) 1,3-diaminopropane (DAP) were collected in this work. A low temperature/atmospheric pressure apparatus was used to generate the vapour phase in equilibrium with the loaded solutions at 40 C, 60 C and 80 C. Equilibrium curves were obtained by measuring the CO2 partial pressure with a NDIR photometer, and the alkalinity and CO2 content of the liquid phase respectively by acid-base titration and barium chloride precipitation-titration method. The loading was then calculated. A rigorous thermodynamic model was then developed to represent the phase and chemical equilibria of the DAP-CO2-H2O system. Activity coefficients in the solution were determined using E-NRTL framework while the Peng-Robinson equation of state provided gas phase properties. Binary interaction parameters for DAP-H2O were first regressed based on PTxy data from literature, with the NRTL equations implemented in an in-house Matlab program. These resulting values were then fixed during the regression of other binary and ternary parameters contained in the E-NRTL model, performed with the same program and the VLE data from this work and from literature. To reduce the system complexity, a limited amount of experimental data was considered, which led to a model with an AARD on CO2 partial pressure of 33.5%. If it may seem high, it is actually pretty good as the behaviour of solutions involving reactions with diamines is difficult to predict. Nevertheless, the model might be improved by looking at other sets of data and more reliable properties for the 1,3-diaminopropane. iv
5 Acknowledgement v
6 Table of Contents ABSTRACT... IV ACKNOWLEDGEMENT... V TABLE OF CONTENTS... VI LIST OF FIGURES... VIII LIST OF TABLES... IX LIST OF ABBREVIATIONS... X CHAPTER 1: INTRODUCTION THE PROBLEM OF CO 2 EMISSIONS CARBONE CAPTURE AND STORAGE Capture technologies Absorption-regeneration process MOTIVATION AND SCOPE OF WORK... 7 CHAPTER 2: EXPERIMENTAL PROCEDURES INFORMATION ABOUT SOLVENTS Monoethanolamine (MEA) ,3-Diaminopropane (DAP) EQUILIBRIUM MEASUREMENTS ANALYSIS OF THE GAS PHASE IR spectroscopy Calibration and calculations Uncertainty propagation ANALYSIS OF LIQUID SAMPLES Determination of the CO2 content Determination of alkalinity CHAPTER 3: THERMODYNAMIC FRAMEWORK EQUILIBRIUM EQUATIONS Phase and chemical equilibria Fugacity and fugacity coefficient Activity and activity coefficient Standard states conventions THERMODYNAMIC MODELS Gas phase properties Activity coefficient models PARAMETERS FITTING Regression tool Database CHAPTER 4: RESULTS AND DISCUSSION EXPERIMENTAL RESULTS Monoethanolamine tests Vapour-Liquid Equilibrium of 1,3-diaminopropane vi
7 4.1.3 Influence of the DAP concentration Comparison with MEA MODELING RESULTS Binary system (H2O-DAP) Parameters fitting for the ternary DAP-H2O-CO2 system Additional analyzes CHAPTER 4: CONCLUSION REFERENCES APPENDICES vii
8 List of Figures 1.1 Global average temperature between 1880 and Total global CO2 emissions from industrial sources, Illustration of a CCS process Pre-combustion capture Post-combustion capture Oxyfuel-combustion capture Absorption-regeneration process Monoethanolamine ,3-diaminopropane Low pressure/temperature VLE apparatus Device for the loading of the solution Non Dispersive Infra Red spectrometer Metrohm 809 Titrando for CO2 analysis Amine titration device Mettler Toledo G Phase and chemical equilibria Two types of cells according to Wilson's theory Graphical user interface in Parfinder VLE data at 40 C and low pressure for 30 wt% MEA VLE data at 80 C and low pressure for 30 wt% MEA Experimental VLE data of 1M DAP Experimental VLE data of 3M DAP VLE data at different DAP concentrations VLE data at 40 C and different DAP concentrations-error bars Comparison between 30 wt% MEA and 3M DAP PTxy diagrams for H2O-DAP system: NRTL model prediction results and experimental data points Activity coefficients for H2O-DAP system: NRTL model prediction results and data points Parity plot between experimental and model predicted CO2 partial pressures VLE of the DAP-CO2-H2O system at different temperatures and DAP concentrations: e-nrtl prediction and experimental data Comparison between e-nrtl predicted equilibria and all experimental data viii
9 List of Tables 2.1 Uncertainty on the CO2 analyzer measurements Properties of molecular species Coefficients for the chemical equilibrium constants Regressed binary NRTL parameters for H2O-DAP Imposed interaction parameters for the ternary system Regressed parameters for chemical equilibrium constants Regressed binary and ternary parameters for the DAP-CO2-H2O system ix
10 List of Abbreviations AARD AMP CCS DAP DEA DEEA DIPPR EDA eg EoS FTIR GHG GWP i.e. MAPA MEA MDEA MOF NDIR (E-) NRTL PE ppm PZ UN VLE Wt Average Absolute Relative Deviation 2-amino-2-methyl-1-propanol Carbon Capture and Storage Diaminopropane Diethanolamine 2-(diethylamino)ethanol Design Institute for Physical Properties Ethylene diamine Exempli gratia Equation of state Fourier Transform Infra Red Greenhouse gas Global Warming Potential Id est N-Methyl-1,3-propanediamine Monoethanolamine Methyldiéthanolamine Metal Organic Frameworks Non Dispersive Infra Red (Electrolyte) Non Random Two Liquid 2-piperidine ethanol Parts per million Piperazine United Nation Vapour Liquid Equilibrium Weight x
11 Chapter 1: Introduction 1.1 The problem of CO 2 emissions Carbon dioxide was identified in the 1750s by the Scottish physicist and chemist Joseph Black [1,2] as the gas released during respiration, by its action on limewater: Ca(OH)2 + CO2 CaCO3 + H2O (1.1) At ambient temperature and under normal pressure conditions, it is a non-flammable odorless and colorless gas, heavier than air. It sublimates at C and can also exist in a liquid form if it is compressed up to 5.2 atm at C [2,3,4]. Carbon dioxide is soluble in water, in an amount of 88 ml for 100 ml at 20 C, where it reacts to form carbonic acid H2CO3. This gaseous compound, naturally present in the atmosphere, is not toxic, but high concentration can lead to a lack of oxygen, especially in confined spaces [4]. However, its main adverse effect is related to the ability of this molecule to absorb infrared radiation emitted by the Earth's surface, thereby trapping heat energy. This phenomenon, resulting in an increase in low atmosphere temperature, is called greenhouse effect. Although necessary for life, the enhanced warming observed in recent decades, as shown in Figure 1.1, could lead in long term to major climate changes, threatening the existence as we know it. Celsius degrees Figure 1.1: Global average temperature between 1880 and 2010 [5]. The main cause of this rise in temperature is the rapid industrialization of this last two centuries, which was accompanied by some adverse effects on our planet, such as the discharge, in the atmosphere, of pollutants like carbon dioxide. To the natural production from the oceans, basement, volcanoes or the respiration of plants and animals, were so added releases from human sources, mostly due to the burning of fossil fuels (coal, oil, natural gas). 1
![Industrial processes (cement industry and fertilizer plants for examples) and thermal power generation account for 50% of anthropogenic CO2 emissions [6,7], while transportation, deforestation and](/docs-images/93/114082401/images/12-0.jpg "agriculture share the remaining part. Other greenhouse gases are also produced by these activities, for example methane (CH4) and nitrous oxide (N2O).")
12 Industrial processes (cement industry and fertilizer plants for examples) and thermal power generation account for 50% of anthropogenic CO2 emissions [6,7], while transportation, deforestation and agriculture share the remaining part. Other greenhouse gases are also produced by these activities, for example methane (CH4) and nitrous oxide (N2O). The impact of a gas on the overall increase in temperature is indicated by its global warming potential, GWP, a relative indicator based on the radiative properties and the lifetime of the compound. Carbon dioxide is the benchmark and has a GWP respectively 21 and 310 [8] times lower than those of methane and nitrous oxide, if a time horizon of one hundred years is considered. But if it gets more attention than the other gases of the category, it is because of the huge amounts released. Indeed, CO2 counts for the largest share of human emission of GHGs, with 33.6 Gt emitted in 2010 for 7.5 Gt of methane, expressed in carbon dioxide equivalent, and 2.8 Gt of nitrous oxide [9]. Moreover, these quantities are steadily increasing, as shown in Figure 1.2 below. Figure 1.2: Total global CO 2 emissions from industrial sources, [10]. The importance of this international problem has prompted leaders to take action to reduce GHGs concentrations in the atmosphere [11,12]. The Kyoto protocol was so signed in December 1997 by the majority of UN members, with the notable exception of the United States of America. This is a major breakthrough in the struggle against climate change, because it sets binding and quantified objectives in term of reducing emissions. Industrialized countries have thus committed themselves to decrease greenhouse gases releases by at least 5% between 2008 and 2012, based on 1990 values. Other agreements have been concluded since, and it is hoped that further work will be done in this direction, as the situation is still worrying. 2

13 1.2 Carbone capture and storage The best way to achieve these expectations is obviously not producing GHGs, and especially carbon dioxide, anymore, for example by increasing energy efficiencies or by using renewable energy sources. However, the necessary technologies cannot be developed quickly enough, and transition techniques enabling the use of conventional fuel with limited releases must so be implemented. In this context, carbon capture and storage (CCS) [11,12,13] is the main topic of many researches and seems to be a promising technology that might, in some decades, contribute up to 30% to the reduction of global emissions related to large industrial installations (power plants, steel and refining industries, cement factories, etc.) [14]. In general terms, a CCS chain (Figure 1.3) includes separation and compression of CO2 to supercritical state, its transport, and its safe storage, mainly in adapted geological layers, or re-use (e.g. fire extinguishers, sparkling drinks, cooling agent, chemical transformation, etc.) Capture technologies Figure 1.3: Illustration of a CCS process [15]. The first step of the process consists in collecting the flue gas exiting industrial plants and to treat it to obtain a carbon dioxide concentrated stream. There are three principal methods [11] for "the extraction" of CO2, depending on the position related to the source of production. They are detailed below. Pre-combustion capture As its name implies, this method performs treatments before the combustion phase where carbon dioxide is usually generated. In order to get a fuel that doesn't contain carbon anymore, an auto-thermal reforming or a partial oxidation is for instance carried out. These 3
 The «water gas shift reaction» then converts CO into CO2 and boosts hydrogen production: CO + H2O CO2 + H2 (1.")
![4) The last step of this pathway is the separation of carbon dioxide from hydrogen, which is used as fuel. Figure 1.4 illustrates these explanations. Figure 1.4: Pre-combustion capture [16].](/docs-images/93/114082401/images/14-1.jpg "Post-combustion capture This second capture way operates after the combustion chamber, by separating carbon dioxide from other constituents of the flue gas (see figure 1.5).")
14 well-established processes result in the formation of a syngas, mainly composed of carbon monoxide and hydrogen. CH4 + H2O CO + 3H2 (1.2) CH4 + 1/2O2 CO + 2H2 (1.3) The «water gas shift reaction» then converts CO into CO2 and boosts hydrogen production: CO + H2O CO2 + H2 (1.4) The last step of this pathway is the separation of carbon dioxide from hydrogen, which is used as fuel. Figure 1.4 illustrates these explanations. Figure 1.4: Pre-combustion capture [16]. Post-combustion capture This second capture way operates after the combustion chamber, by separating carbon dioxide from other constituents of the flue gas (see figure 1.5). This technology works at atmospheric pressure with diluted CO2, concentration between 5 and 30% according to the industrial application, what is different from the previous one where CO2 content of 50% can be achieved prior to extraction. It leads to higher efficiency than for the pre-combustion capture, but it is also more expensive in investment. Moreover, post-combustion capture process can be easily integrated to existing installation. These factors explain why this technique is currently the most studied. Figure 1.5: Post-combustion capture [16]. Oxyfuel-combustion capture Such processes involve removing the bulk nitrogen from the air before combustion takes place, allowing its implementation with pure oxygen. The resulting flue gases will have a CO2 4
 while nitrogen (T eb = -196 C)")
15 content higher than 90% on dry basis, and purification can then be completed by condensing the water (Figure 1.6). The nitrogen separation is principally achieved by cryogenic means, which consist in cooling the incoming gas to a temperature at which oxygen liquefies (T eb = -183 C) while nitrogen (T eb = -196 C) remains in the gaseous phase [3]. This operation requires a lot of energy, and its application on existing plants often needs to adapt some parameters like the flow rates. That's why alternative techniques are proposed, for example the "chemical looping" combustion where an oxidized metal support is circulated in the combustion chamber. Figure 1.6: Oxyfuel-combustion capture [16] Absorption-regeneration process Among the three major capture ways presented above, post-combustion capture is further highlighted due to its ease of application to the old units. In that case, CO2 separation can be performed through various physicochemical techniques [11], including: Physical absorption in a liquid solvent in which CO2 dissolves. Chemical absorption in solutions having preferential reactive properties with CO2. Adsorption with activated carbon, zeolites or MOF. Membrane processes using gas-gas or gas-liquid membranes. Cryogenics. Although all these possibilities, and others as well, are currently under research, chemical absorption, generally in amino solvent, is the most developed and the closest of industrial use. The process elaborated for this operation is shown in Figure 1.7 and explained in the next paragraphs [11,17,18]. It has been widely studied and is so well known, and its performance were inter alia validated on the pilot unit located in Esbjerg (Denmark), as part of the European project CASTOR [12]. The flue gas, previously cooled down to the absorption temperature (40-45 C), is introduced at the bottom of the absorber, at a pressure equal or slightly higher than atmospheric pressure ( bars), in order to overcome the pressure drop. According to its origin (type of power plant or industry), its CO2 content usually varies from 4 to 35%. The gaseous mixture then flows through the column while contacting with the solvent, conventionally a 30 wt% aqueous solution of ethanolamine (MEA), flowing counter-currently. Reactions with carbon dioxide occur at the interface, resulting in a liquid enrichment and therefore in the flue gas cleaning. At the top of the column, the carbon dioxide depleted exhaust air is send to a wash 5
16 section where most of the vaporized amine is recovered. The CO2 loaded solvent, called rich solvent, exits the bottom of the absorber at a temperature around 55 C. Figure 1.7: Absorption-regeneration process. This last mentioned then goes to a second column in order to be regenerated, thanks to the shifting of the reactions resulting from a change of the operating conditions. It is pumped to the stripper's pressure, usually 2 bars, pre-heated by the hot solution leaving the bottom of the column which needs to be cooled, and inserted in the upper part of the stripper. While coming down, the solution is heated up to 120 C (depend on the solvent), what allows to desorb the carbon dioxide. A concentrated stream (> 90%) can then be obtained by condensing the water present in the overhead steam. The CO2-stripped MEA solution, called lean solvent, leaves the bottom of the stripper and is recycled back to the absorber. The quantities of carbon dioxide contained, in free form or as reaction products, in the rich and lean solutions defined above, are part of the most important parameters of the flowsheet. Indeed, they reflect the absorption capacity and the efficiency of the regeneration step. The concept of loading is so unavoidable when interesting in this capture method. It is usually defined as: Loading = mol CO 2 mol amine (1.5) Despite the good performance of this process in terms of carbon dioxide recovering, it has a major drawback that prevents its industrial-scale exploitation: a high energy consumption, especially in the stripper column. These are indeed approximately 3.6 GJ [11,17,18] that are required to liberate one ton of carbon dioxide, which represents 65% of the total energy demand of the configuration. As an example, the addition of this process on a power plant would lead to a substantial efficiency lost, about 11-15%, which corresponds to a cost of 6
17 avoided CO2 between 40 and 60 /t [11,12]. For information, it is much higher than the European allowance for carbon dioxide releases, equal to 5 /t. Many studies were carried out in order to reduce energy costs, and two main paths of improvement are highlighted by specialists: the use of new solvents, i.e. different from 30 wt% MEA, and the flowsheet optimisation. Even if these two ways should ideally be simultaneously considered, researches has not yet reached this point, and only the first one is the subject of this work. 1.3 Motivation and scope of work Many improved solvents have already been tested in previous publications, such as amino acid salts (glycinate, prolinate, taurate), other alkanolamines (DEA, DEEA, MDEA), sterically hindered amines (AMP, PE) or diamines (EDA, PZ, MAPA) [11,19 to 23]. If some seem interesting seeing that the regeneration of the solution is facilitated by the instability of the salts formed during the reaction with CO2, main feature of the sterically hindered amines for example, the resulting energy gain is often offset by a lower absorption performance, leading to higher column height and solution circulation rate. A promising idea would then be to mix one of these compounds with a diamine, which enhances the CO2 absorption and the salts formation, but is therefore not a good candidate if used alone regarding the energy consumption at the boiler. Diamines are also envisaged to elaborate demixing solvents, other interesting alternative. This work is focused on vapour-liquid equilibrium (VLE) of a still understudied diamine, but whose structure augurs better stability than for MEA or EDA, and which is less toxic than piperazine: the 1,3-diaminopropane. The knowledge of the equilibrium curves at different temperatures and concentrations has a very important role in the design and optimization of industrial gas treating processes, and studying this characteristic is so one of the first steps in the development of new solvents. The first part of this report is dedicated to the description of the experimental device used to achieve VLE for the DAP-H2O-CO2 system at low pressure and low temperature, as well as the analytical methods applied to the two resulting phases. Two different diamine concentrations will be investigated, i.e. 1M and 3M, in order to complete a previous work on the same topic. Before that, the entire procedure will be tested on a 30 wt% MEA solution, to validate it. Both solvent involved are moreover described in details. All the data collected for 1,3-diaminopropane will then be put together in a second part, with the aim of developing a rigorous thermodynamic model (e-nrtl) describing the VLE behaviour of the ternary system. Indeed, designers often need equilibrium information under conditions which have not been studied, and models provide a good alternative to time consuming experiments. In addition, it will facilitate further study of quaternary systems involving DAP and another amine. Readers can find in this report a presentation of the thermodynamic relations and of the in-house program used for the modeling. Results will then be discussed together with those of the binary DAP-H2O system, which should be previously characterized. 7
18 Chapter 2: Experimental procedures 2.1 Information about solvents As explained in the previous chapter, the most promising technology for the post-combustion capture of carbon dioxide involves the preferential reaction between the gaseous compound and a solvent, followed by the regeneration of this last one thanks to an increase in temperature. The choice of the absorbent thus has a major impact on the success of the process, both from a technical and an economical point of view. Among the different aspects that should be considered in the selection, there are of course the absorption capacity and the reaction kinetics, but also the physico-chemical properties of the system so formed, the ease of regeneration, and the risks of degradation. Information such as the price, the environmental impact and the availability of the fluid are also important. Based on these factors, four categories [11] of potentially usable solvents have so far been highlighted. However, those of the two first groups have been further studied and are actually the closest to an industrial use: First generation, which mainly consists of a mixture between water and compounds from the amines' family (e.g. alkanolamines, alkylamines and diamines), also known as chemical solvents because of the reaction with CO2 that occurs, or between water and inorganic salts. Physical solvents like alcohols also belong to this category. Second generation, composed of mixtures of chemical solvents and of chemical and physical solvents. Ionic liquids such as molten salts with particular properties. Enzymatic solvents, formed by the association between amino solvent(s) and a biocatalyst Monoethanolamine (MEA) Also called ethanolamine or 2-aminoethanol and often abbreviated MEA, monoethanolamine [11,26,27] (CAS number: ) is both a primary amine and a primary alcohol (see Figure 2.1). Used in aqueous solution since the 1960s by chemical and oil industries to remove hydrogen sulphide and carbon dioxide from gaseous effluents [24], it was obviously one of the first solvent considered for CO2 capture in post-combustion. Due to its low cost and the good reactive properties towards CO2, this compound, conventionally mixed with water to have a 30 wt% amine content, became the benchmark in comparative studies of new solvents. In this work, the experiments carried out with this widely studied absorbent aim to familiarize with the apparatus and the procedures used to get the liquid-vapour equilibrium curves. 8
19 Figure 2.1: Monoethanolamine [25]. General information Regarding the physico-chemical properties of the amino molecule [3,28], this colorless viscous liquid characterized by a like-ammonia odour, whose molecular formula is C2H7NO, has a molar mass of g/mol and a density of g/cm 3. Its boiling temperature is around 170 C at atmospheric pressure, while solidification occurs at 10 C. Ethanolamine is completely soluble in water and in other polar solvents, for example acetone or methanol. Like other amines, it acts as a weak base (pka = 9.5). Vapour pressure is approximately 0.2 mmhg at 20 C and the evolution with temperature is given in Appendix A. Information about vapour pressure and VLE of aqueous monoethanolamine solutions are also available. In addition to be used to neutralize some gases, ethanolamine can also be found in detergents, emulsifiers, varnishes and in products related to textile finishing and wood treating. This phospholipid is also involved in the manufacture of cosmetics and pharmaceuticals. Monoethanolamine used in this work is provided by Sigma-Aldrich and has a purity higher than 99%. Handling preferentially requires gloves, protective clothing and safety glasses, because of its corrosiveness. It can also be dangerous if inhaled or swallowed [29]. Application to CO2 capture process Reaction mechanism As a primary amine, the chemical absorption of CO2 in the presence of H2O can be described as follows: Formation of a zwitterion, neutral molecular compound having the same number of formal positive and negative electric charges, when a carbon dioxide molecule reacts with an amine molecule. C2H5OH-NH + CO2 C2H5OH-NH + COO - (2.1) Zwitterion deprotonation by one or more basic compound or by a water molecule and production of a stable carbamate ion and a protonated base. C2H5OH-NH + COO - + Base C2H5OH-NCOO - + Base-H + (2.2) Neutralization of the proton so formed by a second amine molecule. C2H5OH-NH + H + C2H5OH-NH2 + (2.3) About the kinetics of these reactions, proton exchange (2.2) and its neutralization (2.3) can generally be considered to be instantaneous. The zwitterion forming step (2.1) is, in turn, fast 9
20 but with a finite speed. This is the kinetically determining step, regarded as irreversible. The combination of these three interactions gives the global reaction for the absorption of carbon dioxide (2.4): 2 C2H5OH-NH + CO2 C2H5OH-NCOO - + C2H5OH-NH2 + (2.4) It is a second order reaction, with an unitary partial order relative to CO2 and to the amine compound: r CO2 = k 2 [CO 2 ] [MEA] (2.5) In the relation above, r CO2 is the CO2 reaction rate in aqueous solution of ethanolamine, and k 2 the kinetic constant of reaction 2.1 in direct sense. Another mechanism is also suggested in the literature. Called ter-moleculaire, it assumes that an amine molecule will react simultaneously with a base and a carbon dioxide one, to form a complex (2.6). This then dissociates, allowing some molecules to react with water or with another amine, which results in ionic products. CO2 + C2H5OH-NH---- B C2H5OH-NCOO BH + (2.6) The stoichiometry of the global reaction is particularly important as it explains the theoretical absorption capacity of monoethanolamine and of all primary amines. Indeed, two moles of amines are required to have one mole of carbon dioxide captured, and the maximum loading is so 0.5 mol CO2/mol amine. However, experiments have shown that higher absorption capacity could sometimes be achieved. This is due to the hydrolysis of carbamate that leads to the release of bicarbonate ions (2.7): C2H5OH-NCOO - + H2O C2H5OH-NH + HCO3 - (2.7) This reaction is rather slow but it liberates an amine molecule, which is then again available to absorb carbon dioxide. It is important to note that the literature doesn't endorse the direct interaction between water and carbamate. Reaction 2.7 is actually the combination of the reverse reaction of 2.2 and of the bicarbonate forming step in the presence of amine, CO2 and H2O. Anyway, the range of loadings implemented in atmospheric processes using MEA to capture CO2 from flue gases does not exceed 0.5 mol CO2/mol amine. Degradation Although the mechanism explained in the previous paragraph helps eliminate carbamates, its kinetics is not favourable, and these stable salts are formed irreversibly. This results in a decrease of amine content and therefore of the absorption performance of the solution. Among the other degradation products that may be encountered, some are due to the forming of oxazolidinone, a 5-membered ring containing both nitrogen and oxygen. Parasitic addition reactions also occur because of the contaminants present in the flues gases, and a large number of amine molecules could be used to capture sulphur gases if a desulfurization process is not previously applied. Primary amines are also highly susceptible to direct 10
21 oxidation, due mainly to the unavoidable attendance of oxygen in exhaust gases. Finally, thermal degradation is not either to neglect. The rate of degradation of an amine is a strong function of temperature and CO2 partial pressure. Most of the parasitic secondary reactions occur at high temperature, so in the stripper area when capture process by absorption-regeneration is considered. High CO2 loadings and amine concentrations also promote solvent degradation, and that's why they should be limited. However, neither carbon dioxide nor elevated temperature are required for oxidation to exist. This phenomenon is controlled by O2 mass transfer and mainly concerns the absorber area. Inhibitors are often added to prevent this from happening. In addition to causing a reduction in the absorption capacity of the solvent, degradation products induce an increase in solution viscosity and foaming tendency. The first problem can be solved by rising absorbent circulation flow rate, but a decrease in the heat exchanger efficiency and hydrodynamic troubles in the absorber may arise. Instead of it, part of the contaminated solution is purged and replaced by a fresh amine make-up. Corrosion The corrosive nature of amines makes capture processes particularly susceptible to this type of damage. Protective means are so set up, and the first of them is to limit at 30 wt% the monoethanolamine content of the solvent. The presence of carbon dioxide, acidic compound, further accentuates this problem, especially in areas where concentration and temperature are high, i.e. in the upper part of the stripper column, in the condenser and at the bottom of the absorber. This is why the loadings are usually restricted. Moreover, carbamates ions remaining in solution due to the inability to completely desorb the CO2 also have an indirect influence on corrosion. Indeed, they react with ferrous and ferric ions to form complexes, which prevents the formation of a protective ferrous oxide film ,3-Diaminopropane (DAP) If aqueous alkanolamines, and particularly MEA solutions, have been first proposed to achieve the carbon dioxide capture, major drawbacks like degradation products and significant reaction enthalpy that leads to high energy consumption in the stripper are an obstacle to the deployment of the process on an industrial scale. To overcome this, diamines could be attractive alternative solvents as they possibly have faster absorption, higher capacity, lower circulation rate, and so lower energy requirements. However, more carbamates are formed during the absorption step, which complicates the solvent regeneration. Consequently, diamines are mainly envisaged as absorption enhancers used together with one (or more) solvent(s) from a different type. This work is interested in one of the compound of this family that is still understudied but may be more stable and less corrosive: the 1,3-diaminopropane (CAS number: ). 11
22 Figure 2.2: 1,3-diaminopropane [30]. General information The molecular structure of 1,3-diaminopropane, also called trimethylenediamine or propane- 1,3-diamine, is represented in Figure 2.2. This symmetrical compound has an empirical formula of C3H10N2 and is the isomer of the 1,2-diaminopropane. P. Singh et al. [31] showed that the amine group substitution at the β-carbon to the amine group (1,2-diaminopropane) causes a decrease in the absorption capacity when compared with the non-substituted (1,3- diaminopropane). The difference is nevertheless not huge, and the isomer is also investigated. The two isomers of diaminopropane are used as building blocks in the synthesis of heterocycles and coordination complexes, in areas such as biochemistry, manufacture of epoxy resins and textile finishing DAP has a molecular weight of g/mol and a vapour pressure lower than 8 mmhg at 20 C. This colourless diamine evaporates around C at atmospheric pressure and solidifies when temperature drops below -12 C. It is soluble in water and lighter than the latter, as its density is 0.88 g/cm 3. Stable and hygroscopic, DAP is also flammable, air sensitive and incompatible with acids and strong oxidizing agents [32,33]. In addition to be flammable, this liquid is corrosive as the other amines and contact with skin should be absolutely avoided. It is also registered as harmful if swallowed. Wearing protective clothing, safety goggles and gloves is so recommended when handling. Use of respiratory protection should be considered in case of release. 1,3-diaminopropane involved in this work is provided by Sigma-Aldrich and has a purity higher than 99% [32]. Application to CO2 capture process Chemical reaction between 1,3-diaminopropane and carbon dioxide in the presence of water unfolds according to a mechanism similar to that described for monoethanolamine (section 2.1.1). But having two amine functions results in some particularities, and all the reactions that are expected to take place in the absorption process are listed below, based on a similar work involving N-Methyl-1,3-propanediamine as solvent [22]. When water is in contact with carbon dioxide, carbonates and bicarbonates ions are produced by the reactions 2.9 and 2.10 below. These interactions occur in parallel to the ionization of water (2.8). 2 H 2 O H 3 O + + OH (2.8) 2 H 2 O + CO 2 H 3 O + + HCO 3 (2.9) H 2 O + HCO 3 H 3 O + + CO 3 2 (2.10) 12
23 DAP, for its part, is protonated when put in solution. Reactions 2.11 and 2.12 show respectively first and second protonation of the diamine. DAP + H 3 O + DAPH + + H 2 O (2.11) DAPH + + H 3 O + DAPH H 2 O (2.12) As it was explained, the encounter between a carbon dioxide molecule and an amine one results in a zwitterion, which then reacts with a base, water for example, to form a carbamate. This process may involve in the same way one or the other amine function of DAP (2.13) or even both of them (2.14). This last case leads to dicarbamate formation. DAP + CO 2 + H 2 O DAPCOO + H 3 O + (2.13) DAPCOO + CO 2 + H 2 O DAP(COO) H 3 O + (2.14) The combination of reactions 2.11 to 2.14 gives the global equation for the absorption of carbon dioxide (2.15): 2 DAP + 2CO 2 DAP(COO) DAPH 2 2+ (2.15) From the stoichiometry of this relation, it is found that the theoretical absorption capacity of the diamine is 1 mol of CO2 per mol of DAP. This is because for every carbamate formed, a protonated diamine is also produced. Any loading higher than 1 is therefore caused by (bi)carbonates formation. 2.2 Equilibrium measurements In the current energy context that requires optimization of thermodynamic cycles and separation processes, an understanding of the temperatures, pressures, and compositions at which mixtures are pure liquid or vapour is primordial, as it allows to properly match the operating conditions to the working fluid or inversely. The study of vapour liquid equilibrium is thus a key step in the development of new solvents, prior to designing the towers and performing bench scale testing that may lead to a pilot plant. The vapour-liquid equilibrium (VLE) data of ternary Amine-CO2-H2O systems were collected using a low temperature vapour-liquid equilibrium apparatus designed to operate at atmospheric pressure and up to 80 ± 0.1 C. Figure 2.3 shows a picture of the available equipment as well as a schematic representation of this one. Risk assessment is given in Appendix B. The apparatus consists of four 360 cm 3 glass flasks partially immersed in a water bath, whose temperature is controlled, connected together and to a BÜHLER pump that allows the circulation of the gas phase. These elements are placed in a thermostat box, also fitted with a heater and a fan. The condenser and the CO2 analyzer placed after this device can also be seen in Figure 2.3, and a K-type thermocouple records the vapour temperature between these two components. Two other identical thermocouples are likewise used to measure cells and water 13
![temperature within ± 0.1 C. These data as well as those coming from the analyzer are transmitted to a computer [34]. Figure 2.3: Low pressure/temperature VLE apparatus [34].](/docs-images/93/114082401/images/24-0.jpg "At the beginning of the experiment, flasks numbered 2, 3 and 4 are filled with about 150 ml of pre-loaded solution by means of a syringe, while the last one acts as a gas stabilizer/liquid lock and")
24 temperature within ± 0.1 C. These data as well as those coming from the analyzer are transmitted to a computer [34]. Figure 2.3: Low pressure/temperature VLE apparatus [34]. At the beginning of the experiment, flasks numbered 2, 3 and 4 are filled with about 150 ml of pre-loaded solution by means of a syringe, while the last one acts as a gas stabilizer/liquid lock and thus remains empty. So that the equilibrium can be correctly established, the three receptacles should have the same content. This constraint prevents the use of this apparatus with demixing solvents (or solvent mixtures), considered as a promising alternative. The filling must therefore be carefully done, and the good homogenization of the solution must be ensured during its preparation. This pre-loading step is carried out in two parts: the unloaded solvent is first prepared by mixing a predefined amount of amine with de-ionized water, and the weights of both components are noted. As the mixing is exothermic, it is better to wait the return to room temperature before adding carbon dioxide. This second part is achieved with the device represented in Figure 2.4. The unloaded solution is placed into the cylinder, and carbon dioxide is brought to the glass stem, by the bottom of which it will diffuse into the liquid until maximal loading is reached. CO2 is provided by YARAPRAXAIR and has a very high purity (> %). 14
 coming from YARAPRAXAIR is then sent in the system during about 30 seconds in order to flush the gas side and to remove the oxygen dissolved in the loaded solution.")
25 Once the flasks have been filled, pure nitrogen (> 99.6%) coming from YARAPRAXAIR is then sent in the system during about 30 seconds in order to flush the gas side and to remove the oxygen dissolved in the loaded solution. Heater and water bath can finally be turned on, and temperatures are adjusted to the desired values. Next step consists in starting the circulation pump and waiting for the temperatures and the equilibrium to be reached, which takes between 30 and 60 minutes. To limit the amount of condensate, that can become significant when the temperature increases, the line to the analyzer is closed during the establishment of the equilibrium, and is opened when it is almost reached, usually after minutes. Flow in the rotameter is set at 1 NL/min. Figure 2.4: Device for the loading of the solution. When the information provided by the online CO2 analyzer (ref. section 2.3), which will lead to the CO2 partial pressure in the vapour phase (vertical axis of VLE curves), are constant, they are recorded as well as the ambient pressure and the temperatures of bath, of cells and of the condenser, which is usually around 7-12 C. Circulation pump is turned off, and a 10 ml sample is taken from flask number 4 with a syringe in order to analyze its amine and carbon dioxide content (ref. section 2.4), so that the loading will be known (horizontal axis of VLE curves). The three cells are then emptied as good as possible, to prevent any difference in their composition in the next experiment. The procedure is then repeated with another initial solution, prepared by diluting the recovered liquid with the fresh (unloaded) one. The relationship between the amount of solvent added and the new composition of the solution is intuitive and comes from the experience. It is therefore not unusual to achieve very low dilutions, leading to a high number of experiments, or on the contrary to excessively dilute, which will require to restart from a new pre-loaded solution. Again, a good homogenization of the mixtures realized is essential. Once all experiments involving the same solvent have been carried out, the apparatus is dismantled and each work piece is washed with hot and de-ionized water. 15

26 2.3 Analysis of the gas phase IR spectroscopy As mentioned above, the carbon dioxide content in the vapour phase is measured on-line by a Rosemount BINOS 100 CO2 analyzer, after that the flow has been cooled to condense water and amine. It is a non-dispersive infrared photometer (NDIR) [35,36] whose principle can be explained as follows: The infrared radiation is located in the range of long wavelengths (low energy), that is to say between 0.7 and 1000 μm (from to 10 cm -1 ). The interaction of such a radiation with a molecule causes its vibratory/rotational excitation at some specific frequencies, depending on the type of covalent bonds or chemical groups encountered. The analysis of the light transmitted by a sample which has received an IR beam indicates the amount of energy absorbed for each wavelength, what allows the identification of the molecules included, based on the characteristic absorption bands, and of their concentration, due to absorption strength. There are two types of spectrometers: in the FTIR ones (Fourier Transform Infra Red), a monochromatic beam is send through the sample, while in the NDIR ones, the incident radiation is polychromatic and the transmitted light is filtered before entering the detector. Less sophisticated, these analyzers are less bulky and less expensive than the FTIR. A schematic diagram is given in Figure 2.5. As can be seen, radiation also goes through a reference cell placed in parallel that usually contains N2. Due to a rotation chopper wheel, the rays coming from one or the other side of the analysis chamber produce periodically changing signals in the detector. The difference between the two provides a reliable measure of the concentration. Figure 2.5: Non Dispersive Infra Red spectrometer [37]. This method enabling continuous determination is often used for CO2 as this molecule has a strong absorption at 4.26 μm (2345 cm -1 ), wavelength area that doesn't contain any other absorption band. Good selectivity is so ensured. Moreover, very low detection limits (about 2 ppb) can be achieved for a measurement time of only a few minutes. 16
27 2.3.2 Calibration and calculations The use of four channels of IR analyzer is scheduled to allow accurate measurements over a wide range of carbon dioxide contents. Two first ones are suitable for low concentrations, ranging respectively from 0 to 2000 ppm (vol basis) and from 0 to 1 vol%. Beyond that, the third channel that gives results from 0 to 5 vol% should be used, but it was unfortunately out of order. The higher levels were therefore all measured with channel number four, ranging from 0 to 20 vol%. However, the detector of the NDIR spectrometer provides an electric signal, expressed in Volts, instead of a volume fraction of CO2 in the gas considered. A relationship between these two values has to be established by means of a calibration procedure [38], performed for each channel before or after use. It is described below. Calibration is done by sending a gas flow of known composition to the analyzer and observing the corresponding signal. A mass flow controller is used to prepare the various mixtures from nitrogen ( >99.6%) and carbon dioxide of two different concentrations: 4.98% for calibrating channels 1 and 2 and % for the channels 3 and 4. Gases are provided by YARAPRAXAIR. A set of electric signal/real volume composition pairs is so obtained. These points are then put into a graph and approximated by a straight line, whose slope and intercept are recorded and called respectively a channel j and b channel j. The CO2 content of the vapour phase in the IR analyzer, noted Y IR CO2 (vol%) is so determined by the relation below where I channel j is the intensity (Volt) indicated by channel j. Y IR CO2 = I channel j a channel j + b channel j (2.16) In order to get the CO2 partial pressure of the circulating vapour, a further correction must be applied to the previously calculated value [38]. Indeed, as the analyzed gas was dried through a condenser before it reaches the IR spectrometer, the concentration measured is somewhat higher than in the gas over the equilibrium cells. Based on the definition of Y IR CO2, the following expression can be established: Y IR CO2 = v IR CO2 IR v CO2 + v IR N2 + v IR H2O + v Amine IR (2.17) Where vi IR is the gas flow of compound i (Nl/min) in the analyzer. As nitrogen and carbon dioxide are non condensable gases, the same quantities are flowing before and after the condenser (no change in pressure or temperature). For water and amine, on the other hand, the amounts entering the sample cell can be neglected while they are significant in the circulating vapour. Taking these considerations and a material balance into account, the above equation can be modified to show the carbon dioxide flow in the system: Y IR CO2 = v CO2 v total (v H2O v IR H2O ) (v Amine v Amine IR ) (2.18) 17
28 In this expression, v total and v i are respectively the total gas flow and the gas flow of compound i in the equilibrium cells. Multiplying both numerator and denominator by P v total results in the relation below: P CO2 = Y IR CO2 IR [P (P H2O P H2O IR ) (P amine P amine )] (2.19) P is the total pressure within the apparatus, equal to the atmospheric pressure, while P i and P i IR indicate partial pressure in the circulating vapour and in the gas phase going through the analyzer. The correction factor can be expressed in another way: P CO2 = Y IR CO2 IR [P (P T solution P T solution )] (2.20) IR P T solution and P T solution are the vapour pressure of the unloaded solution respectively at the cell and the cooler temperature. They are determined by ebulliometer measurements. 1 Ambient pressure is obtained from barometer Uncertainty propagation Unlike the error, which refers to the difference between a measured value and the "true" one, that should therefore be known, the uncertainty is related to the possible positive or negative deviation from the exact quantity that is desired to be determined. When a variable X is calculated from several measured units xi, each characterized by some uncertainty Δxi, these combine to produce the total uncertainty ΔX. Assuming that all the xi are uncorrelated and IR considering equation 2.20 for P CO2 determination, with P T solution P T solution = P R, the next expression can be used [39] : P CO2 = ( P 2 CO2 IR Y ) CO2 IR Y 2 CO2 + ( P 2 CO2 P ) P 2 + ( P 2 CO2 ) P R P R 2 (2.21) The different terms are set out as follows: ( P CO2 ) = P P R IR Y CO2 ( P CO2 P ) = ( P CO2 IR ) = Y P CO2 R P is related to the accuracy of the pressure reading on the barometer and is taken equal to ± 0.1 mmhg, or ± kpa. ΔP R is usually fixed at ± 0.3 kpa by the ebulliometer operators, and Y IR CO2 is provided by the analyzer manufacturer [35] with a maximum value of 2% full scale. According to the channel used for the measurement, it therefore worth: 1 Maybe shortly describe in Appendix. 18
29 Channel IR Y CO2 (%) ± ± ± 0.1 ± 0.4 Table 2.1: Uncertainty on the CO 2 analyzer measurements. 2.4 Analysis of liquid samples As it was described in section 2.2, a sample of about 10 ml is taken from the liquid phase at the end of the experiment. Amine and carbon dioxide concentrations are then calculated, what allows to get the loading of the solution in equilibrium with the vapour phase. One must be very attentive to the definition given for this ratio. As a reminder, it is usually expressed as the number of moles of carbon dioxide per moles of amine. Here, however, the following relation is used: Loading = CO 2 [mol kg] Alkalinity [mol N kg] (2.22) We must therefore be careful when comparisons with literature are realized Determination of the CO2 content The procedure adopted to get the concentration of carbon dioxide in the liquid phase is the barium chloride precipitation-titration method. It contains the subsequent steps. A 250 ml Erlenmeyer flask is first filled with 25 ml of 1N BaCl2, 50 ml of 0.1N NaOH, and between 0.3 and 1 ml of sample. The exact weight added must be recorded and should be adjusted in agreement with the expected CO2 content. Lower volumes should thus be used if small amounts of carbon dioxide are suspected and vice-versa. The flask is then sealed with a stopper equipped with a vapour tube and heated on a warming plate to enhance the barium carbonate formation by the reaction below. Ba 2+ + CO 2 + 2OH BaCO 3 (s) + H 2 O (2.23) Boiling is held for a few minutes after what the Erlenmeyer is placed in cold water. When the temperature of the mixture has fallen back to room temperature, which takes about 30 minutes, a vacuum filtration using a 0.45 μm HAWP membrane filter provided by MILLIPORE is performed to recover the precipitate. It is important to wait for the cooling of the solution before starting this step, to prevent the solid from adhering to the metal filter top. Washing with de-ionized water is further realized. The filter is then transferred to a 250 ml beaker and covered with 50 ml of de-ionized water. Hydrochloric acid (0.1N) is dispensed in order to dissolve the BaCO 3 cake and thereby liberate the CO2 in the solution, according to the following reaction: BaCO 3 (s) + 2HCl BaCl 2 + CO 2 + H 2 O (2.24) 19

30 The volume of HCl added must exceed the amount required for complete dissolution of the precipitate. 40 ml are often sufficient, but ph can also be controlled as it should be lower than 2. The weight of acid fed to the beaker must be precisely know and recorded. After all barium carbonate has disappeared under the influence of a magnetic stirrer (should results in a clear solution, add HCl if not), the quantity of hydrochloric acid that didn't react is determined by a titration with 0.1N NaOH. This final step is performed with an automatic titrator, Metrohm 809 Titrando, shown in Figure 2.6, which takes about 10 minutes to reach ph 7. Figure 2.6: Metrohm 809 Titrando for CO 2 analysis. For each sample collected during the production of vapour-liquid equilibrium, two parallels are realized to ensure that good results are obtained. The difference between both concentrations so found shouldn't exceed 3%, and the tests must be repeated if it is too high. This method is also applied to a blank, what means that no sample is added during the first step, to take into account the CO2 content of the air in our calculations. Once titration is over, the volume of sodium hydroxide used is noted, and the following equation gives the carbon dioxide concentration in the liquid phase: CO 2 (mole kg) = 1 HCl(g) NaOH(ml) [BlankHCl(g) BlankNaOH(ml)] 20 Sample (g) (2.25) The solutions employed were previously prepared from de-ionized water, barium chloride dihydrate (CAS number: ) of purity higher than 99% provided by SIGMA- ALDRICH, and Titrisol sodium hydroxide and hydrochloric acid ampoules specially designed for having a concentration of 0.1N if used in 1000 ml. 20

31 2.4.2 Determination of alkalinity Faster than the carbon dioxide determination approach, the technology implemented in this case is only based on an acid-base titration. Methodology is given below. A sampling beaker is filled with 50 ml of de-ionized water, weighed, and its mass is taken as reference. Two millilitres are then added from the liquid sample, and the exact amount introduced is noted. The basic solution thus obtained is thereafter neutralized with 0.2N H2SO4 by means of an automatic apparatus, Mettler Toledo G20 (Figure 2.7). A couple of minutes are enough to get the end-point of ph 2.5. The volume of acid consumed is used in the following equation to calculate the total alkalinity of the solution: Alkalinity (N mol kg) = H 2SO 4 (ml) 0.2 Sample (g) (2.26) Similarly to what is done for dosing carbon dioxide, two parallels are prepared for each point and the validity of the measurements is ensured for a difference lower than 3%. Making a blank sample is not necessary. The sulphuric acid solution is made with two Titrisol ampoules designed to have a concentration of 0.1N when used in 1000 ml. Figure 2.7: Amine titration device Mettler Toledo G20. 21

32 Chapter 3: Thermodynamic Framework Thermodynamic concepts related to the phenomena involved are presented in this chapter. Phase and chemical equilibria governing absorption processes are explained as well as the notions of activity and fugacity that lead to the establishment of models to represent systems behaviour. Indeed, if the knowledge of vapour-liquid equilibrium data is essential to look into new solvents for the carbon dioxide capture, thermodynamic models provide an excellent alternative to time consuming measurements. The equations used for their development and the methodology implemented are also presented. 3.1 Equilibrium equations The absorption mechanism of the gaseous compound consists of two steps. First one is the dissolution of the gas phase species in the liquid phase: CO2(g) CO2(l) (3.1) Once in an aqueous form, it is converted into ions by the chemical reaction with the amine, what shifts equation 3.1 to the right side. More or less volatile compounds also results from the partial dissociation of weak electrolytes. Vapour-liquid equilibrium therefore depends on both phase and chemical equilibria (see Figure 3.1), detailed below, which must be solved simultaneously. Figure 3.1: Phase and chemical equilibria [40] Phase and chemical equilibria A system, consisting of a liquid and a vapour phase and comprising C constituents, is regarded to be in its thermodynamic equilibrium state when the following three criteria are simultaneously fulfilled [41] : T V = T L P V = P L (3.2a) (3.2b) 22
33 μi V = μi L For i changing from 1 to C (3.2c) The subscripts V and L respectively refer to the vapour and the liquid and μi is the chemical potential of compound i. It is defined as given in equation 3.4. This latter involves the Gibbs free energy, noted G, state variable characterized by the relation 3.3 where H is the enthalpy and S the entropy of the system. G (T,P, n1, n2,..., nc) = H (T,P, n1, n2,..., nc) - T * S (T,P, n1, n2,..., nc) (3.3) μ i (T, P, n 1, n 2, n C ) = ( G n i ) n i j,t,p (3.4) In the expressions above, n i designates the number of moles of compound i. Phase equilibrium is so reached when the temperature, pressure and chemical potential of all species in vapour and liquid phase are uniform over the whole system. The task of thermodynamics is then to quantitatively describe the distribution of each component among the present phases in this stable conditions. Considering now that chemical reactions also take place within the system mentioned above, chemical equilibria should in addition be taken into account as they handle the extent of dissociation and reaction and are therefore responsible for the distribution of species in the involved phase(s). They are achieved by minimizing the Gibbs free energy, at constant temperature and pressure [42]. This is equivalent to meet the condition expressed by relation 3.5. C i=1 ν i μ i = 0 (3.5) In the expression above, ν i is the stoichiometric coefficient of compound i if a global reaction is considered. Conventionally, it is a negative value when i is a reagent and a positive one when i is a reaction product. Traditionally, the equilibrium state of a reaction is characterized by an equilibrium constant, K, specific to the contemplated interaction and defined as follow: νi Kr (T) = ij a ij (3.6) The couple ij refers to a constituent i in phase j that takes part into the reaction r. The variable aij is called the activity coefficient and is explained in a further section. The temperature dependency of theses constants can be given on a molar basis by relation 3.7. ln K r = A + B + C ln T + D T (3.7) T Where T is the temperature in Kelvin. The knowledge of these parameters A,B,C and D for all the reactions involved in the ternary CO2-H2O-Amine system is therefore essential in VLE models. The reactions that occur when absorption is carried out with MEA or with DAP are presented in section and respectively. Other fundamental thermodynamic parameters in vapour-liquid equilibria are, as shown in the above developments, the chemical potentials or partial molar Gibbs free energies. As they can't be directly determined by measuring instruments, it is therefore desirable to express 23
34 these quantities in terms of some auxiliary function that might be more easily identified with physical reality. These considerations led to the concept of fugacity Fugacity and fugacity coefficient In general, the fugacity of a component i in any system, made by a mixture of C constituents or by a pure solid, liquid or vapour phase, is defined by the relation 3.8 [41]. μ i = μ i (T, 1) + RT ln f i (T, P, n 1, n 2, ) (3.8) Where μ i is the chemical potential of species i in its standard, gaseous, pure, perfect state (*), at the system's temperature T and a pressure of 1 atm. Fugacity so represents the gap between the chemical potential in actual conditions and the one is this reference state. Based on this, the phase equilibrium condition 3.2c can be rewritten in: μ i (T, 1) + RT ln f i V = μ i (T, 1) + RT ln f i L (3.9) f i V = f i L (3.10) Thermodynamic developments [41] show that, in a pure phase, the fugacity is proportional to the pressure while it is related to the partial pressure of the compound if it is part of a mixture. In both case, the correction factor is the fugacity coefficient, i. It depends on the temperature and the pressure and reflects the difference between the real system and the ideal gas state. Its value is smaller than unity if molecules have attractive interactions and higher if they repel. The following definitions are suitable for a mixture of C constituents in any phase, but can be easily particularized for a pure phase. f i (T, P, y) = y i P i (T, P, y) (3.11) P RT ln i = (v i (T, P, y) RT ) dp 0 P (3.12) lim i (T, P, y) = 1 p 0 In these relations, yi is the mole fraction of species i in the phase in question, y the composition vector, R the gas constant and vi the partial molar volume, function of temperature, pressure and composition. The resolution of equation 3.10 and the determination of fugacity coefficients thus require the use of an EoS. As these one are often in the form P = f (T, v, n1, n2,...), equation 3.12 should be expressed on a different way: RT ln i = ( RT ( P V V n i )T,V,ni j ) dv RT ln Z (3.13) Z is the compressibility factor, equal to 1 for a perfect gas. However, as the reference state used to define the fugacity is the perfect gas at T and 1 atm, calculations for a liquid or a solid phase imply the existence of an equation of state valid over a wide range, which is a problem. To solve it, concept of activity is introduced. 24
35 3.1.3 Activity and activity coefficient Similarly to what is done for the fugacity, activity can be related to the chemical potential by the following relation [41] : μ i (T, P, n 1, n 2, ) = μ i 0 (CS) + RT ln a i (T, P, n 1, n 2, ) (3.14) The difference lies in the reference conditions used. In this case, μ i 0 is the chemical potential of compound i in its standard state ( 0 ) at temperature T, which can be different from the perfect gas at T and 1 atm. Physically, the activity of a substance in a given system represents how reactive it is relative to its standard state. The formula below shows the relationship between activity and fugacity: a i = f i(t, p, n 1, n 2, ) f i 0 (3.15) For a liquid-vapour equilibrium, different standard states are usually selected for the liquid and the gaseous species, and equation 3.10 becomes: a i V f i 0V = a i L f i 0L (3.16) Alternatively, introducing the fugacity coefficient for the vapour phase: y i P i (T, P, y) = f i 0L a i L (T, P, x) (3.17) Just as the fugacity coefficient measures the non ideality compared to the ideal gas state, an activity coefficient, γ i, defined by relation 3.18, can also be introduced to represent the gap between a real condensed phase and an ideal solution. Note that xi is the mole fraction of compound i and x the composition vector in the liquid. γ i = a i x i (3.18) These parameters also depend on temperature, pressure and composition and are determined using equations of state for condensed phases, called solution models. For the liquid phase, it is usual to consider as reference state the pure liquid i at T and P [41,43]. The fugacity f i 0L is then calculated from the one of the pure vapour in equilibrium, that's to say the saturation vapour of i at the temperature T and the saturation vapour pressure Psat. Equation 3.19 is obtained taking into account the definition given by relation 3.11 adapted for a pure phase. The exponential term, the Poynting factor, also noted ψ i, is expressed as the effect of change in pressure (Psat to P). It is often close to unity due to the low volumes of condensed phases, except for high working pressures. f i 0L (T, P) = f i 0 (T, P sat ) exp P Psat v i L RT dp = P sat sat (T, P sat )ψ i (3.19) 25
36 3.1.4 Standard states conventions Regarding the vapour phase, the ideal gas at the operating pressure T and 1 atm serves as reference for all the species. In contrast, several standard states could be chosen for the constituents in the aqueous phase, and two systems of normalization can then be defined [23,43]. Symmetric reference system In this case, standard conditions are expressed in the same way for all the compounds, i.e. the pure liquid at the temperature and the pressure of the solution. This convention is often used when both solutes and solvent in their pure state are liquids under the operating conditions of the system. If the actual state approaches the reference one, then: lim γ i = 1 x i 1 The solution tends to be ideal in the Raoult's law sense. Asymmetric reference system This convention is applied when, for at least one solute, the pure liquid doesn't exist at T and P. The standard state of this compound is so defined as a pure substance infinitely diluted at T and P, while the pure liquid is chosen as reference for other constituents. The systems studied in this work are in this second case. The limits for the activity coefficients are given below. For solvent(s), i.e. amine and water: For ionic and molecule solutes (CO2): lim γ i = 1 xi 1 lim γ i = 1 xi 0 In the area of the low CO2 levels in the aqueous phase, the fugacity of the solvent follows the Raoult's law, and is so given by relation 3.20, while the fugacity of the solutes is expressed by the Henry's law (3.21). H i/s = f i is the Henry's constant of the dissolved compound i in the solvent. It is a function of T and P. Raoult's law: f i = x i f i 0 (3.20) Henry's law: f i = x i H i/s (3.21) 26
37 3.2 Thermodynamic models The previous developments led to the writing of a general expression for the equilibrium between a gaseous and a liquid phase: y i P i (T, P, y) = Ω i x i γ i (T, P, x) ψ i (3.21) Where Ω i = { P sat sat for pure liquid reference state H i/s for infinite dilution reference state In this relation, the temperature (T), the operating and saturation pressures (P, Psat), the Henry's constants (H i/s ), the vapour and liquid mole fractions (xi, yi) and composition vectors (x, y), are deducted from experiments in a direct or indirect way. The poynting factor (ψ i ) can be neglected for the low and medium pressures. On the other hand, the determination of the fugacity coefficients ( i, sat ) and of the activity coefficients (γ i ) requires an equation of state and a solution model. This section presents the one used in the modeling part of this work Gas phase properties Calculations of the thermodynamic properties and equilibrium conditions for the vapour phase are performed with the cubic equation of state developed in 1976 by Peng and Robinson. It has the following form [41] : P = RT v b a v 2 + 2bv b 2 (3.22) As in other expressions set out above, R is the ideal gas constant, P the pressure, T the temperature and v the molar volume. Both parameters a and b are characteristics of the substance involved, but a is temperature dependant while b is a constant. They are defined by the equations below where the subscript C refers to the critical coordinates of the compound and the subscript r to the reduced parameters (operational variable divided by the critical one). a(t) = a(t C ) α(t r ) b = RT c P c a(t C ) consists in the non temperature dependent part of parameter a while the expression of α(t r ) is adjusted according to the saturation vapour pressure. a(t C ) = (RT C) 2 P C α(t r ) = [1 + m (1 (T r ) 0.5 )] 2 with m = ω ω 2 Where ω is the Pitzer acentric factor of the constituent. 27
38 3.2.2 Activity coefficient models NRTL equations The Non Random Two Liquid (NRTL) model [41] developed by Renon and Prausnitz (1968) is based on the idea of local concentrations introduced by Wilson some years before. He had observed two sets of molecules in a solution (Figure 3.2), each being focused around a different species, and had found that they had different concentrations, also distinct from the global one. On the microscopic scale, the solution is so made of two liquids. Compared to Wilson's model, Renon and Prausnitz have added another parameter in order to better represent the non randomness of the molecules' distribution in both cells. Figure 3.2: Two types of cells according to Wilson's theory. Expression for the excess Gibbs energy, defined by the difference between mixing and ideal mixing Gibbs energy, in case of binary system is shown in equation RT = x τ 21 G 21 1x 2 [ + τ 12G 12 ] (3.23) x 1 + x 2 G 21 x 2 + x 1 G 12 G E τ 12 = g 12 g 22 RT τ 21 = g 21 g 11 RT G 12 = exp ( α 12 τ 12 ) G 21 = exp ( α 21 τ 21 ) The macroscopic molar fractions are identified by the variables xi while g ij and g ii are temperature dependent energy parameters, respectively related to i-j and i-i interactions. α ij characterize the non random assignment of molecules i around j. It is assumed that α ij = α ji and that it is equal to zero for completely random mixtures. The partial derivation of relation 3.23 relative to the i content gives the excess chemical potentials, which can be connected to the activity coefficients: 28
39 μ 1 E G 21 RT = ln γ 1 = x 2 2 [τ 21 ( ) x 1 + x 2 G 21 μ 2 E G 12 RT = ln γ 2 = x 2 1 [τ 12 ( ) x 2 + x 1 G τ 12 G 12 (x 2 + x 1 G 12 ) 2] (3.24) τ 21 G 21 (x 1 + x 2 G 21 ) 2] (3.25) This model thus requires 3 parameters for a binary system, 6 if we consider the temperature dependency of the form Xij = aij + bij * T where X can be τ or α. This makes it very flexible, what leads to good representation of non-ideal mixtures, but becomes an issue when more than two species are considered. Electrolyte-NRTL An extend of the NRTL model was proposed by Chen and his co-workers (1986) in order to represent the liquid-phase non-ideality for aqueous and mixed-solvent electrolyte systems over wide ranges of state conditions [23,44,45]. Reviewed several times for the publication of the first version, it is often used to accommodate interactions with ions in solution. This local composition theory is based on the following assumptions: Like-ion repulsion: due to high repulsive force between ions of the same charge, the probability to find cations in the near vicinity of another one is low. Same for anions. Local electroneutrality should be satisfied. E-NRTL model defines the excess Gibbs free energy in electrolyte systems as the sum of two contributions: G ex = G ex ex SR + G LR where * indicates asymmetric convention. 1) Short range forces between all species are included in the term G ex SR. The model uses the NRTL expressions for multiple components to account for these local interactions that exist at the immediate neighbourhood of any species (molecular, anionic or cationic ones). ex j X j G jm τ jm = X m + X m k X k G c ( X a, j X j G jc,a,cτ jc,a,c ) km c a, a,, X a,, k X k G kc,a, c + X a ( X c, j X j G ja,c,aτ ja,c,a ) a c, c,, X c,, k X k G ka,c, a G SR (3.26) In this relation, X j = x j C j = C j n j i n i is the effective mole fraction of component j, with j (and also k) = m, c or a, subscripts that respectively refer to molecules, cations and anions. If the species considered is a molecular one, C j = 1, while C j = z j, the charge number of the species j, for ions. The local binary parameters G ij and τ ij are connected to each other by the non-randomness factors α ij. Expressions are given thereafter: G jc,a, c = exp( α jc,a, c τ jc,a, c) 29
40 G ja,c, a = exp( α ja,c, a τ ja,c, a) G am = c X cg ca,m c, X c, G ca,m = exp( α ca,m τ ca,m ) and G cm = a X ag ca,m a, X a, 2) The long range electrostatic ion-ion interactions count for the second part of the excess Gibbs free energy expression. This second term comes from the Pitzer-Debye-Hückel formula written below: ex G PDH = RT ( X k ) ( /2 k Ms ) ( 4A ϕi X ρ 1 ) ln (1 + ρi X 2) (3.27) X k is the mole fraction of the liquid phase, Ms the solvent molecular weight (kg/kmol), I X the ionic strength (mole fraction basis), A ϕ the Debye-Hückel parameter and ρ is called the closest approach parameter. I X and A ϕ can be calculated by the next equations: I X = 1 2 x iz i 2 i A ϕ = 1 1/2 3 (2πN Ad s 1000 ) ( Q2 3 e ε w kt ) 2 (3.28) (3.29) In these relations, z i represents the charge number of ion i and Q e the electron charge, N A is Avogadro's number, k the Boltzman constant, d s states for solvent density while ε w is dielectric constant for water. In their formula, Pitzer, Debye and Hückel used the ideal dilute state in the mixed solvent as reference state for the ionic species. However, the reference used to calculate the short range term is the infinitely diluted aqueous solution. Born expression is so added in order to correct the difference between the dielectric constant of water and of the mixed solvent. ex G Born = RT ( Q2 e 2kT ) ( 1 1 ) x 2 iz i ε s ε w r i i 10 2 (3.30) ε s is the dielectric constant for the solvent and r i the Born radius of species i. The excess Gibbs free energy contribution from long range interaction is so given by: G ex LR = G ex ex PDH + G Born Once G ex has been determined, the activity coefficients γ i of all the species present in the system, ionic or molecular ones, solute or solvent, can be calculated as follows: ln γ i = 1 RT [ (n ig ex ) n i ] T,P,n j i i, j = m, c, a (3.31) Where n i is the mole number of compound i. 30

![3.1 Regression tool Parameters fitting was performed with an in-house program elaborated by D. Pinto and J. Monteiro during the last years: PARFINDER [46].](/docs-images/93/114082401/images/41-1.jpg "Still under development but already proved in other works [22,23,40], this optimization tool is written in Matlab R2011a and provides results in Excel files.")
41 3.3 Parameters fitting Implementation of the correlations described above to solve the vapour-liquid equilibrium equation (3.21) requires the knowledge of a number of interaction parameters. They are determined by regression from experimental data, thanks to software and computer codes specially developed for this purpose Regression tool Parameters fitting was performed with an in-house program elaborated by D. Pinto and J. Monteiro during the last years: PARFINDER [46]. Still under development but already proved in other works [22,23,40], this optimization tool is written in Matlab R2011a and provides results in Excel files. It also presents the advantage of having a graphical user interface, shown in Figure 3.3, which makes it possible to operate without any programming knowledge. Parfinder program comprises one optimization routine, the PSO algorithm, with gbest and lbest as possible topologies, and allows to fit the parameters to vapour pressure (Antoine and Riedel) and activity coefficients (NRTL, e-nrtl, r-e-nrtl) equations. More information on the PSO algorithm are available in appendix. Figure 3.3: Graphical user interface in Parfinder. Before starting the program, the user has to complete the provided Excel tables with the data available for optimization. VLE results are required for the vapour pressure fitting while VLE (partial or total pressures), excess enthalpy and freezing point depression (unloaded systems) or heat of reaction and physical solubility (loaded systems) experimental data can serve for the activity coefficient fitting. It is also possible to fix the value of some parameters according to the model chosen. Optimization normally takes a couple of days, depending on several factors like the amount of input points, the system complexity, the maximum number of iterations and the strength of the computer. After it is done, possibility is offered to generate figures with the model predictions and the experimental data and to fill the Excel files with optimized parameters. 31
42 3.3.2 Database When activity coefficients are wanted to be determined with Parfinder, implementation of a complete database is an important preliminary step. Indeed, several physical and chemical properties are needed to solve the models described in section 3.2 or even more generally the phase and chemical equilibria equations. Components list One of the table in the database is dedicated for listing all the species present in the system. For each of them, charge and molecular weight are indicated, considering a zero charge for molecules and identifying zwitterions by a small letter z in the charge column. Molecules also has to be characterized by the following properties: Dielectric constant parameters for relation: ε(f/m) = A + B ( 1 1 ), with T in K. T C Parameters for Antoine or Riedel saturation pressure equations. Critical properties: temperature, pressure, volume, the Racket parameter (what is it?). Acentric factor Parameters for molar volume equation: V(m 3 /mol) = A + BT + CT 2, with T in K. Based on section 2.1.2, it can be seen that our system includes 12 compounds: 5 anions (OH -, HCO3 -, CO3 2-, DAPCOO -, DAP(COO)2 2- ), 3 cations (H3O +, DAPH +, DAPH2 2+ ), one zwitterion (DAPH + COO - ) and 3 molecules (CO2, DAP, H2O). Properties for carbon dioxide and water are very well known and easily available. They are taken from DIPPR database that also provides some information for 1,3-diaminopropane. Unfortunately, dielectric constant is not reported, and reliable values couldn't be find in the literature. Same parameters than those used for MEA were thus selected, but it is clear that it is an important point to improve in our model. Tables 3.1 summarizes the molecules properties. Molecules Dielectric constant A B C T C [K] Critical properties P C V C [kpa] [m 3 /mol] Acentric factor CO ,21 7,38E+3 9,40E-5 0, H 2O 78, ,38 298,15 647,096 2,21E+4 5,59E-5 0, DAP 35, , ,12E+3 3,16E-4 0, Saturation pressure (Riedel*) Z RA [-] Molar volume A B C D E A B C CO 2 140, ,268 0, ,43E-5-3,09E-7 5,70E-10 H 2O 73, ,2-7,3037 4,1653E-6 2 1,81E DAP 144, ,015 0, ,05E-5-1,4E-7 3,82E-10 * P sat (Pa) = exp (A + B T(K) + C ln T(K) + DT(K) E ) Table 3.1: Properties of molecular species. 32
43 DAP parameters for Riedel equation were taken from M. Saeed's work (2011) [47]. A graph showing his experimental data, results from other articles [48,49] and the correlation used is available in Appendix XX. It can be seen that the saturation pressures are well predicted in a temperature range lower than 80 C, which is here investigated, while an overestimation occurs at higher temperatures. Reactions list Reactions that occur in the system also have to be set up in the database. For each of them, compounds involved are selected and their stoichiometry is mentioned, with negative numbers for reactants and positive for products. Eight interactions are considered, according to the mechanism presented in section These are water dissociation (1), carbonates formation (2), bicarbonates formation (3), amine first and second protonation (4,5), zwitterion/carbamate equilibrium (6), global reaction for carbamates formation (7) and carbamate/dicarbamate equilibrium (8). As previously highlighted, chemical equilibrium constants are of first importance for tracing vapour-liquid equilibrium curves, and the parameters of equation 3.7 must be specified when they are known. Otherwise, we can choose to regress them during the optimization, what is done for reactions 6,7 and 8 for which no data are available for the moment. On the other hand, several works [50,51] report pka measurements for DAP at different temperatures and ionic strengths. It reflects the basicity of an amine and is related to the protonation constants by relation 3.32: pka = - log Ka (3.32) If the various studies seem to agree on the value range of the first protonation constant, although different numbers are given, having a good approximation of the second protonation constant is much more difficult. Problems related to the realization of such experiments and to obtaining reliable values are one of the main limitations for the modeling of the DAP-CO2- H2O system. The pka data of 1,3-diaminopropane used in this master's thesis come from S. Hussein's measurements [40] and the correlations that have been deducted, and are expressed on a mole fraction basis. A graphic representation is available in appendix XX. Table 3.2 indicates parameters for the chemical equilibrium constant dependency with temperature [52]. A B C D K 1 132, ,9-22, K 2 231, ,1-36, K 3 216, ,7-35, K 4-328, ,214 49, K 5 163, ,2-23, ln K(mole fraction) = A + B T(K) + C ln T(K) + D T (K) Table 3.2: Coefficients for the chemical equilibrium constants. 33


44 Chapter 4: Results and Discussion 4.1 Experimental results Monoethanolamine tests Being the most used solvent at this time and acting as the benchmark for comparative studies of new solutions, monoethanolamine has been the subject of numerous research, and its vapour-liquid equilibria are, among other things, well known. Its involvement in this Master's thesis is so related to a preliminary step aiming to get used with the equipments and experimental procedures implemented and described in Chapter 2. This section reports VLE data of MEA-H2O-CO2 system. Experiments were first conducted at 40 C from a 30 wt% MEA solution that was then loaded with CO2. Analysis results of the two phases are plotted in a graph (Figure 4.1) showing the partial CO2 pressure (kpa) as a function of the CO2 loading (mol CO2 /mol nitrogen). Obtaining such an equilibrium curve requires approximately 4 working days, involving the equilibrium achievement for at least 10 points (1 hour for each), the realization of the analyzes (4 hours/ 5 samples) and the results processing. The two charts exhibit the same set of data, but the right one uses a logarithmic scale for the vertical axis. This is the usual representation for vapour-liquid equilibria, and only this last one will be shown in the following. Note that for ethanolamine whose molecule only contains one N atom, our loading definition gives same results than the conventionally used in literature (mol CO2/mol amine). Figure 4.1 also contains values from previous studies, carried out with the same VLE apparatus [53] or by a different way [54]. Figure 4.1: VLE data at 40 (±0.1) C and low pressure for 30 wt% MEA. 34
45 p CO2 (kpa) Comparison between the results previously obtained with the equilibrium equipment used in this work and data provided in another report indicates some differences, but it is not unreasonable to trust the set up procedure. The first tests performed as part of this assignment are not as good as they could be, because of the significant scattering observed and problems in realizing appropriated dilutions. In order to better control the techniques before operating a new compound, a second set of experiments was conducted with the same solvent at 80 C. Figure 4.2 presents the equilibrium curve from this work as well as one formerly measured [53]. It can be seen than the results are much better since the points of the two series overlap and a wider range of loadings was covered ,1 0,01 0 0,1 0,2 0,3 0,4 0,5 Loading (mol CO2/mol Nitrogen) Literature same apparatus This work Figure 4.2: VLE data at 80 (±0.1) C and low pressure for MEA 30wt%. Regarding the reproducibility of the measurements, it comes from the figure above that the results are quite faithful, but it requires a careful work from the operator who has to ensure, inter alia, the homogeneity of the solutions and the good establishment of the equilibrium, which can take some time. Data provided by the analysis and detailed calculations are available in Appendix X Vapour-Liquid Equilibrium of 1,3-diaminopropane The first objective of this Master's thesis is to supplement the data available for this potential solvent in order to be able to decide, when holding all the cards, whether or not it could replace monoethanolamine for a less energy intensive carbon dioxide capture, or at least if it could help improving it. Similar project has already been done in 2012 by Hussain S. [40] who studied VLE of 2M (15.18 wt%) and 5M (37.83 wt%) DAP in presence of water and CO2. His results are given in Appendix X2 and will also be shown further in this report. Vapour-liquid equilibrium of ternary DAP-CO2-H2O systems are reported in this section. Experiments were performed over aqueous solutions of 1,3-diaminopropane with two different concentrations: 1M (7.6 wt%) and 3M (22.7 wt%). As the low pressure VLE apparatus can only operate in a limited temperature range, data were collected at 40 (±0.1) C, 60 (±0.1) C and 80 (±0.1) C. All the experimental information and the calculations can be 35
46 p CO2 (kpa) p CO2 (kpa) found in Appendix X3. Partial pressures between and 7.87 kpa were obtained for loadings ranging from to mol CO2/ mol N (0.3 to 1 mol CO2/mol amine), as shown in Figure 4.3 and ,0000 1,0000 0,1000 0, ,1 0,2 0,3 0,4 0,5 0,6 Loading (mol CO2/ mol N) 40 C (1) 40 C (2) 60 C 80 C Figure 4.3: Experimental VLE data of 1M DAP. 10,0000 1,0000 0,1000 0,0100 0,00 0,10 0,20 0,30 0,40 0,50 0,60 Loading (mol CO2/ mol N) 40 C 60 C 80 C Figure 4.4: Experimental VLE data of 3M DAP. Two series were made for DAP 1M at 40 C as there were some doubts about the validity of the measurements at higher loadings. Despite some scatter, a trend emerges towards a higher slope of the tangent when the carbon dioxide content of the liquid phase is important. The vapour enrichment in CO2 is faster than the solvent one in this range. A similar conclusion can be drawn from the 40 C curve for DAP 3M. Current knowledge point to a sigmoid shape of the vapour-liquid equilibrium curve as it is for other solvents (see MEA curves in next section). This is indeed guessed through our results at 40 C, but can't be completely confirmed considering the impossibility to work with higher loadings. About 60 C and 80 C data, they could be seen as flattened sigmoid curves. 36
47 These figures are in agreement with the phenomena involved. Indeed, as chemical absorption that occurs in the liquid phase between CO2 and the amine is exothermic, it is enhanced at low temperatures. There is therefore less carbon dioxide in the vapour phase at 40 C than at 80 C, and loadings increase faster. However, when they are close to the maximum value, CO2 can no longer be predominantly absorbed chemically but has to dissolve in the solution. Due to this major role of physical absorption at high gas loadings, effects of pressure and temperature are less pronounced and the different curves are close to each other Influence of the DAP concentration Data from this work and from Hussain's thesis [40] were plotted together to highlight the dependence of the ternary system equilibrium relative to the DAP concentration at different temperatures. Figure 4.5 presents an overview of the results obtained at 40 C, 60 C and 80 C for different diamine contents. Even if they are nevertheless used in this comparison study, it should be noted that in his report about 2M and 5M diaminopropane, S. Hussain expressed some misgivings about the validity of his data, particularly for the lowest concentration. Figure 4.5: VLE data at different DAP concentrations. 37
48 It seems difficult, based on these charts, to draw a clear conclusion on the influence of concentration. About the 40 C curves, they overlap rather well except for the low pressures. At 60 C however, vapour-liquid equilibrium appears to move towards higher loadings when the concentration increases, while the points collected at 80 C give the impression of being pile up, if 5M data at low pressures aren't considered. Lacking other sets of data enabling a comparison to support, or not, the validity of the measured values, it should be kept in mind when analyzing these results that some experimental errors may have occurred, despite the preliminary tests performed in this work in order to reduce this risk. Nevertheless, literature provides VLE information at different concentrations for MEA [53] and piperazine [55], a cyclic diamine strongly considered for CO2 capture, that could help to interpret our results. About ethanolamine, no effect of the mass fraction is reported for the range of temperature and molarity investigated here, while a study carried out at 328K (55 C) with PZ indicates a similar evolution for the curves obtained with concentrated diamine aqueous solutions (from 6.7 to 38.7 wt%). Consequently, the analysis, in the light of current knowledge, of the VLE resulting from our experiments, allows to consider that the vapour-liquid equilibrium of the ternary DAP-CO2-H2O system is independent of the amine content of the solvent, at least in the tested limits. From this, assuming that all the points should follow the same path, a selection of the data can be realized to remove those suspected biased, taking into account the measurements uncertainties. The use of this limited set of value will eventually help the modeling tool in the parameters fitting, by simplifying a bit this complex system. Uncertainty on CO2 partial pressure is determined as explained in section 2.3.3, and calculations are reported in Appendix X4. For the uncertainty on loading measurement, it is taken equal to the reproducibility, i.e. 3%. Figure 4.6 presents the 40 C data with their error bars, divided into three graphs to ensure better visibility, according to the pressure range covered by the CO2 analyzers used. In the first chart zooming on the low pressure part of the equilibrium, two points representing different DAP concentrations have various ordinates for the same loading of 0.29, but as their error bars are overlapping they can be considered as one single point. On the other hand, for a similar problem occurring at an abscissa of 0.39, the difference can't be explained by uncertainties and may reflect some experimental errors. We choose to trust the footsteps of the 3M data as they better agree with the 2M and 5M points, and 1M ones are so removed. In addition, the isolated spot in the very low pressures range should also be deleted to ensure the convergence of Parfinder program. About the second graph that indicates equilibrium data between 0.2 and 1 kpa, attention is drawn through the point (0.49,0.62) which has a large vertical uncertainty. The explanation is that it was measured with channel 4, inappropriate to vapour phase content. It was so removed. In the ordinates range of kpa, two paths appear, 2 and 3M on the left and 1 and 5M on the right. This second could be taken out, but it wasn't due to horizontal error bars. Finally, for the highest pressures, nothing disturbing is noticed when taking uncertainties into 38
49 p CO2 (kpa) p CO2 (kpa) p CO2 (kpa) account, and all the data were considered for the model. If some difficulties arise in the fitting, higher points will be remove. 0,2 0,02 0,002 0,000 0,100 0,200 0,300 0,400 0,500 Loading (mol CO2/ mol N) 1 0,2 0,300 0,400 0,500 0,600 Loading (mol CO2/ mol N) ,450 0,470 0,490 0,510 Loading (mol CO2/mol N) 0,530 0,550 Figure 4.6: VLE data at 40 C and different DAP concentrations-error bars. A line of reasoning similar to what is detailed here for 40 C was applied to the data collected at 60 C and 80 C. Graphs with error bars are available in Appendix. 39
50 p CO2 (kpa) Comparison with MEA The equilibrium data for 30 wt% ethanolamine from experiments undertaken in a previous work [53] are compared with our results for the 1,3-diaminopropane at 40 C, 60 C and 80 C in the graph below (Figure 4.7). Ideally, the comparison study should involve solvents at the same mass content. But, as the 4M (~ 30 wt%) DAP hasn't been investigated, 3M is used instead, which should not cause big differences, in the lights of the previous conclusions. Attention must be paid to the definition used for the loading in the Figure below. Indeed, industrial applications are interested in the amount of carbon dioxide absorbed as a function of the amount of amine used, rather than the number of N atom. This change doesn't alter the ethanolamine curves but moves those of DAP towards abscissa twice as high. It reflects the advantage of diamines which react with twice more CO2 than MEA (ref. section 2.1) ,1 0,01 0,001 α MEA α DAP 0 0,2 0,4 0,6 0,8 1 Loading (mol CO2/ mol amine) MEA 30 wt% 40 C MEA 30 wt% 60 C MEA 30 wt% 80 C DAP 3M 40 C DAP 3M 60 C DAP 3M 80 C Figure 4.7: Comparison between 30 wt% MEA and 3M DAP. Obviously, the achievement of an higher rich loading, defined as the resulting loading at the end of the absorption column which usually operates at 40 C, may lead to a lower requirement in solvent flowrate and therefore in less energy needed at the boiler. However, as explained in the Introduction, the regenerated solution is sent back to the absorber to be used again. Consequently, the parameter influencing the amount of solvent required to reach the desired level of purification is the cyclic capacity Δα, equal to the difference between the rich loading and the lean loading, obtained after the stripping at 120 C. Although lacking equilibrium data at 120 C, it is possible based on our results to have a first estimate of the cyclic capacity of DAP compared to MEA, by looking at the difference between the loading at 40 C and the one at 80 C for a given CO2 partial pressure. Conclusion should ideally be verify thanks to the model or in a further work involving experiments at higher temperatures. For a p co2 of 0.1 kpa, it comes from Figure 4.7 than MEA has a cyclic 40
51 capacity of approximately 0.25 mol CO2/ mol amine ( ), which corresponds to the value given in the literature [56,57], while the cyclic capacity of DAP is about 0.31 mol CO2/ mol amine ( ). Its use would therefore reduce the solvent circulation rate, having positive effects on the energy consumption of the process. 4.2 Modeling results Binary system (H2O-DAP) A preliminary step to the modeling of the ternary DAP-H2O-CO2 system is the determination of binary interaction parameters between water and 1,3-diaminopropane. It will reduce the number of unknown variables during the regression of the complete system, making it slightly less complex. For this purpose, assumption is made that the binary mixture is a non-reactive system, thus only composed of two non-ionic species, and the NRTL model is used for calculating the activity coefficients (ref. section 3.2.2). Equilibrium data (PTxy) resulting from experiments performed in a previous work [47] with an ebulliometer (Appendix) are available for the regression of unknown variables, i.e. a12, b12, a21 and b21, which, as a reminder, represent the temperature evolution of the energy parameters τ12 and τ21. The non randomness factors α 12 and α 21 are fixed at 0.2 as suggested by Chen [45]. The objective function chosen to be optimized is the Average Absolute Relative Deviation, defined by relation 4.1: AARD(%) = 1 N pcalc p exp p exp 100 (4.1) Where N is the number of experimental data, p calc is the value predicted by the model and p exp the experimental value. The regressed binary interaction parameters of the NRTL framework for the DAP-H2O couple are given in Table 4.1. They were obtained with AARD of 1.56 % on total pressure, which is acceptable but nevertheless higher than what can be got with the program for other pairs. Parameters a 12 a 21 b 12 b Legend 1 H2O 2 DAP Table 4.1: Regressed binary NRTL parameters for H 2O-DAP. An important remark is that running the modeling tool several times under the same conditions provides various sets of parameters with similar AARD values. A way to optimize the ternary model is therefore to find the best set to use. The NRTL model prediction results for total pressure are shown in Figure 4.8 that also reports PTxy data from literature [48]. The calculated activity coefficients as a function of the amine content of the solution are given in Figure 4.9. In addition, graphs showing DAP mole fractions in the vapour and liquid phases at different temperatures are available in Appendix. 41
52 (a) 100 C 80 C 70 C Pressure (kpa) x,y (amine) 10 2 (b) 10 1 Pressure (kpa) x,y (amine) 10 C 20 C 30 C 40 C 50 C 60 C 70 C 80 C 90 C Figure 4.8: PTxy diagrams for H 2O-DAP system: NRTL model prediction results and experimental data points from a) Saaed M., 2011 and b) Ahmed B., If we look at the isothermal dependence of total pressure over liquid (bottom curve) and vapour (upper curve) phase, it appears that it decreases in both cases when amine concentration increases, which agrees with physical properties of the compounds telling us that DAP has lower saturation pressure than water. The NRTL model fits the Saaed experimental data pretty well except at the higher mole fractions where under prediction occurs, giving a total AARD of 1.56% (Figure 4.8a). This phenomenon is accentuated when our model is used to fit equilibrium points obtained at lower temperatures in another work 42
53 (Figure 4.8b), and it should therefore be improved in order to give proper results in these cases. Nevertheless, the dropout compared to experimental data arises for concentrations higher than 30 mol% (~ 64 wt%) which is very concentrated considering potential industrial applications. Moreover, the maximum amine content used in this Master's thesis is 37.8 wt%. This discrepancy between the model and the measured values can of course also be noted in the activity coefficients determination. It can be seen in Figure 4.9 that our NRTL model is in good agreement with the data points for the activity coefficients of water, except for amine contents above 0.7, while activity coefficients of DAP are well predicted in the low concentration range before the underestimation occurs. As the three graphs below indicate coefficients evolution at different temperatures, the finding of the weak influence of this parameter on the two curves can be done. γ water γ DAP Saeed, 2011 Figure 4.9: Activity coefficients for H 2O-DAP system: NRTL model prediction results and data points. 43
54 4.2.2 Parameters fitting for the ternary DAP-H2O-CO2 system Since several reactions resulting in ionic species take place when these three components are put together, as it was set out in section 2.1.2, the NRTL framework is no longer appropriate to correctly represent this system's comportment. Its extended version, the E-NRTL model (ref ), is implemented instead. CO2 partial pressure data coming from this work and from Hussain S. [40] (Appendix) were used to regress the interaction parameters as well as the unknown relations for pka temperature dependency (ref. section 3.3.2). Information provided to the program were therefore, for each point collected, the temperature of the experiment, the amine wt% in the solvent, the CO2 pressure of the vapour phase and the loading of the solution in equilibrium. This last one is defined in the Matlab program as the number of mole of carbon dioxide divided by the number of mole of diamine, both being expressed based on the fresh solution. The CO2 content resulting from analytical procedure (ref ) has to be corrected in the following way: CO 2 [mol kg unloaded solution] = CO 2 [mol kg loaded solution] 1 (CO 2 [mol kg loaded solution] 44 (4.2) 1000 ) Where 44 is the molecular weight of carbon dioxide. It is then divided by the amine concentration (mol/kg) of the fresh solvent. No additional data concerning total pressure, physical solubility or heat of reaction were brought into play, because of their low availability in literature. The objective function to be optimized is AARD, defined by equation 4.1. Calculation of activity coefficients for the 12 species present, and thus equilibria prediction, requires knowing 12 binary parameters for molecule-molecule energy interactions, 108 ternary parameters for molecule-salt interactions and the same number for salt-molecule interactions, considering that τ ij = a ij + b ij T where i and j can represent either a compound or a pair of species. 60 non-randomness factors are also needed, assuming that α ij = α ji. Among these, some values were fixed as suggested in the literature [45], in order to facilitate the regression of the other parameters. The non-randomness factors were thereby set at 0.2 for the molecule-molecule and the H2O-ionic pairs interactions, while the remaining ones, i.e. related to interactions between CO2 or DAP and ionic pairs, were set at 0.1. Energy interaction parameters of H2O-ionic pairs, ionic pairs-h2o, CO2/DAP-ionic pairs and ionic pairs-co2/dap were in addition assumed to be independent of the temperature and were fixed equal to the default values used in Aspen Plus (2008), respectively 8, -4, 15 and -8. These considerations are summarized in Table 4.2: α m,m α H2O,ca α CO2/DAP,ca τ H2O,ca τ ca,h2o τ CO2 DAP,ca τ ca,co2 DAP a b (K) a b (K) a b (K) a b (K) Table 4.2: Imposed interaction parameters for the ternary system. 44
55 Where the subscripts m, c and a respectively mean, molecule, cation and anion, ca representing any ionic pair. The binary parameters previously determined for the subsystem DAP-H2O and given in Table 4.1 are also used. Consequently, 200 parameters have to be regressed by the Parfinder program (ref. 3.3). Also taking into account the missing data for chemical equilibria, we understand all the complexity of this modeling. Several steps have therefore been implemented in order to get satisfying results. They are explained here after. Scenario 1: Parameters regression with all experimental data Although this scenario may, a priori, lead to a mistaken model, its realization can provide valuable information about the encountered problems, enabling us to find appropriate solutions. A set of 110 data points, collected at 40 C, 60 C and 80 C over 7.59, 15.18, and wt% DAP aqueous solutions, was therefore used at first to fit the equations parameters. As a result, if some curves were in pretty good agreement with the experimental points, like the ones at 60 C and 80 C for 7.59, and 22.7 wt%, those at 40 C were under predicting and discontinuities occurred for the highest concentration. There were also some unexpected effects in the very low pressure range. The different graphs are given in Appendix. The model thus established was characterized by an AARD of 42 %. In order to improve it, the following modifications were applied: A limited set of values was selected as explained in section Equilibrium points at wt% DAP were removed. The Matlab program was changed so that fewer loading intervals are considered. Parameter D in equation 3.7 giving temperature dependency of the equilibrium constant was set at zero for the unknown relations. The two last mentioned are implemented as ideas resulting from experience with Parfinder to eliminate discontinuities. About the data selection, there is of course not one single correct solution and the choices made could be discussed. Scenario 2: Parameters regression with selected data In a second step, the parameters were fitted again taking into account the above remarks. The remaining 70 data points were well predicted by the new model, except for the 40 C equilibrium curve with the lowest DAP concentration. Indeed, only two experimental points were used for its prediction, what explains its low reliability. Despite the actions carried out, the program still had some difficulties to generate a part of one curve, the 40 C and 22.7 wt% one. However, its shape looks promising as can be seen in Appendix where all the graphs are reported. The model thus established was characterized by an AARD of 36 %. At this point, a possible option to try having a better fitting is to perform the regression one more time, while fixing the parameters for the chemical equilibrium constants equal to the previously determined values, which are given in Table
56 A B C D K 6-7, ,41 0, K 7-4, ,56-1, K 8-5, ,99-0, ln K(mole fraction) = A + B T(K) + C ln T(K) + D T (K) Table 4.3: Regressed parameters for chemical equilibrium constants. Scenario 3: Parameters regression with selected data and fixed pka values As the set of variables to be optimized for the establishment of the model is reduced in this case, better agreement with the 70 experimental data used was expected. This was verify by the AARD of the resulting regression, equal to 33.5 %. The accuracy of the fitting is also reflected by Figure 4.10, showing the parity plot between experimental CO2 partial pressures and model prediction results. It is concluded that the model can broadly represent the vapourliquid equilibria of the tested DAP solutions, without being very accurate. However, this could be related to measurement errors as experimental points appear scattered, especially in the high loading area This Work Saddam Hussain, 2012 [kpa] Calc. P CO Exp. P CO2 [kpa] Figure 4.10: Parity plot between experimental and model predicted CO 2 partial pressures. The regressed binary and ternary interaction parameters are given in Table 4.4. Model predictions for the different vapour-liquid equilibria are shown in Figure 4.11 where they are compared with the measured values. Same conclusion than in the second scenario can be done for the 40 C and 7.59 wt% curve, but the others are in good agreements with the experimental points and the sigmoid clearly peeps out in some cases. Nevertheless, a non-explained discontinuity occurred during the modeling of the equilibrium at 40 C and with a wt% DAP aqueous solvent. One of the weaknesses of our model lies in the absence of experimental data in the low loading range, as they are harder to get. Moreover, it is of course strongly dependent of the quality of the performed measurements, which is difficult to ensure, and of the chosen data selection. 46
57 a b (K) a b (K) a b (K) a1,4-10 0,13404 b1, ,05 a3,4-9 -0,29437 b3, ,234 a5-8,2-2,42883 b5-8,2 503,8715 a1, ,59615 b1, ,511 a3, ,68317 b3, ,7876 a5-8,3 1, b5-8,3 2485,242 a1, ,41481 b1, ,783 a3,4-11 0, b3, ,908 a5-9,1 0, b5-9,1-1756,35 a1,5-7 1,43771 b1, ,1049 a3,4-12 0, b3, ,041 a5-9,2 1, b5-9,2-447,013 a1,5-8 0, b1, ,672 a3,5-7 0, b3, ,519 a5-9,3 1, b5-9,3-30,9197 a1,5-9 -0,40941 b1, ,27 a3,5-8 0, b3, ,1941 a5-10,1-0,44833 b5-10,1 772,7723 a1,5-10 1, b1, ,772 a3,5-9 -2,85969 b3, ,375 a5-10,2-0,4587 b5-10,2-406,201 a1, ,18129 b1, ,729 a3,5-10 2, b3, ,557 a5-10,3-1,53701 b5-10,3 818,1407 a1,5-12 2, b1, ,71 a3,5-11 0, b3, ,03 a5-11,1-0,95238 b5-11,1-898,965 a1,6-7 -1,30015 b1, ,8536 a3, ,42452 b3, ,97 a5-11,2-3,36196 b5-11,2-821,731 a1,6-8 -0,30493 b1, ,9962 a3,6-7 -2,61258 b3, ,4084 a5-11,3 1, b5-11,3-2336,13 a1,6-9 -2,16747 b1, ,505 a3,6-8 0, b3, ,92 a5-12,1 1, b5-12, a1, ,1176 b1, ,254 a3,6-9 -0,05627 b3, ,7494 a5-12,2-2,72067 b5-12,2-485,852 a1, ,62094 b1, ,972 a3, ,93593 b3, ,801 a5-12,3-2,54246 b5-12,3-629,763 a1, ,97062 b1, ,2369 a3,6-11 2, b3, ,901 a6-7,1 0, b6-7,1-2329,78 a2,4-10 0, b2, ,8519 a3,6-12 0, b3, ,9005 a6-7,2-1,22495 b6-7,2 481,0315 a2, ,27615 b2, ,4528 a4-7,3-1,11722 b4-7,3-1270,95 a6-7,3-0,93728 b6-7,3-2076,99 a2,4-12 0, b2, ,5191 a4-8,3 1, b4-8,3-1754,43 a6-8,1 0, b6-8,1-1547,28 a2,5-7 -1,09122 b2, ,348 a4-9,3 0, b4-9,3-2528,53 a6-8,2-1,05809 b6-8,2 3527,679 a2,5-8 -1,70171 b2, ,509 a4-10,1-1,50791 b4-10,1-2520,94 a6-8,3 0, b6-8,3 608,8899 a2,5-9 -2,67054 b2, ,841 a4-10,2 2, b4-10,2 631,9603 a6-9,1-0,86018 b6-9,1-1010,76 a2, ,70544 b2, ,3 a4-10,3 1, b4-10,3 584,5886 a6-9,2 0, b6-9,2 4019,924 a2, ,79226 b2, ,3707 a4-11,1-1,90514 b4-11,1-604,755 a6-9,3 0, b6-9,3 1590,713 a2, ,88746 b2, ,7177 a4-11,2 2, b4-11,2 1656,68 a6-10,1 0,20349 b6-10,1-512,077 a2,6-7 -0,44031 b2, ,3581 a4-11,3-0,9331 b4-11,3 665,3371 a6-10,2-1,16532 b6-10,2-438,614 a2,6-8 -0,05993 b2, ,782 a4-12,1-1,64529 b4-12,1-348,81 a6-10,3 1, b6-10,3 1120,555 a2,6-9 -0,25904 b2,6-9 34,62339 a4-12,2 0, b4-12,2-3173,69 a6-11,1-1,55794 b6-11,1-708,073 a2, ,14763 b2, ,37406 a4-12,3-0,90506 b4-12,3 81,70762 a6-11,2-0,63877 b6-11,2 610,9793 a2, ,46624 b2, ,2421 a5-7,1-2,65772 b5-7,1 279,4634 a6-11,3 1,56592 b6-11,3 75,08191 a2, ,64272 b2, ,22 a5-7,2-1,17077 b5-7,2-230,192 a6-12,1 3,58002 b6-12,1-1020,13 a3,4-7 2, b3, ,3963 a5-7,3 0, b5-7,3-1101,5 a6-12,2-0,199 b6-12,2 167,1587 a3,4-8 -0,28846 b3, ,535 a5-8,1-0,8145 b5-8,1-10,5726 a6-12,3 0, b6-12,3 792,801 a1,2-2,65884 b1,2-1317,68 a2,1-2,12941 b2,1 a2,3-0,27614 b2,3-300,347 a3,2 0, b3,2 Legend 1 H 2O 2 CO 2 3 DAP 4 H 3O + 5 DAPH DAPH 2 7 OH HCO CO 3 10 DAPCOO - 11 DAP(COO - ) 2 12 DAPH + COO - Table 4.4: Regressed binary and ternary parameters for the DAP-CO 2-H 2O system. 47
58 10 2 T = 40 C and 8 % w/w 10 0 Calculated This Work 10 5 T = 40 C and 15 % w/w Calculated Saddam Hussain, 2012 P CO2 [kpa] P CO2 [kpa] Loading [mol CO 2 /mol amine] Loading [mol CO 2 /mol amine] 10 5 T = 40 C and 23 % w/w Calculated This Work 10 2 T= 60 C and 8 % w/w 10 0 Calculated This Work P CO2 [kpa] P CO2 [kpa] Loading [mol CO 2 /mol amine] Loading [mol CO 2 /mol amine] 10 5 T = 60 C and 15 % w/w Calculated Saddam Hussain, T= 80 C and 8 % w/w Calculated This Work P CO2 [kpa] P CO2 [kpa] Loading [mol CO 2 /mol amine] Loading [mol CO 2 /mol amine] 10 5 T = 60 C and 15 % w/w Calculated Saddam Hussain, T= 80 C and 23 % w/w Calculated This Work P CO2 [kpa] P CO2 [kpa] Loading [mol CO 2 /mol amine] Loading [mol CO 2 /mol amine] Figure 4.11: VLE of the DAP-CO 2-H 2O system at different temperatures and DAP concentrations: e-nrtl prediction and experimental data. 48
59 4.2.3 Additional analyzes Extrapolation to all experimental data Once the optimisation of the parameters is completed, it is possible to add extra data in the program and to compare them with the predicted equilibrium at the different temperatures and for the various diamine contents. The following graphs were so drawn using total 110 data points collected in this work and by Hussain [40]. Curves at 100 C and 120 C were extrapolated, but no satisfactory results were obtained in the absence of measured values to guide the model. The given lines were indeed collapsed with the 80 C one and are therefore not represented. 40 C 60 C 80 C This work Saddam Hussain, 2012 Figure 4.12: Comparison between e-nrtl predicted equilibria and all experimental data. Observing Figure 4.12 allows to be critical towards the points that were excluded in order to fit the parameters, and thereby, to think about other data sets that could be used instead to 49
60 improve the developed model. If we look at the first graph, under prediction occurs at 40 C for loadings higher than 0.8 while other points, that weren't used for the fitting, are well predicted. Their removal were consequently maybe not necessary. Another modification that could lead to a better model is the use of the data collected at 60 C for 23 wt% and 38 wt% DAP solutions, in the lowest CO2 pressure range. Indeed, the choice was made to keep only the 60 C points resulting from experiments with 8 wt% and 15 wt% solvents, but it seems that the ones at 38 wt% are in very good agreement with the model, except for the higher loadings, and taking into account some of the 23 wt% data could make the fitting more accurate. Finally, note that the e-nrtl equations correctly predict the measured equilibrium curves for the more concentrated solution, although these experimental values weren't considered for the regression of the parameters. A discrepancy is observed for the loadings higher than 1, but these last points shouldn't be trusted as diaminopropane can't normally be so much loaded when working at atmospheric pressure. Speciation Having a rigorous thermodynamic model able to correctly represent the phase and chemical equilibria of the DAP-CO2-H2O system allows, among other things, the determination of the concentration profile in the liquid phase, where various species are present. It provides useful information about the reactions progression and can help selecting the operating conditions to implement. However, the distribution given by the model should ideally be confirmed by NMR measurements. Figure 4.13 presents the evolution of the liquid phase content according to the loading at 40 C and with a diamine concentration in the solvent of 7.59 wt% Mol fraction of Species [-] [mol CO 2 /mol amine] Legend missing. To be finished. 50
61 Chapter 4: Conclusion Protecting our environment has become for some decades one of the main challenges facing our civilization at the global level. One of the objectives in this context is to stop the important releases of carbon dioxide in our atmosphere, in steady increase for the last century what has led to global warming and climate changes. Indeed, 33.6 Gt of this greenhouse gas were emitted by human activities in 2010, which is 50% more than in 1990 [9]. An interesting solution is to capture the CO2 from the flue gases by a chemical absorption-regeneration process using monoethanolamine as solvent, with a view to store or value it. However, this method in its current application is very energy intensive as about 3.6 GJ are required to recover one ton of CO2. Several research teams are therefore looking for new solvents to implement in order to make this technology more attractive. This work was devoted to a potentially interesting sorbent, the 1,3-diaminopropane, that was described in details and compared to ethanolamine. New experimental data for vapour-liquid equilibrium of CO2 loaded aqueous solution of 1M (7.6 wt%) and 3M (22.7 wt%) diaminopropane are reported, in order to complete the database initiated during previous works [40,47,48]. A low temperature/atmospheric pressure apparatus was used to generate the vapour phase in equilibrium with the loaded solutions at 40 C, 60 C and 80 C. Resulting CO2 partial pressures, within the range [ to 7.87 kpa], were measured with an on-line NDIR photometer, while the alkalinity and the CO2 content of the liquid phase were respectively determined by acid-base titration using sulphuric acid and by the barium chloride precipitation-titration method. A loading range from 0.51 mol CO2/ mol N to 0.15 (80 C) or 0.26 mol CO2/ mol N (40 C, 60 C), was covered. This entire procedure leading to equilibria curves has first been validated by comparing the results obtained for 30 wt% monoethanolamine with those provided in literature. The correctness of the resulting graphs is also ensure by the expected sigmoids that the experimental points are suspected to shape. It can also be noted that the equilibrium curves at higher temperatures appear more "linear", inducing a lower impact of the temperature in the high loadings/partial pressures area, and that no significant influence of the diamine concentration in the solution has been concluded. In addition, it seems in a first estimate that 1,3-diaminopropane would allow a better CO2 absorption compared to MEA, without having a worst cyclic capacity. A thermodynamic model representing the DAP-CO2-H2O system was then developed in the second part of this Master's thesis. This report contains a presentation of the concepts and equations that govern phase and chemical equilibria, like the chemical equilibrium constants or the fugacity and activity coefficients. The determination of these last mentioned requires an equation of state and a solution model, and these are respectively the Peng-Robinson equation and the E-NRTL model that were here implemented. The unknown interaction parameters and equilibrium constants were regressed using vapour-liquid equilibrium experimental data from this work and from literature [40], by means of an in-house Matlab program. In order to reduce 51
62 the complexity of the system to be optimized, the binary interaction parameters between DAP and water were first regressed based on the NRTL framework and the PTxy measurements realized in a previous work [47]. The predicted vapour-liquid equilibria for this combination were in good agreement with the experimental data, with an AARD on total pressure of 1.56%. However, obtaining a good fitting for the complete system was more difficult and involved several intermediate regressions. Finally, the use of a selected set of experimental points allowed, in the best case, to get a model with an AARD on CO2 partial pressure of 33.5%. If this value may seem high, it is actually pretty good considering the complexity of the systems containing diamines. Most of the data were well predicted although some discontinuity problems couldn't be solved. An extrapolation of the model to the equilibrium at 120 C was then attempted, but the results were inconclusive. Further, liquid phase speciation was performed. The accuracy of the developed thermodynamic model is of course strongly dependent of the quality of the vapour-liquid equilibrium measurements, hampered by the rigor required during the experiments. Although everything was done to limit the errors and their impact on the modeling, at least in this work, the absence of possible comparison prevents to categorically exclude the risk. A first way to improve the prediction is to think about a better data selection, based on our last results analysis, and to try having more points collected in the low loading range. Another limitation is the low availability of values for the diaminopropane properties, like the dielectric constant or the chemical equilibrium constants which are difficult to get. The search of the optimal binary interaction parameters may also be performed. Finally, remember that the study of liquid-vapour equilibria is only a first step in the development of new solvents for the carbon dioxide capture, and that other characteristics (degradation, corrosion, toxicity, etc) should be taken into account to say whether or not it could be used. 52
63 References 1. consulted on 16/02/ consulted on 16/02/ Weast R.C., 1986, CRC Handbook of Chemistry and Physics, 67th edition. 4. Bonnard et al., 2005, Dioxyde de carbone: fiche toxicologique, Institut National de Recherche et de Sécurité. 5. Giese A., 2011, Les températures mesurées atteignent des sommets en 2010, Earth Policy Institute. 6. Service de l'observation et des statistiques, 2012, Chiffes clés du climat: France et Monde, Repères consulted on 25/02/ consulted on 25/02/ consulted on 01/03/ consulted on 01/03/ Dubois L. and Thomas D., Traitement des effluents gazeux: techniques de capture du CO2, courses notes, Faculty of Engineering, University of Mons, Mons, Belgium. 12. European Commission, 2007, CO2 capture and storage projects (EUR 22574) consulted on 03/03/ consulted on 03/03/ consulted on 03/03/ Intergovernmental panel on climate change, 2005, Carbon dioxide capture and storage, special report, chapter Brandani et al., 2013, Process simulation of aqueous MEA plants for post-combustion capture from coal-fired power plants, Energy Procedia, 37, Favre et al., 2013, A rigorous optimization method of operating parameters for aminebased CO2 capture processes, Energy Procedia, 37,
64 19. Wei et al., 2013, Amino acid salts for CO2 capture at flue gas temperatures, Ch. Eng. Sc., 107, Kemper et al., 2011, Absorption and regeneration performance of novel reactive amine solvents for post-combustion CO2 capture, Energy Procedia, 4, Hasse et al., 2011, Pilot Plant Experiments for Post Combustion Carbon Dioxide Capture by Reactive Absorption with Novel Solvents, Energy Procedia, 4, Foss, K. B., 2013, Experimental determination of VLE data for the MAPA-H2O-CO2 system and model representation using the e-nrtl framework, MSc Thesis, Norwegian University of Science and Technologies, Trondheim, Norway. 23. Rafiq A., 2012, Vapor Liquid Equilibrium (VLE) in H2O-Amine-CO2 system, MSc Thesis, Norwegian University of Science and Technology, Trondheim, Norway. 24. Hassan N., 2005, Techno-Economic Study of CO2 Capture Process for Cement Plants, MSc thesis, University of Waterloo, Ontario, Canada html, consulted on 21/12/ Descamps C., 2004, Etude de la capture du CO2 par absorption physique dans les systèmes de production d'électricité basés sur la gazéification du charbon intégré à un cycle combiné, PhD thesis, Mines Paristech, Pairs, France. 27. Kothandaraman A., 2010, Carbon dioxide capture by chemical absorption: a solvent comparison study, Massachusetts Institute of Technology, Massachusetts, USA. 28. Dow Ethanolamines, 2003, Monoethanolamine Diethanolamine Triethanolamine, Form No AMS, The Dow Chemical Company. 29. Sigma-Aldrich, 2013 (v 5.2), Material safety data sheet for ethanolamine, form No consulted on 26/04/ Singh et al., 2008, Structure and activity relationships for amine-based CO2 absorbents-ii, Ch. Eng. Research and Design, 87, 2, Sigma-Aldrich, 2013 (v 5.0), Material safety data sheet for 1,3-diaminopropane, form No D consulted on 28/04/
65 34. Ma'mum S. et al., 2006, Selection of new absorbents for carbon dioxide capture, Energy Conservation and Management, 48, 1, Process Analytic Division, BINOS 100 microprocessor-controlled and NDIRanalyzer: operation manual, Rosemount Analytical, Edition 11/ Decroly A., 2013, Traitement des effluents gazeux industriels, PowerPoint, Faculty of Engineering, University of Mons, Mons, Belgium consulted on 05/05/ Chemical process technology department, 2014, Low Pressure VLE apparatus: user guide, Norwegian University of Science and Technology, Trondheim, Norway consulted on 23/05/ Hussain S., 2012, Characterization and Modelling of Vapor Liquid Equilibrium of 1,3- Diaminopropane for CO2 Capture: Using e-nrtl framework, MSc Thesis, Norwegian University of Science and Technology, Trondheim, Norway. 41. De Weireld G. and Jadot R., 2011, Thermodynamique chimique, Course notes, Faculty of Engineering, University of Mons, Mons, Belgium. 42. De Weireld G. and Jadot R., 2012, Compléments de thermodynamique chimique, Course notes, Faculty of Engineering, University of Mons, Mons, Belgium. 43. Colle S., 2006, Etude thermodynamique et cinétique de l absorption du dioxyde de soufre dans des solutions d acide sulfurique de moyennes et fortes concentrations contenant du peroxyde d hydrogène, PhD thesis, Faculty of Engineering, Mons, Belgium. 44. Svendsen et al., 2010, The refined e-nrtl model applied to CO2 H2O alkanolamine systems, Ch. Eng. Sc., 65, 11, Chen et al., 1986, A local composition model for the excess Gibbs energy of aqueous electrolyte systems, AlChE J., 32, 3, D. Pinto and J. Monteiro, 2013, Parfinder v1.0: user's guide, Chemical process technology department, Norwegian University of Science and Technology, Trondheim, Norway. 47. Saeed M., 2011, Vapour-Liquid equilibrium of binary systems, Autumn project, Norwegian University of Science and Technology, Trondheim, Norway. 48. Ahmed B., 2014, Etude thermodynamique des amines et de leurs mélanges: mesures et modélisation, PhD thesis, Abou Bekr Belkaid University, Tlemcen, Algery. 55
66 49. Pividal et al., 1990, Neighbor Effects on the Group Contribution Method: Infinite Dilution Activity Coefficients of Binary Systems Containing Primary Amines and Alcohols, J. Chem. Eng. Data, 35, 1, Sharma et al., 2006, Potentiometric studies on the protonation constants and protonation energies of some diamines in methanol + water mixtures, E-Journal of chemistry, 4, 3, Daniele et al., 1984, Ionic strength dependence of formation constants-v:protonation constants of some nitrogen-containing ligands at different temperatures and ionic strengths, Talanta, 32, 1, Edwards et al., 1978, Vapor Liquid equilibria in multicomponent aqueous solutions of volatile weak electrolytes, AlChE Journal, 24, Aronu et al., 2011, Solubility of CO2 in 15, 30, 45 and 60 mass% MEA from 40 to 120 C and model representation using the extended UNIQUAC framework, J. Chem. Eng. Sc. 66, Jou et al., The solubility of CO2 in a 30 mass percent monoethanolamine solution, Can. J. Chem. Eng. 73, Bandyopadhyay et al., 2010, Vapour liquid equilibria of carbon dioxide in dilute and concentrated aqueous solutions of piperazine at low to high pressure, Fluid Phase Equilibria, 300, Neveux T., 2013, Modélisation et optimisation des procédés de captage du CO2 par absorption chimique, PhD thesis, University of Lorraine, France. 57. Singh P., 2011, Amine based solvent for CO2 absorption: " From molecular structure to process", PhD thesis, University of Twente, The Netherlands. 56


67 Appendices A. Properties of MEA aqueous solutions [28] Pressure = 760 mmhg absolute. 57

68 B. Risk assessment for VLE apparatus 58
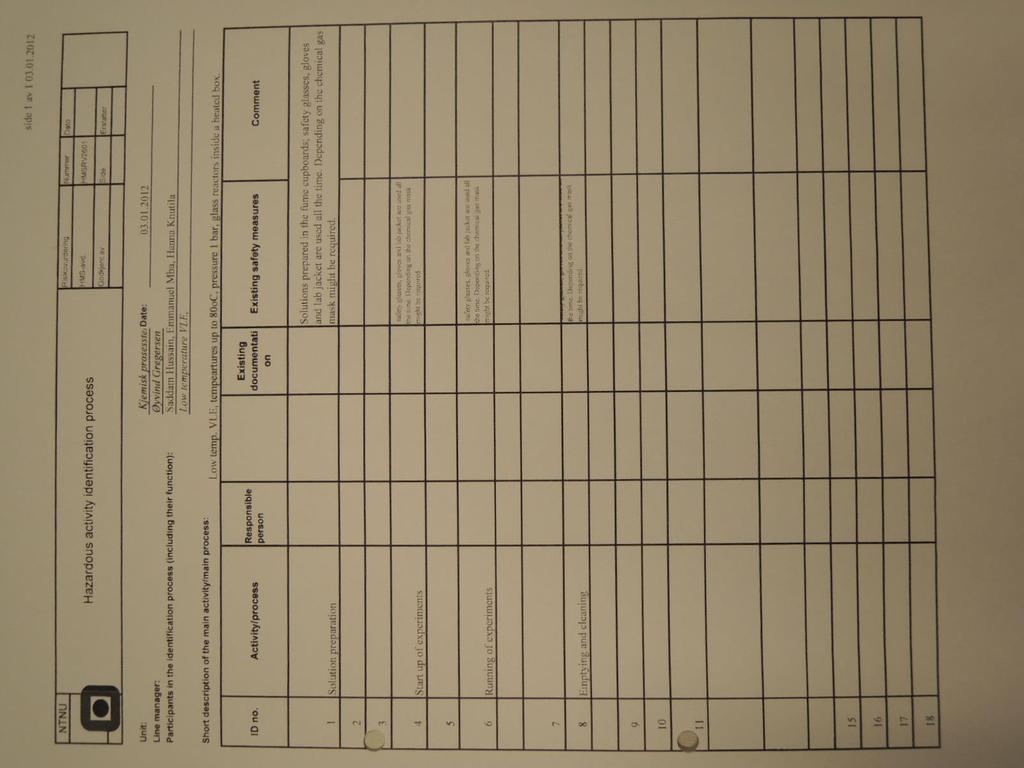
69 59
Carbon dioxide removal processes by alkanolamines in aqueous organic solvents Hamborg, Espen Steinseth
 University of Groningen Carbon dioxide removal processes by alkanolamines in aqueous organic solvents Hamborg, Espen Steinseth IMPORTANT NOTE: You are advised to consult the publisher's version (publisher's
Current status of R&D in post combustion CO 2 capture
 Current status of R&D in post combustion CO 2 capture Kaj Thomsen, Ph.D. Center for Energy Resources Engineering, CERE DTU Chemical Engineering Technical University of Denmark Outline Choice of solvent
A rational approach to amine mixture formulation for CO 2 capture applications. Trondheim CCS Conference - 6 June 14 16, 2011 Graeme Puxty
 A rational approach to amine mixture formulation for CO 2 capture applications Trondheim CCS Conference - 6 June 14 16, 2011 Graeme Puxty The ideal solvent for CO 2 post-combustion capture: Process challenges
Experimental study into carbon dioxide solubility and species distribution in aqueous alkanolamine solutions
 Air Pollution XX 515 Experimental study into carbon dioxide solubility and species distribution in aqueous alkanolamine solutions H. Yamada, T. Higashii, F. A. Chowdhury, K. Goto S. Kazama Research Institute
A NEW SOLVENT FOR CO2 CAPTURE R.
 A NEW SOLVENT FOR CO 2 CAPTURE R. Viscardi, G. Vanga and V. Barbarossa vincenzo.barbarossa@enea.it C.R. Casaccia ENEA; via Anguillarese, 301; 00123 S. M. Galeria-Roma Abstract This experimental study describes
Based on the kinetic molecular theory of gases, which one of the following statements is INCORRECT?
 1 Based on the kinetic molecular theory of gases, which one of the following statements is INCORRECT? A) The collisions between gas molecules are perfectly elastic. B) At absolute zero, the average kinetic
In terms of production, nitric acid is the third most widely produced acid across the world.
 In terms of production, nitric acid is the third most widely produced acid across the world. It has a wide range of uses in agriculture, industry and medicine where it is used as a fertiliser and in the
Available online at ScienceDirect. Energy Procedia 63 (2014 ) GHGT-12
 GHGT-12") Available online at www.sciencedirect.com ScienceDirect Energy Procedia 63 (2014 ) 1854 1862 GHGT-12 Screening tests of new hybrid solvents for the post-combustion CO 2 capture process by chemical absorption
Available online at www.sciencedirect.com ScienceDirect Energy Procedia 63 (2014 ) 1854 1862 GHGT-12 Screening tests of new hybrid solvents for the post-combustion CO 2 capture process by chemical absorption
Edexcel Chemistry Checklist
 Topic 1. Key concepts in chemistry Video: Developing the atomic model Describe how and why the atomic model has changed over time. Describe the difference between the plum-pudding model of the atom and
Development of reactive chemical absorbents at the CSIRO
 Development of reactive chemical absorbents at the CSIRO HiPerCap Workshop, March 25 2015 Graeme Puxty Research Team Leader CSIRO ENERGY FLAGSHIP CSIRO s chemical absorbent research program Concept Kinetics,
Py x P P P. Py x P. sat. dq du PdV. abs Q S. An Innovative Approach in the G U TS PV P P G U TS PV T H U PV H U PV. abs. Py x P. sat.
 E a 1 1 sat sat ln Py x P Py x P K H k Ae R E sat a Py x P 1 1 sat ln K1 R Py x P K H k Ae R 1 CO P H 1 1 abs ln K H H 1/ R Q C 1 1 CO P ln S K H K1 R 1 P H abs H P K1 R CP 1 K1 R 1/ R S Q P 1 E a E du
Module: 7. Lecture: 36
 Module: 7 Lecture: 36 DIMETHYL FORMAMIDE INTRODUCTION Dimethylformamide is an organic compound and denotes as DMF. The name is derived from the fact that it is a derivative of formamide, the amide of formic
AQA Chemistry (Combined Science) Specification Checklists. Name: Teacher:
 Specification Checklists. Name: Teacher:") AQA Chemistry (Combined Science) Specification Checklists Name: Teacher: Paper 1-4.1 Atomic structure and the periodic table 4.1.1 A simple model of the atom, symbols, relative atomic mass, electronic
AQA Chemistry (Combined Science) Specification Checklists Name: Teacher: Paper 1-4.1 Atomic structure and the periodic table 4.1.1 A simple model of the atom, symbols, relative atomic mass, electronic
Module: 7. Lecture: 36
 Module: 7 Lecture: 36 DIMETHYL FORMAMIDE INTRODUCTION Dimethylformamide is an organic compound and denotes as DMF. The name is derived from the fact that it is a derivative of formamide, the amide of formic
Carbon dioxide removal processes by alkanolamines in aqueous organic solvents Hamborg, Espen Steinseth
 University of Groningen Carbon dioxide removal processes by alkanolamines in aqueous organic solvents Hamborg, Espen Steinseth IMPORTANT NOTE: You are advised to consult the publisher's version (publisher's
Atmospheric Analysis Gases. Sampling and analysis of gaseous compounds
 Atmospheric Analysis Gases Sampling and analysis of gaseous compounds Introduction - External environment (ambient air) ; global warming, acid rain, introduction of pollutants, etc - Internal environment
Mass Transfer in a Small Scale Flue Gas Absorber Experimental and Modeling
 Mass Transfer in a Small Scale Flue Gas Absorber Experimental and Modeling P.J.G. Huttenhuis, E.P. van Elk, S. Van Loo, G.F. Versteeg Procede Gas Treating B.V., The Netherlands 11 th MEETING of the INTERNATIONAL
Available online at ScienceDirect. Energy Procedia 63 (2014 ) GHGT USA
 GHGT USA") Available online at www.sciencedirect.com ScienceDirect Energy Procedia 63 (2014 ) 1487 1496 GHGT-12 CO 2 mass transfer and solubility in aqueous primary and secondary amine Le Li a, Gary Rochelle a, *
Available online at www.sciencedirect.com ScienceDirect Energy Procedia 63 (2014 ) 1487 1496 GHGT-12 CO 2 mass transfer and solubility in aqueous primary and secondary amine Le Li a, Gary Rochelle a, *
EXPERIMENT 6 Empirical Formula of a Compound
 EXPERIMENT 6 Empirical Formula of a Compound INTRODUCTION Chemical formulas indicate the composition of compounds. A formula that gives only the simplest ratio of the relative number of atoms in a compound
5 Energy from chemicals
 5 Energy from chemicals Content 5.1 Enthalpy 5.2 Hydrogen fuel cell Learning Outcomes Candidates should be able to: (a) (b) (c) (d) (e) describe the meaning of enthalpy change in terms of exothermic (H
Chapter Objectives. Chapter 9 Energy and Chemistry. Chapter Objectives. Energy Use and the World Economy. Energy Use and the World Economy
 Chapter Objectives Larry Brown Tom Holme www.cengage.com/chemistry/brown Chapter 9 Energy and Chemistry Explain the economic importance of conversions between different forms of energy and the inevitability
Available online at Energy Procedia 1 (2009) (2008) GHGT-9
 (2008) GHGT-9") Available online at www.sciencedirect.com Energy Procedia 1 (2009) (2008) 1257 1264 000 000 Energy Procedia www.elsevier.com/locate/procedia www.elsevier.com/locate/xxx GHGT-9 Solubility of CO 2 in Aqueous
Available online at www.sciencedirect.com Energy Procedia 1 (2009) (2008) 1257 1264 000 000 Energy Procedia www.elsevier.com/locate/procedia www.elsevier.com/locate/xxx GHGT-9 Solubility of CO 2 in Aqueous
Heat of Absorption of CO 2 in Aqueous Solutions of DEEA, MAPA and their Mixture
 Available online at www.sciencedirect.com Energy Procedia 37 (2013 ) 1532 1542 GHGT-11 Heat of Absorption of CO 2 in Aqueous Solutions of DEEA, MAPA and their Mixture Muhammad Waseem Arshad a, Nicolas
Absorption of carbon dioxide into a mixed aqueous solution of diethanolamine and piperazine
 Indian Journal of Chemical Technology Vol. 17, November 2010, pp. 431-435 Absorption of carbon dioxide into a mixed aqueous solution of diethanolamine and piperazine M K Mondal Department of Chemical Engineering
Elements and Their Oxides
 Elements and Their Oxides An oxide is a. Oxides can form when an element reacts with oxygen, often in air. This reaction can be rapid with the release of a great deal of energy, as in the combustion of
EXECUTIVE SUMMARY. especially in last 50 years. Industries, especially power industry, are the large anthropogenic
 EXECUTIVE SUMMARY Introduction The concentration of CO 2 in atmosphere has increased considerably in last 100 years, especially in last 50 years. Industries, especially power industry, are the large anthropogenic
AQA Chemistry Checklist
 Topic 1. Atomic structure Video: Atoms, elements, compounds, mixtures Use the names and symbols of the first 20 elements in the periodic table, the elements in Groups 1 and 7, and other elements in this
Describe in full the colour change at the end-point of this titration. ... (1)
") Q1. (a) A solution of barium hydroxide is often used for the titration of organic acids. A suitable indicator for the titration is thymol blue. Thymol blue is yellow in acid and blue in alkali. In a titration
Q1. (a) A solution of barium hydroxide is often used for the titration of organic acids. A suitable indicator for the titration is thymol blue. Thymol blue is yellow in acid and blue in alkali. In a titration
# Ans Workings / Remarks
 # Ans Workings / Remarks 1 B Atomic mass and temperature affects the rate of diffusion of gas. The lower the atomic mass, the lighter the substance. The higher the temperature, the higher the rate of collision
11B, 11E Temperature and heat are related but not identical.
 Thermochemistry Key Terms thermochemistry heat thermochemical equation calorimeter specific heat molar enthalpy of formation temperature enthalpy change enthalpy of combustion joule enthalpy of reaction
Chapter 11. Liquids and Intermolecular Forces
 Chapter 11 Liquids and Intermolecular Forces States of Matter The three states of matter are 1) Solid Definite shape Definite volume 2) Liquid Indefinite shape Definite volume 3) Gas Indefinite shape Indefinite
Chapter 5. Stoichiometry
 Chapter 5 Stoichiometry Chapter 5 Table of Contents (5-1) Counting by weighing (5-2) Atomic masses (5-3) Learning to solve problems (5-4) The mole (5-5) Molar mass (5-6) Percent composition of compounds
CHEMISTRY 110 EXAM 3 NOVEMER 12, 2012 FORM A
 CHEMISTRY 110 EXAM 3 NOVEMER 12, 2012 FORM A 1. Consider a balloon filled with 5 L of an ideal gas at 20 C. If the temperature of the balloon is increased by 70 C and the external pressure acting on the
Advanced Subsidiary Unit 1: The Core Principles of Chemistry
 Write your name here Surname Other names Edexcel GCE Centre Number Chemistry Advanced Subsidiary Unit 1: The Core Principles of Chemistry Candidate Number Thursday 13 January 2011 Morning Time: 1 hour
Unit 6 Solids, Liquids and Solutions
 Unit 6 Solids, Liquids and Solutions 12-1 Liquids I. Properties of Liquids and the Kinetic Molecular Theory A. Fluids 1. Substances that can flow and therefore take the shape of their container B. Relative
CHEMISTRY HIGHER LEVEL
 *P15* Pre-Leaving Certificate Examination, 2012 Triailscrúdú na hardteistiméireachta, 2012 CHEMISTRY HIGHER LEVEL TIME: 3 HOURS 400 MARKS Answer eight questions in all These must include at least two questions
CHEMISTRY CP Name: Period:
 CHEMISTRY CP Name: Period: CHEMISTRY SPRING FINAL REVIEW SHEET NOTE: Below are concepts that we have covered in class throughout the second semester. Questions are organized by chapter/concept to help
Chemistry 212 MOLAR MASS OF A VOLATILE LIQUID USING THE IDEAL GAS LAW
 Chemistry 212 MOLAR MASS OF A VOLATILE LIQUID USING THE IDEAL GAS LAW To study the Ideal Gas Law. LEARNING OBJECTIVES To determine the molar mass of a volatile liquid. BACKGROUND The most common instrument
Fig. 3.2 on Page 101. Warming. Evidence for CO 2. History of Global Warming-2. Fig. 3.2 Page 101. Drilled cores from ocean floors
 Chemistry in Context: Chapter 3:The Chemistry of Global Warming Practice Problems: All Ch. 3 problems with the blue codes or answers on Page 521. Venus Atmospheric pressure is 90x that of Earth 96% CO
Solubility of carbon dioxide in aqueous solutions of 2-amino-2-ethyl-1,3-propanediol
 Fluid Phase Equilibria 202 (2002) 359 366 Solubility of carbon dioxide in aqueous solutions of 2-amino-2-ethyl-1,3-propanediol Jung-Yeon Park a, Sang Jun Yoon a, Huen Lee a,, Ji-Ho Yoon b, Jae-Goo Shim
Name AP Chemistry / / Chapter 5 Collected AP Exam Free Response Questions Answers
 Name AP Chemistry / / Chapter 5 Collected AP Exam Free Response Questions 1980 2010 - Answers 1982 - #5 (a) From the standpoint of the kinetic-molecular theory, discuss briefly the properties of gas molecules
Water & Solutions Chapter 17 & 18 Assignment & Problem Set
 Water & Solutions Chapter 17 & 18 Assignment & Problem Set Name Warm-Ups (Show your work for credit) Date 1. Date 2. Date 3. Date 4. Date 5. Date 6. Date 7. Date 8. Water & Solutions 2 Vocabulary (know
Chemistry Lab Fairfax High School Invitational January 7, Team Number: High School: Team Members Names:
 Chemistry Lab Fairfax High School Invitational January 7, 2017 Team Number: High School: Team Members Names: Reference Values: Gas Constant, R = 8.314 J mol -1 K -1 Gas Constant, R = 0.08206 L atm mol
ScienceDirect. Impact of heat stable salts on equilibrium CO 2 absorption
 Available online at www.sciencedirect.com ScienceDirect Energy Procedia 63 (2014 ) 1781 1794 GHGT-12 Impact of heat stable salts on equilibrium CO 2 absorption Ugochukwu Edwin Aronu*, Kristin Giske Lauritsen,
Laurea in Scienza dei Materiali Materiali Inorganici Funzionali. Carbon Capture and Storage CCS
 Laurea in Scienza dei Materiali Materiali Inorganici Funzionali Carbon Capture and Storage CCS Prof. Dr. Antonella Glisenti -- Dip. Scienze Chimiche -- Università degli Studi di di Padova Bibliography
The Chemistry of Global Warming
 The Chemistry of Global Warming Venus Atmospheric pressure is 90x that of Earth 96% CO 2 and sulfuric acid clouds Average temperature = 450 C Expected temperature based on solar radiation and distance
EVAPORATION YUSRON SUGIARTO
 EVAPORATION YUSRON SUGIARTO Evaporation: - Factors affecting evaporation - Evaporators - Film evaporators - Single effect and multiple effect evaporators - Mathematical problems on evaporation Principal
Same theme covered in Combined but extra content Extra parts atomic symbols (first 20, Group 1 and Group 7)
") Co-teaching document new ELC Science 5960 and Foundation Level GCSE Combined Science: Trilogy (8464) Chemistry: Component 3 Elements, mixtures and compounds ELC Outcomes Summary of content covered in ELC
Co-teaching document new ELC Science 5960 and Foundation Level GCSE Combined Science: Trilogy (8464) Chemistry: Component 3 Elements, mixtures and compounds ELC Outcomes Summary of content covered in ELC
CH 221 Chapter Four Part II Concept Guide
 CH 221 Chapter Four Part II Concept Guide 1. Solubility Why are some compounds soluble and others insoluble? In solid potassium permanganate, KMnO 4, the potassium ions, which have a charge of +1, are
Atoms, Elements, Atoms, Elements, Compounds and Mixtures. Compounds and Mixtures. Atoms and the Periodic Table. Atoms and the.
 Atoms, Elements, Compounds and Mixtures Explain how fractional distillation can be used to separate a mixture. 1 Atoms, Elements, Compounds and Mixtures Fractional distillation is used to separate components
Steady-State Molecular Diffusion
 Steady-State Molecular Diffusion This part is an application to the general differential equation of mass transfer. The objective is to solve the differential equation of mass transfer under steady state
Test Booklet. Subject: SC, Grade: HS CST High School Chemistry Part 2. Student name:
 Test Booklet Subject: SC, Grade: HS Student name: Author: California District: California Released Tests Printed: Thursday January 16, 2014 1 Theoretically, when an ideal gas in a closed container cools,
GCE O' LEVEL PURE CHEMISTRY (5073/02) Suggested Answers for 2016 O Level Pure Chemistry Paper 2
 Suggested Answers for 2016 O Level Pure Chemistry Paper 2") Section A (50 M) Aa) trend The number of electron shell increases The number of valence electrons increases Proton number increases There is a change in character from metallic to non-metallic Only true
Section A (50 M) Aa) trend The number of electron shell increases The number of valence electrons increases Proton number increases There is a change in character from metallic to non-metallic Only true
OCR Chemistry Checklist
 Topic 1. Particles Video: The Particle Model Describe the main features of the particle model in terms of states of matter. Explain in terms of the particle model the distinction between physical changes
Assessment Schedule 2015 Chemistry: Demonstrate understanding of aspects of carbon chemistry (90932)
") NCEA Level 1 Chemistry (90932) 2015 page 1 of 6 Assessment Schedule 2015 Chemistry: Demonstrate understanding of aspects of carbon chemistry (90932) Evidence Statement Q Evidence Achievement Merit Excellence
NCEA Level 1 Chemistry (90932) 2015 page 1 of 6 Assessment Schedule 2015 Chemistry: Demonstrate understanding of aspects of carbon chemistry (90932) Evidence Statement Q Evidence Achievement Merit Excellence
THE UNITED REPUBLIC OF TANZANIA NATIONAL EXAMINATIONS COUNCIL CERTIFICATE OF SECONDARY EDUCATION EXAMINATION
 THE UNITED REPUBLIC OF TANZANIA NATIONAL EXAMINATIONS COUNCIL CERTIFICATE OF SECONDARY EDUCATION EXAMINATION 032/1 CHEMISTRY 1 (For Both School and Private Candidates) TIME: 3 Hours Tuesday afternoon 09/10/2007
Figure 4-1: Pretreatment schematic
 GAS TREATMENT The pretreatment process consists of four main stages. First, CO 2 and H 2 S removal stage which is constructed to assure that CO 2 would not exceed 50 ppm in the natural gas feed. If the
THERMOCHEMISTRY & DEFINITIONS
 THERMOCHEMISTRY & DEFINITIONS Thermochemistry is the study of the study of relationships between chemistry and energy. All chemical changes and many physical changes involve exchange of energy with the
Physicochemical Processes
 Lecture 3 Physicochemical Processes Physicochemical Processes Air stripping Carbon adsorption Steam stripping Chemical oxidation Supercritical fluids Membrane processes 1 1. Air Stripping A mass transfer
Adsorption Processes. Ali Ahmadpour Chemical Eng. Dept. Ferdowsi University of Mashhad
 Adsorption Processes Ali Ahmadpour Chemical Eng. Dept. Ferdowsi University of Mashhad Contents Introduction Principles of adsorption Types of adsorption Definitions Brief history Adsorption isotherms Mechanism
Simulation of gas sweetening process using new formulated amine solutions by developed package and HYSYS
 Simulation of gas sweetening process using new formulated amine solutions by developed package and Mohammad Irani 1 ١, Reza Dorosti 2, Akbar Zamaniyan 1, Marziye Zare 1- Research Institute of Petroleum
Systems Engineering Spring Group Project #1: Process Flowsheeting Calculations for Acetic Anhydride Plant. Date: 2/25/00 Due: 3/3/00
 10.551 Systems Engineering Spring 2000 Group Project #1: Process Flowsheeting Calculations for Acetic Anhydride Plant Date: 2/25/00 Due: 3/3/00 c Paul I. Barton, 14th February 2000 At our Nowhere City
Lecture 25: Manufacture of Maleic Anhydride and DDT
 Lecture 25: Manufacture of Maleic Anhydride and DDT 25.1 Introduction - In this last lecture for the petrochemicals module, we demonstrate the process technology for Maleic anhydride and DDT. - Maleic
FTIR measurement of NH 3, HCN, SO 2, H 2 S and COS in pulverized lignite oxy-fuel flames Daniel Fleig, Stefan Hjärtstam and Daniel Kühnemuth
 FTIR measurement of NH 3, HCN, SO 2, H 2 S and COS in pulverized lignite oxy-fuel flames Daniel Fleig, Stefan Hjärtstam and Daniel Kühnemuth Abstract Nitrogen and sulphur compounds are investigated in
IB Chemistry Solutions Gasses and Energy
 Solutions A solution is a homogeneous mixture it looks like one substance. An aqueous solution will be a clear mixture with only one visible phase. Be careful with the definitions of clear and colourless.
Name: Regents Review Quiz #1 2016
 Name: Regents Review Quiz #1 2016 1. Which two particle diagrams represent mixtures of diatomic elements? A) A and B B) A and C C) B and C D) B and D 2. At STP, which physical property of aluminum always
EXPERIMENT 7 Reaction Stoichiometry and Percent Yield
 EXPERIMENT 7 Reaction Stoichiometry and Percent Yield INTRODUCTION Stoichiometry calculations are about calculating the amounts of substances that react and form in a chemical reaction. The word stoichiometry
NCERT. [H O] Since water is in large excess, its concentration can be assumed to be constant and combining it with K provides a new constant K w
![NCERT. [H O] Since water is in large excess, its concentration can be assumed to be constant and combining it with K provides a new constant K w](/thumbs/74/71110555.jpg "NCERT. [H O] Since water is in large excess, its concentration can be assumed to be constant and combining it with K provides a new constant K w") UNIT-5 PH AND PH CHANGE IN AQUEOUS SOLUTIONS YOU have already performed experiments on dynamic equilibrium between unionised salt and the ions produced by it on dissolving in a solvent. In this unit we
UNIT-5 PH AND PH CHANGE IN AQUEOUS SOLUTIONS YOU have already performed experiments on dynamic equilibrium between unionised salt and the ions produced by it on dissolving in a solvent. In this unit we
4. a) Complete the nuclear equation below. (1mk) b) 37 37
 Complete the nuclear equation below. (1mk) b) 37 37") KCSE 2006 CHEMISTRY PAPER 1 QUESTIONS 1. (a) What is meant by isomerism? (1mark) (b) Draw and name two isomers of butane. (2 marks) 2. The diagram below represent a set-up that was used to show that part
KCSE 2006 CHEMISTRY PAPER 1 QUESTIONS 1. (a) What is meant by isomerism? (1mark) (b) Draw and name two isomers of butane. (2 marks) 2. The diagram below represent a set-up that was used to show that part
Class XI Chapter 1 Some Basic Concepts of Chemistry Chemistry
 Question 1.1: Calculate the molecular mass of the following: (i) H 2 O (ii) CO 2 (iii) CH 4 (i) H 2 O: The molecular mass of water, H 2 O = (2 Atomic mass of hydrogen) + (1 Atomic mass of oxygen) = [2(1.0084)
Lesson Plans Chapter 15: Solutions & Solution Chemistry
 Lesson Plans Chapter 15: Solutions & Solution Chemistry I. Solutions a. A solution is simply a homogeneous mixture i. Homogeneous: same throughout (it does not mean one ) ex: water + sugar, air, alloys,
Review Topic 8: Phases of Matter and Mixtures
 Name: Score: 24 / 24 points (100%) Review Topic 8: Phases of Matter and Mixtures Multiple Choice Identify the choice that best completes the statement or answers the question. C 1. Soda water is a solution
Chapter 11 Properties of Solutions
 Chapter 11 Properties of Solutions Solutions Homogeneous mixtures of two or more substances Composition is uniform throughout the sample No chemical reaction between the components of the mixture Solvents
HONORS CHEMISTRY Putting It All Together II
 NAME: SECTION: HONORS CHEMISTRY Putting It All Together II Calculations in Chemistry It s time to pull out your calculators! In the first review sheet, you were able to write formulas of compounds when
6. Place the following elements in order of increasing atomic radii: Mg, Na, Rb, Cl.
 CH141 Practice Problems/Practice Final Exam Page 1 of 12 Name: 1. What is the SO 4 2- concentration of a solution prepared by dissolving 3.00 g of Na 2 SO 4 in 1.00 L of water? 2. What is the hybridization
Chemistry 1B Experiment 17 89
 Chemistry 1B Experiment 17 89 17 Thermodynamics of Borax Solubility Introduction In this experiment, you will determine the values of H and S for the reaction which occurs when borax (sodium tetraborate
Classifying Chemical Reactions: Lab Directions
 Classifying Chemical Reactions: Lab Directions Please Return Background: The power of chemical reactions to transform our lives is visible all around us in our homes, in our cars, even in our bodies. Chemists
NAME Student ID No. UNIVERSITY OF VICTORIA. CHEMISTRY 102 Term Test I February 4, 2011
 NAME Student ID No. Section (circle one): A01 (Dr. Lipson) A02 (Dr. Briggs) A03 (Dr. Brolo) UNIVERSITY OF VICTORIA Version A CHEMISTRY 102 Term Test I February 4, 2011 Version A This test has two parts:
Cherry Hill Tuition A Level Chemistry OCR (A) Paper 9 THIS IS A NEW SPECIFICATION
 Paper 9 THIS IS A NEW SPECIFICATION") THIS IS A NEW SPECIFICATION ADVANCED SUBSIDIARY GCE CHEMISTRY A Chains, Energy and Resources F322 * OCE / 1 9 2 3 4* Candidates answer on the Question Paper OCR Supplied Materials: Data Sheet for Chemistry
THIS IS A NEW SPECIFICATION ADVANCED SUBSIDIARY GCE CHEMISTRY A Chains, Energy and Resources F322 * OCE / 1 9 2 3 4* Candidates answer on the Question Paper OCR Supplied Materials: Data Sheet for Chemistry
Exampro GCSE Chemistry
 Exampro GCSE Chemistry C Chapter 4 Higher Name: Class: Author: Date: Time: 59 Marks: 59 Comments: Page of 0 Q. The picture shows a lump of phosphate rock. Rob Lavinsky, irocks.com CC-BY-SA-3.0 [CC-BY-SA-3.0],
Chapter 6. Types of Chemical Reactions and Solution Stoichiometry
 Chapter 6 Types of Chemical Reactions and Solution Stoichiometry Chapter 6 Table of Contents (6.1) (6.2) (6.3) (6.4) (6.5) (6.6) (6.7) (6.8) Water, the common solvent The nature of aqueous solutions: Strong
Chemistry Final Exam Sample Items
 Chemistry Final Exam Sample Items 1. Which best describes the current atomic theory? a. Atoms consist of electrons circling in definite orbits around a positive nucleus. b. Atoms are composed of electrons
Stoichiometry: Chemical Calculations. Chapter 3-4
 Chapters 3-4 Stoichiometry: Chemical Calculations Slide 1 of 48 Molecular Masses And Formula Masses Molecular Masses Molecular mass is the sum of the masses of the atoms represented in a molecular formula.
3.2 Alkanes. Refining crude oil. N Goalby chemrevise.org 40 C 110 C 180 C. 250 C fuel oil 300 C 340 C. Fractional Distillation: Industrially
 3.2 Alkanes Refining crude oil Fractional Distillation: Industrially Petroleum is a mixture consisting mainly of alkane hydrocarbons Petroleum fraction: mixture of hydrocarbons with a similar chain length
Lower Sixth Chemistry. Sample Entrance Examination
 Lower Sixth Chemistry Sample Entrance Examination Time allowed: 60 minutes Name: Total : 60 Marks INSTRUCTIONS : Answer all questions Answers should be written in the spaces provided Dictionaries or reference
Carbon dioxide removal by alkanolamines in aqueous organic solvents Hamborg, Espen S.; Derks, Peter W.J.; Elk, Edwin P. van; Versteeg, Geert F.
 University of Groningen Carbon dioxide removal by alkanolamines in aqueous organic solvents Hamborg, Espen S.; Derks, Peter W.J.; Elk, Edwin P. van; Versteeg, Geert F. Published in: Energy Procedia DOI:
2. If the volume of a container holding a gas is reduced, what will happen to the presure within the container?
 1. Which gas law states that the volume of a fixed mass of a gas is directly proportional to its Kelvin temperature if the pressure is kept constant? A. Boyle s law B. Charles law C. Dalton s law D. Gay-Lussac
Synthesis of Benzoic Acid
 E x p e r i m e n t 5 Synthesis of Benzoic Acid Objectives To use the Grignard reagent in a water free environment. To react the Grignard reagent with dry ice, CO 2(s). To assess the purity of the product
(Refer Slide Time: 00:00:43 min) Welcome back in the last few lectures we discussed compression refrigeration systems.
 Welcome back in the last few lectures we discussed compression refrigeration systems.") Refrigeration and Air Conditioning Prof. M. Ramgopal Department of Mechanical Engineering Indian Institute of Technology, Kharagpur Lecture No. # 14 Vapour Absorption Refrigeration Systems (Refer Slide
Refrigeration and Air Conditioning Prof. M. Ramgopal Department of Mechanical Engineering Indian Institute of Technology, Kharagpur Lecture No. # 14 Vapour Absorption Refrigeration Systems (Refer Slide
Chapter 8 Thermochemistry: Chemical Energy. Chemical Thermodynamics
 Chapter 8 Thermochemistry: Chemical Energy Chapter 8 1 Chemical Thermodynamics Chemical Thermodynamics is the study of the energetics of a chemical reaction. Thermodynamics deals with the absorption or
F325: Equilibria, Energetics and Elements How Far?
 F325: Equilibria, Energetics and Elements 5.1.2 How Far? 100 marks 1. Syngas is a mixture of carbon monoxide and hydrogen gases, used as a feedstock for the manufacture of methanol. A dynamic equilibrium
Organic Chemistry. Alkanes are hydrocarbons in which the carbon atoms are joined by single covalent bonds.
 Organic Chemistry Organic compounds: The branch of chemistry which deals with the study of carbon compounds is called organic chemistry. Catenation: The carbon atom has a property to undergo self linking
Chemistry 20 Unit 3A Solutions FITB Notes. Topic A Classification of Solutions
 Chemistry 20 Unit 3A Solutions FITB Notes General Outcome: Topic A Classification of Solutions Matter is a substance with and A substance is a type of matter with one definite formula (elements, compounds)
AP Chapter 5: Gases Name
 AP Chapter 5: Gases Name Warm-Ups (Show your work for credit) Date 1. Date 2. Date 3. Date 4. Date 5. Date 6. Date 7. Date 8. AP Chapter 5: Gases 2 Warm-Ups (Show your work for credit) Date 1. Date 2.
Seymour Public Schools Curriculum
 Chemistry Curriculum The intent of this unit is to demonstrate the proper use of lab materials and equipment. Also, correctly answer safety questions, demonstrate safe working practices in the lab as described
Exercise 2-4. Titration of a Buffer Solution EXERCISE OBJECTIVES
 Exercise 2-4 Titration of a Buffer Solution EXERCISE OBJECTIVES To define the terms buffer solution and buffer capacity; To titrate a buffer solution with a weak acid solution; To plot a graph using the
Name Class Date. As you read Lesson 17.1, use the cause and effect chart below. Complete the chart with the terms system and surroundings.
 Name Class Date Thermochemistry 17.1 The Flow of Energy As you read Lesson 17.1, use the cause and effect chart below. Complete the chart with the terms system and surroundings. Process Cause Effect endothermic
Studies of N,N-Dibutyltrimethylenediamine and N, N, N Triethylenediamine for CO 2
 Pertanika J. Sci. & Technol. 16 (1): 61-71 (2008) ISSN: 0128-7680 Universiti Putra Malaysia Press Studies of N,N-Dibutyltrimethylenediamine and N, N, N Triethylenediamine for CO 2 Absorption and Desorption
Essential Knowledge. 2.A.3 Organisms must exchange matter with the environment to grow, reproduce and maintain organization
 Ch3: Water Essential Knowledge 2.A.3 Organisms must exchange matter with the environment to grow, reproduce and maintain organization a. Molecules and atoms from the environment are necessary to build
London Examinations IGCSE
 Centre No. Candidate No. Paper Reference 4 3 3 5 2 H Paper Reference(s) 4335/2H London Examinations IGCSE Chemistry Paper 2H Higher Tier Wednesday 21 May 2008 Afternoon Time: 2 hours Surname Signature