Nontarget Analysis via LC-QTOF-MS to Assess the Release of Organic Substances from Polyurethane Coating
|
|
|
- Morris Hudson
- 5 years ago
- Views:
Transcription
1 Nontarget Analysis via LC-QTOF-MS to Assess the Release of Organic Substances from Polyurethane Coating Agnessa Luft, Kathrin Bröder, Uwe Kunkel,#, Manoj Schulz, Christian Dietrich, Roland Baier, Peter Heininger and Thomas A. Ternes, * Federal Institute of Hydrology (BfG), Koblenz, Germany # present address: Bavarian Environment Agency, Augsburg, Germany Federal Waterways Engineering and Research Institute, Karlsruhe, Germany * Corresponding author phone: ; fax: ; ternes@bafg.de Content Chemicals and Standards... 3 Test Materials... 4 HRMS Analysis via LC-QTOF-MS... 5 Quantification of the Identified Substances verified by Authentic Reference Standards... 6 Data Analysis of Qualitative Screening... 8 Bacterial Screening Toxicity Test... 9 Leaching Experiments DOC, TNb and LC-QTOF-MS Results...10 Identification...19 References...29 Pages: 29 Tables: 7 Figures: 12 Tables Table S1. Seven reference standards used in the study Table S2. Organic substances in the used 1C-PU coating according to manufacturer declaration Table S3. MS Parameters for measurements in positive and negative ESI mode Table S4. Overview of the quantified substances with their mass, limit of quantification (LOQ) and results of the preliminary environmental analysis of three surface waters. Rhine and Mosel samples are composite samples of 3 months (M). Teltowkanal samples are grab samples Table S5. Parameter for peak extraction and alignment (MarkerView ) Table S6. Parameter for gradient separation used a mobile phase consisting of methanol, ethyl acetate and n- hexane Table S7. Substances detected in leachates summarized with their retention time, mass, intensity, fragments, and group. The table consists of masses belonging to groups A E, including p-toluenesulfonic acid (1 30), masses without specific group assignment (31 41), masses with insufficient MS 2 spectra (42 47), and mass without MS 2 spectra (48). The masses are sorted by intensity (pos.) within the group. Chemical structures verified by reference standard are highlighted in gray Figures Figure S1. Leaching experiment of 1C-PU coating with varying hardening and leaching duration. Sum of peak intensities (I) with and (II) without adducts and isotopes and number of peaks (III) with and (IV) without adducts S1
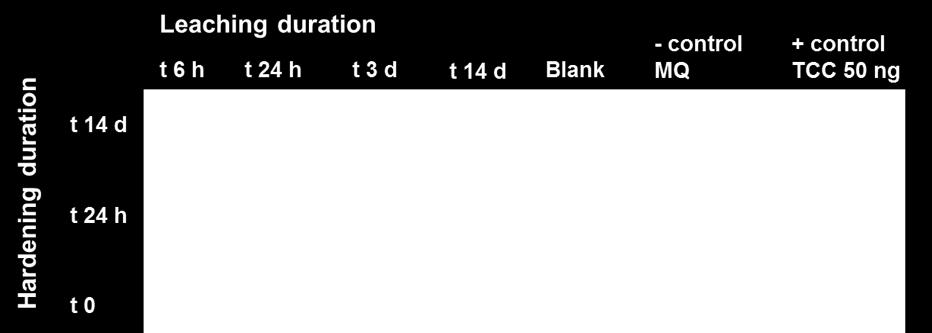
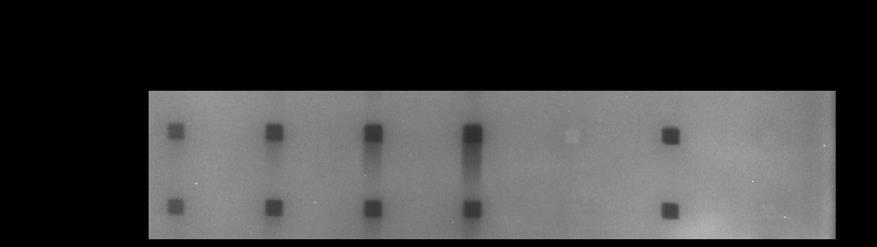
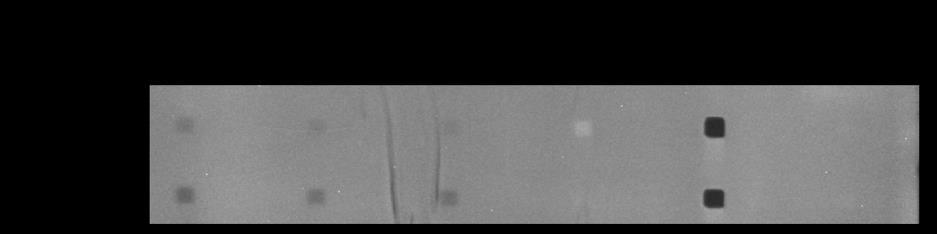
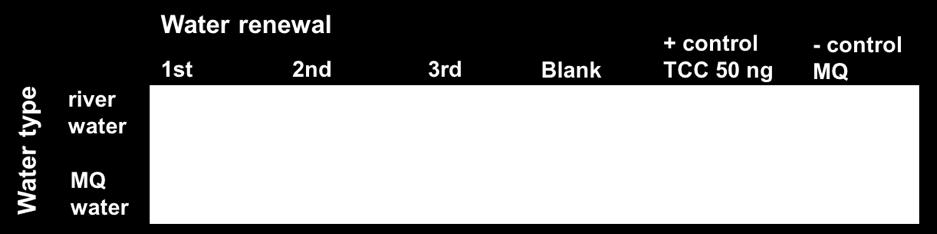
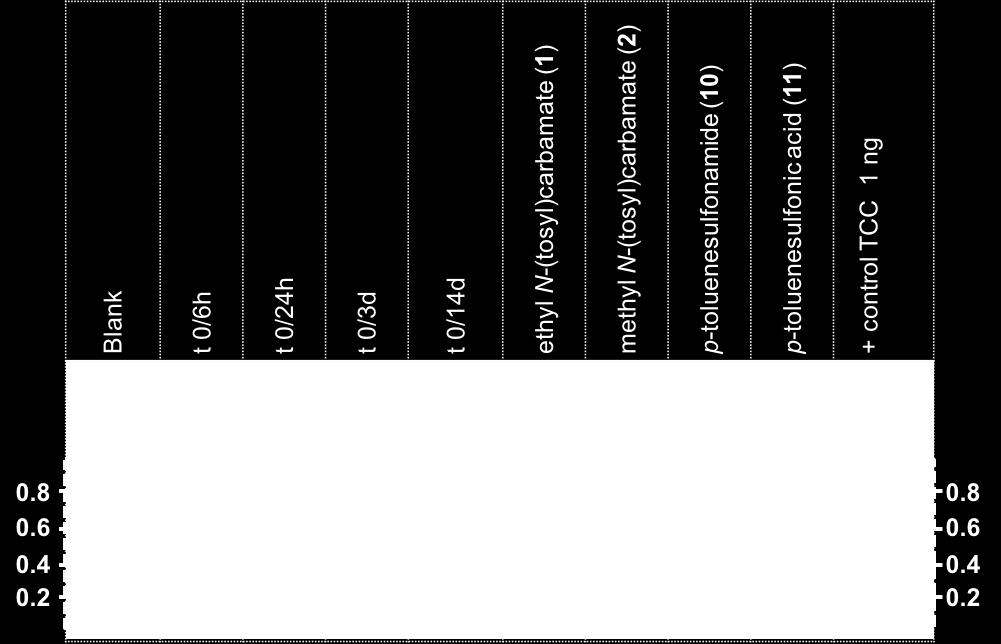
2 and isotopes. MQ water was used as leaching water. Analysis was performed in the positive ionization mode using LC-QTOF-MS. The statistical errors of the measurements are given as 95% confidence intervals (n = 3). 10 Figure S2. TNb in samples of leachate from the leaching experiment with varying polymer hardening (t= 0, 24 h and 14 d) and leaching duration. MQ water was used as leaching water Figure S3. Peak intensities of masses belonging to groups A E in leachate samples from the leaching experiment with varying polymer hardening (t = 0, 24 h and 14 d). MQ water was used as leaching water. Analyses were performed in the positive ionization mode using LC-QTOF-MS (only No. 11 was measured in negative ionization mode). The statistical errors of the measurements are given as standard deviation (n = 3). Masses obtained by MarkerView. t R is given in min Figure S4. (I) Sum of peak intensities, (II) DOC, (III) sum of peak numbers and (IV) TNb in leachate samples from the leaching experiment with varying leaching water, MQ and river water (RW). The polymer hardening duration was 24 h. For (I) and (III), analyses were performed in the positive ionization mode using LC-QTOF- MS Figure S5. Peak intensities of masses belonging to groups A E in leachate samples from the leaching experiment with varying leaching water, MQ and river water. The polymer hardening duration was 24 h. Analyses were performed in the positive ionization mode using LC-QTOF-MS. Masses obtained by MarkerView. t R is given in min Figure S6. (I) Sum of peak intensities [%] after repetitive water renewals compared to the peak intensities prior to any water renewals. The same comparison using (II) DOC [%], (III) number of peaks [%] and (IV) TNb [%]. Polymer hardening duration was 24 h. Leaching duration before water renewals was 14 d. Leaching duration after each water renewal was 24 h. MQ and river water (RW) were used as leaching water. For (I) and (III), analyses were performed in the positive ionization mode using LC-QTOF-MS Figure S7. Final peaks (after subtraction steps) were detected in leachates from leaching experiment I. Peak intensities resulted from hardening duration t = 0 (direct water addition after final material preparation) and leaching duration t = 14 d. Analyses were performed in the positive and negative ionization mode using LC- QTOF-MS. The arrow indicates the one peak that was only visible in negative ionization mode Figure S8. Examples of one of the numerous possible structural composition of two of the declared prepolymers Figure S9. Chemical structures of the first three substances suggested by MetFrag for measured MS 2 spectrum in positive ionization mode Figure S10. MS 2 spectra of identified substances of (I) N-(tosyl)carbamate, (II) p-toluenesulfonamide, (III) p- toluenesulfonic acid, (IV) 4,4 -MDI, (V) TDI, and (VI) [C 2 H 4 O] n derivatives. Intensities are on a different scale from PeakView due to data conversion to mzml (open format) Figure S11. (I) Relative amounts (sum of peak intensities) of the five characterized groups and of the peaks without any structure proposal in total. (II VI) In addition, the relative amount of substances within the groups A E. The sum of peak intensities was formed by summarized the peak intensities over all leaching parameters (leaching duration and hardening). Substances that were identified by reference standard are highlighted in gray. t R is given in min Figure S12. Luminescent bacteria inhibition test with Aliivibrio fischeri of leachates from leaching experiments (I) with varying polymer hardening duration, (II) with varying water types and (III) with water renewal. Hardening duration was set to 24 h in (II). (IV) Gradient separation step with leachates from leaching experiments with varying hardening duration and standards. Only MQ was used as leaching water in (I, IV). Dark spots indicate toxicity to Aliivibrio fischeri. The darker the spot, the higher the degree of toxicity. Of all samples, an amount of 10 µl was sprayed on the TLC plate using an automatic TLC sampler. After an exposure time of 10 min the detection was performed with the TLC Visualizer S2
3 Chemicals and Standards Stock solutions of reference standards (Table S1) with concentration of 10 mg L -1 were prepared in methanol. Further dilution steps were done to prepare final reference standard solutions to a concentration of 1 µg L -1, 10 µg L -1 and 1000 µg L -1 for calibration. To compare the reference standards with analytes from leachate samples, ultrapure water (MQ) was also used as solvent to avoid any negative effects on the chromatography. The stock solutions were stored in the freezer at 20 C. The diluted standard solutions were stored in the dark at 4 C. Table S1. Seven reference standards used in the study. CAS Substance Molecular weight Molecular Formula - Ethyl N-(3-amino-2-methylphenyl)carbamate C 10 H 14 N 2 O Ethyl N-[5-(ethoxycarbonylamino)-2-methylphenyl]carbamate C 13 H 18 N 2 O Ethyl N-(tosyl)carbamate C 10 H 13 NO 4 S Methyl N-(tosyl)carbamate C 9 H 11 NO 4 S p-toluenesulfonamide C 7 H 9 NO 2 S p-toluenesulfonic acid C 7 H 8 SO Diethyl 4,4'-methylenebis(N-phenylcarbamate) C 19 H 22 N 2 O 4 S3


4 Test Materials Table S2. Organic substances in the used 1C-PU coating according to manufacturer declaration. S4
5 HRMS Analysis via LC-QTOF-MS MQ water with 0.1% formic acid was used as mobile phase A and acetonitrile with 0.1% formic acid as mobile phase B. The gradient of mobile phase A was as follows: start with 98%, after 3 min decrease to 2% within 15 min, kept isocratic for 6 min, returned to the initial conditions (98%) within 0.5 min which was held for the last 5.5 min. The total run time was 30 min. The flow rate was adjusted to 200 µl min -1 and the column oven temperature to 25 C. The injection volume of the sample was 10 µl. A Luna 3 µm C18 column (150 x 2 mm, 3 µm; Phenomenex, Aschaffenburg, Germany) was used for chromatographic separation. MS was performed in full scan TOF-MS and MS/MS mode (high resolution) with information dependent acquisition (IDA) experiments (product ion). The resolution of measurements was 35,000 at m/z = 400 and the mass accuracy below 5 ppm. Further important MS parameters for measurements in positive and negative ESI mode are presented in Table S3. Table S3. MS Parameters for measurements in positive and negative ESI mode. Parameter positive negative m/z range m/z range for IDA # of IDA experiments / spectra 8 8 Curtain gas / psi Ion source gas 1 / psi Ion source gas 2 / psi IonSpray voltage floating / V Temperature / C Collision energy for IDA / ev Declustering potential / V An automated external calibration system (Calibrant Delivery System, CDS) was used for mass calibration of the mass spectrometer to maintain the mass accuracy during the batch S5
6 measurements. This was performed by using an APCI calibration solution (positive and negative polarity solutions). The TOF was calibrated every 2.5 h during the batch measurement in an air-conditioned room at 24 C ± 1 C. When measuring the samples of the first leaching experiment, the samples were injected in triplicate, for subsequent samples no repeat injections were used. Quantification of the Identified Substances verified by Authentic Reference Standards An external calibration with 17 calibration points ( µg L -1 ) was used. The limit of quantification (LOQ) was defined as the lowest point in the calibration curve with a signal to noise ratio (S/N) of at least 10. Leachate samples were used for analysis, undiluted as well as diluted (1:10, 1:100). S6
7 Table S4. Overview of the quantified substances with their mass, limit of quantification (LOQ) and results of the preliminary environmental analysis of three surface waters. Rhine and Mosel samples are composite samples of 3 months (M). Teltowkanal samples are grab samples. No./ Substance Ionization Group a Mode Mass b [M+H] + or [M H] LOQ [ g L -1 ] Rhine, Koblenz 2016 [ g L -1 ] Surface water M1-3 M7-9 Mosel, Koblenz 2016 [ g L -1 ] M1-3 M7-9 Teltowkanal, Berlin [ g L -1 ] 2016/09/ /09/11 M4-6 M10-12 M4-6 M /09/ /09/12 1 A 2 A 10 B Ethyl N-(tosyl)carbamate pos Methyl N-(tosyl)carbamate pos p-toluenesulfonamide pos < LOQ < LOQ < LOQ < LOQ < LOQ < LOQ < LOQ < LOQ < LOQ < LOQ < LOQ < LOQ < LOQ < LOQ < LOQ < LOQ < LOQ < LOQ < LOQ < LOQ < LOQ < LOQ < LOQ < LOQ < LOQ < LOQ < LOQ < LOQ < LOQ < LOQ < LOQ < LOQ < LOQ < LOQ < LOQ < LOQ 11 p-toluenesulfonic acid neg < LOQ < LOQ < LOQ < LOQ < LOQ < LOQ < LOQ < LOQ 4.8 < LOQ 12 C Diethyl 4,4'-methylenebis(Nphenylcarbamate) pos < LOQ < LOQ < LOQ < LOQ < LOQ < LOQ < LOQ < LOQ < LOQ < LOQ < LOQ < LOQ 16 D Ethyl N-[5-(ethoxycarbonylamino)- 2-methyl-phenyl]carbamate pos < LOQ < LOQ < LOQ < LOQ < LOQ < LOQ < LOQ < LOQ < LOQ < LOQ < LOQ < LOQ 19 D Ethyl N-(3-amino-2- methylphenyl)carbamate pos < LOQ < LOQ < LOQ < LOQ < LOQ < LOQ < LOQ < LOQ < LOQ < LOQ < LOQ < LOQ a SI Table S7, b mass range for extraction of ion chromatograms (EICs) / S7
8 Data Analysis of Qualitative Screening MS data acquisition was controlled with Analyst TF software (SCIEX). Data were analyzed using MarkerView 1.2.1, MultiQuant 2.1 and PeakView software (SCIEX). With the MarkerView software the data of all samples measured in one batch were analyzed and presented in lists as so called features consisting of extracted peaks with their respective mass and retention time. Parameters for peak extraction (see Table S5) were set to obtain these data lists. MultiQuant software was used to perform automatic peak integration and, if necessary, to integrate manually. Thus, the peak data was completed by peak intensity in addition to mass and retention time obtained from MarkerView data. Peaks which were also detected with similar intensity in control samples (the ratio of peak intensity of sample and control sample less than 10) were deleted. This was done to eliminate peaks originating from the test system. The programs R and Tinn-R Editor in combination with the software R package nontarget 1.5 (Eawag, Dübendorf, Switzerland) were used to detect, filter and determine adduct and isotope relations in the MS data set. The following adducts and isotopes were considered in the positive mode: [M+H] +, [M+Na] +, [M+NH 4 ] +, [M+K] + (adducts) and 13 C, 15 N, 34 S, 37 Cl, 81 Br, 41 K (isotopes). Here, the option was set to allow doubly charged ions. S8
9 Table S5. Parameter for peak extraction and alignment (MarkerView ). Peak extraction and alignment Data to process Alignment Filtering Period 1 Experiment 1 Min. Retention Time Max. Retention Time Subtraction Offset MarkerView 1 min Subtraction Mult. Factor min Noise Threshold 100 Min. Spectral Peak Width Min. RT Peak Width Retention Time Tolerance Mass Tolerance Remove peaks < Use Global Exclusion List 10 scans 80 ppm 4 scans 0.3 min 50 ppm 3 a / - b False Max. Number of Peaks 9000 Perform RT correction False Normalization Perform normalization False a remove peaks for measurements with sample injection in triplicate b no remove peaks for measurements with single sample injection Bacterial Screening Toxicity Test Table S6. Parameter for gradient separation used a mobile phase consisting of methanol, ethyl acetate and n-hexane. Step Methanol [Vol %] Ethyl acetate [Vol %] n-hexane [Vol %] Migration distance [mm] Drying time [min] S9


 with and (II) without")
 without adducts and isotopes.")

10 Leaching Experiments DOC, TNb and LC-QTOF-MS Results LC-QTOF-MS - Subtraction of Adducts and Isotopes. After a blank subtraction step, adducts and isotope ions were additionally subtracted. By doing so, the sum of peak intensities and peak numbers was reduced as shown in the Figure S1. However, the shape of the curves remained the same. (I) (II) (III) (IV) Figure S1. Leaching experiment of 1C-PU coating with varying hardening and leaching duration. Sum of peak intensities (I) with and (II) without adducts and isotopes and number of peaks (III) with and (IV) without adducts and isotopes. MQ water was used as leaching water. Analysis was performed in the positive ionization mode using LC-QTOF-MS. The statistical errors of the measurements are given as 95% confidence intervals (n = 3). S10

 and leaching duration.")
11 I) Leaching Experiment of varying Polymer Hardening and Leaching Duration. Figure S2. TNb in samples of leachate from the leaching experiment with varying polymer hardening (t= 0, 24 h and 14 d) and leaching duration. MQ water was used as leaching water. 1 A 2 A 3 A 4 A 5 A 6 A S11
12 7 B 8 B 9 B 10 B C 13 C 14 C 15 D 16 D 17 D 18 D S12
13 19 D 20 D 21 D 22 D 23 D 24 D 25 E 26 E 27 E 28 E 29 E 30 E Figure S3. Peak intensities of masses belonging to groups A E in leachate samples from the leaching experiment with varying polymer hardening (t = 0, 24 h and 14 d). MQ water was used as leaching water. Analyses were performed in the positive ionization mode using LC-QTOF-MS (only No. 11 was measured in negative ionization mode). The statistical errors of the measurements are given as standard deviation (n = 3). Masses obtained by MarkerView. t R is given in min. S13
.")
.")
.")
 (II) (III) (IV) Figure S4.")
14 II) Leaching Experiment with varying Leaching Water. The measured DOC showed no difference between MQ water and river water. A maximum DOC level of 1.1 g C L -1 was measured in contact with MQ water and river water at a leaching duration of 14 d (Figure S4- II). The measured TNb was different in MQ water and river water at a leaching duration of 14 d, whereby a maximum TNb level of 18.2 mg L -1 in river water and 13.9 mg L -1 in MQ water was measured (Figure S4-IV). At 6 h of leaching duration the sum of peak intensities was comparable in MQ water and river water, while between 24 h and 14 d the sum of peak intensities increased in river water with the leaching duration more than in MQ water (Figure S4-I). The number of peaks remained relatively constant at all leaching durations and was similar in MQ water and river water (Figure S4-III). (I) (II) (III) (IV) Figure S4. (I) Sum of peak intensities, (II) DOC, (III) sum of peak numbers and (IV) TNb in leachate samples from the leaching experiment with varying leaching water, MQ and river water (RW). The polymer hardening duration was 24 h. For (I) and (III), analyses were performed in the positive ionization mode using LC-QTOF-MS. S14
15 Group A Group B Group C S15
16 Group D S16
17 Group E Figure S5. Peak intensities of masses belonging to groups A E in leachate samples from the leaching experiment with varying leaching water, MQ and river water. The polymer hardening duration was 24 h. Analyses were performed in the positive ionization mode using LC-QTOF-MS. Masses obtained by MarkerView. t R is given in min. III) Leaching Experiment with Water Renewal. In MQ water, after the first water renewal, the leached DOC was only 6% of what was released during the first 14 d. This was similar in river water. After the third water renewal, the released DOC was less than 2% of the DOC released after 14 d. As with the initial 14 d leaching period (Figure S4-II), after each water renewal, the DOC in MQ water was relatively comparable with the DOC in river water (Figure S6-II). However, with respect to TNb a difference was observed between the two water types (Figure S6-IV) as was observed after the initial 14 d leaching period (Figure S4- IV). After the first water renewal, the TNb was in MQ water 15% of the value before any water renewal and in river water was 5%. A similar difference was also observed after the subsequent two water renewals (Figure S6). S17
 was still 53% of what was released during the first 14 d.")

 Sum of peak intensities [%] after repetitive water renewals compared to the peak intensities prior to any water renewals.")
18 The LC-QTOF-MS results showed, as with the DOC results, that further compounds were leached out of the test material (Figure S6-I and S6-III). In MQ water, after the first water renewal, the sum of peak intensities (Figure S6-I) was still 53% of what was released during the first 14 d. Even after the third water renewal, the sum of peak intensities was 37% of the sum prior to any water renewals. Although the trends in DOC and sum of peak intensities corresponded well to one another, the two values measure different properties and therefore are not expected to be proportional. This can be seen when comparing Figure S6-I and S6-II. (I) (II) (III) (IV) Figure S6. (I) Sum of peak intensities [%] after repetitive water renewals compared to the peak intensities prior to any water renewals. The same comparison using (II) DOC [%], (III) number of peaks [%] and (IV) TNb [%]. Polymer hardening duration was 24 h. Leaching duration before water renewals was 14 d. Leaching duration after each water renewal was 24 h. MQ and river water (RW) were used as leaching water. For (I) and (III), analyses were performed in the positive ionization mode using LC-QTOF-MS. S18
19 Identification Substances detected in positive and negative ionization mode are plotted in Figure S7 and listed in Table S7. Some substances could be measured in both positive and negative ionization mode while one additional substance was detected exclusively in negative ionization mode. Figure S7. Final peaks (after subtraction steps) were detected in leachates from leaching experiment I. Peak intensities resulted from hardening duration t = 0 (direct water addition after final material preparation) and leaching duration t = 14 d. Analyses were performed in the positive and negative ionization mode using LC-QTOF- MS. The arrow indicates the one peak that was only visible in negative ionization mode. Table S7. Substances detected in leachates summarized with their retention time, mass, intensity, fragments, and group. The table consists of masses belonging to groups A E, including p-toluenesulfonic acid (1 30), masses without specific group assignment (31 41), masses with insufficient MS 2 spectra (42 47), and mass without MS 2 spectra (48). The masses are sorted by intensity (pos.) within the group. Chemical structures verified by reference standard are highlighted in gray. Proposed chemical Mass No./ t structures/ R Intensity measd. Fragments in Group a Identification (pos/neg) [min] confidence level b (L) [M+H] + sample / c Five most intense fragments from MS 2 spectra (pos/neg) [M-H] - 1 A L E E A L E E A L E A L E E S19

20 5 A Side-chain structure could not be proposed due to missing characteristic MS 2 fragments. L E A L E E B / d 1.8E B / d 1.5E B L / d 2.4E B L E E L e 3.3E C L E C L f 1.8E C L E E D L f 4.5E E D L E D L f 9.1E E D L E D L E D L E S20

21 21 D E E D L E D E D L E E L / g 1.9E E L E E L / g 1.7E E L E E L / g 9.3E E L / g 5.6E E E E E E E E E E E E E E E E E S21

")
![and leaching duration t = 14 d d In-source fragment mass / parent ion ([M+H] + )](/docs-images/91/107307495/images/22-2.jpg "mass e This mass was detected only in the negative ionization mode.")

22 E E+04 a Peaks were assigned to groups as part of the identification process. b According to Schymanski et. al 1 c Sample used for intensity: hardening duration t = 0 (direct water addition) and leaching duration t = 14 d d In-source fragment mass / parent ion ([M+H] + ) mass e This mass was detected only in the negative ionization mode. f In-source fragment mass, parent ion mass unknown g NH 4 + adduct mass / parent ion [M+H] + mass CAS-No CAS-No Figure S8. Examples of one of the numerous possible structural composition of two of the declared prepolymers. S22
23 1 st O NH S O O OH 2 nd O NH S O O OH 3 rd O NH O S O O Figure S9. Chemical structures of the first three substances suggested by MetFrag for measured MS 2 spectrum in positive ionization mode. S23
24 (I) (II) S24
25 (III) (IV) (V) S25
26 (VI) Figure S10. MS 2 spectra of identified substances of (I) N-(tosyl)carbamate, (II) p-toluenesulfonamide, (III) p- toluenesulfonic acid, (IV) 4,4 -MDI, (V) TDI, and (VI) [C 2 H 4 O] n derivatives. Intensities are on a different scale from PeakView due to data conversion to mzml (open format). S26
 Relative amounts (sum of peak intensities) of")


27 (I) (II) (III) (IV) (V) (VI) Figure S11. (I) Relative amounts (sum of peak intensities) of the five characterized groups and of the peaks without any structure proposal in total. (II VI) In addition, the relative amount of substances within the groups A E. The sum of peak intensities was formed by summarized the peak intensities over all leaching parameters (leaching duration and hardening). Substances that were identified by reference standard are highlighted in gray. t R is given in min. S27
")
28 (I) (II) (III) (IV) S28
 with varying polymer hardening duration, (II) with varying water types and (III) with water")
29 Figure S12. Luminescent bacteria inhibition test with Aliivibrio fischeri of leachates from leaching experiments (I) with varying polymer hardening duration, (II) with varying water types and (III) with water renewal. Hardening duration was set to 24 h in (II). (IV) Gradient separation step with leachates from leaching experiments with varying hardening duration and standards. Only MQ was used as leaching water in (I, IV). Dark spots indicate toxicity to Aliivibrio fischeri. The darker the spot, the higher the degree of toxicity. Of all samples, an amount of 10 µl was sprayed on the TLC plate using an automatic TLC sampler. After an exposure time of 10 min the detection was performed with the TLC Visualizer. References (1) Schymanski, E. L.; Jeon, J.; Gulde, R.; Fenner, K.; Ruff, M.; Singer, H. P.; Hollender, J. Identifying small molecules via high resolution mass spectrometry: communicating confidence Environ. Sci. Technol. 2014, 48 (4) , DOI: /es S29
Overview. Introduction. André Schreiber AB SCIEX Concord, Ontario (Canada)
") Quantitation and Identification of Pharmaceuticals and Personal Care Products (PPCP) in Environmental Samples using Advanced TripleTOF MS/MS Technology André Schreiber AB SCIEX Concord, Ontario (Canada)
Quantitation and Identification of Pharmaceuticals and Personal Care Products (PPCP) in Environmental Samples using Advanced TripleTOF MS/MS Technology André Schreiber AB SCIEX Concord, Ontario (Canada)
Overview. Introduction. André Schreiber 1 and Yun Yun Zou 1 1 AB SCIEX, Concord, Ontario, Canada
 LC-MS/MS Based Strategy for the Non-Targeted Screening of an Unlimited Number of Contaminants in Food Using the AB SCIEX TripleTOF 5600 System and Advanced Software Tools André Schreiber 1 and Yun Yun
PesticideScreener. Innovation with Integrity. Comprehensive Pesticide Screening and Quantitation UHR-TOF MS
 PesticideScreener Comprehensive Pesticide Screening and Quantitation Innovation with Integrity UHR-TOF MS The Challenge of Comprehensive Pesticide Residue Analysis The use of pesticides to reduce crop
Application Note LCMS-116 What are we eating? MetaboScape Software; Enabling the De-replication and Identification of Unknowns in Food Metabolomics
 Application Note LCMS-116 What are we eating? MetaboScape Software; Enabling the De-replication and Identification of Unknowns in Food Metabolomics Introduction Determining the structure of secondary metabolites
Making Sense of Differences in LCMS Data: Integrated Tools
 Making Sense of Differences in LCMS Data: Integrated Tools David A. Weil Agilent Technologies MassHunter Overview Page 1 March 2008 How Clean is our Water?... Page 2 Chemical Residue Analysis.... From
RMassBank: Automatic Recalibration and Processing of Tandem HR-MS Spectra for MassBank
 RMassBank: Automatic Recalibration and Processing of Tandem HR-MS Spectra for MassBank Eawag: Swiss Federal Institute of Aquatic Science and Technology Presenting: Emma Schymanski Coauthors: Michael Stravs,
Application Note. Edgar Naegele. Abstract
 Fast identification of main drug metabolites by quadrupole time-of-flight LC/MS Measuring accurate MS and MS/MS data with the Agilent 651 Q-TOF LC/MS and identification of main meta-bolites by comparison
Proposal: criteria for positive identification in LC-MS analysis
 Proposal: criteria for positive identification in LC-MS analysis Lubertus Bijlsma, Maria Bronze, Emma Gracia Lor, Susana Simoes Any analytical methodology should comply with several quality requirements,
Yun W. Alelyunas, Mark D. Wrona, Russell J. Mortishire-Smith, Nick Tomczyk, and Paul D. Rainville Waters Corporation, Milford, MA, USA INTRODUCTION
 Quantitation by High Resolution Mass Spectrometry: Using Target Enhancement and Tof-MRM to Achieve Femtogram-level On-column Sensitivity for Quantitation of Drugs in Human Plasma Yun W. Alelyunas, Mark
Application Note LCMS-112 A Fully Automated Two-Step Procedure for Quality Control of Synthetic Peptides
 Application Note LCMS-112 A Fully Automated Two-Step Procedure for Quality Control of Synthetic Peptides Abstract Here we describe a two-step QC procedure for synthetic peptides. In the first step, the
Rapid and Accurate Forensics Analysis using High Resolution All Ions MS/MS
 Rapid and Accurate Forensics Analysis using High Resolution All Ions MS/MS Application Note Forensic Toxicology Authors Martin Josefsson, and Markus Roman National Board of Forensic Medicine Linköping,
AB SCIEX SelexION Technology Used to Improve Mass Spectral Library Searching Scores by Removal of Isobaric Interferences
 AB SCIEX SelexION Technology Used to Improve Mass Spectral Library Searching s by Removal of Isobaric Interferences Differential Mobility Used as a Tool to Address Selectivity Challenges Adrian M. Taylor
EPA Method 535: Detection of Degradates of Chloroacetanilides and other Acetamide Herbicides in Water by LC/MS/MS
 Application Note EPA Method 535 EPA Method 535: Detection of Degradates of Chloroacetanilides and other Acetamide Herbicides in Water by LC/MS/MS API 3200 LC/MS/MS System Overview Described here is the
Metabolomic Profiling of Accurate Mass LC-MS/MS Data to Identify Unexpected Environmental Pollutants
 Metabolomic Profiling of Accurate Mass LC- Data to Identify Unexpected Environmental Pollutants André Schreiber 1, David Cox 1, Nadia Pace 1, Christopher Borton 2 1 AB SCIEX, Concord, ntario, Canada; 2
MassHunter TOF/QTOF Users Meeting
 MassHunter TOF/QTOF Users Meeting 1 Qualitative Analysis Workflows Workflows in Qualitative Analysis allow the user to only see and work with the areas and dialog boxes they need for their specific tasks
EPA Method 535: Detection of Degradates of Chloroacetanilides and other Acetamide Herbicides in Water by LC/MS/MS
 EPA Method 535: Detection of Degradates of Chloroacetanilides and other Acetamide Herbicides in Water by LC/MS/MS Christopher Borton AB SCIEX Golden, Colorado verview Described here is the analysis of
Quantitation of High Resolution MS Data Using UNIFI: Acquiring and Processing Full Scan or Tof-MRM (Targeted HRMS) Datasets for Quantitative Assays
 Datasets for Quantitative Assays") : Acquiring and Processing Full Scan or Tof-MRM (Targeted HRMS) Datasets for Quantitative Assays Mark Wrona, Jayne Kirk, and Yun Alelyunas Waters Corporation, Milford, MA, USA APPLICATION BENEFITS Ability
: Acquiring and Processing Full Scan or Tof-MRM (Targeted HRMS) Datasets for Quantitative Assays Mark Wrona, Jayne Kirk, and Yun Alelyunas Waters Corporation, Milford, MA, USA APPLICATION BENEFITS Ability
Application Note. David A. Weil Zoltan Timar Michael Zumwalt Edgar Naegele. Abstract
 Detection and identification of impurities in pharmaceutical drugs Computer-assisted extraction, profiling and analysis of Q-TF data for determination of impurities using Agilent Massunter software Application
Determination of Beta-Blockers in Urine Using Supercritical Fluid Chromatography and Mass Spectrometry
 Determination of Beta-Blockers in Urine Using Supercritical Fluid Chromatography and Mass Spectrometry Application Note Doping Control Authors Prof. Maria Kristina Parr Freie Universität Berlin Institute
Multi-residue analysis of pesticides by GC-HRMS
 An Executive Summary Multi-residue analysis of pesticides by GC-HRMS Dr. Hans Mol is senior scientist at RIKILT- Wageningen UR Introduction Regulatory authorities throughout the world set and enforce strict
WADA Technical Document TD2003IDCR
 IDENTIFICATION CRITERIA FOR QUALITATIVE ASSAYS INCORPORATING CHROMATOGRAPHY AND MASS SPECTROMETRY The appropriate analytical characteristics must be documented for a particular assay. The Laboratory must
SUSPECT AND NON-TARGET SCREENING OF ORGANIC MICROPOLLUTANTS IN WASTEWATER THROUGH THE DEVELOPMENT OF A LC-HRMS BASED WORKFLOW
 SUSPECT AND NON-TARGET SCREENING OF ORGANIC MICROPOLLUTANTS IN WASTEWATER THROUGH THE DEVELOPMENT OF A LC-HRMS BASED WORKFLOW Pablo Gago-Ferrero Laboratory of Analytical Chemistry Department of Chemistry
Key Features of Targeted Metabolite Screening. Using the TripleTOF System, an Accurate Mass Metabolite Spectral Library and MasterView Software
 RUO-MKT-02-2201-A Automated Targeted Screening of Hundreds of Metabolites Using the TripleTOF System, an Accurate Mass Metabolite Spectral Library and MasterView Software Baljit K. Ubhi 1, Eva Duchoslav
Supporting Information
 1 Supporting Information 2 3 Discovery and implications of C 2 and C 3 perfluoroalkyl sulfonates in aqueous film forming foams (AFFF) and groundwater 4 Krista A. Barzen-Hanson a and Jennifer A. Field b*
5Cl-AKB48 and 5Br-AKB48
 NMS Labs 2300 Stratford Ave Willow Grove, PA 19090 5Cl-AKB48 and 5Br-AKB48 5Cl-AKB48 Sample Type: Seized Material Latest Revision: May 18 th, 2018 Date Received: February 16 th, 2018 Date of Report: April
Achieve confident synthesis control with the Thermo Scientific ISQ EC single quadrupole mass spectrometer
 APPLICATION NOTE 72385 Achieve confident synthesis control with the Thermo Scientific ISQ EC single quadrupole mass spectrometer Authors Stephan Meding, Katherine Lovejoy, Martin Ruehl Thermo Fisher Scientific,
Profiling of Diferulates (Plant Cell Wall Cross- Linkers) Using Ultrahigh-performance Liquid. Chromatography-Tandem Mass Spectrometry
 Using Ultrahigh-performance Liquid. Chromatography-Tandem Mass Spectrometry") Supporting Information for: Profiling of Diferulates (Plant Cell Wall Cross- Linkers) Using Ultrahigh-performance Liquid Chromatography-Tandem Mass Spectrometry Ramin Vismeh a,b, Fachuang Lu c,d, Shishir
Supporting Information for: Profiling of Diferulates (Plant Cell Wall Cross- Linkers) Using Ultrahigh-performance Liquid Chromatography-Tandem Mass Spectrometry Ramin Vismeh a,b, Fachuang Lu c,d, Shishir
TargetScreener. Innovation with Integrity. A Comprehensive Screening Solution for Forensic Toxicology UHR-TOF MS
 TargetScreener A Comprehensive Screening Solution for Forensic Toxicology Innovation with Integrity UHR-TOF MS TargetScreener Get the Complete Picture Forensic laboratories are frequently required to perform
Identification and Characterization of an Isolated Impurity Fraction: Analysis of an Unknown Degradant Found in Quetiapine Fumarate
 Identification and Characterization of an Isolated Impurity Fraction: Analysis of an Unknown Degradant Found in Quetiapine Fumarate Michael D. Jones, Xiang Jin Song, Robert S. Plumb, Peter J. Lee, and
Quantitative Analysis and Identification of Migrants in Food Packaging Using LC-MS/MS
 Quantitative Analysis and Identification of Migrants in Food Packaging Using LC-MS/MS Cécile Busset 1 and Stephen J. Lock 2 1 AB SCIEX, Paris (France); 2 AB SCIEX, Warrington, Cheshire (U.K.) Introduction
NEW TOOLS FOR FINDING AND IDENTIFYING METABOLITES IN A METABOLOMICS WORKFLOW
 NEW TOOLS FOR FINDING AND IDENTIFYING METABOLITES IN A METABOLOMICS WORKFLOW Julia E. Wingate 1 ; Elliott Jones 2 ; Armin Graber 3 ; Klaus Weinberger 3 1Applied Biosystems, Toronto, Canada; 2Applied Biosystems,
A Workflow Approach for the Identification and Structural Elucidation of Impurities of Quetiapine Hemifumarate Drug Substance
 A Workflow Approach for the Identification and Structural Elucidation of Impurities of Quetiapine Hemifumarate Drug Substance Michael D. Jones, Marian Twohig, Karen Haas, and Robert S. Plumb Waters Corporation,
Applying MRM Spectrum Mode and Library Searching for Enhanced Reporting Confidence in Routine Pesticide Residue Analysis
 PO-CON1768E Applying MRM Spectrum Mode and Library Searching for Enhanced Reporting Confidence in Routine Pesticide ASMS 2017 TP-194 David Baker 1, Christopher Titman 1, Neil Loftus 1, Jonathan Horner
Supporting Information. Sweetened Swimming Pools and Hot Tubs
 Supporting Information Sweetened Swimming Pools and Hot Tubs Lindsay K Jmaiff Blackstock, Wei Wang, Sai Vemula, Benjamin T Jaeger and Xing-Fang Li * Division of Analytical and Environmental Toxicology,
Low-level Determination of 4-Hydrazino Benzoic Acid in Drug Substance by High Performance Liquid Chromatography/Mass Spectrometry
 ISSN: 0973-4945; CODEN ECJHAO E- Chemistry http://www.e-journals.net 2010, 7(2), 403-408 Low-level Determination of 4-Hydrazino Benzoic Acid in Drug Substance by High Performance Liquid Chromatography/Mass
N-(1-carbamoyl-2-methyl-propyl)-1-(5-chloropentyl)indazole-3- carboxamide
-1-(5-chloropentyl)indazole-3- carboxamide") NMS Labs 2300 Stratford Ave Willow Grove, PA 19090 5Cl-AB-PINACA Sample Type: Seized Material Latest Revision: October 5, 2018 Date Received: June 6, 2018 Date of Report: October 5, 2018 1. GENERAL INFORMATION
NMS Labs 2300 Stratford Ave Willow Grove, PA 19090 5Cl-AB-PINACA Sample Type: Seized Material Latest Revision: October 5, 2018 Date Received: June 6, 2018 Date of Report: October 5, 2018 1. GENERAL INFORMATION
Methyl 1-[(4-fluorophenyl)methyl]indazole-3-carboxylate
![Methyl 1-[(4-fluorophenyl)methyl]indazole-3-carboxylate](/thumbs/94/121105036.jpg "Methyl 1-[(4-fluorophenyl)methyl]indazole-3-carboxylate") NMS Labs 2300 Stratford Ave Willow Grove, PA 19090 MFUBINAC Sample Type: Seized Material Latest Revision: October 30, 2018 Date Received: August 17, 2018 Date of Report: October 30, 2018 1. GENERAL INFORMATION
NMS Labs 2300 Stratford Ave Willow Grove, PA 19090 MFUBINAC Sample Type: Seized Material Latest Revision: October 30, 2018 Date Received: August 17, 2018 Date of Report: October 30, 2018 1. GENERAL INFORMATION
Simplified Approaches to Impurity Identification using Accurate Mass UPLC/MS
 Simplified Approaches to Impurity Identification using Accurate Mass UPLC/MS Marian Twohig, Michael D. Jones, Dominic Moore, Peter Lee, and Robert Plumb Waters Corporation, Milford, MA, USA APPLICATION
De Novo Metabolite Chemical Structure Determination. Paul R. West Ph.D. Stemina Biomarker Discovery, Inc.
 De Novo Metabolite Chemical Structure Determination Paul R. West Ph.D. Stemina Biomarker Discovery, Inc. As a part of non targeted metabolomic analysis, when peaks in the mass spectra are thought to be
The Agilent 1260 Infinity Analytical SFC System with Time-of-Flight Mass Spectrometric Detection
 Application Note Small Molecules The Agilent 26 Infinity Analytical SFC System with Time-of-Flight Mass Spectrometric Detection Method Development Using Method Scouting Wizard Authors Stefan Bieber Analytical
LC-MS/MS Method for the Determination of Diclofenac in Human Plasma
 LC-MS/MS Method for the Determination of Diclofenac in Human Plasma J. Jones, Thermo Fisher Scientific, Runcorn, Cheshire, UK Application Note 20569 Key Words SPE, SOLA, Accucore RP-MS, diclofenac, Core
Quantitative analysis of mitragynine in human urine by high performance liquid chromatography-tandem mass spectrometry
 Quantitative analysis of mitragynine in human urine by high performance liquid chromatography-tandem mass spectrometry Shijun Lua, Buu N. Trana, Jamie L. Nelsenb, Kenneth M. Aldousa. Journal of Chromatography
All Ions MS/MS: Targeted Screening and Quantitation Using Agilent TOF and Q-TOF LC/MS Systems
 All Ions MS/MS: Targeted Screening and Quantitation Using Agilent TOF and Q-TOF LC/MS Systems Technical Overview Introduction All Ions MS/MS is a technique that is available for Agilent high resolution
Analytical determination of testosterone in human serum using an Agilent Ultivo Triple Quadrupole LC/MS
 Application Note Clinical Research Analytical determination of testosterone in human serum using an Agilent Ultivo Triple Quadrupole LC/MS Authors Yanan Yang 1, Victor Mandragon 2, and Peter Stone 1 1
2-[[2-(4-ethyl-2,5-dimethoxy-phenyl)ethylamino]methyl]phenol
![2-[[2-(4-ethyl-2,5-dimethoxy-phenyl)ethylamino]methyl]phenol](/thumbs/89/99252682.jpg "2-[[2-(4-ethyl-2,5-dimethoxy-phenyl)ethylamino]methyl]phenol") NMS Labs 2300 Stratford Ave Willow Grove, PA 19090 25E-NBOH Sample Type: Seized Material Latest Revision: May 18 th, 2018 Date Received: January 12 th, 2018 Date of Report: February 27 th, 2018 1. GENERAL
NMS Labs 2300 Stratford Ave Willow Grove, PA 19090 25E-NBOH Sample Type: Seized Material Latest Revision: May 18 th, 2018 Date Received: January 12 th, 2018 Date of Report: February 27 th, 2018 1. GENERAL
Toxicity, Teratogenic and Estrogenic Effects of Bisphenol A and its Alternative. Replacements Bisphenol S, Bisphenol F and Bisphenol AF in Zebrafish.
 1 Supporting Information 2 3 Toxicity, Teratogenic and Estrogenic Effects of Bisphenol A and its Alternative Replacements Bisphenol S, Bisphenol F and Bisphenol AF in Zebrafish. 4 5 John Moreman, Okhyun
Analysis of Pharmaceuticals and Personal Care Products in River Water Samples by UHPLC-TOF
 application Note Liquid Chromatography/ Mass Spectrometry Author Sharanya Reddy PerkinElmer, Inc. Shelton, CT USA Analysis of Pharmaceuticals and Personal Care Products in River Water Samples by UHPLC-TOF
The new Water Screening PCDL
 The new Water Screening PCDL Content and integration in suspect and non-target screening Dr. Thomas Glauner Senior LC/MS Applications Scientist EMEA Market Development Team 1 Accurate mass screening and
Analysis of Polar Metabolites using Mass Spectrometry
 Analysis of Polar Metabolites using Mass Spectrometry TransMed Course: Basics in Clinical Proteomics and Metabolomics. Oct 10-19, 2012 dd.mm.yyyy Vidya Velagapudi, Ph.D, Adjunct Professor Head of the Metabolomics
Agilent ESI and APCI sources: for polar to non-polar compounds
 1 Agilent 6400 Series Triple Quadrupole Users Workshop 1 Agilent ESI and APCI sources: for polar to non-polar compounds Nebulizer Pressure Corona current Nebulizer Pressure Vaporizer Vcap Vcap Drying Gas
Food & Environmental. Overview. Introduction. Method Details. André Schreiber and Yun Yun Zou SCIEX, Concord, Ontario, Canada
 Food & Environmental Comprehensive Quantitation and Identification of Pesticides in Food Samples using LC-MS/MS with Scheduled MRM, Fast Polarity Switching, and MS/MS Library Searching André Schreiber
Identifying Disinfection Byproducts in Treated Water
 Identifying Disinfection Byproducts in Treated Water Jonathan D. Byer, LEC Corporation; Saint Joseph, Michigan USA Susan D. Richardson, University of South Carolina; Columbia, South Carolina USA 1. Introduction
4-methyl-1-phenyl-2-pyrrolidin-1-yl-pentan-1-one
 NMS Labs 2300 Stratford Ave Willow Grove, PA 19090 alpha-pihp Sample Type: Seized Material Latest Revision: October 30, 2018 Date Received: August 17, 2018 Date of Report: October 30, 2018 1. GENERAL INFORMATION
Untargeted Screening on the X500R QTOF
 Untargeted Screening on the X500R QTOF R. E. Haufler, Paul Winkler, Andrei Schreiber, SCIEX, Concord, ON Canada NEMC August 2016 RUO-MKT-11-4397 Outline X500R technology and performance X500R QTOF Scan
WADA Technical Document TD2015IDCR
 MINIMUM CRITERIA FOR CHROMATOGRAPHIC-MASS SPECTROMETRIC CONFIRMATION OF THE IDENTITY OF ANALYTES FOR DOPING CONTROL PURPOSES. The ability of a method to identify an analyte is a function of the entire
The Use of the ACQUITY QDa Detector for a Selective, Sensitive, and Robust Quantitative Method for a Potential Genotoxic Impurity
 The Use of the ACQUITY QDa Detector for a Selective, Sensitive, and Robust Quantitative Method for a Potential Genotoxic Impurity Janet Hammond Waters Corporation, Wilmslow, UK APPLICATION BENEFITS High
Separation of Enantiomers of Amphetamine-Related Drugs and Their Structural Isomers
 Application Note Forensic and Toxicology - Criminalistics Separation of Enantiomers of Amphetamine-Related Drugs and Their Structural Isomers Using the Agilent 126 Infinity II SFC and Detection by Coupled
Mass Spectrometry. Hyphenated Techniques GC-MS LC-MS and MS-MS
 Mass Spectrometry Hyphenated Techniques GC-MS LC-MS and MS-MS Reasons for Using Chromatography with MS Mixture analysis by MS alone is difficult Fragmentation from ionization (EI or CI) Fragments from
4-Methyldiethcathinone (4-MDEC)
") NMS Labs 2300 Stratford Ave Willow Grove, PA 19090 4-Methyldiethcathinone (4-MDEC) Sample Type: Seized Material Latest Revision: May 18 th, 2018 Date Received: December 12 th, 2017 Date of Report: February
NMS Labs 2300 Stratford Ave Willow Grove, PA 19090 4-Methyldiethcathinone (4-MDEC) Sample Type: Seized Material Latest Revision: May 18 th, 2018 Date Received: December 12 th, 2017 Date of Report: February
Technical Procedure for Blood Cannabinoid Liquid-Liquid Extraction (BCLLE) for Analysis by LC-MS/MS
 for Analysis by LC-MS/MS") Technical Procedure for Blood Cannabinoid Liquid-Liquid Extraction (BCLLE) for Analysis by LC-MS/MS 1.0 Purpose - This procedure specifies the required elements for the extraction and quantitation of THC,
Technical Procedure for Blood Cannabinoid Liquid-Liquid Extraction (BCLLE) for Analysis by LC-MS/MS 1.0 Purpose - This procedure specifies the required elements for the extraction and quantitation of THC,
1-(1,3-benzodioxol-5-yl)-2-(ethylamino)hexan-1-one
-2-(ethylamino)hexan-1-one") NMS Labs 2300 Stratford Ave Willow Grove, PA 19090 N-ethyl Hexylone Sample Type: Seized Material Latest Revision: May 18 th, 2018 Date Received: February 12 th, 2018 Date of Report: April 19 th, 2018 1.
NMS Labs 2300 Stratford Ave Willow Grove, PA 19090 N-ethyl Hexylone Sample Type: Seized Material Latest Revision: May 18 th, 2018 Date Received: February 12 th, 2018 Date of Report: April 19 th, 2018 1.
Key Words Q Exactive, Accela, MetQuest, Mass Frontier, Drug Discovery
 Metabolite Stability Screening and Hotspot Metabolite Identification by Combining High-Resolution, Accurate-Mass Nonselective and Selective Fragmentation Tim Stratton, Caroline Ding, Yingying Huang, Dan
Welcome! Course 7: Concepts for LC-MS
 Welcome! Mass Spectrometry meets Cheminformatics Tobias Kind and Julie Leary UC Davis Course 7: Concepts for LC-MS Class website: CHE 241 - Spring 28 - CRN 16583 Slides: http://fiehnlab.ucdavis.edu/staff/kind/teaching/
A Rapid Approach to the Confirmation of Drug Metabolites in Preclinical and Clinical Bioanalysis Studies
 A Rapid Approach to the Confirmation of Drug Metabolites in Preclinical and Clinical Bioanalysis Studies APPLICATION BENEFITS Regulatory guidelines and recommendations place a greater emphasis on the detection
Extraction of Aflatoxins and Ochratoxin from Dried Chili Using ISOLUTE. Myco Prior to LC-MS/MS Analysis
 Application Note AN785 Extraction of Aflatoxins and chratoxin From Dried Chili Using ISLUTE Myco prior to LC-MS/MS Analysis Page Extraction of Aflatoxins and chratoxin from Dried Chili Using ISLUTE Myco
MS Interpretation I. Identification of the Molecular Ion
 MS Interpretation I Identification of the Molecular Ion Molecular Ion: EI Requirements for the Molecular Ion Must be the highest m/z peak in the spectrum Highest Isotope Cluster Must be an odd-electron
LC-MS Based Metabolomics
 LC-MS Based Metabolomics Analysing the METABOLOME 1. Metabolite Extraction 2. Metabolite detection (with or without separation) 3. Data analysis Metabolite Detection GC-MS: Naturally volatile or made volatile
The Theory of HPLC. Quantitative and Qualitative HPLC
 The Theory of HPLC Quantitative and Qualitative HPLC i Wherever you see this symbol, it is important to access the on-line course as there is interactive material that cannot be fully shown in this reference
Q-TOF PREMIER DYNAMIC RANGE ENHANCEMENT AND ACCURATE MASS MEASUREMENT PERFORMANCE
 Q-TOF PREMIER DYAMIC RAGE EHACEMET AD ACCURATE MASS MEASUREMET PERFORMACE Michael McCullagh, Jose Castro-Perez, and Lisa Calton Waters Corporation, Manchester, UK ITRODUCTIO The use of time-of-flight (TOF)
Die Nadel im Heuhaufen
 Die Nadel im Heuhaufen Workflow zur Identifizierung unerwarteter Komponenten in LC Q-Tof Daten Umwelt & Lebensmittel Seminar Tour Andreas Reimann Produktspezialist LC-MS Agilent Technologies Instrumentation
Maximizing Triple Quadrupole Mass Spectrometry Productivity with the Agilent StreamSelect LC/MS System
 Maximizing Triple Quadrupole Mass Spectrometry Productivity with the Agilent StreamSelect LC/MS System Application Note Authors Kevin McCann, Sameer Nene, Doug McIntyre, Edmond Neo, Dennis Nagtalon, and
Biotransformation of benzotriazoles: insights from transformation product identification and compoundspecific
 Supporting Information for Biotransformation of benzotriazoles: insights from transformation product identification and compoundspecific isotope analysis Sebastian untscha 1) 2), Thomas ofstetter 1) 2),
Report AFK0242/18 TABLE OF CONTENTS
 Client: Blue Dent Dental OS: 0161/0211-18 Contact: Rafael Gomes E-mail: rafael@bluedent.com.br Phone: (19) 3563-2222 Address: Rua Joaquim Jorge Port, 1272 City/State: Pirassununga/SP Zip Code: 13636-142
Agilent 6400 Series Triple Quadrupole Users Workshop. MH QQQ Users workshop 2/21/2014 1
 Agilent 6400 Series Triple Quadrupole Users Workshop 1 Agilent 6400 Series Triple Quadrupole Users Workshop QQQ Method Development and Optimization MassHunter Quantitation: Batch and Method setup QC s,
Accelerated Impurity Profiling Workflow for Bulk Drugs and Formulations using an Accurate Mass Workhorse
 Accelerated Impurity Profiling Workflow for Bulk Drugs and Formulations using an Accurate Mass Workhorse Suma Ramagiri, Loren lson, Gary Impey, Joe Fox AB SCIEX, Concord, ntario and Framingham, Massachusetts
LC/MS/MS qua ntitation of β-estradiol 17-acetate using an Agilent 6460 Triple Quadrupole LC/MS working in ESI negative ion mode
 LC/MS/MS qua ntitation of β-estradiol 17-acetate using an Agilent 6460 Triple Quadrupole LC/MS working in ESI negative ion mode Application Note Authors Siji Joseph Agilent Technologies India Pvt. Ltd.
Analysis of Illegal Dyes in Food Matrices using Automated Online Sample Preparation with LC/MS
 Application Note: 56 Analysis of Illegal Dyes in Food Matrices using Automated Online Sample Preparation with LC/MS Yang Shi, Catherine Lafontaine, Matthew Berube, John Fink, François Espourteille Thermo
This document is a preview generated by EVS
 TECHNICAL REPORT RAPPORT TECHNIQUE TECHNISCHER BERICHT CEN/TR 15641 August 2007 ICS 67.050 English Version Food analysis - Determination of pesticide residues by LC- MS/MS - Tandem mass spectrometric parameters
An Effective Workflow for Impurity Analysis Incorporating High Quality HRAM LCMS & MSMS with Intelligent Automated Data Mining
 An Effective Workflow for Impurity Analysis Incorporating High Quality HRAM LCMS & MSMS with Intelligent Automated Data Mining Dave Weil, Ph.D. and Jim Lau, Ph.D. Typical Method Conditions: 1260 UHPLC
Accurate Mass Analysis of Hydraulic Fracturing Waters: Identification of Polyethylene Glycol Surfactants by LC/Q-TOF-MS
 Accurate Mass Analysis of Hydraulic Fracturing Waters: Identification of Polyethylene Glycol Surfactants by LC/Q-TOF-MS Application Note Authors E. Michael Thurman and Imma Ferrer Center for Environmental
Agilent All Ions MS/MS
 Agilent All Ions MS/MS Workflow Overview A Determine fragment ions for LC/MS Quant method B Develop final Quant method Develop LC/MS Qualitative Analysis method Process data with Find by Formula Build
Overview. Introduction
 Comprehensive Quantitation and Identification of Pesticides in Food Samples Using the SCIEX UltraLC 100 and the SCIEX QTRAP 4500 System André Schreiber SCIEX, Concord, Ontario, Canada Overview Liquid Chromatography
Accurate Mass Analysis of Hydraulic Fracturing Waters
 Application Note Environmental Accurate Mass Analysis of Hydraulic Fracturing Waters Using the Kendrick mass defect with the Agilent LC/Q-TOF MS Authors E. Michael Thurman and Imma Ferrer Department of
Certified Reference Material - Certificate of Analysis Methylone, Primary Standard
 Certified Reference Material - Certificate of Analysis Methylone, Primary Standard Page 1 of 9 Catalog Number: O Lot: Expiration Date: Description: Packaging: Storage: Shipping: Intended Use: Instructions
Clinical Toxicology. Biomass Component Extraction: The uneaten cooked plant specimen was prepared for
 Clinical Toxicology Page of 0 Materials and Methods Biomass Component Extraction: The uneaten cooked plant specimen was prepared for chemical analysis as follows. The sample was frozen, diced, pulverized
Bioanalytical Chem: 4590: LC-MSMS of analgesics LC-MS Experiment Liquid Chromatography Mass Spectrometry (LC/MS)
") Liquid Chromatography Mass Spectrometry (LC/MS) Prelab Questions: Questions to be answered before doing the experiment. The answers are due at the beginning of each experiment without exception (the questions
Liquid Chromatography Mass Spectrometry (LC/MS) Prelab Questions: Questions to be answered before doing the experiment. The answers are due at the beginning of each experiment without exception (the questions
Lirui Qiao, 1 Rob Lewis, 2 Alex Hooper, 2 James Morphet, 2 Xiaojie Tan, 1 Kate Yu 3
 Using Natural Products Application Solution with UNIFI for the Comparison of the Chemical Ingredients of Shuanghuanglian Oral Drink from Two Different Manufacturers Lirui Qiao, 1 Rob Lewis, 2 Alex Hooper,
Analysis of a Verapamil Microsomal Incubation using Metabolite ID and Mass Frontier TM
 Application Note: 320 Analysis of a Verapamil Microsomal Incubation using Metabolite ID and Mass Frontier TM Key Words Metabolism Study Structure Elucidation Metabolite ID Mass Frontier Chromatography
SEAMLESS INTEGRATION OF MASS DETECTION INTO THE UV CHROMATOGRAPHIC WORKFLOW
 SEAMLESS INTEGRATION OF MASS DETECTION INTO THE UV CHROMATOGRAPHIC WORKFLOW Paula Hong, John Van Antwerp, and Patricia McConville Waters Corporation, Milford, MA, USA Historically UV detection has been
Increasing Speed of UHPLC-MS Analysis Using Single-stage Orbitrap Mass Spectrometer
 Increasing Speed of UHPLC-MS Analysis Using Single-stage Orbitrap Mass Spectrometer Olaf Scheibner and Maciej Bromirski Thermo Fisher Scientific, Bremen, Germany Overview Purpose: Improve the performance
Simultaneous, Fast Analysis of Melamine and Analogues in Pharmaceutical Components Using Q Exactive - Benchtop Orbitrap LC-MS/MS
 Simultaneous, Fast Analysis of Melamine and Analogues in Pharmaceutical Components Using Q Exactive - Benchtop Orbitrap LC-MS/MS Kate Comstock, Tim Stratton, Hongxia (Jessica) Wang, and Yingying Huang
Analytical Technologies and Compound Identification. Daniel L. Norwood, MSPH, PhD SCĪO Analytical Consulting, LLC.
 Analytical Technologies and Compound Identification Daniel L. Norwood, MSPH, PhD SCĪ Analytical Consulting, LLC. Extractables/Leachables Characterization (USP) Characterization is the discovery,
Using TOF for Screening and Quantitation of Sudan Red Colorants in Food Application
 Using TOF for Screening and Quantitation of Sudan Red Colorants in Food Application Food Authors Yanyan Fang Agilent Technologies, Inc. 412 Ying Lun Road Pu Dong, Shanghai 200131 China Michael Zumwalt
HPLC Praktikum Skript
 HPLC Praktikum Skript Assistants: Gianluca Bartolomeo HCI D330, 3 46 68, bartolomeo@org.chem.ethz.ch Sahar Ghiasikhou HCI E330, 2 29 29, ghiasikhou@org.chem.ethz.ch 1. Introduction In chromatographic techniques,
Improved 6- Plex TMT Quantification Throughput Using a Linear Ion Trap HCD MS 3 Scan Jane M. Liu, 1,2 * Michael J. Sweredoski, 2 Sonja Hess 2 *
 Improved 6- Plex TMT Quantification Throughput Using a Linear Ion Trap HCD MS 3 Scan Jane M. Liu, 1,2 * Michael J. Sweredoski, 2 Sonja Hess 2 * 1 Department of Chemistry, Pomona College, Claremont, California
Utilizing ELSD and MS as Secondary Detectors for Prep HPLC and Flash Chromatography. Tips and Techniques to Optimize ELSD and MS based Purification
 Utilizing ELSD and MS as Secondary Detectors for Prep HPLC and Flash Chromatography Tips and Techniques to Optimize ELSD and MS based Purification Utilizing ELSD and MS as Secondary Detectors for Prep
LC-HRMS: Challenges for Routine Implementation
 Joint EURL pesticides meeting October 23 rd -25th, 2013 Almeria Spain LC-HRMS: Challenges for Routine Implementation Richard J. Fussell Food and Environment Research Agency (York, UK) www.fera.defra.gov.uk
Analyst Software. Automatic Optimization Tutorial
 This document is provided to customers who have purchased AB Sciex equipment to use in the operation of such AB Sciex equipment. This document is copyright protected and any reproduction of this document
LC/Q-TOF Workflows for Comprehensive Micropollutant Analysis
 LC/Q-TO Workflows for Comprehensive Micropollutant Analysis Targeted Quantification, Suspect Screening, and Unknown Compound Identification Application Note Environmental Authors Christoph Moschet and
Improved Automated Sample Preparation for the Analysis of 25-OH-Vitamin D3 by LC/MS/MS
 Improved Sample Preparation for the Analysis of 25-OH-Vitamin D3 by LC/MS/MS Abstract In this work, we demonstrate an improved automated sample preparation for liquid chromatography-tandem mass spectrometry