Autecology of Prairie Plants on the Northern Mixed Grass Prairie
|
|
|
- Edward Jessie Snow
- 6 years ago
- Views:
Transcription
1 Autecology of Prairie Plants on the Northern Mixed Grass Prairie Llewellyn L. Manske PhD Research Professor of Range Science North Dakota State University Dickinson Research Extension Center Report DREC Prairie ecosystems are complex; exceedingly more complex than the most complicated machines ever built by humans. The long-standing standard process to understand complex systems is to initially investigate the separate component parts. The gained knowledge of each part combined with the synergistic effects resulting when the parts work together provide the information needed to develop an understanding of the whole ecosystem. This classical concept of biological systems was developed by the Greek philosopher/scientist Aristotle ( BC) who taught that the whole is greater than the sum of its parts. The goals of this study were developed by Dr. Warren C. Whitman (c. 1950) and Dr. Harold Goetz (1963) which were to gain quantitative knowledge of each component species and to provide a pathway essential for the understanding of the whole prairie ecosystem that would result in the development and establishment of scientific standards for proper management of native rangelands of the Northern Plains. The prairie plants flourishing on northern mixed grass prairie ecosystems come with preprogramed genetic material that control the parameters of behavioral response, growth, and development of each particular species. All of these physiological factors are quantifiable. Six ecological studies conducted at the Dickinson Research Extension Center collected growth and development data on individual prairie plant species. These quantitative data were compiled in these reports and used to describe the distinctive annual growing season life histories of prairie species. The component species included in this study were grouped into three physiognomic categories: grasses and upland sedges, forbs, and shrubs and subshrubs. Dr. Warren C. Whitman conducted a grass and sedge nutritional quality and phenological growth study with data collected weekly during the growing seasons of 1946 and The study included 1 upland sedge, 5 cool season, 4 warm season, 1 naturalized, and 2 domesticated grasses. The study sites were established in two seeded domesticated grasslands and a native rangeland pasture located about one mile (1.6 km) west of the original DREC livestock research units on the Dickinson campus (Whitman et al. 1951). Dr. Warren C. Whitman originated and Dr. Harold Goetz completed a prairie plant growth in height and first flower date study with data collected on 7 to 10 day intervals during the growing seasons of 1955 to The study included 2 upland sedges, 8 cool season and 5 warm season grasses, 85 forbs, and 2 shrubs and 5 subshrubs. The study site was a 40 acre native rangeland pasture that had two hills and was located about one mile (1.6 km) northwest of the DREC main office on the Dickinson campus. The hills provided a gradient of soils that stratified into sandy, shallow, silty and clayey ecological sites creating various habitat characteristics for numerous species (Goetz 1963). Dr. Nicholas Zaczkowski determined the range of flowering time of prairie plants during a floristic study in southwestern North Dakota. Daily records of observed flowering plants were reported on 7 to 8 day sampling periods during the growing seasons of 1969 to The study included 2 upland sedges, 1 naturalized, 3 cool season and 6 warm season grasses, 151 forbs, and 11 shrubs and 6 subshrubs. The study area included the vast complex of rolling prairie and badland terrain of southwestern North Dakota with sample sites located on most of the topographic positions that included sandy, shallow, silty, loamy terrace, deep sandy blowout, thin claypan, and shallow to scoria ecological sites (Zaczkowski 1972). An autecological study of grasses and upland sedges was conducted by Dr. Llewellyn Manske during the growing seasons of 1983 to 1989 with data collected biweekly. The study included 1 upland sedge, 3 cool season, 2 warm season, 1 naturalized, and 2 domesticated grasses. The study sites were located at the Dickinson Research Extension Center ranch near Manning, ND, and consisted of two seeded domesticated grasslands and 720 acres of native rangeland pastures separated in three management treatments, each with two replications, and data collection sites established on sandy, shallow, and silty ecological sites. The ecological sites of the grazed treatments had matching paired plots, one grazed and the other with an ungrazed exclosure. An autecological study of forbs, shrubs, and subshrubs was conducted by Dr. Llewellyn Manske and Dr. Harold Goetz during the growing seasons of 1984 to 1985 with data collected biweekly. The study included 19 forbs, 1 shrub, and 3 subshrubs.
2 The study sites were located at the Dickinson Research Extension Center ranch near Manning, ND, and consisted of 720 acres of native rangeland pastures separated in three management treatments, each with two replications, and data collection sites established on sandy, shallow, and silty ecological sites. The ecological sites of the grazed treatments had matching paired plots, one grazed and the other with an ungrazed exclosure. A long-term (30 year) change in prairie plant species abundance study was conducted by Dr. Llewellyn Manske during the growing seasons of 1983 to 2012 with data collected annually. The study included 1 upland sedge, 2 naturalized, 6 cool season and 8 warm season grasses, 44 forbs, and 4 shrubs and 5 subshrubs. The study sites were located at the Dickinson Research Extension Center ranch near Manning, ND, and consisted of 720 acres of native rangeland pastures separated into three management treatments, each with two replications, and data collection sites established on sandy, shallow, and silty ecological sites. The ecological sites of the grazed treatments had matching paired plots, one grazed and the other with an ungrazed exclosure. Study Area The physiography of the study area consists of the Unglaciated section of the Missouri Plateau (Fenneman 1931, 1946; Hunt 1974). Portions of this section were undoubtedly glaciated during glacial advances earlier than Wisconsin Age. However, there is little geologic evidence by older glaciation. The important distinction between the Unglaciated and Glaciated sections is the type and age of parent material from which the soil develops. The landscape surface of the Unglaciated section is highly eroded fluvial sedimentary deposits of material removed from the uplifted Rocky Mountains. Most of the deposition occurred from slow meandering streams during the Laramide Orogeny, that formed the mountains, and during the 20 to 30 million years of the late Cretaceous and early Tertiary Periods following the uplift. Intense widespread erosion of these sediments occurred from about 5 to 3 million years ago during the late Plicene Epoch (Bluemle 2000). The extensive erosion during this period removed about 500 to 1000 feet of sediments (Fenneman 1931). These fluvial Tertiary sediments had great differences in hardness and durability. The soft and unconsolidated material was easily removed and the harder coherent material had greater resistance to weathering and to erosional forces of wind and running water. Differential erosion formed a landscape with well developed integrated drainage systems of broad mature valleys and gently rolling uplands containing widely spaced large hills and buttes with erosion resistant caps raising 500 to 650 feet above the plain (Bluemle 2000). Drainage of the Missouri Plateau during the highly erosional period of the Plicene (5 to 3 million years ago) was primarily north and northeast towards the Hudson Bay area. The climate became cooler about 2.6 million years ago and, about 700,000 years ago, the climate was cold enough to produce continental glaciers (Bluemle 2000). Early glacial advances blocked the northward paths of the rivers draining the Unglaciated section and diverted water flow into steeper southern routes. The increased gradient of several rivers caused drastic downcutting through areas of poorly consolidated, soft, fine textured sediments resulting in formation of badland regions (Fenneman 1931). The soils of western North Dakota developed from eroded Tertiary fluvial sedimentary deposits in the Ustic-Frigid soil moisture-temperature regime. The soils in the Ustic soil moisture regime, typically of semi arid climates, are dry in some or all parts for 90 or more days in most years, but not dry in all parts for more than half the time, and are not dry for as long as 45 days during the 4 months that follow the summer solstice (21 June) in 6 or more years out of 10 years. The Frigid soil temperature regime has mean annual soil temperatures of less than 47 F (8 C) (Soil Survey Staff 1975). These soils are primarily Typic Borolls (semi arid cool Mollisols) and support vegetation of mid and short grasses of the Mixed Grass Prairie (Manske 2008b). The geologic history of the Northern Plains was dynamic and the climate has changed several times. A major climate change resulted when the Rocky Mountains uplifted about 70 to 80 million years ago, forming a barrier that prevented humid Pacific Ocean air masses from flowing eastward. The Plains became much drier. Two million years ago the climate became cooler and more humid, with several periods of glaciation. The periods of glacial advance were cool and humid, the interglacial periods warmer and drier. The changes in climate since the last glaciation period have strongly influenced the present conditions of the region. The last ice sheet reached its maximum advance between 14,000 and 12,000 years ago. About 10,000 years ago, a sudden change in the climate to drier and warmer summers but colder winters occurred. This major change accelerated the melting of the glacial ice. A spruceaspen forest developed in the cool, moist conditions at the ice margin; this community graded into a deciduous forest, which graded into a grassland south of the Northern Plains. The climate became much drier and warmer between 10,000 and 5,000 years ago. During 8,500 and 4,500 years ago, the
3 vegetation was a sagebrush and short grass community similar to vegetation in parts of Wyoming, and the region experienced frequent summer droughts and extensive soil erosion from wind (Bluemle 1977, 1991). The climate changed about 5,000 years ago to conditions like those of the present, with cycles of wet and dry periods (Bluemle 1977, 1991; Manske 1994). The wet periods have been cool and humid, with greater amounts of precipitation. During the wet peiods, the vegetation increased in taller grasses and deciduous woodlands. The dry periods have been warmer, with reduced precipitation and recurrent summer droughts. During the dry periods, the vegetation decreased in woodlands and increased in grasslands, with the plant composition shifting from taller grass species to shorter grass species. The current native plant species in the Northern Plains did not originate here. All of the plant species have migrated into the region by different mechanisms and at different times and rates. The present plant species have flora affinities to northern, eastern, western, Rocky Mountain, and Great Basin plant communities (Zaczkowski 1972). This wide mix of plant species in the Northern Plains formed from remnants of plant communities that reached periods of greater development during the wet and dry cycles when conditions favored these various plant community types. The large diversity of plant species that make up the mixed grass prairie permits dynamic responses to changes in climatic conditions by increasing the combination of plant species favored by any set of conditions (Manske 2008a). Climatic conditions regulate growth and development of prairie plants. Length of daylight, temperature, precipitation, and water deficiency are the most important climatic factors that affect rangeland plants (Manske 2011b). Light is necessary for plant growth because light is the source of energy for photosynthesis. Plant growth is affected by variations in quality, intensity, and duration of light. The quality of light (wavelength) varies from region to region, but the quality of sunlight does not vary enough in a given region to have an important differential effect on the rate of photosynthesis. However, the intensity (measurable energy) and duration (length of day) of sunlight change with the seasons and affect plant growth. Light intensity varies greatly with the season and with the time of day because of changes in the angle of incidence of the sun s rays and the distance light travels through the atmosphere. Light intensity also varies with the amount of humidity and cloud cover because atmospheric moisture absorbs and scatters light rays. Water vapor is the most common greenhouse gas. Day length period (photoperiod) is one of the most dependable cues by which plants time their activities in temperate zones. Day length for a given date and locality remains the same from year to year. Changes in the photoperiod function as the timer or trigger that activates or stops physiological processes bringing about growth and flowering of plants and that starts the process of hardening for resistance to low temperatures in fall and winter. Sensory receptors, specially pigmented areas in the buds or leaves of a plant, detect day length and night length and can activate one or more hormone and enzyme systems that bring about physiological responses (Odum 1971, Daubenmine 1974, Barbour et al. 1987). Temperature is an approximate measurement of the heat energy available from solar radiation. At both low and high levels temperature limits plant growth. Most plant biological activity and growth occur within only a narrow range of temperatures, between 32 F (0 C) and 122 F (50 C) (Coyne et al. 1995). Low temperatures limit biological reactions because water becomes unavailable when it is frozen and because levels of available energy are inadequate. However, respiration and photosynthesis can continue slowly at temperatures well below 32 F if plants are hardened. High temperatures limit biological reactions because the complex structures of proteins are disrupted or denatured. Different plant species have different optimum temperature ranges. Cool season plants, which are C 3 photosynthetic pathway plants, have an optimum temperature range of 50 to 77 F (10 to 25 C). Warm season plants, which are C 4 photosynthetic pathway plants, have an optimum temperature range of 86 to 105 F (30 to 40 C) (Coyne et al. 1995). Water, precipitation, is an integral part of all living systems and is ecologically important because it is a major force in shaping climatic patterns and biochemically important because it is a necessary component in physiological processes (Brown 1995). Water is the principal constituent of plant cells, usually composing up to 80% of the fresh weight of herbaceous plants. Water is the primary solvent in physiological processes by which gases, minerals, and other materials enter plant cells and by which these materials are translocated to various parts of the plant. Water is the substance in which processes such as photosynthesis and other biochemical reactions occur and a structural component of proteins and nucleic acids. Water is also essential for
4 the maintenance of the rigidity of plant tissue and for cell enlargement and growth in plants (Brown 1977, 1995). A water deficiency exists when the amount of rainfall received is less than potential evapotranspiration demand. Temperature and precipitation act together to affect the physiological and ecological status of range plants. The biological situation of a plant at any time is determined by the balance between rainfall and potential evapotranspiration. The higher the temperature, the greater the rate of evapotranspiration and the greater the need for rainfall to maintain homeostasis. Evapotranspiration demand is greater than precipitation in the mixed grass and short grass prairie regions. The tall grass prairie region has greater precipitation than evapotranspiration demand. Under water deficiency conditions, plants are unable to absorb adequate water to match the transpiration rate, and plant water stress develops. Range plants have mechanisms that help reduce the damage from water stress, but some degree of reduction in herbage production occurs (Manske 2016). A technique reported by Emberger et al. (1963) was used to develop water deficiency months data from historical temperature and precipitation data (Manske 1998, 2013). The water deficiency months data were used to identify months with conditions unfavorable for plant growth. This method plots mean monthly temperature ( C) and monthly precipitation (mm) on the same axis, with the scale of the precipitation data at twice that of the temperature data. The temperature and precipitation data are plotted against an axis of time. The resulting ombrothermic diagram shows general monthly trends and identifies months with conditions unfavorable for plant growth. Water deficiency conditions exist during months when the precipitation data bar drops below the temperature data curve and plants are under water stress. Plants are under temperature stress when the temperature curve drops below the freezing mark (0 C) (Manske 2016). Long-Term Weather-Dickinson The NDSU Dickinson Research Extension Center campus is located in Dickinson, Stark county, western North Dakota, USA, at latitude 46 53' N, longitude ' W, elevation 2,500 feet. The 118 year long-term ( ) mean annual temperature was 40.9 F (4.9 C). January was the coldest month, with a mean temperature of 11.5 F (-11.4 C). July and August were the warmest months, with mean temperatures of 68.8 F (20.4 C) and 67.0 F (19.4 C), respectively. Perennial grassland plants are capable of active growth for periods longer than the frost-free period. The growing season for perennial plants was considered to be between the first 5 consecutive days in spring and the last 5 consecutive days in fall with the mean daily temperature at or above 32 F (0 C). In western North Dakota, the growing season for perennial plants was considered to be generally from mid April through mid October (6.0 months). The 118 year long-term mean annual precipitation was 16.0 inches (406.4 mm). The growing season precipitation (April to October) was 13.5 inches (342.9 mm), 84.5% of the annual precipitation. The early portion of the growing season (April to July) received 9.5 inches (241.3 mm), 59.5% of the annual precipitation and the latter portion of the growing season (August to October) received 4.0 inches (101.6 mm), 25.0% of the annual precipitation. Total precipitation received during the nongrowing season (November through March) was only 2.5 inches (63.5 mm), 15.6% of the annual precipitation (Manske et al. 2010). Water stress develops in perennial plants during water deficiency periods when the amount of rainfall is less than evapotranspiration demand. Water deficiency months were identified from historical temperature and precipitation data by the ombrothermic diagram technique (Emberger et al. 1963). The long-term ( ) ombrothermic diagram (figure 1) shows near water deficiency conditions during August, September, and October, and favorable water relations during April, May, June, and July (Manske 2010). Reoccurrence of water deficiency conditions during April, May, June, and July was 16.9%, 13.6%, 10.2%, and 38.1%, respectively, and during August, September, and October water deficiency reoccurred 52.5%, 50.0%, and 46.6% of the years, respectively. Long-term occurrence of water deficiency conditions was 32.7% of the growing season months, for a mean of 2.0 water deficient months per growing season (Manske et al. 2010).
5 Temperature ( C) Precipitation (mm) 0 0 (20) (50) Jan Mar Feb May Apr Jun Jul Sep Aug Oct Nov Dec Temperature Precipitation Fig. 1. Ombrothermic diagram of long-term ( ) mean monthly temperature and monthly precipitation at Dickinson, North Dakota.
6 Growing Season Precipitation-Dickinson The Study The growing season precipitation during 1940 to 1949 was inches (111.88% of LTM). The growing season precipitation during was inches (136.52% of LTM). The growing season precipitation during was inches (87.32% of LTM). The last 5 years of the 1940's decade received 24.6% less precipitation than the first 5 years. Growing season precipitation of 1946 was inches (87.47% of LTM). April through July precipitation was 81.95% of LTM and August through October precipitation was % of LTM. Growing season precipitation of 1947 was inches (125.50% of LTM). April through July precipitation was % of LTM and August through October precipitation was 97.73% of LTM (table 1). Mean growing season precipitation of was inches (106.49% of LTM). The 1946 and 1947 growing seasons experienced 3.5 and 2.5 months of water deficiency conditions, respectively. The Study Mean growing season precipitation of was inches (94.96% of LTM) with 38.5% of the months in water deficiency. Two growing seasons, 1958 and 1960, received precipitation at less than 75% of LTM. One growing season, 1957, received precipitation at greater than 125% of LTM. One growing season, 1962, received precipitation at greater than 100% of LTM (table 2). Six growing seasons, 1955, 1956, 1958, 1959, 1960, and 1961, had 2.5 or greater months in water deficiency. Two growing seasons, 1957 and 1962, had 1.5 or less months in water deficiency (table 3). During this 8 year study July, August, September, and October experienced water deficiency during four or five years (table 3). The Study The mean monthly temperature and monthly precipitation for the perennial plant growing season months from four weather stations, Bowman, Marmarth, Medora, and Trotters, of southwestern North Dakota for 1969 to 1971 were reported by Zaczkowski (1972) and summarized for this report. July and August were the warmest months, with mean temperatures of 68.2 F and 72.4 F, respectively. Mean growing season precipitation of was inches (105.56% of LTM). The growing season of 1970 had the greatest precipitation at inches (122.24% of LTM). The growing season of 1969 had the lowest precipitation at inches (87.47% of LTM) (table 4). During this 3 year study, August experienced 3 years of water deficiency.
7 Table 1. Precipitation in inches and percent of long-term mean for perennial plant growing season months, Dickinson, ND, Long-Term Mean Apr May Jun Jul Aug Sep Oct Growing Season Annual Total % of LTM % of LTM % of LTM
8 Table 2. Precipitation in inches and percent of long-term mean for perennial plant growing season months, Dickinson, ND, Apr May Jun Jul Aug Sep Oct Growing Season Annual Total Long-Term Mean % of LTM % of LTM % of LTM % of LTM % of LTM % of LTM % of LTM % of LTM % of LTM
9 Table 3. Growing season months with water deficiency conditions that caused water stress in perennial plants, Dickinson, ND, % 6 Months APR MAY JUN JUL AUG SEP OCT # Months 15 Apr-15 Oct # %
10 Table 4. Three year mean monthly temperature and mean monthly precipitation for perennial plant growing season months from four weather stations, Bowman, Marmarth, Medora, and Trotters, of southwestern North Dakota, 1969 to Apr May Jun Jul Aug Sep Oct Mean Temperature F Mean Precipitation Growing Season Data from Zaczkowski Long-Term Weather-DREC ranch The NDSU Dickinson Research Extension Center ranch is located in Dunn county in western North Dakota, at 47 14' north latitude, ' west longitude. Mean annual temperature is 42.3 F (5.7 C). January is the coldest month, with mean temperature of 14.6 F (-9.7 C). July and August are the warmest months, with mean temperatures of 69.7 o F (20.9 o C) and 68.6 o F (20.3 o C), respectively. Long-term ( ) mean annual precipitation is inches ( mm). The perennial plant growing season precipitation (April to October) is inches ( mm) and is 83.6% of annual precipitation. June has the greatest monthly precipitation, at 3.27 inches (83.08 mm). The precipitation received during the 3-month period of May, June, and July (8.26 inches, mm) accounts for 48.8% of the annual precipitation (Manske 2013). Water deficiency months were identified from historical temperature and precipitation data by the ombrothermic diagram technique (Emberger et al. 1963). The long-term ( ) ombrothermic diagram (figure 2) shows near water deficiency conditions during August and September when water deficiency reoccurred 54.8% and 58.1% of the years and shows favorable water relations during April, May, June, July, and October with reoccurrence of water deficiency conditions at 16.1%, 9.7%, 9.7%, 35.5%, and 35.5% of the years, respectively. Longterm occurrence of water deficiency conditions was 32.3% of the growing season months, for a mean of 2.0 water deficient months per growing season (Manske 2013).
11
12 Growing Season Precipitation-DREC ranch Autecological studies on prairie plants extend from 1983 to 2012 on the DREC ranch. The growing season precipitation information has been grouped into 5 and 6 year periods. Mean growing season precipitation of was inches (96.18% of LTM) with 33.3% of the months in water deficiency. None of the growing seasons received precipitation at less than 75% of LTM. One growing season, 1986, received precipitation at greater than 125% of LTM (table 5). Two growing seasons, 1984 and 1987, had greater than 2.0 months in water deficiency. Three growing seasons, 1983, 1985, and 1986, had less than 2.0 months in water deficiency (table 11). Mean growing season precipitation during the forb, and shrub and subshrub autecology study period was inches (86.66% of LTM) with 33.3% of the months in water deficiency Mean growing season precipitation of was low at 9.65 inches (68.29% of LTM) with 51.7% of the months in water deficiency. All of the growing seasons received precipitation at less than 90% of LTM. One growing season, 1988, received precipitation at less than 40% of LTM. One growing season, 1992, received precipitation at less than 75% of LTM (table 6). All of the growing seasons, , had 2.0 or greater months in water deficiency (table 11). The growing season of 1988 had 5.0 months in water deficiency which was the second greatest water deficiency since The growing seasons of 1936 had 5.5 months in water deficiency and 1934 had 4.5 months in water deficiency (Manske et al. 2010). Mean growing season precipitation during the grass autecology study period of was inches (84.79% of LTM) with 42.8% of the months in water deficiency Mean growing season precipitation of was inches (108.28% of LTM) with 30.6% of the months in water deficiency. None of the growing seasons received precipitation at less than 75% of LTM. One growing season, 1998, received precipitation at greater than 125% of LTM. Three growing seasons, 1993, 1995, and 1997, received precipitation at greater than 100% of LTM (table 7). Three growing seasons, 1993, 1994, and 1995, had 2.0 or greater months in water deficiency. Three growing seasons, 1996, 1997, and 1998, had less than 2.0 months in water deficiency (table 11) Mean growing season precipitation of was inches (110.12% of LTM) with 20.0% of the months in water deficiency. None of the growing seasons received precipitation at less than 75% of LTM. One growing season, 2002, received precipitation at greater than 125% of LTM. Three growing seasons, 1999, 2000, and 2001, received precipitation at greater than 100% of LTM (table 8). One growing season, 2001, had greater then 2.0 months in water deficiency. Four growing seasons, 1999, 2000, 2002, and 2003, had 1.0 or less months in water deficiency (table 11) Mean growing season precipitation of was inches (98.51% of LTM) with 37.5% of the months in water deficiency. None of the growing seasons received precipitation at less than 75% of LTM and none at greater than 125% of LTM. Three growing seasons, 2005, 2006, and 2009, received precipitation at greater than 100% of LTM (table 9). Three growing seasons, 2005, 2007, and 2008, had 3.0 or greater months in water deficiency. One growing season, 2009, had 2.0 months in water deficiency. Two growing seasons, 2004 and 2006, had 1.0 month in water deficiency (table 11) Mean growing season precipitation of was inches (112.60% of LTM) with 22.2% of the months in water deficiency. None of the growing seasons received precipitation at less than 75% of LTM. One growing season, 2011, received precipitation at greater than 125% of LTM. One growing season, 2010, received precipitation at greater than 100% of LTM (table 10). One growing season, 2012, had 2.0 months in water deficiency. Two growing seasons, 2010 and 2011, had less than 2.0 months in water deficiency (table 11) Mean growing season precipitation during the long-term change in prairie species abundance study of was inches (98.38% of LTM) with 33.3% of the months in water deficiency. Two growing seasons (6.7%) received precipitation at less than 75% of LTM. Four growing seasons (13.3%) received precipitation at greater than 125% of LTM. Ten growing seasons (33.3%) received precipitation at greater than 100% of LTM. Sixteen growing seasons (53.3%) had 2.0 or greater months in water deficiency. Ten growing seasons (33.3%)
13 had 1.0 or less months in water deficiency. No growing seasons had zero months in water deficiency. Three growing seasons before and after this study, 1982, 2013, and 2015, had zero months in water deficiency (Manske 2016). During , water deficiency during August and September reoccurred at 56.7% and 60.0% of the years, respectively. Water deficiency during April, May, June, July and October reoccurred at 16.7%, 10.0%, 10.0%, 36.7%, and 36.7% of the years, respectively (table 12).
14 Table 5. Precipitation in inches and percent of long-term mean for perennial plant growing season months, DREC ranch, Apr May Jun Jul Aug Sep Oct Growing Season Annual Total Long-Term Mean % of LTM % of LTM % of LTM % of LTM % of LTM % of LTM
15 Table 6. Precipitation in inches and percent of long-term mean for perennial plant growing season months, DREC ranch, Apr May Jun Jul Aug Sep Oct Growing Season Annual Total Long-Term Mean % of LTM % of LTM % of LTM % of LTM % of LTM % of LTM
16 Table 7. Precipitation in inches and percent of long-term mean for perennial plant growing season months, DREC ranch, Apr May Jun Jul Aug Sep Oct Growing Season Annual Total Long-Term Mean % of LTM % of LTM % of LTM % of LTM % of LTM % of LTM % of LTM
17 Table 8. Precipitation in inches and percent of long-term mean for perennial plant growing season months, DREC ranch, Apr May Jun Jul Aug Sep Oct Growing Season Annual Total Long-Term Mean % of LTM % of LTM % of LTM % of LTM % of LTM % of LTM
18 Table 9. Precipitation in inches and percent of long-term mean for perennial plant growing season months, DREC ranch, Apr May Jun Jul Aug Sep Oct Growing Season Annual Total Long-Term Mean % of LTM % of LTM % of LTM % of LTM % of LTM % of LTM % of LTM
19 Table 10. Precipitation in inches and percent of long-term mean for perennial plant growing season months, DREC ranch, Apr May Jun Jul Aug Sep Oct Growing Season Annual Total Long-Term Mean % of LTM % of LTM % of LTM % of LTM
20 Table 11. Growing season months with water deficiency conditions that caused water stress in perennial plants, DREC ranch, % 6 Months APR MAY JUN JUL AUG SEP OCT # Months 15 Apr-15 Oct # % # % # %
21 Table 11 (cont.). Growing season months with water deficiency conditions that caused water stress in perennial plants, DREC ranch, % 6 Months APR MAY JUN JUL AUG SEP OCT # Months 15 Apr-15 Oct # % # % # %
22 Table 12. Growing season months with water deficiency, DREC ranch, Apr May Jun Jul Aug Sep Oct # Months % 6 Months 15 Apr-15 Oct Total % of 30 Years
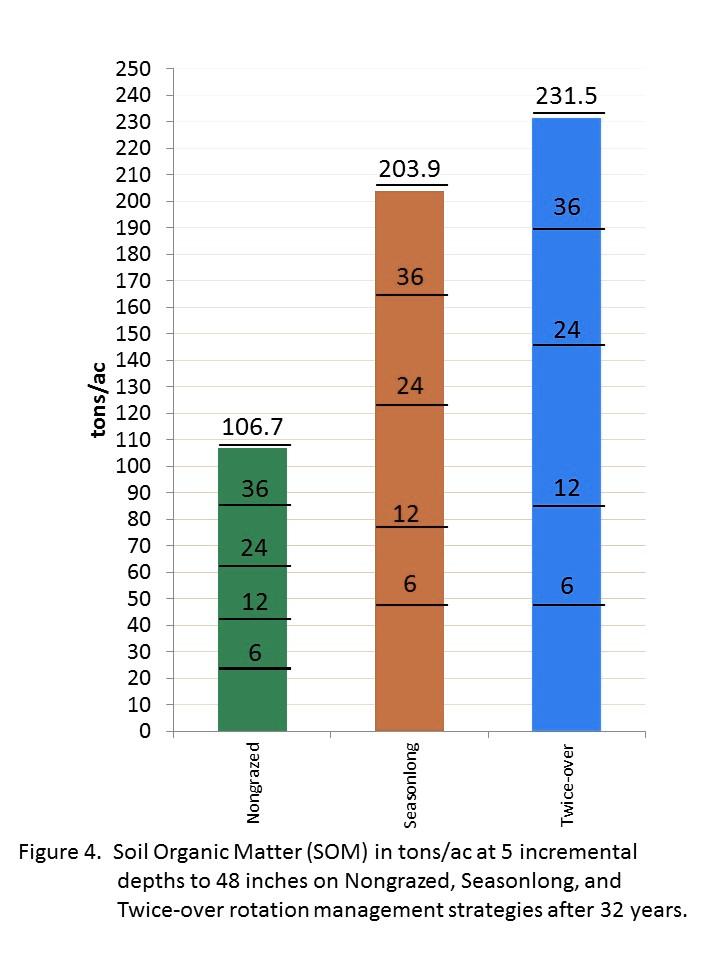
23 Treatments at the DREC ranch The native rangeland study sites were on the Dickinson Research Extension Center (DREC) ranch, operated by North Dakota State University (NDSU), and located in Dunn County, 20 miles north of Dickinson, in western North Dakota, USA. Effects from three management treatments were evaluated 1) long-term nongrazed control, 2) 4.5-month seasonlong, and 3) 4.5-month twice-over rotation system. Each management treatment was replicated two times. The long-term nongrazed control management treatment was designed with large exclosures that contained vegetation that had not been defoliated by grazing, mowing, or burning. The 4.5-month seasonlong grazing system was the traditional management treatment. A single pasture was grazed for 137 days from early June to mid October stocked at 2.86 acres per cow-calf pair per month. The 4.5-month twice-over rotation grazing system was the biologically effective treatment with the partial defoliation periods coordinated with the grass phenological growth stages. A set of three pastures were grazed for a total of 137 days from early June to mid October stocked at 2.20 acres per cow-calf pair per month. Each pasture was grazed for two periods, one 15-day period between 1 June and 15 July (when lead tillers of grasses were between the 3.5 new leaf stage and flowering stage) and one 30-day period between 15 July (after secondary tillers of grasses reached the 3.5 new leaf stage) and mid October. The first pasture grazed in the sequence was the last pasture grazed the previous year. First year, A, B, C; second year C, A, B; third year B, C, A; and then repeat first year. The effects from each of the three management treatments were evaluated on sandy, shallow, and silty ecological sites. Permanent sample plots were established within the long-term nongrazed exclosures. On the two grazed treatments, permanent sample plots were organized in a paired plot design with one plot grazed and the other plot ungrazed that was protected by a 16' X 32' (4.88 m X 9.75 m ) stock panal exclosure to prevent access by livestock. Soil Biological Activity The below ground biological activities were extremely dissimilar for the three management treatments causing differential effects on the individual prairie plant species. Rhizosphere volume associated with perennial grass roots was determined from two replicated intact soil cores from silty ecological sites collected monthly during The volume of each rhizosphere around every grass root was determined by measuring the length and diameter with a vernier caliper. The rhizosphere volume on the three management treatments were not different during June. During August and September, the rhizosphere volumes were not different on the nongrazed and seasonlong treatments at cm 3 /m 3 and cm 3 /m 3, respectively, however, the rhizosphere volume had been significantly increased at cm 3 /m 3 on the twice-over rotation treatment by the stimulation during the first grazing period (figure 3). The greater volume of rhizosphere on the twice-over treatment resulted in a greater biomass of bacteria, protozoa, endomycorrhizal fungi, and ectomycorrhizal fungi (Manske 2011a). These two types of soil fungi secrete great quantities of adhesive polysaccharides that bond soil particles into aggregates resulting in increased soil pore spaces, increased rooting depth, and increased water holding capacity. The twice-over rotation treatment had greater quantities of infiltrated soil water than the seasonlong and nongrazed treatments. Soil water was determined monthly by the gravimetric procedure. Mean growing season infiltrated soil water (0-48 inches) on the twice-over treatment ( ) was 2.72 inches (44.0%) greater and significantly different than that on the nongrazed treatment and was 1.38 inches (18.4%) greater and not significantly different than that on the seasonlong treatment. Mean growing season soil water (0-48 inches) on the seasonlong treatment was 1.34 inches (21.7%) greater and not significantly different than that on the nongrazed treatment (table 13). Production of herbage and livestock biomass at biological potential levels on prairie ecosystems depends on the availability of essential elements at the required quantities. The major essential elements are carbon, hydrogen, nitrogen, and oxygen and the minor essential elements are the macronutrients and micronutrients. Productivity of prairie ecosystems degrades (decrease) when output of essential elements is greater than input and productivity aggrades (increase) when input of essential elements is greater than output (Manske 2012). Soil organic matter is the primary nutrient reservoir of prairie ecosystems and contains the major essential elements and most of the minor essential elements (Brady 1974, Van Veen and Paul 1981, Burke et al. 1989). An increase or decrease in
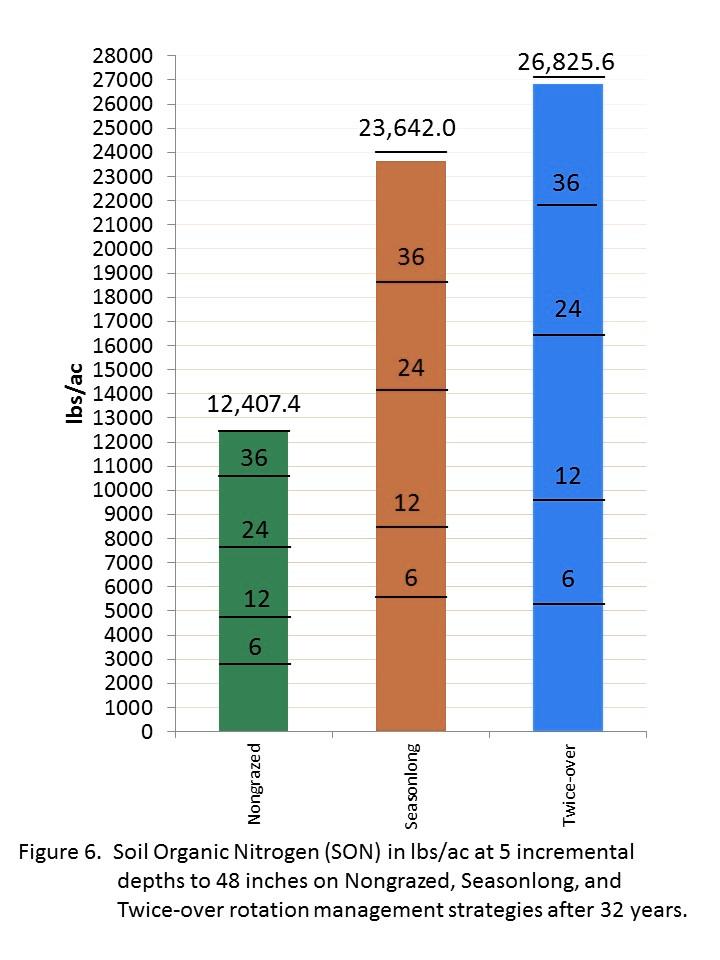
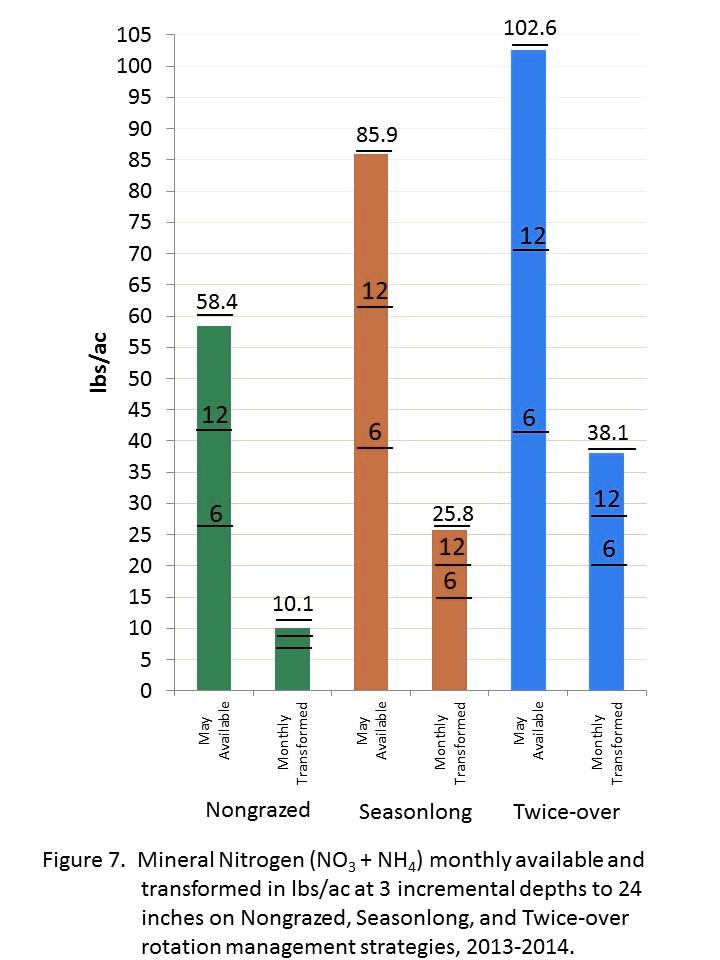
24 the quantity of soil organic matter is a direct indication of soil primary productivity and is a sensitive measure of changes in soil quality and ecosystem functionality (Burke et al. 1989, Gregorich et al. 1994). Percent soil organic matter was determined by analysis of treatment silty soil ( ). Weight of soil organic matter (SOM), soil organic carbon (SOC), and soil organic nitrogen (SON) were determined from the weight of silty soil at incremental depths and the percent organic matter, the percent organic carbon, and the percent organic nitrogen, respectively. The quantities of soil organic parameters on silty ecological sites should have been the same on all three management treatments at the start of these studies in Differences in the organic quantities on the treatments after 32 years would be caused by the effects on the soil microorganism biomass and the ecosystem biogeochemical processes and the resulting affects on soil quality and ecosystems productivity. Soil organic matter (SOM) accumulation on the twice-over treatment was 117.0% greater than that on the nongrazed treatment and was 54.1% greater than that on the seasonlong treatment. Soil organic matter (SOM) accumulation on the seasonlong treatment was 91.1% greater than that on the nongrazed treatment (table 14, figure 4). The twice-over treatment had accumulated 2.3 tons/ac/yr of soil organic carbon (SOC) in 32 years more than the annual amount that accumulated on the nongrazed treatment and accumulated 0.5 tons/ac/yr of SOC more than the annual amount on the seasonlong treatment. The annual accumulation of SOC on the seasonlong treatment was 1.8 tons/ac/yr more than the annual accumulation on the nongrazed treatment (table 14, figure 5). The annual quantity of soil organic nitrogen (SON) accumulation on the twice-over treatment in 32 years was lbs/ac/yr more than the annual amount on the nongrazed treatment and was 99.5 lbs/ac/yr more than the annual amount on the seasonlong treatment. The annual accumualtion of SON on the seasonlong treatment was lbs/ac/yr more than the annual amount on the nongrazed treatment (table 14, figure 6). Soil organic nitrogen (SON) cannot be used by prairie plants. Organic nitrogen must be converted into mineral nitrogen by soil microorganisms. Greater quantities of organic nitrogen can be mineralized to available mineral nitrogen by a larger volume and greater biomass of rhizosphere microorganisms (Coleman et al. 1983, Schimel, Coleman, and Horton 1985). The quantity of available soil mineral nitrogen is the major limiting factor of herbage growth on prairie ecosystems (Wight and Black 1979). A minimum quantity of mineralization of soil organic matter that supplies 100 pounds of mineral nitrogen per acre is required to sustain herbage production at biological potential levels on prairie ecosystems of the Northern Plains (Wight and Black 1972). The quantity of available soil mineral nitrogen (NO 3 nitrate and NH 4 ammonium) varies with changes in soil microorganism biomass and plant phenological growth and development during the growing season (Whitman 1975) and is the net difference between the total quantity of soil organic nitrogen (SON) mineralized by soil microorganisms and the quantity of mineral nitrogen immobilized (transformed) by plants and soil microbes (Brady 1974, Legg 1975). The twice-over treatment was the only treatment that had a large enough rhizosphere volume and microorganism biomass to mineralize nitrogen at greater quantities than the minimum threshold amount of 100 lbs/ac to maintain ecosystem productivity at biological potential levels. The quantity of mineral nitrogen available to the 24 inch soil depth on the nongrazed and seasonlong treatments was 58.4 lbs/ac and 85.9 lbs/ac, respectively, which were 41.6% and 14.1% lower than the minimum quantity required (table 15, figure 7). The lbs/ac of soil mineral nitrogen available on the twice-over treatment was 75.7% and 19.4% greater than the quantities of mineral nitrogen available on the nongrazed and seasonlong treatments, respectively. The quantity of soil mineral nitrogen available on the seasonlong treatment was 47.1% greater than that on the nongrazed treatment (table 15, figure 7). Greater quantities of soil mineral nitrogen transformed indicates greater prairie ecosystem productivity. The mean quantity of mineral nitrogen transformed monthly to organic nitrogen on the twice-over, seasonlong, and nongrazed treatments was 38.1 lbs/ac, 25.8 lbs/ac, and 10.1 lbs/ac, respectively. The quantity of transformed nitrogen on the twice-over treatment was 277.2% greater than that on the nongrazed treatment and was 48.0% greater than that on the seasonlong treatment. The quantity of transformed nitrogen on the seasonlong treatment was 155.4% greater than that on the nongrazed treatment (figure 7). The twice-over rotation grazing management system is the biologically effective management strategy that is coordinated with grass
25 phenological growth stage and meets the biological requirements of the perennial grass plants and rhizosphere organisms (Manske 1999, 2010b, 2011a). Healthy grass plants capture and fix carbon during photosynthesis and produce carbohydrates in quantities greater than the amount needed for tiller growth and development (Coyne et al. 1995). Partial defoliation of grass tillers that removes about 25% to 33% of the aboveground leaf material at vegetative phenological growth stages between the three and a half new leaf stage and the flower (anthesis) stage (Manske 2009, 2011a) by large grazing graminivores causes greater quantities of exudated material containing simple carbohydrates to be released from the grass tillers through the roots into the rhizosphere (Hamilton and Frank 2001). With the increase in availability of carbon compounds in the rhizosphere, the biomass and activity of the microorganisms increases (Anderson et al. 1981, Curl and Truelove 1986, Whipps 1990). The increase in rhizosphere organism biomass and activity causes greater rates of mineralization of soil organic nitrogen (Coleman et al. 1983, Clarholm 1985, Klein et al. 1988, Burrows and Pfleger 2002, Rillig et al. 2002, Bird et al. 2002,Driver et al. 2005) that results in mineral nitrogen to be available at quantities greater than the threhold amount of 100 lbs/ac (table 15, figure 7). Acknowledgment I am grateful to Sheri Schneider for assistance in the production of this manuscript and for development of the tables and figures.
26
27 Table 13. Mean inches of soil water at incremental depths during the growing season on the silty ecological sites of the three grazing management treatments, Growing Season Months Soil Depth (inches) Apr May Jun Jul Aug Sep Oct Nongrazed Seasonlong Twice-over
28 Table 14. Soil organic matter (SOM), soil organic carbon (SOC), and soil organic nitrogen (SON) at incremental depths during June on silty ecological sites of the three grazing management treatments, Nongrazed Soil Depths (Inches) SOM % tons/ac SOC % tons/ac SON % lbs/ac 2, , , , , , Seasonlong SOM % tons/ac SOC % tons/ac SON % lbs/ac 5, , , , , , Twice-over SOM % tons/ac SOC % tons/ac SON % lbs/ac 5, , , , , ,825.62
29

30
31
32 Table 15. Available mineral nitrogen, nitrate (NO 3 ) and ammonium (NH 4 ), in lbs/ac at 0-24 inch soil depth during the growing season on silty ecological sites of the three grazing management treatments, Growing Season Months Soil Depth 0-24 inches May Jun Jul Aug Sep Oct Nongrazed NO 3 nitrate NH 4 ammonium NO 3 + NH Seasonlong NO 3 nitrate NH 4 ammonium NO 3 + NH Twice-over NO 3 nitrate NH 4 ammonium NO 3 + NH
33
Plant Water Stress Frequency and Periodicity in Western North Dakota
 Plant Water Stress Frequency and Periodicity in Western North Dakota Llewellyn L. Manske PhD, Sheri Schneider, John A. Urban, and Jeffery J. Kubik Report DREC 10-1077 Range Research Program Staff North
Environmental Factors to Consider during Planning of Management for Range Plants in the Dickinson, North Dakota, Region,
 Environmental Factors to Consider during Planning of Management for Range Plants in the Dickinson, North Dakota, Region, 1892-21 Llewellyn L. Manske PhD Range Scientist North Dakota State University Dickinson
Autecology of Broom Snakeweed on the Northern Mixed Grass Prairie
 Autecology of Broom Snakeweed on the Northern Mixed Grass Prairie Llewellyn L. Manske PhD Research Professor of Range Science North Dakota State University Dickinson Research Extension Center Report DREC
Range Plant Growth Related to Climatic Factors of Western North Dakota,
 Range Plant Growth Related to Climatic Factors of Western North Dakota, 1982-2016. Llewellyn L. Manske PhD Research Professor North Dakota State University Dickinson Research Extension Center Report DREC
Autecology of Hood s Phlox on the Northern Mixed Grass Prairie
 Autecology of Hood s Phlox on the Northern Mixed Grass Prairie Llewellyn L. Manske PhD Research Professor of Range Science North Dakota State University Dickinson Research Extension Center Report DREC
Range Plant Growth Related to Climatic Factors of Western North Dakota,
 Range Plant Growth Related to Climatic Factors of Western North Dakota, 1982-2014. Llewellyn L. Manske PhD Research Professor North Dakota State University Dickinson Research Extension Center Report DREC
Grass Plant Responses to Defoliation
 Grass Plant Responses to Defoliation Llewellyn L. Manske PhD Range Scientist North Dakota State University Dickinson Research Extension Center Management of grassland ecosystems has customarily been applied
Evaluation of Plant Species Shift on Fertilized Native Rangeland
 Evaluation of Plant Species Shift on Fertilized Native Rangeland Report DREC 09-1011 Llewellyn L. Manske PhD Range Scientist North Dakota State University Dickinson Research Extension Center Nitrogen fertilization
Proactive Management of Native Rangeland. Study Areas
 Proactive Management of Native Rangeland Management of native rangeland is in a prolonged period of transformation from using the old concepts of increaser and decreaser species and plant community succession
Biologically Effective Grazing Management
 Biologically Effective Grazing Management Llewellyn L. Manske PhD Range Scientist North Dakota State University Dickinson Research Extension Center Beneficial Relationships of Grazing and Grass Growth
CONTENTS VOLUME 2. Groundplum Astragulus crassicarpus Missouri milkvetch Astragulus missouriensis... 11
 CONTENTS VOLUME 2 Magnoliopsida (Dicots) Fabaceae (Legume) Groundplum Astragulus crassicarpus.................... 2 Missouri milkvetch Astragulus missouriensis.................. 11 Purple prairieclover
Energy Systems, Structures and Processes Essential Standard: Analyze patterns of global climate change over time Learning Objective: Differentiate
 Energy Systems, Structures and Processes Essential Standard: Analyze patterns of global climate change over time Learning Objective: Differentiate between weather and climate Global Climate Focus Question
Soil Mineral Nitrogen Increased Above the Threshold Quantity of 100 Pounds per Acre in Rangeland Ecosystems
 Soil Mineral Nitrogen Increased Above the Threshold Quantity of 100 Pounds per Acre in Rangeland Ecosystems Report DREC 11-3056 Llewellyn L. Manske PhD Ran ge Scientist North Dakota State University Dickinson
Degradation and Biological Restoration of Mixed Grass Prairie Ecosystems
 Degradation and Biological Restoration of Mixed Grass Prairie Ecosystems Llewellyn L. Manske PhD Research Professor of Range Science North Dakota State University Dickinson Research Extension Center Report
Weather and Climate Change
 Weather and Climate Change What if the environmental lapse rate falls between the moist and dry adiabatic lapse rates? The atmosphere is unstable for saturated air parcels but stable for unsaturated air
Drought in Southeast Colorado
 Drought in Southeast Colorado Nolan Doesken and Roger Pielke, Sr. Colorado Climate Center Prepared by Tara Green and Odie Bliss http://climate.atmos.colostate.edu 1 Historical Perspective on Drought Tourism
ZUMWALT WEATHER AND CLIMATE ANNUAL REPORT ( )
") ZUMWALT WEATHER AND CLIMATE ANNUAL REPORT (26-29) FINAL DRAFT (9 AUGUST 21) J.D. HANSEN 1, R.V. TAYLOR 2, AND V.S. JANSEN 3 INTRODUCTION The Zumwalt Prairie in northeastern Oregon is a unique grassland
ZUMWALT WEATHER AND CLIMATE ANNUAL REPORT (26-29) FINAL DRAFT (9 AUGUST 21) J.D. HANSEN 1, R.V. TAYLOR 2, AND V.S. JANSEN 3 INTRODUCTION The Zumwalt Prairie in northeastern Oregon is a unique grassland
Variability of Reference Evapotranspiration Across Nebraska
 Know how. Know now. EC733 Variability of Reference Evapotranspiration Across Nebraska Suat Irmak, Extension Soil and Water Resources and Irrigation Specialist Kari E. Skaggs, Research Associate, Biological
Weather and Climate of the Rogue Valley By Gregory V. Jones, Ph.D., Southern Oregon University
 Weather and Climate of the Rogue Valley By Gregory V. Jones, Ph.D., Southern Oregon University The Rogue Valley region is one of many intermountain valley areas along the west coast of the United States.
2003 Moisture Outlook
 2003 Moisture Outlook Nolan Doesken and Roger Pielke, Sr. Colorado Climate Center Prepared by Tara Green and Odie Bliss http://climate.atmos.colostate.edu Through 1999 Through 1999 Fort Collins Total Water
Monthly Long Range Weather Commentary Issued: APRIL 18, 2017 Steven A. Root, CCM, Chief Analytics Officer, Sr. VP,
 Monthly Long Range Weather Commentary Issued: APRIL 18, 2017 Steven A. Root, CCM, Chief Analytics Officer, Sr. VP, sroot@weatherbank.com MARCH 2017 Climate Highlights The Month in Review The average contiguous
2. PHYSICAL SETTING FINAL GROUNDWATER MANAGEMENT PLAN. 2.1 Topography. 2.2 Climate
 FINAL GROUNDWATER MANAGEMENT PLAN 2. PHYSICAL SETTING Lassen County is a topographically diverse area at the confluence of the Cascade Range, Modoc Plateau, Sierra Nevada and Basin and Range geologic provinces.
Climate Change Impact on Air Temperature, Daily Temperature Range, Growing Degree Days, and Spring and Fall Frost Dates In Nebraska
 EXTENSION Know how. Know now. Climate Change Impact on Air Temperature, Daily Temperature Range, Growing Degree Days, and Spring and Fall Frost Dates In Nebraska EC715 Kari E. Skaggs, Research Associate
Grazing Treatment Effects on Vegetative Tillering and Soil Rhizospheres of Western Wheatgrass
 Grazing Treatment Effects on Vegetative Tillering and Soil Rhizospheres of Western Wheatgrass Michelle M. Gorder 1, Llewellyn L. Manske 2, and Tobias L. Stroh 1 1 Dickinson State University, Department
Colorado s 2003 Moisture Outlook
 Colorado s 2003 Moisture Outlook Nolan Doesken and Roger Pielke, Sr. Colorado Climate Center Prepared by Tara Green and Odie Bliss http://climate.atmos.colostate.edu How we got into this drought! Fort
Monthly Long Range Weather Commentary Issued: APRIL 1, 2015 Steven A. Root, CCM, President/CEO
 Monthly Long Range Weather Commentary Issued: APRIL 1, 2015 Steven A. Root, CCM, President/CEO sroot@weatherbank.com FEBRUARY 2015 Climate Highlights The Month in Review The February contiguous U.S. temperature
Monthly Long Range Weather Commentary Issued: February 15, 2015 Steven A. Root, CCM, President/CEO
 Monthly Long Range Weather Commentary Issued: February 15, 2015 Steven A. Root, CCM, President/CEO sroot@weatherbank.com JANUARY 2015 Climate Highlights The Month in Review During January, the average
National Wildland Significant Fire Potential Outlook
 National Wildland Significant Fire Potential Outlook National Interagency Fire Center Predictive Services Issued: September, 2007 Wildland Fire Outlook September through December 2007 Significant fire
Grazing and Burning Treatment Effects on Soil Mineral Nitrogen and Rhizosphere Volume
 Grazing and Burning Treatment Effects on Soil Mineral Nitrogen and Rhizosphere Volume Llewellyn L. Manske PhD Range Scientist North Dakota State University Dickinson Research Extension Center Insufficient
What is Climate? Understanding and predicting climatic changes are the basic goals of climatology.
 What is Climate? Understanding and predicting climatic changes are the basic goals of climatology. Climatology is the study of Earth s climate and the factors that affect past, present, and future climatic
CLIMATE OF THE ZUMWALT PRAIRIE OF NORTHEASTERN OREGON FROM 1930 TO PRESENT
 CLIMATE OF THE ZUMWALT PRAIRIE OF NORTHEASTERN OREGON FROM 19 TO PRESENT 24 MAY Prepared by J. D. Hansen 1, R.V. Taylor 2, and H. Schmalz 1 Ecologist, Turtle Mt. Environmental Consulting, 652 US Hwy 97,
Champaign-Urbana 1998 Annual Weather Summary
 Champaign-Urbana 1998 Annual Weather Summary ILLINOIS STATE WATER SURVEY Audrey Bryan, Weather Observer 2204 Griffith Dr. Champaign, IL 61820 wxobsrvr@sparc.sws.uiuc.edu The development of the El Nìno
Meteorology. Circle the letter that corresponds to the correct answer
 Chapter 3 Worksheet 1 Meteorology Name: Circle the letter that corresponds to the correct answer 1) If the maximum temperature for a particular day is 26 C and the minimum temperature is 14 C, the daily
The Climate of Texas County
 The Climate of Texas County Texas County is part of the Western High Plains in the north and west and the Southwestern Tablelands in the east. The Western High Plains are characterized by abundant cropland
Soil Formation. Lesson Plan: NRES B2-4
 Soil Formation Lesson Plan: NRES B2-4 1 Anticipated Problems 1. What are five different factors that affect soil formation? 2. What are some different types of parent material that affect soils? 3. What
Chiang Rai Province CC Threat overview AAS1109 Mekong ARCC
 Chiang Rai Province CC Threat overview AAS1109 Mekong ARCC This threat overview relies on projections of future climate change in the Mekong Basin for the period 2045-2069 compared to a baseline of 1980-2005.
The Climate of Bryan County
 The Climate of Bryan County Bryan County is part of the Crosstimbers throughout most of the county. The extreme eastern portions of Bryan County are part of the Cypress Swamp and Forest. Average annual
Weathering, Erosion, Deposition, and Landscape Development
 Weathering, Erosion, Deposition, and Landscape Development I. Weathering - the breakdown of rocks into smaller particles, also called sediments, by natural processes. Weathering is further divided into
The Climate of Pontotoc County
 The Climate of Pontotoc County Pontotoc County is part of the Crosstimbers. This region is a transition region from the Central Great Plains to the more irregular terrain of southeast Oklahoma. Average
Tropical Moist Rainforest
 Tropical or Lowlatitude Climates: Controlled by equatorial tropical air masses Tropical Moist Rainforest Rainfall is heavy in all months - more than 250 cm. (100 in.). Common temperatures of 27 C (80 F)
CATCHMENT DESCRIPTION. Little River Catchment Management Plan Stage I Report Climate 4.0
 CATCHMENT DESCRIPTION Little River Catchment Management Plan Stage I Report Climate 4. Little River Catchment Management Plan Stage I Report Climate 4.1 4. CLIMATE 4.1 INTRODUCTION Climate is one of the
The Climate of Marshall County
 The Climate of Marshall County Marshall County is part of the Crosstimbers. This region is a transition region from the Central Great Plains to the more irregular terrain of southeastern Oklahoma. Average
Does removal of cattle grazing promote development of stable climax plant communities and preserve prairie grasslands in perpetuity?
 Effects from Long-Term Nongrazing After 75 Years Llewellyn L. Manske PhD Research Professor of Range Science North Dakota State University Dickinson Research Extension Center Does removal of cattle grazing
The Colorado Drought of 2002 in Perspective
 The Colorado Drought of 2002 in Perspective Colorado Climate Center Nolan Doesken and Roger Pielke, Sr. Prepared by Tara Green and Odie Bliss http://climate.atmos.colostate.edu Known Characteristics of
Which map shows the stream drainage pattern that most likely formed on the surface of this volcano? A) B)
 B)") 1. When snow cover on the land melts, the water will most likely become surface runoff if the land surface is A) frozen B) porous C) grass covered D) unconsolidated gravel Base your answers to questions
1. When snow cover on the land melts, the water will most likely become surface runoff if the land surface is A) frozen B) porous C) grass covered D) unconsolidated gravel Base your answers to questions
Local Ctimatotogical Data Summary White Hall, Illinois
 SWS Miscellaneous Publication 98-5 STATE OF ILLINOIS DEPARTMENT OF ENERGY AND NATURAL RESOURCES Local Ctimatotogical Data Summary White Hall, Illinois 1901-1990 by Audrey A. Bryan and Wayne Armstrong Illinois
The Climate of Murray County
 The Climate of Murray County Murray County is part of the Crosstimbers. This region is a transition between prairies and the mountains of southeastern Oklahoma. Average annual precipitation ranges from
Soft stems. Wind pollinated
 Plant Adaptations The temperature in grassland or the prairies are windy, have hot summers and cold winters. Rainfall is uncertain and in the range of about 25-27 cm per year, and drought is common. The
The Climate of Seminole County
 The Climate of Seminole County Seminole County is part of the Crosstimbers. This region is a transition region from the Central Great Plains to the more irregular terrain of southeastern Oklahoma. Average
The Climate of Oregon Climate Zone 5 High Plateau
 105 E55 Unbound issue i". 9 13oes not circulate CZe Special Report 917 May 1993 The Climate of Oregon Climate Zone 5 Property of OREGON STATE UNIVERSITY Library Serials Corvallis, OR 97331-4503 Agricultural
World Geography Chapter 3
 World Geography Chapter 3 Section 1 A. Introduction a. Weather b. Climate c. Both weather and climate are influenced by i. direct sunlight. ii. iii. iv. the features of the earth s surface. B. The Greenhouse
January 25, Summary
 January 25, 2013 Summary Precipitation since the December 17, 2012, Drought Update has been slightly below average in parts of central and northern Illinois and above average in southern Illinois. Soil
Abiotic Structural Components
 1 Module # 10 Component # 2 Abiotic Structural Components Introduction The abiotic aspects of the ecosystem are often neglected in ecological studies. Therefore, this entire component will be devoted to
The Climate of Payne County
 The Climate of Payne County Payne County is part of the Central Great Plains in the west, encompassing some of the best agricultural land in Oklahoma. Payne County is also part of the Crosstimbers in the
The Climate of Haskell County
 The Climate of Haskell County Haskell County is part of the Hardwood Forest. The Hardwood Forest is characterized by its irregular landscape and the largest lake in Oklahoma, Lake Eufaula. Average annual
Monthly Long Range Weather Commentary Issued: APRIL 25, 2016 Steven A. Root, CCM, Chief Analytics Officer, Sr. VP, sales
 Monthly Long Range Weather Commentary Issued: APRIL 25, 2016 Steven A. Root, CCM, Chief Analytics Officer, Sr. VP, sales sroot@weatherbank.com MARCH 2016 Climate Highlights The Month in Review The March
Climatic and Ecological Conditions in the Klamath Basin of Southern Oregon and Northern California: Projections for the Future
 Climatic and Ecological Conditions in the Klamath Basin of Southern Oregon and Northern California: Projections for the Future A Collaborative Effort by: CLIMATE LEADERSHIP INITIATIVE INSTITUTE FOR A SUSTAINABLE
Current Climate Trends and Implications
 Current Climate Trends and Implications Dr. Mark Seeley Professor emeritus Department of Soil, Water, and Climate University of Minnesota St Paul, MN 55108 Crop Insurance Conference September 12, 2018
WHAT CAN MAPS TELL US ABOUT THE GEOGRAPHY OF ANCIENT GREECE? MAP TYPE 1: CLIMATE MAPS
 WHAT CAN MAPS TELL US ABOUT THE GEOGRAPHY OF ANCIENT GREECE? MAP TYPE 1: CLIMATE MAPS MAP TYPE 2: PHYSICAL AND/OR TOPOGRAPHICAL MAPS MAP TYPE 3: POLITICAL MAPS TYPE 4: RESOURCE & TRADE MAPS Descriptions
The Global Scope of Climate. The Global Scope of Climate. Keys to Climate. Chapter 8
 The Global Scope of Climate Chapter 8 The Global Scope of Climate In its most general sense, climate is the average weather of a region, but except where conditions change very little during the course
SEPTEMBER 2013 REVIEW
 Monthly Long Range Weather Commentary Issued: October 21, 2013 Steven A. Root, CCM, President/CEO sroot@weatherbank.com SEPTEMBER 2013 REVIEW Climate Highlights The Month in Review The average temperature
Missouri River Basin Water Management
 Missouri River Basin Water Management US Army Corps of Engineers Missouri River Navigator s Meeting February 12, 2014 Bill Doan, P.E. Missouri River Basin Water Management US Army Corps of Engineers BUILDING
Description DESCRIPTION
 DESCRIPTION The location of the Upper James Watershed is located in northeastern South Dakota as well as southeastern North Dakota. It includes the following counties located in North Dakota Barnes, Dickey,
Chapter Introduction. Earth. Change. Chapter Wrap-Up
 Chapter Introduction Lesson 1 Lesson 2 Lesson 3 Climates of Earth Chapter Wrap-Up Climate Cycles Recent Climate Change What is climate and how does it impact life on Earth? What do you think? Before you
EFFECTS FROM LONG-TERM NONGRAZING AFTER 75 YEARS
 EFFECTS FROM LONG-TERM NONGRAZING AFTER 75 YEARS North Dakota State University Dickinson Research Extension Center 2013 4016a North Dakota State University 2013 Dickinson Research Extension Center Rangeland
Climate Change and Arizona s Rangelands: Management Challenges and Opportunities
 Climate Change and Arizona s Rangelands: Management Challenges and Opportunities Mike Crimmins Climate Science Extension Specialist Dept. of Soil, Water, & Env. Science & Arizona Cooperative Extension
Champaign-Urbana 1999 Annual Weather Summary
 Champaign-Urbana 1999 Annual Weather Summary ILLINOIS STATE WATER SURVEY 2204 Griffith Dr. Champaign, IL 61820 wxobsrvr@sws.uiuc.edu Maria Peters, Weather Observer A major snowstorm kicked off the new
Minnesota s Climatic Conditions, Outlook, and Impacts on Agriculture. Today. 1. The weather and climate of 2017 to date
 Minnesota s Climatic Conditions, Outlook, and Impacts on Agriculture Kenny Blumenfeld, State Climatology Office Crop Insurance Conference, Sep 13, 2017 Today 1. The weather and climate of 2017 to date
Interrelationships. 1. Temperature Wind Fire Rainfall Soil Type Floods Sunlight Altitude Earthquake
 Interrelationships Abiotic Factors A. A Partial List 1. Temperature Wind Fire Rainfall Soil Type Floods Sunlight Altitude Earthquake B. Aquatic Adaptations 1. Pumping salt out a. Salt water fish 2. Pumping
Climate Chapter 19. Earth Science, 10e. Stan Hatfield and Ken Pinzke Southwestern Illinois College
 Climate Chapter 19 Earth Science, 10e Stan Hatfield and Ken Pinzke Southwestern Illinois College The climate system A. Climate is an aggregate of weather B. Involves the exchanges of energy and moisture
NIDIS Intermountain West Drought Early Warning System April 18, 2017
 1 of 11 4/18/2017 3:42 PM Precipitation NIDIS Intermountain West Drought Early Warning System April 18, 2017 The images above use daily precipitation statistics from NWS COOP, CoCoRaHS, and CoAgMet stations.
student pretest Stewardship Project middle school (Grades 7-8)
") student pretest Stewardship Project middle school (Grades 7-8) 1. True or False. Solar energy is radiant energy carried through the sun s heat and light. 2. Yes or No. Does solar energy dissipate as it
student pretest Stewardship Project middle school (Grades 7-8) 1. True or False. Solar energy is radiant energy carried through the sun s heat and light. 2. Yes or No. Does solar energy dissipate as it
AT350 EXAM #1 September 23, 2003
 AT350 EXAM #1 September 23, 2003 Name and ID: Enter your name and student ID number on the answer sheet and on this exam. Record your answers to the questions by using a No. 2 pencil to completely fill
The Climate of Kiowa County
 The Climate of Kiowa County Kiowa County is part of the Central Great Plains, encompassing some of the best agricultural land in Oklahoma. Average annual precipitation ranges from about 24 inches in northwestern
A Report on a Statistical Model to Forecast Seasonal Inflows to Cowichan Lake
 A Report on a Statistical Model to Forecast Seasonal Inflows to Cowichan Lake Prepared by: Allan Chapman, MSc, PGeo Hydrologist, Chapman Geoscience Ltd., and Former Head, BC River Forecast Centre Victoria
National Wildland Significant Fire Potential Outlook
 National Wildland Significant Fire Potential Outlook National Interagency Fire Center Predictive Services Issued: April 1, 2008 Next Issue: May 1, 2008 Wildland Fire Outlook April 2008 through July 2008
Unit E: Basic Principles of Soil Science. Lesson 2: Understanding Soil Formation
 Unit E: Basic Principles of Soil Science Lesson 2: Understanding Soil Formation Important Terms Alluvium Bedrock Chemical weathering Climate Glacial till Loess Native vegetation Organic matter Outwash
The Climate of Grady County
 The Climate of Grady County Grady County is part of the Central Great Plains, encompassing some of the best agricultural land in Oklahoma. Average annual precipitation ranges from about 33 inches in northern
Upper Missouri River Basin February 2018 Calendar Year Runoff Forecast February 6, 2018
 Upper Missouri River Basin February 2018 Calendar Year Runoff Forecast February 6, 2018 Calendar Year Runoff Forecast Explanation and Purpose of Forecast U.S. Army Corps of Engineers, Northwestern Division
Weather and Climate Summary and Forecast January 2018 Report
 Weather and Climate Summary and Forecast January 2018 Report Gregory V. Jones Linfield College January 5, 2018 Summary: A persistent ridge of high pressure over the west in December produced strong inversions
2003 Water Year Wrap-Up and Look Ahead
 2003 Water Year Wrap-Up and Look Ahead Nolan Doesken Colorado Climate Center Prepared by Odie Bliss http://ccc.atmos.colostate.edu Colorado Average Annual Precipitation Map South Platte Average Precipitation
L.O Students will learn about factors that influences the environment
 Name L.O Students will learn about factors that influences the environment Date 1. At the present time, glaciers occur mostly in areas of A) high latitude or high altitude B) low latitude or low altitude
Climate. Annual Temperature (Last 30 Years) January Temperature. July Temperature. Average Precipitation (Last 30 Years)
 January Temperature. July Temperature. Average Precipitation (Last 30 Years)") Climate Annual Temperature (Last 30 Years) Average Annual High Temp. (F)70, (C)21 Average Annual Low Temp. (F)43, (C)6 January Temperature Average January High Temp. (F)48, (C)9 Average January Low Temp.
Climate Annual Temperature (Last 30 Years) Average Annual High Temp. (F)70, (C)21 Average Annual Low Temp. (F)43, (C)6 January Temperature Average January High Temp. (F)48, (C)9 Average January Low Temp.
The Atmosphere. Importance of our. 4 Layers of the Atmosphere. Introduction to atmosphere, weather, and climate. What makes up the atmosphere?
 The Atmosphere Introduction to atmosphere, weather, and climate Where is the atmosphere? Everywhere! Completely surrounds Earth February 20, 2010 What makes up the atmosphere? Argon Inert gas 1% Variable
Presentation Overview. Southwestern Climate: Past, present and future. Global Energy Balance. What is climate?
 Southwestern Climate: Past, present and future Mike Crimmins Climate Science Extension Specialist Dept. of Soil, Water, & Env. Science & Arizona Cooperative Extension The University of Arizona Presentation
Which Earth latitude receives the greatest intensity of insolation when Earth is at the position shown in the diagram? A) 0 B) 23 N C) 55 N D) 90 N
 0 B) 23 N C) 55 N D) 90 N") 1. In which list are the forms of electromagnetic energy arranged in order from longest to shortest wavelengths? A) gamma rays, x-rays, ultraviolet rays, visible light B) radio waves, infrared rays, visible
1. In which list are the forms of electromagnetic energy arranged in order from longest to shortest wavelengths? A) gamma rays, x-rays, ultraviolet rays, visible light B) radio waves, infrared rays, visible
2012 Growing Season Weather Summary for North Dakota. Adnan Akyüz and Barbara A. Mullins Department of Soil Science October 30, 2012
 2012 Growing Season Weather Summary for North Dakota Adnan Akyüz and Barbara A. Mullins Department of Soil Science October 30, 2012 Introduction The 2012 growing season (the period from April through September)
Chapter 6, Part Colonizers arriving in North America found extremely landscapes. It looked different to region showing great.
 Social Studies 9 Unit 1 Worksheet Chapter 6, Part 1. 1. Colonizers arriving in North America found extremely landscapes. It looked different to region showing great. 2. The Earth is years old and is composed
The Climate of Oregon Climate Zone 4 Northern Cascades
 /05 E55 Unbound issue No. 9/ is Does not circulate Special Report 916 May 1993 The Climate of Oregon Climate Zone 4 Property of OREGON STATE UNIVERSITY Library Serials Corvallis, OR 97331-4503 Agricultural
TILT, DAYLIGHT AND SEASONS WORKSHEET
 TILT, DAYLIGHT AND SEASONS WORKSHEET Activity Description: Students will use a data table to make a graph for the length of day and average high temperature in Utah. They will then answer questions based
10/6/ th Grade Ecology and the Environment. Chapter 2: Ecosystems and Biomes
 7 th Grade Ecology and the Environment Chapter 2: Ecosystems and Biomes Lesson 1 (Energy Flow in Ecosystems) Each organism in an ecosystem fills an energy role. Producer an organism that can make its own
Climate Changes due to Natural Processes
 Climate Changes due to Natural Processes 2.6.2a Summarize natural processes that can and have affected global climate (particularly El Niño/La Niña, volcanic eruptions, sunspots, shifts in Earth's orbit,
Extreme Weather and Climate Change: the big picture Alan K. Betts Atmospheric Research Pittsford, VT NESC, Saratoga, NY
 Extreme Weather and Climate Change: the big picture Alan K. Betts Atmospheric Research Pittsford, VT http://alanbetts.com NESC, Saratoga, NY March 10, 2018 Increases in Extreme Weather Last decade: lack
Weather and Climate Summary and Forecast Winter
 Weather and Climate Summary and Forecast Winter 2016-17 Gregory V. Jones Southern Oregon University February 7, 2017 What a difference from last year at this time. Temperatures in January and February
2015 Fall Conditions Report
 2015 Fall Conditions Report Prepared by: Hydrologic Forecast Centre Date: December 21 st, 2015 Table of Contents Table of Figures... ii EXECUTIVE SUMMARY... 1 BACKGROUND... 2 SUMMER AND FALL PRECIPITATION...
Webinar and Weekly Summary February 15th, 2011
 Webinar and Weekly Summary February 15th, 2011 -Assessment of current water conditions - Precipitation Forecast - Recommendations for Drought Monitor Upper Colorado Normal Precipitation Upper Colorado
SEASONAL AND DAILY TEMPERATURES
 1 2 3 4 5 6 7 8 9 10 11 12 SEASONAL AND DAILY TEMPERATURES Chapter 3 Earth revolves in elliptical path around sun every 365 days. Earth rotates counterclockwise or eastward every 24 hours. Earth closest
Range Cattle Research and Education Center January CLIMATOLOGICAL REPORT 2016 Range Cattle Research and Education Center.
 1 Range Cattle Research and Education Center January 2017 Research Report RC-2017-1 CLIMATOLOGICAL REPORT 2016 Range Cattle Research and Education Center Brent Sellers Weather conditions strongly influence
PRELIMINARY DRAFT FOR DISCUSSION PURPOSES
 Memorandum To: David Thompson From: John Haapala CC: Dan McDonald Bob Montgomery Date: February 24, 2003 File #: 1003551 Re: Lake Wenatchee Historic Water Levels, Operation Model, and Flood Operation This
Regents Earth Science Unit 7: Water Cycle and Climate
 Regents Earth Science Unit 7: Water Cycle and Climate Name Section Coastal and Continental Temperature Ranges Lab # Introduction: There are large variations in average monthly temperatures among cities