Proactive Management of Native Rangeland. Study Areas
|
|
|
- Erick Watson
- 5 years ago
- Views:
Transcription
1 Proactive Management of Native Rangeland Management of native rangeland is in a prolonged period of transformation from using the old concepts of increaser and decreaser species and plant community succession for management of just the aboveground components to using the new concepts of defoliation resistance mechanisms and biogeochemical processes for management of all the aboveground and belowground components. The relatively recent inclusion of the biological and physiological mechanisms within plants, the biogeochemcial processes in soils, and the vital role of soil microorganisms in native rangeland ecosystem management is a major paradigm shift that may take longer than two generations of scientists and managers to accomplish. Grass plants, rhizosphere soil microorganisms, defoliation resistance mechanisms, and grassland ecosystem biogeochemical processes all require activation through partial defoliation of grass leaves at vegetative phenological growth stages by grazing graminivores. Grass plants, soil organisms, and graminivores have coevolved complex symbiotic relationships. Large grazing graminivores depend on grass plants for nutritious forage. Grass plants depend on rhizosphere organisms for mineralization of essential elements, primarily nitrogen, from the soil organic matter. The main sources of soil organic matter are grazing animal waste and dead plant material. Rhizosphere organisms depend on grass plants for energy in the form of short carbon chains. Sufficient quantities of short carbon chain energy can be exudated from grass plants through the roots into the rhizosphere with removal of 25% to 33% of the aboveground leaf material by large graminivores while grass lead tillers are between the 3.5 new leaf stage and the flower stage. Grass plants produce double the leaf biomass than is needed for the plants existence to provide nutritious leaf forage to feed the large grazing graminivores. Native rangelands are complex ecosystems consisting of numerous interactive biotic (living) and abiotic (nonliving) components. The biotic components are the plants, soil organisms, and large grazing graminivores that have biological and physiological requirements. The abiotic components include the major and minor essential elements that have transformable characteristics between organic and inorganic forms through biogeochemical processes. The major essential elements are carbon, hydrogen, nitrogen, and oxygen. The minor essential elements consist of seven macrominerals and ten microminerals that are required by most living organisms. The abiotic radiant energy from the sun is also an essential component. Rangeland ecosystems are functioning units of coacting biotic organisms interacting with the abiotic components and the environment. The complex of mechanisms and processes connected with these extensive interactions have been collectively identified as defoliation resistance mechanisms and biogeochemical processes. If any of the numerous processes are not functioning at potential level, the ecosystem does not produce at potential levels. Management of rangeland ecosystems needs to meet the biological and physiological requirements of the biotic components and activate the biogeochemical processes that cycle the abiotic components. Mixed grass prairie communities require biologically effective partial defoliation by annually managed grazing graminivores in order to persist as healthy and productive ecosystems that maintain growing season residuum vegetation structure unfavorable for pestiferous rangeland grasshopper population development. Management of native rangeland favorable for pest grasshoppers should be terminated and management of native rangeland favorable for livestock production and unfavorable for pest grasshopper production needs to be evaluated and implemented. Study Areas The objectives of this research project were to quantitatively describe the changes to vegetation structure during the growing season caused by grazing management practices on native rangeland and to document changes to grasshopper population abundance and composition that resulted from the management caused changes to grasshopper habitat. This collaborative project was conducted from the Range Research Laboratory at the NDSU Dickinson Research Extension Center (DREC), Dickinson, North Dakota, directed by Dr. Llewellyn L. Manske and was responsible for the vegetation data, and conducted from the Rangeland Insect Laboratory at the USDA Agricultural Research Service (ARS), Bozeman, Montana, that was moved mid study to Sidney, Montana, directed by Dr. Jerome A. Onsager and was responsible for the grasshopper data. The initial study sites were located in the North Dakota Grasshopper IPM Demonstration Project Site within the McKenzie County Grazing 123
2 District of the Little Missouri Grasslands, 21 miles (34 km) west of Watford City between 47 35' and 47 50' N. latitude and ' and ' W. longitude, North Dakota. The study sites were provided with the cooperation of the USDA Forest Service and the McKenzie County Grazing Association. The project was funded by the USDA Animal and Health Inspection Service (APHIS), Protection and Quarantine (PPQ), Cooperative Grasshopper Integrated Pest Management (GHIPM) Project during the 1993 and 1994 field seasons. The two research units agreed to continue research project data collection for the field seasons of 1995 to 1998 as separate but cooperative entities. The grasshopper data collection was continued from the USDA-ARS, Sidney, Montana, laboratory on the initial study sites. The vegetation data collection was continued on similar sites located a short distance east in Dunn County at the NDSU Dickinson Research Extension Center ranch, at 46 48' N. latitude and ' W. longitude, near Manning, North Dakota. The native rangeland vegetation at the McKenzie County and Dunn County locations is the Wheatgrass- Needlegrass Type (Barker and Whitman 1989) of the mixed grass prairie. Long-Term Regional Weather The western North Dakota region has cold winters and hot summers typical of continental climates. Mean annual temperature is 40.9 o F (4.9 o C). January is the coldest month, with a mean temperature of 11.5 o F (-11.4 o C). July and August are the warmest months, with mean temperatures of 68.7 o F (20.4 o C) and 67.0 o F (19.5 o C), respectively. Long-term ( ) mean annual precipitation is inches ( mm). The precipitation during the perennial plant growing season (April through October) is inches ( mm) and is 84.5% of the annual precipitation. June has the greatest monthly precipitation, at 3.55 inches (90.14 mm). The precipitation received in the three month period of May, June, and July is 8.13 inches ( mm) and is 50.7% of the annual precipitation (Manske 2011f). Water stress develops in perennial plants during water deficiency periods when the amount of rainfall is less than evapotranspiration demand. Water deficiency months were identified from historical temperature and precipitation data by the ombrothermic diagram technique (Emberger et al. 1963). The long-term ( ) ombrothermic diagram shows near water deficiency conditions during August, September, and October, and favorable water relations during April, May, June, and July. Reoccurrence of water deficiency conditions during April, May, June, and July is 16.9%, 13.6%, 10.2%, and 38.1%, respectively, and during August, September, and October water deficiency reoccurs 52.5%, 50.0%, and 46.6% of the years, respectively. Long-term occurrence of water deficiency conditions is 32.7% of the growing season months, for a mean of 2.0 water deficient months per growing season (Manske et al. 2010). Growing Season Precipitation Growing season (April to September) precipitation for the McKenzie County study sites was taken from the Watford City ndawn weather station and reported by Onsager 2000 (table 46). Long-term (31 years) annual precipitation for the area was inches ( mm). Growing season precipitation for 1993 and 1995 was above normal. Growing season precipitation for 1994 and 1996 was below normal and for 1997 and 1998 conditions were dry with perennial plants under water stress some of the time. The growing season conditions progressively became warmer and dryer during the six years of data collection at the McKenzie County study sites. Precipitation for the perennial plant growing season months (April through October) for the Dunn County study sites was taken from the DREC ranch weather station and reported by Manske 2013 (table 47). Long-term (31 years) annual precipitation for the area was inches ( mm). Growing season precipitation for 1993 to 1997 was normal each year and was above normal for Water deficiency conditions occurred during August, September, and October in 1993; July, August, and September in 1994; June and September in 1995; April and October in 1996; August in 1997; and April and September in Management Treatments Two native rangeland grazing management treatments were established at the McKenzie County location on allotments with previously existing grazing practices. The management treatments were a seasonlong grazing system and a twice-over rotation grazing system. The seasonlong grazing system study plots were established on two separate native rangeland areas within one large pasture. Each study plot had two replicated vegetation sample sites. The extremely large pasture had been grazed annually at moderate stocking rates from 1 June to 31 October 124
3 since the McKenzie County Grazing Association had been organized. The pasture was grazed during the same time period in 1993 and 1994, and from 1995 and The seasonlong grazing of native rangeland treatment was sampled for grasshopper population data at two replicated study sites during 1993 to The twice-over rotation grazing system was established on a four pasture allotment that had been managed with the twice-over system since Each pasture had two replicated vegetation sample sites. The four pastures were each grazed during two periods per growing season. The first period was during the 45 day interval from 1 June to 15 July. The second period was during mid July to mid or late October. Cow-calf pairs grazed the four pastures from 1 June to 31 October 1993 and from 1 June to 22 October 1994, and during similar time periods from 1995 to The twice-over grazing on native rangeland treatment was sampled for grasshopper population data at four replicated study sites with one in each pasture during 1993 to Research activity on the grasshopper habitat study continued at two locations during 1994 to The grasshopper population data was collected at the initial study sites on the seasonlong grazing system and on the twice-over grazing system at the McKenzie County locations. The vegetation data was collected on similar study sites managed with a seasonlong grazing system and with a twice-over rotation grazing system at the Dunn County locations. The seasonlong grazing system on native rangeland was designed with two replicated pastures. Each pasture had vegetation sample plots on a silty ecological site. Each pasture was grazed for 137 days from early June stocked at 2.86 acres per cow-calf pair per month. The twice-over rotation grazing system on native rangeland was designed with two replicated systems each with three pastures. Each pasture had vegetation sample plots on a silty ecological site. Each pasture was grazed two times per growing season. Each system was grazed 137 days from early June stocked at 2.04 acres per cow-calf pair per month. After this study, the stocking rate was reduced to 2.2 acres per cow-calf pair per month. Procedures Changes in residuum vegetation structure during the growing season caused by management practices on native rangeland were evaluated by aboveground herbage biomass, plant species basal cover, and bareground area collected at the McKenzie County sites during the growing seasons of 1993 and 1994 and by aboveground herbage biomass and plant species basal cover collected at the Dunn County sites during the growing seasons of 1994 to Aboveground herbage biomass was collected by the standard clipping method (Cook and Stubbendieck 1986). All herbage biomass clipping sites were partially defoliated by the selected management treatment. The reported herbage biomass values represent the residuum vegetation and the regrowth vegetation resulting from the treatment. This study did not establish nondefoliated sample sites that show the vegetation response without the treatment. Clipped herbage material was collected monthly (May, June, July, and August) from five 0.25 m 2 quadrats (frames) during 1993 and from four 0.25 m 2 quadrats during 1994 at each replicated vegetation sample site on the seasonlong grazing system, and on the twice-over rotation grazing system at the McKenzie County research study sites. Clipped herbage material was collected monthly (June, July, August, September, and October) from five 0.25 m 2 quadrats (frames) during 1994 to 1998 at each replicated vegetation sample site on the seasonlong grazing system and on the twice-over rotation grazing system at the Dunn County research study sites. The herbage material in each frame was hand clipped to ground level and sorted in the field by biotype categories: cool season grass, warm season grass, sedges, forbs, standing dead, and litter. The herbage of each biotype category from each frame was placed in labeled paper bags of known weight, oven dried at 140 F (60 C), and weighed. Herbage biomass in pounds per acre and relative composition for each biotype category was determined from the clipping data. Mean monthly herbage biomass for each biotype category was determined for the growing season. species basal cover was determined by the ten-pin point frame method (Cook and Stubbendieck 1986) with 2000 points collected along transect lines at each replicated vegetation sample site during peak growth between mid July and mid August each year. Basal cover plant species data were sorted into biotype categories: cool season grass, warm season grass, sedges, forbs, litter, and bare soil. The bare soil category was the percent mineral soil not covered by live plants or litter. Basal cover and relative composition of biotype categories were determined from the ten-pin point frame data collected at the McKenzie County research study sites 125
4 during 1993 and 1994, and at the Dunn County research study sites during 1994 to Bareground area was determined with the line intercept method (Canfield 1941, Cook and Stubbendieck 1986) that was modified to measure linear length of intercepted open areas not covered by vegetation canopy. Ten 2000 cm (787.4 in) transect lines were established at each vegetation sample site at the McKenzie County research study sites. Bareground area percentage and combined bareground length of each transect were means of four readings per growing season conducted between June and August of 1993 and Vegetation structure during the growing season resulting from management treatments were evaluated with herbage biomass and basal cover data. The vegetation structure caused by the twice-over rotation grazing system was compared to the vegetation structure caused by the seasonlong grazing system by percent difference data at the McKenzie County research study sites and at the Dunn County research study sites. Grasshopper population density data was collected during 1993 to 1998 at the initial McKenzie County reseach study sites by a team of entomologists directed by Dr. Onsager using methods described by Onsager and Henry (1977). Each grasshopper study site was provided with a set of 40 aluminum wire rings, each 0.1 m 2, affixed to the ground in a 4 X 10 array with 8 meters between rings. Grasshopper populations were sampled at 7 to 10 day intervals during 1993, 1995, and 1998, and at 2 to 3 day intervals during 1994 and Sampling began as soon as the grasshopper study sites were accessible in the spring and terminated after killing frost in the fall. Total density was estimated by counting grasshoppers within each ring of the 40 wire ring array that had a total area of 4 m 2. The field data was converted into grasshopper days (GD) per m 2 which is an index of seasonal abundance for 3 rd instar and older stages. The concept of grasshopper days (GD) is similar to that of animal unit months (AUM). A sweep net collection was taken along the perimeter of the 40 wire ring array each sampling period to establish composition of the population by species and by stage of development (Onsager 2000). Results The growing season residuum vegetation structure expected to negatively affect pestiferous rangeland grasshopper populations was greater plant herbage biomass, greater live plant basal cover, and reduced bareground areas with open vegetation canopy cover. This study compared the residuum vegetation structure of native rangeland during the growing season on a four pasture twice-over rotation grazing system with that on a seasonlong grazing system at the McKenzie County study sites and compared the residuum vegetation structure during the growing season on a three pasture twice-over rotation grazing system with that on a seasonlong grazing system at the Dunn County study sites. Comparisons of the growing season residuum vegetation structure was evaluated using percent difference data for monthly herbage biomass and mean herbage biomass of the native grass, total live, and standing biomass biotype categories and percent difference data for basal cover of the native grass and total live biotype categories from the seasonlong grazing system and the twice-over rotation grazing system at both the McKenzie County and Dunn County study sites. Bareground area percentage and combined bareground length per 2000 cm transects were evaluated from the native rangeland grazing treatments at the McKenzie County study sites. McKenzie County Study Sites The seasonlong grazing system on native rangeland was grazed from 1 June to 31 October at moderate stocking rates during the 1993 and 1994 growing seasons leaving a mean monthly residual standing biomass of lbs/ac (table 48). During the growing seasons of 1993 and 1994, the aboveground vegetation biomass on the seasonlong grazing system consisted of 31.8% standing dead and litter and 68.2% live herbage. The live herbage biomass was 90.3% native grass (51.2% warm season grass and 39.0% cool season grass), 2.3% sedges, and 7.4% forbs (table 49). The twice-over rotation grazing system on native rangeland was grazed from early June to mid or late October at moderate stocking rates during the 1993 and 1994 growing seasons leaving a mean monthly residual standing biomass of lbs/ac (table 50). During the growing seasons of 1993 and 1994, the aboveground vegetation biomass on the twice-over grazing system consisted of 40.8% standing dead and litter and 59.2% live herbage. The live herbage biomass was 91.1% native grass (78.8% cool season grass and 12.3% warm season grass), 1.0% sedges, and 7.9% forbs (table 51). The mean monthly herbage biomass of the native grass, total live, and standing biomass biotypes 126
5 on the seasonlong grazing system was lbs/ac, lbs/ac, and lbs/ac, respectively (table 48), and on the twice-over grazing system was lbs/ac, lbs/ac, and lbs/ac, respectively (table 50). The twice-over grazing system produced greater live residual herbage biomass than the seasonlong grazing system. The twice-over grazing system produced 37.1% greater native grass biomass, 35.8% greater total live biomass, and 41.9% greater standing herbage biomass than that produced on the seasonlong grazing system (table 52). The standing herbage biomass biotype on the seasonlong grazing system consisted of 72.8% native grass, 31.5% cool season grass, 41.3% warm season grass, 1.9% sedges, 6.0% forbs, and 19.4% standing dead herbage. The standing herbage biomass biotype on the twice-over grazing system consisted of 70.3% native grass, 60.8% cool season grass, 9.5% warm season grass, 0.8% sedges, 6.1% forbs, and 22.9% standing dead herbage. Basal cover during the 1993 and 1994 growing seasons on the seasonlong grazing system of the native grass and total live biotypes was 29.0% and 34.9%, respectively (table 53), and on the twice-over grazing system of the native grass and total live biotypes was 29.2% and 35.8%, respectively (table 54). The basal cover of the native grass biotype was 0.8% greater and of the total live biotype was 2.4% greater on the twice-over grazing system than those on the seasonlong grazing system (table 55). The differences of basal cover on the twice-over grazing system and the seasonlong grazing system were small. Bare soil, or mineral soil not covered by live plants or litter, percentages measured with the ten-pin point frame method was 7.6% and 6.4% on the seasonlong grazing system and on the twice-over grazing system, respectively (tables 53 and 54). The bare soil on the seasonlong grazing system was 20.2% greater than that on the twice-over rotation grazing system. Bareground, or open canopy, area measured with the line intercept method during the 1993 and 1994 growing seasons was 7.4%, 148 cm/2000 cm transect, on the seasonlong grazing system (table 56), and was 7.5%, 150 cm/2000 cm transect, on the twice-over grazing system (table 57). The bareground area on the seasonlong grazing system and on the twice-over grazing system were not different. The residuum vegetation structure resulting from the two grazing management treatments were quite different, with the seasonlong grazing system composed primarily of short warm season grass and upland sedge and with the twice-over rotation grazing system composed primarily of mid height cool season grass. The seasonlong grazing system had shorter height structure with relative cover of 46.3% short grass (table 58), had basal cover composition with 140.8% greater warm season grass and 53.7% greater upland sedge (table 53), and had herbage biomass composition with 315.9% greater warm season grass and 133.3% greater upland sedge (table 49) than those on the twice-over grazing system. The twice-over rotation grazing system had taller height structure with relative cover of 53.8% mid height cool season grass (table 58), had basal cover composition with 47.4% greater cool season grass (table 54), and had herbage biomass composition with 101.8% greater cool season grass (table 51) than those on the seasonlong grazing system. The residuum vegetation structure on the seasonlong grazing system was primarily short grass and sedges and was good pestiferous rangeland grasshopper habitat. The residuum vegetation structure on the twice-over rotation grazing system was primarily mid height cool season grasses and was poor pestiferous rangeland grasshopper habitat. Mean cumulative grasshopper days (GD) per m 2 were significantly greater on the seasonlong grazing system than on the twice-over rotation grazing system (Onsager 2000) (table 59). The seasonlong grazing system had an annual mean of 358 GD for the 9 pestiferous rangeland grasshoppers and had an annual mean of 748 GD for the total of all grasshopper species. The twice-over grazing system had an annual mean of 122 GD for the 9 pestiferous rangeland grasshoppers and had an annual mean of 229 GD for the total of all grasshopper species (table 59). One grasshopper species, Mel sanguinipes, had elevated annual mean grasshopper days per m 2 on both grazing systems with 87 GD on the seasonlong grazing system and 78 GD on the twice-over grazing system (table 59). Population abundance of four grasshopper species, Mel gladstoni, Ope obscura, Enc costalis, and Mel infantilis, increased significantly to annual means of 88 GD, 71 GD, 57 GD, and 26 GD, respectively, on the seasonlong grazing system while remaining at low annual means of 3 GD, 6 GD, 10 GD, and 5 GD, respectively, on the twice-over grazing system (table 59). No grasshopper species 127
6 had population abundance at significantly greater grasshopper days on the twice-over grazing system than on the seasonlong grazing system (Onsager 2000) (table 59). Four grasshopper species, Pho nebrascensis, Mel femurrubrum, Tra kiowa, and Age deorum, had low population abundance on both the seasonlong grazing system and the twice-over grazing system (table 59). Grasshopper populations on the seasonlong grazing system had moderate densities between 3.8/yd 2 and 6.9/yd 2 with monthly forage use between 38.6 lbs/ac and 80.8 lbs/ac during 1993 to 1995 (table 60). Grasshopper populations on the twice-over grazing system had low densities between 1.2/yd 2 and 2.8/yd 2 with monthly forage use between 14.2 lbs/ac and 36.2 lbs/ac during 1993 to 1995 (table 60). Grasshopper population assemblage increased to outbreak levels in 1997 and 1998 on the seasonlong grazing system (figure 4) (Onsager 2000). Grasshopper densities on the seasonlong grazing system increased greatly to 15.4/yd 2 in 1997 with monthly forage use of lbs/ac and densities increased further to 22.4/yd 2 in 1998 with monthly forage use of lbs/ac (table 60). This huge grasshopper population outbreak did not occur on the twice-over rotation grazing system (figure 4) (Onsager 2000). Grasshopper densities on the twice-over grazing system remained low at 1.8/yd 2 in 1997 with monthly forage use of 21.2 lbs/ac and densities increased slightly to 4.7/yd 2 in 1998 with monthly forage use of 47.7 lbs/ac (table 60). The residuum vegetation structure on the seasonlong grazing system was comprised primarily of short stature warm season grass and upland sedge which was the major factor that permitted the grasshopper population assemblages to greatly increase above outbreak levels. The outbreak assemblage consisted of three major species, Enc costalis, Mel gladstoni, and Ope obscura. All three species hatch with intermediate or late groups after early June reducing the development time to hard frost by greater than a month compared to the hatch time of the very early or early groups. In order for grasshopper species that hatch after early June to survive in northern habitats, nymphal development, adult growth and maturation, mating, egg development, and egg deposition needs to progress at near physiological capabilities. Sustentation of these high rates of growth and development depend on the body temperature to be at optimum during most of the daylight hours. Maintaining body temperature at optimum requires readily accessible direct sunlight. In order for late hatching grasshopper populations to increase above outbreak quantities, a huge proportion of the nymphal population must develop to the adult stage at near potential rates and successfully deposit large numbers of eggs during a minimum of two consecutive years. The taller residuum vegetation structure on the twice-over rotation grazing system was comprised primarily of mid height cool season grass that restricted grasshopper access to direct sunlight decreasing the length of time that body temperature could be maintained at optimum levels causing reduction in the rates of growth and development that delayed adult maturation and egg development impeding egg deposition and thus preventing the population assemblage from increasing to outbreak numbers. The vegetation structure on the twice-over grazing system successfully prevented population increases of all the grasshopper species that hatched after early June with the late and intermediate groups and also prevented population increases of the grasshopper species hatching before June with the early group that preferred to bask on bareground (table 59). The vegetation structure on the twice-over grazing system was not fully successful at preventing population increases of the grasshopper species hatching with the early group that were capable of basking both on bareground and on vegetation (table 59). Onsager (2000) determined that nymphal development of the 3 rd instar to the 5 th instar of Mel sanguinipes was significantly slower and required 2.6 days longer for development per instar on the twiceover grazing system with a mean of 11.5 days per instar than that on the seasonlong grazing system with a mean of 8.9 days per instar resulting in a delay of 7.8 days for the appearance of adults on the twiceover grazing system. This delay in nymphal development had a major impact on the proportion of the nymphal population that became adults. The population density counts conducted by Onsager (2000) revealed that the twice-over grazing system with a mean density of 0.60 adults/m 2 (0.5/yd 2 ) produced fewer adult grasshoppers than that produced on the seasonlong grazing system with a mean density of 2.05 adults/m 2 (1.71/yd 2 ). Onsager (2000) gave two explanations that would cause the measured delay in instar development. The vegetation structure on the twice-over grazing system interfered with the amount of direct sunlight reaching the grasshopper microhabitat causing the ambient air 128
7 temperature to become cooler and/or preventing efficient thermoregulation of nymphal body temperature. In addition, Onsager (2000) showed that, although the statistical average daily survival rates for nymphs on the twice-over grazing system and on the seasonlong grazing system were not significantly different, the slightly lower biological survival rate for nymphs on the twice-over grazing system over the longer delayed development time for three instar stages could result in the great difference in the measured densities of adult grasshoppers with 70.7% fewer adult grasshoppers per square meter on the twice-over grazing system than on the seasonlong grazing system. Greatly reduced densities of adult grasshopper would deposit lower quantities of viable eggs that season and produce fewer hatchlings the next growing season. Dunn County Study Sites The seasonlong grazing system on native rangeland was grazed from early June to mid October at a stocking rate of 2.86 ac/aum during the 1994 to 1998 growing seasons leaving a mean monthly residual standing herbage biomass of lbs/ac (table 61). During the growing seasons of 1994 to 1998, the aboveground vegetation biomass on the seasonlong grazing system consisted of 27.5% standing dead and litter and 72.5% live herbage. The live herbage biomass was 66.3% native grass (38.4% cool season grass and 27.6% warm season grass), 24.2% sedges, and 9.6% forbs (table 62). The twice-over rotation grazing system on native rangeland was grazed from early June to mid October at a stocking rate of 2.04 ac/aum during the 1994 to 1998 growing seasons leaving a mean monthly residual standing herbage biomass of lbs/ac (table 63). During the growing seasons of 1994 to 1998, the aboveground vegetation biomass on the twice-over grazing system consisted of 26.2% standing dead and litter and 73.8% live herbage. The live herbage biomass was 70.7% native grass (29.4% cool season grass and 41.3% warm season grass), 18.3% sedges, and 11.0% forbs (table 64). The peak monthly herbage biomass during July of the native grass, total live, and standing biomass biotypes on the seasonlong grazing system was lbs/ac, lbs/ac, and lbs/ac, respectively (table 61), and on the twice-over grazing system was lbs/ac, lbs/ac, and lbs/ac, respectively (table 63). The twice-over grazing system produced greater peak live residual herbage biomass than the seasonlong grazing system. The twice-over grazing system produced 53.0% greater native grass biomass, 35.4% greater total live biomass, and 37.8% greater standing herbage biomass than that produced on the seasonlong grazing system during peak production in July (table 65). The composition of the native grass biotype on the seasonlong grazing system consisted of 58.6% cool season grass and 41.4% warm season grass in July. The composition of the native grass biotype on the twice-over grazing system consisted of 48.2% cool season grass and 51.8% warm season grass in July. The mean monthly herbage biomass of the native grass, total live, and standing biomass biotypes on the seasonlong grazing system was lbs/ac, lbs/ac, and lbs/ac, respectively (table 61), and on the twice-over grazing system was lbs/ac, lbs/ac, and lbs/ac, respectively (table 63). The twice-over grazing system produced greater live residual herbage biomass during the growing season than the seasonlong grazing system. The twice-over grazing system produced 27.7% greater native grass biomass, 19.6% greater total live biomass, and 19.5% greater standing herbage biomass than that produced on the seasonlong grazing system (table 65). The standing herbage biomass biotype on the seasonlong grazing system consisted of 60.7% native grass, 35.5% cool season grass, 25.3% warm season grass, 22.1% sedges, 8.8% forbs, and 8.3% standing dead herbage. The standing herbage biomass biotype on the twice-over grazing system consisted of 64.9% native grass, 27.0% cool season grass, 37.9% warm season grass, 16.8% sedges, 10.1% forbs, and 8.3% standing dead herbage. Basal cover during the 1994 to 1998 growing seasons on the seasonlong grazing system of the native grass, sedges, and total live biotypes was 14.8%, 8.8%, and 26.2%, respectively (table 66), and on the twice-over grazing system of the native grass, sedges, and total live biotypes was 20.7%, 3.6%, and 26.4%, respectively (table 66). The basal cover of the native grass biotype was 39.4% greater and of the total live biotype was 0.8% greater on the twice-over grazing system than on the seasonlong grazing system (table 67). The basal cover of the sedge biotype was 146.1% greater on the seasonlong grazing system than on the twice-over grazing system. The sedge biotype on the seasonlong grazing system composed 24.2% of the live herbage biomass (table 62), and 33.5% of the live basal cover (table 66). The sedge biotype on the twice-over grazing system composed 18.3% of the live herbage biomass (table 64), and 13.5% of the live basal cover (table 66). Bare soil, or mineral soil not covered by live plants or litter, percentages measured with the ten-pin 129
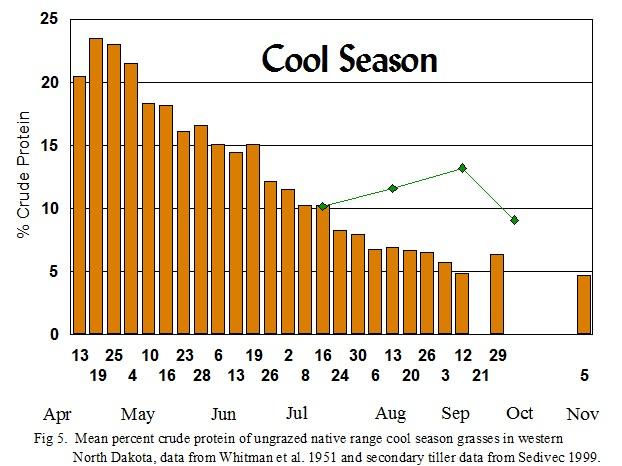
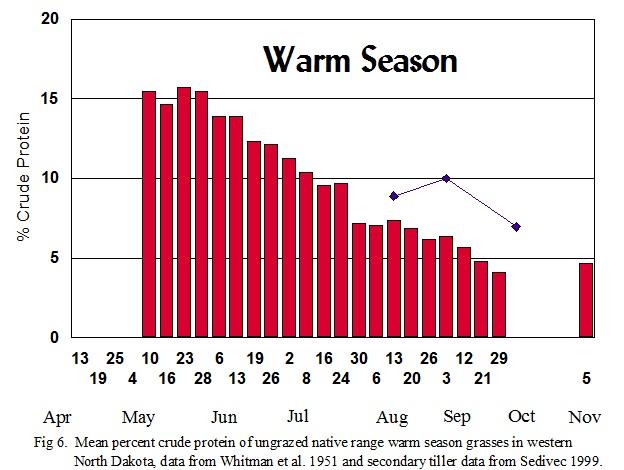
8 point frame method were low at 1.3% and 1.1% on the seasonlong grazing system and on the twice-over grazing system, respectively (table 66). The bare soil on the seasonlong grazing system was 18.2% greater than that on the twice-over rotation grazing system. Grasshopper population density data were not collected on these Dunn County native rangeland research study sites. However, during vegetation data collection, very few grasshoppers were observed on the seasonlong grazing system and on the twice-over grazing system. The small quantity of grasshoppers present were not a problem. Furthermore, the growing season residuum vegetation structure on native rangeland managed with the twice-over rotation grazing strategy produced 27.7% greater native grass herbage biomass, 19.6% greater total live herbage biomass, 19.5% greater standing herbage biomass, and 39.4% greater native grass basal cover than that produced on native rangeland managed with the seasonlong grazing system. Greater activation of the plant defoliation resistance mechanisms and the ecosystem biogeochemical processes on the twice-over grazing system resulted in greater livestock weight gain than on the seasonlong grazing system. During the growing season from early June to mid October, cows and calves gained 9.4 lbs/ac and 33.6 lbs/ac, respectively, on the twice-over grazing system, and cows and calves gained 3.7 lbs/ac and 22.6 lbs/ac, respectively, on the seasonlong grazing system. Cow gains were 157.2% greater and calf gains were 49.2% greater per acre on the twice-over grazing system than on the seasonlong grazing system. Discussion Native rangeland cool season grasses start early leaf greenup in mid April and grow slowly until early May, reaching 59% of the leaf growth in height by mid May. Most cool season grasses reach the three and a half new leaf stage around early June, reach 94% of the leaf growth in height by late June, and 100% of the leaf growth in height by late July. A few early developing cool season grasses start flower stalk development during mid May to early June. The other cool season grasses develop flower stalks during June. The needlegrasses start the flower stage during early June, with most cool season grasses starting to flower before 21 June. Flower stalks reach 94% of the growth in height by late June and 100% of the growth in height by late July when seeds are mature and being shed (Whitman et al. 1951, Goetz 1963, Manske 2000c). The nutritional quality of ungrazed lead tillers of native rangeland cool season grasses changes with the tillers phenological development. Early season growth stages during May have high crude protein levels above 16%. The early vegetative leaf stages contain levels of crude protein above 15% during early to mid June. As seed stalks begin to develop in early June, crude protein levels begin to decrease. At the flower stage, lead tillers contain 15% crude protein. After the flower stage and during the seed development stage, crude protein levels remain above 9.6% until mid July. As the ungrazed lead tillers mature, the fiber content increases and percent crude protein, water, and digestibility decrease. During late July, crude protein levels drop below 8.0% and below 6.5% in late August (figure 5) (Whitman et al. 1951, Manske 2008a). Crude protein levels of grazing activated cool season secondary tillers increase above 9.6% during July and August to 13.2% in early September, decrease during September, and drop below 9.6% in early to mid October (Sedivec 1999, Manske 2008a). Phosphorus levels of lead tillers drop below 0.18% in late July, when plants reach the mature seed stage (Whitman et al. 1951, Manske 2008b). Native rangeland warm season grasses start early leaf greenup in mid May, reaching 44% of the leaf growth in height by early June, and most warm season grasses reach the three and a half new leaf stage around mid June. Warm season grasses reach 85% of the leaf growth in height by late June and reach 100% of the growth in height by late July. Flower stalk development starts during mid June, with the flower stage starting after 21 June. Most warm season grasses reach the flower stage by 15 July. The warm season flower stalks reach 91% of the growth in height by late July and reach 100% growth in height by late August when the seeds are mature and being shed (Whitman et al. 1951, Goetz 1963, Manske 2000c). The nutritional quality of ungrazed lead tillers of native rangeland warm season grasses changes with the tillers phenological development. Early season growth stages during May have high crude protein levels above 15%. The early vegetative leaf stages contain levels of crude above 13% during early to mid June. As seed stalks begin to develop in mid June, crude protein levels begin to decrease. At the flower stage, lead tillers contain 12.2% crude protein. After the flower stage and during the seed development stage, crude protein levels remain above 9.6% until late July. As the ungrazed lead tillers mature, the fiber content increases and percent crude protein, water, and digestibility decrease. During mid 130
9 August, crude protein levels drop below 7.0% and below 6.0% in early September (figure 6) (Whitman et al. 1951, Manske 2008a). Crude protein levels of grazing activated warm season secondary tillers increase above 9.0% during August to 10.0% in early September, decrease during September, and drop below 9.6% in late September (Sedivec 1999, Manske 2008a). Phosphorus levels of lead tillers drop below 0.18% in late August, when plants reach the mature seed stage (Whitman et al. 1951, Manske 2008b). Native rangelands are optimally grazed by large graminivores as summer pastures from 1 June to mid October. Prior to early June, the cool season and warm season grasses are not physiologically capable of full recovery from grazing defoliation. After mid October, the nutritional quality of the herbage from the combination of lead tillers, vegetative tillers, and activated secondary tillers drops below the requirements of lactating beef cows. Biologically effective management of native rangelands places first priority on meeting the biological and physiological requirements of the grass plants, soil organisms, and grazing animals, and to cycle the essential elements. The second priority is the diminishment of the factors that reduce ecosystem productivity and the enhancement of the factors that benefit ecosystem productivity. Perennial grass growth in the Northern Plains is restricted to a 6 month growing season, from mid April to mid October. Native rangeland grasses require 1.5 months of growth in the spring to reach grazing readyness resulting in a 4.5 month grazing season, from early June to mid October. The early greenup of rangeland grass in the spring is not from new seedlings but from vegetative carryover tillers that did not produce a seedhead during the previous growing season. Spring growth of carryover tillers depends both on carbohydrate reserves and on photosynthetic products from the portions of previous years leaves that overwintered without cell wall rupture and regreened with chlorophyll. Grass tiller growth and development depend, in part, on some carbohydrate reserves in early spring because the amount of photosynthetic product synthesized by the green carryover leaves and the first couple of early growing new leaves is insufficient to meet the total requirements for leaf growth (Coyne et al. 1995). Grass growth also requires that the tiller maintains adequate leaf area with a combination of carryover leaves and new leaves to provide photosynthetic product for growth of sequential new leaves. The total nonstructural carbohydrates of a grass tiller are at low levels following the huge reduction of reserves during the winter respiration period, and the carbohydrate reserves remaining in the roots and crowns are needed for both root growth and initial leaf growth during early spring. The low quantity of reserve carbohydrates are not adequate to supply the entire amount required to support root growth and also support leaf growth causing a reduction in active growth until sufficient leaf area is produced to provide the photosynthetic assimilates required for plant growth and other processes (Coyne et al. 1995). Removal of aboveground leaf material from grass tillers not yet at the three and a half new leaf stage deprives tillers of foliage needed for photosynthesis and increases the demand upon already low levels of carbohydrate reserves. Premature grazing results in greatly reduced growth rates of herbage production (Coyne et al. 1995) causing decreased peak herbage biomass later in the growing season (Manske 2000b). Grazing that starts in mid to late May on native rangeland before the tillers reach the 3.5 new leaf stage results in a reduction of 45% to 60% from the potential herbage biomass that growing season (Campbell 1952, Rogler et al. 1962, Manske 2000b). During the growing season, grass growth can be reduced by the environmental factors of inhibiting cool temperatures during the spring and fall and hot temperatures during the summer and by unevenly distributed precipitation. The precipitation received during the three month period, May, June, and July, is 50.7% of the annual precipitation, which is usually accompanied with generally low water deficiency conditions that reoccur with an average monthly rate during each of these three months at 20.6% of the growing seasons, and promotes rapid grass growth and development. Grass growth is limited during the three month period, August, September, and October, when the precipitation received is 25% of the annual amount and water deficiency conditions are usually high and reoccur with an average monthly rate during each of these three months at 49.7% of the growing seasons (Manske et al. 2010, Manske 2011f). Low water infiltration on native rangelands and shallow soil water storage depths aggravate problems of grass plant growth between rain events. Restricted water infiltration increases the proportion of runoff precipitation, decreasing the quantity of water available for plant growth, and reducing the quantity of the effective precipitation. Low water infiltration rates and shallow water storage depths indicate inadequate soil aggregation and low soil fungi biomass. Aggregation of soil develops when an adequate biomass of soil fungi secrete large amounts 131
10 of insoluable extracellular polysaccharids that have adhesive qualities (Caesar-TonThat and Cochran 2000; Caesar-TonThat et al. 2001a, 2001b; Caesar- TonThat 2002; Manske and Caesar-TonThat 2003). Aggregation of soil enlarges soil pore size, improves soil pore distribution, and stabilizes soil particles, resulting in improved water infiltration and increased soil water storage capacity (Caesar-TonThat et al. 2001b, Manske and Caesar-TonThat 2003). Greater soil aggregation increases the effectiveness of the precipitation received, increases the quantity of soil water available for plant growth, and reduces plant growth problems between rain events. Water from precipitation is important for grass growth. However, herbage production in temperate rangelands is more often limited by deficiencies in mineral nitrogen than by water (Tilman 1990). Rangelands deficient in available soil mineral nitrogen produce less than potential quantities of herbage biomass (Wight and Black 1972). Native rangelands with a mineral nitrogen deficiency produce herbage weight per inch of precipitation received at 49.6% below the weight of herbage produced per inch of precipitation on rangeland without a mineral nitrogen deficiency (Wight and Black 1979). Rangeland soils are not deficient of nitrogen. Most of the nitrogen is immobilized in the soil as organic nitrogen. Rangeland soils in the Northern Plains contain about 5 to 6 tons, with a range of 3 to 8 tons, of organic nitrogen per acre. The organic nitrogen is not available for plant use. Soil organic nitrogen must be converted into mineral nitrogen through mineralization by soil microorganisms. The quantity of soil organism biomass is the limiting factor in rangeland ecosystems low in mineral nitrogen. The rhizosphere soil organism biomass and activity are limited by access to short carbon chain energy. The primary producer trophic level in the rhizosphere are achlorophyllous saprophytes and can not fix carbon for energy. Greater quantities of carbon compound energy exudated into the rhizosphere increases the biomass and activity of the soil organisms resulting in increased mineralization of nitrogen, increased biogeochemical cycling of essential elements, and improvements of belowground resource competitiveness (Manske 1999a, 2011b). Mineral nitrogen available at 100 lbs/ac or greater is needed for herbage biomass weight to be produced at ecosystem potential levels (Wight and Black 1972). The three month period, May, June, and July, is the period that receives the greatest amount of rainfall and is the short period of the growing season when grass lead tillers grow the most in height and weight. Cool season grasses develop to the 3.5 new leaf stage by early June and start the flower stage before 21 June. Warm season grasses develop to the 3.5 new leaf stage by mid June and reach the flower stage by mid July. Cool season grass lead tillers drop below 9.6% crude protein during the third week of July and warm season grass lead tillers drop below 9.6% crude protein during the fourth week of July (Manske 2000b, 2000c, 2008a). After mid to late July, native rangeland pastures managed with traditional concepts typically consists of herbage below the nutritional requirements of lactating beef cows. These cows lose body weight and decrease in daily milk production. The calves average daily gain drops below 2.0 pounds per day (Manske 2002). The herbage quality greatly declines on traditionally managed rangeland after July because little replacement leaf and shoot growth takes place and almost no new tiller growth occurs. Beef producers recognize the resulting decrease in cow and calf performance and usually try to compensate for the resulting reduced animal growth rates with nutrient supplementation. However, improvement of the nutritional quality of the herbage to meet the nutritional requirements of lactating beef cows during the latter portion of the grazing season until mid October can be accomplished by activation of the compensatory physiological processes within grazed grass plants that accelerate growth rates of replacement roots, leaves, and shoots, increases photosynthetic capacity of remaining mature leaves, increases allocation of carbon and nitrogen, improves water (precipitation) use efficiency, and increases restoration of biological processes enabling rapid and complete recovery of partially defoliated grass tillers, and by activation of the asexual processes of vegetative reproduction that increases secondary tiller development from axillary buds and increases tiller density during the growing season (Manske 1999a, 2011b). The resulting growth of replacement leaves and shoots and new secondary tillers from activation of the compensatory physiological processes and of the asexual processes of vegetative reproduction improves the nutritional quality of the available herbage during the latter portion of the grazing season above the nutrient requirements of lactating beef cows and supports animal weight performance at near genetic potentials (Manske 2002). Almost every rangeland grass tiller grows during two growing seasons. The lead tillers that produced seed heads terminate at the end of the second growing season. Vegetative tillers that did not 132
11 produce seed heads, activated secondary tillers, and fall initiated tillers that have grown during one growing season survive over the winter on stored carbohydrate reserves and grow again during the next growing season. The quantity of carbohydrates stored during the winter hardening process, that occurs from mid August to hard frost, is closely related to the amount of active leaf material on each tiller during that period. Tillers with abundant leaf area during late summer and early fall can store adequate quantities of carbohydrates to survive the winter and produce robust leaves the following spring. Traditionally managed grazing of grass tillers during mid August to mid October that removes excessive leaf material from carryover tillers causes inadequate quantities of carbohydrates to be stored. s that have low carbohydrate reserves and survive the winter dormancy period produce tillers with reduced height and weight. Some of the tillers with low carbohydrate reserves deplete their stores through winter respiration before spring, causing winter kill of those tillers. Grazing native rangeland after mid October exacerbates these problems causing ecosystem degradation. The factors that reduce ecosystem productivity need not to occur. Management of Native Rangelands There are numerous factors that can negatively effect rangeland ecosystems and could cause reductions in productivity. Most of these negative factors have countermeasures that nullify or supersede the detrimental effects. During the period of 30 to 20 mya following global climate cooling, complex rangeland ecosystems developed as a result of the coevolution among modern native grasses, rhizosphere soil organisms, and large grazing mammalian graminivores. Numerous intricate interactive biological, physiological, and biogeochemical processes developed coincidentally with the coevolutionary creations. The primary processes are: internal compensatory physiological processes, internal asexual processes of vegetative reproduction, external symbiotic rhizosphere organism processes, and ecological biogeochemical processes. These critical processes permit rangeland ecosystems to function at potential levels. Unfortunately, these processes do not automatically function at full potential capacity. These processes require activation and they require adequate availability of carbon, hydrogen, nitrogen, and oxygen. The twice-over rotation grazing management strategy is the biologically effective management practice that activates the beneficial defoliation resistance mechanisms and the biogeochemical processes. Partial defoliation controlled with the twice-over rotation grazing management strategy removes 25% to 33% of the leaf material from grass lead tillers at phenological growth between the three and a half new leaf stage and the flower (anthesis) stage during early June to mid July activates the beneficial processes. Full functionality of the defoliation resistance mechanisms requires mineral nitrogen to be available at 100 lbs/ac or greater and requires the quantity of available carbon fixed through photosynthesis from 75% to 67% of the leaf area of grass lead tillers prior to peak herbage biomass and from 50% of the leaf area post peak biomass (Manske 2010a, 2010b). The twice-over rotation grazing management strategy uses three to six native rangeland pastures. Each of the pastures in the rotation is partially defoliated by grazing for 7 to 17 days during the first period, the 45 day interval from 1 June to 15 July when partial defoliation of grass lead tillers can activate the beneficial defoliation resistance mechanisms and biogeochemical processes. The length in number of days of the first grazing period on each pasture is the same percentage of 45 days as the percentage of the total season s grazable forage each pasture contributes to the complete system. The forage is measured as animal unit months (AUM s) of forage. The number of days grazed are not counted by calendar dates; days grazed are counted by the number of 24 hour periods grazed from the date and time the cattle are turned into a pasture. During the second grazing period, when lead tillers are maturing and defoliation by grazing is only moderately beneficial, the 90 day interval after mid July and before mid October, each pasture is grazed for double the number of days it was grazed during the first period. The pasture grazed first in the rotation sequence during one year is the last pasture grazed during the previous year (Manske 1999a, 2011b). Management of native rangelands requires annual partial defoliation by large grazing graminivores managed by the biologically effective twice-over rotation strategy that coordinates defoliation events with grass phenological growth stages. The twice-over strategy activates the defoliation resistance mechanisms and the biogeochemical processes, and then maintains their functionality at potential levels. The twice-over strategy also meets the biological requirements of the grass plants and the rhizosphere organisms, and meets the nutritional requirements of the grazing animals during the entire grazing season. Biologically effective management of native rangeland ecosystems 133
12 sustains healthy renewable natural resources that simultaneously provide greater forage for livestock, better habitat for prairie wildlife, more aesthetic prairie landscapes for recreation and sightseeing, increased food and fiber for people, and provides greater growing season residuum vegetation structure that is unfavorable habitat for pestiferous rangeland grasshopper population development. 134
13 Table 46. Precipitation during growing season months (April-September), Watford City, ND mm inches Data from Onsager Table 47. Precipitation in inches and percent of long-term mean for perennial plant growing season months, western North Dakota, Years Apr May Jun Jul Aug Sep Oct Growing Season Annual Total Long-Term Mean % of LTM % of LTM % of LTM % of LTM % of LTM % of LTM % of LTM
14 Table 48. Monthly herbage biomass (lbs/ac) for native rangeland managed with the seasonlong system, Biotype May Jun Jul Aug Mean Monthly Native Grass Cool Season Warm Season Sedges Total Forbs Total Live Standing Dead Standing Biomass Litter Total Dead Total Biomass Table 49. Monthly composition (%) of herbage biomass for native rangeland managed with the seasonlong system, Biotype May Jun Jul Aug Mean Monthly Native Grass Cool Season Warm Season Sedges Total Forbs Total Live Standing Dead Standing Biomass Litter Total Dead Total Biomass
15 Table 50. Monthly herbage biomass (lbs/ac) for native rangeland managed with the twice-over rotation system, Biotype May Jun Jul Aug Mean Monthly Native Grass Cool Season Warm Season Sedges Total Forbs Total Live Standing Dead Standing Biomass Litter Total Dead Total Biomass Table 51. Monthly composition (%) of herbage biomass for native rangeland managed with the twice-over rotation system, Biotype May Jun Jul Aug Mean Monthly Native Grass Cool Season Warm Season Sedges Total Forbs Total Live Standing Dead Standing Biomass Litter Total Dead Total Biomass
16 Table 52. Percent difference of monthly herbage biomass on the twice-over rotation system compared to the seasonlong system on native rangeland management, Biotype May Jun Jul Aug Mean Monthly Native Grass Cool Season Warm Season Sedges Total Forbs Total Live Standing Dead Standing Biomass Litter Total Dead Total Biomass
17 Table 53. Basal cover (%) and composition (%) for native rangeland managed with the seasonlong system, Biotype Basal Cover % Composition % Native Grass Cool Season Warm Season Sedges Total Forbs Total Live Litter Bare Soil 7.63 Table 54. Basal cover (%) and composition (%) for native rangeland managed with the twice-over rotation system, Biotype Basal Cover % Composition % Native Grass Cool Season Warm Season Sedges Total Forbs Total Live Litter Bare Soil
18 Table 55. Percent difference of basal cover on the twice-over rotation system compared to the seasonlong system of native rangeland management, Biotype Difference % Native Grass 0.83 Cool Season Warm Season Sedges Total Forbs Total Live 2.38 Litter
19 Table 56. Bareground area on native rangeland managed with the seasonlong system as mean of twenty 2000 cm (787.4 in) transects. Bareground Size Percent Area Bareground Combined Length cm in % cm in Table 57. Bareground area on native rangeland managed with the twice-over rotation system as mean of twenty 2000 cm (787.4 in) transects. Bareground Size Percent Area Bareground Combined Length cm in % cm in
20 Table 58. community height structure based on mean % relative cover of mid grasses and short grasses, Twice-over Rotation Relative Cover % Seasonlong System Relative Cover % Mid Grasses western wheatgrass needle and thread green needlegrass Short Grasses prairie junegrass blue grama upland sedges
21 Table 59. Mean cumulative grasshopper days (GD) per m 2 and primary habitat use for pestiferous grasshoppers on native rangeland managed with the twice-over rotation system and the seasonlong system, Mean Cumulative Grasshopper days per m 2 Pestiferous Rangeland Grasshoppers Hatch Group Egg Pod Site Basking Site Daily Activity Site Twice-over Grazing Seasonlong Grazing Mel gla Late Bareground Bareground Bareground 3 88* Mel san Early Bareground Grd/Veg Bareground Ope obs Late Bareground Veg/Grd Veg/Grd 6 71* Enc cos Intermediate Bareground Bareground Bareground 10 57* Mel inf Early Bareground Bareground Grd/Veg 5 26* Pho neb Late Bareground Veg/Grd Veg/Grd 6 16 Mel fem Intermediate Bareground Bareground Grd/Veg 9 5 Tra kio Intermediate Bareground Bareground Bareground 3 6 Age deo Early Bareground Bareground Bareground 2 2 Total cumulative GD for the 9 pestiferous grasshoppers Total cumulative GD for the other 21 nonpestiferous grasshoppers Total cumulative GD for all grasshoppers * Habitat use information from Cushing 1993, Pfadt Grasshopper days per m 2 data from Onsager Mean value is significantly greater than its complement*. 143
22 Table 60. Grasshopper density (per m 2 and per yd 2 ) and forage use per month (kg/ha and lbs/ac) on native rangeland managed with the twice-over rotation system and the seasonlong system, Grazing Management System Twice-over Density #/m #/yd Forage use/month kg/ha lbs/ac Seasonlong Density #/m #/yd Forage use/month kg/ha lbs/ac Data from Onsager
23 Figure 4. Grasshopper population abundance reported as grasshopper days per square meter on native rangeland managed with the twice-over rotation and the seasonlong systems. Data from Onsager 2000.
24 Table 61. Monthly herbage biomass (lbs/ac) for native rangeland managed with the seasonlong system, Biotype Jun Jul Aug Sep Oct Mean Monthly Native Grass Cool Season Warm Season Sedges Total Forbs Total Live Standing Dead Standing Biomass Litter Total Dead Total Biomass Table 62. Monthly composition (%) of herbage biomass for native rangeland managed with the seasonlong system, Biotype Jun Jul Aug Sep Oct Mean Monthly Native Grass Cool Season Warm Season Sedges Total Forbs Total Live Standing Dead Standing Biomass Litter Total Dead Total Biomass
25 Table 63. Monthly herbage biomass (lbs/ac) for native rangeland managed with the twice-over rotation system, Biotype Jun Jul Aug Sep Oct Mean Monthly Native Grass Cool Season Warm Season Sedges Total Forbs Total Live Standing Dead Standing Biomass Litter Total Dead Total Biomass Table 64. Monthly composition (%) of herbage biomass for native rangeland managed with the twice-over rotation system, Biotype Jun Jul Aug Sep Oct Mean Monthly Native Grass Cool Season Warm Season Sedges Total Forbs Total Live Standing Dead Standing Biomass Litter Total Dead Total Biomass
26 Table 65. Percent difference of monthly herbage biomass on the twice-over rotation system compared to the seasonlong system of native rangeland management, Biotype Jun Jul Aug Sep Oct Mean Monthly Native Grass Cool Season Warm Season Sedges Total Forbs Total Live Standing Dead Standing Biomass Litter Total Dead Total Biomass
27 Table 66. Basal cover (%) and composition (%) for native rangeland managed with the twice-over rotation and the seasonlong systems, Twice-over rotation Seasonlong Biotype Basal Cover % Composition % Basal Cover % Composition % Native Grass Cool Season Warm Season Sedges Total Forbs Total Live Litter Bare Soil Table 67. Percent difference of basal cover on the twice-over rotation system compared to the seasonlong system of native rangeland management, Biotype Difference % Native Grass Cool Season 3.11 Warm Season Sedges Total Forbs Total Live 0.84 Litter
28
29
Plant Water Stress Frequency and Periodicity in Western North Dakota
 Plant Water Stress Frequency and Periodicity in Western North Dakota Llewellyn L. Manske PhD, Sheri Schneider, John A. Urban, and Jeffery J. Kubik Report DREC 10-1077 Range Research Program Staff North
Biologically Effective Grazing Management
 Biologically Effective Grazing Management Llewellyn L. Manske PhD Range Scientist North Dakota State University Dickinson Research Extension Center Beneficial Relationships of Grazing and Grass Growth
Evaluation of Plant Species Shift on Fertilized Native Rangeland
 Evaluation of Plant Species Shift on Fertilized Native Rangeland Report DREC 09-1011 Llewellyn L. Manske PhD Range Scientist North Dakota State University Dickinson Research Extension Center Nitrogen fertilization
Grass Plant Responses to Defoliation
 Grass Plant Responses to Defoliation Llewellyn L. Manske PhD Range Scientist North Dakota State University Dickinson Research Extension Center Management of grassland ecosystems has customarily been applied
Autecology of Hood s Phlox on the Northern Mixed Grass Prairie
 Autecology of Hood s Phlox on the Northern Mixed Grass Prairie Llewellyn L. Manske PhD Research Professor of Range Science North Dakota State University Dickinson Research Extension Center Report DREC
Degradation and Biological Restoration of Mixed Grass Prairie Ecosystems
 Degradation and Biological Restoration of Mixed Grass Prairie Ecosystems Llewellyn L. Manske PhD Research Professor of Range Science North Dakota State University Dickinson Research Extension Center Report
Autecology of Broom Snakeweed on the Northern Mixed Grass Prairie
 Autecology of Broom Snakeweed on the Northern Mixed Grass Prairie Llewellyn L. Manske PhD Research Professor of Range Science North Dakota State University Dickinson Research Extension Center Report DREC
Autecology of Prairie Plants on the Northern Mixed Grass Prairie
 Autecology of Prairie Plants on the Northern Mixed Grass Prairie Llewellyn L. Manske PhD Research Professor of Range Science North Dakota State University Dickinson Research Extension Center Report DREC
Environmental Factors to Consider during Planning of Management for Range Plants in the Dickinson, North Dakota, Region,
 Environmental Factors to Consider during Planning of Management for Range Plants in the Dickinson, North Dakota, Region, 1892-21 Llewellyn L. Manske PhD Range Scientist North Dakota State University Dickinson
Grazing and Burning Treatment Effects on Soil Mineral Nitrogen and Rhizosphere Volume
 Grazing and Burning Treatment Effects on Soil Mineral Nitrogen and Rhizosphere Volume Llewellyn L. Manske PhD Range Scientist North Dakota State University Dickinson Research Extension Center Insufficient
Range Plant Growth Related to Climatic Factors of Western North Dakota,
 Range Plant Growth Related to Climatic Factors of Western North Dakota, 1982-2016. Llewellyn L. Manske PhD Research Professor North Dakota State University Dickinson Research Extension Center Report DREC
Range Plant Growth Related to Climatic Factors of Western North Dakota,
 Range Plant Growth Related to Climatic Factors of Western North Dakota, 1982-2014. Llewellyn L. Manske PhD Research Professor North Dakota State University Dickinson Research Extension Center Report DREC
Soil Mineral Nitrogen Increased Above the Threshold Quantity of 100 Pounds per Acre in Rangeland Ecosystems
 Soil Mineral Nitrogen Increased Above the Threshold Quantity of 100 Pounds per Acre in Rangeland Ecosystems Report DREC 11-3056 Llewellyn L. Manske PhD Ran ge Scientist North Dakota State University Dickinson
Grazing Treatment Effects on Vegetative Tillering and Soil Rhizospheres of Western Wheatgrass
 Grazing Treatment Effects on Vegetative Tillering and Soil Rhizospheres of Western Wheatgrass Michelle M. Gorder 1, Llewellyn L. Manske 2, and Tobias L. Stroh 1 1 Dickinson State University, Department
Response of Annual and Perennial Grass Growth, Energy Reserves and Fuels Accumulation to Climatic Variation
 Response of Annual and Perennial Grass Growth, Energy Reserves and Fuels Accumulation to Climatic Variation Brad Schultz Extension Educator University of Nevada Cooperative Extension Winnemucca, NV Types
Does removal of cattle grazing promote development of stable climax plant communities and preserve prairie grasslands in perpetuity?
 Effects from Long-Term Nongrazing After 75 Years Llewellyn L. Manske PhD Research Professor of Range Science North Dakota State University Dickinson Research Extension Center Does removal of cattle grazing
Types and Categories of
 Types and Categories of Range Plants Plants are the "ultimate" source of organic energy in ecosystems Plants produce their through Photosynthesis: Get raw material from soil. When leaves are removed from
CONTENTS VOLUME 2. Groundplum Astragulus crassicarpus Missouri milkvetch Astragulus missouriensis... 11
 CONTENTS VOLUME 2 Magnoliopsida (Dicots) Fabaceae (Legume) Groundplum Astragulus crassicarpus.................... 2 Missouri milkvetch Astragulus missouriensis.................. 11 Purple prairieclover
Thorns, Prickles, Spines - The characteristics make the plant less likely to be grazed by large herbivores; not effective against insect herbivores.
 PLANT RESPONSE TO DISTURBANCE This discussion is based on: Briske, D. D. 1991. Developmental morphology and physiology of grasses. p. 85-108. In: Grazing Management: An Ecological Perspective. R. K. Heitschmidt
EFFECTS FROM LONG-TERM NONGRAZING AFTER 75 YEARS
 EFFECTS FROM LONG-TERM NONGRAZING AFTER 75 YEARS North Dakota State University Dickinson Research Extension Center 2013 4016a North Dakota State University 2013 Dickinson Research Extension Center Rangeland
PLANT RESPONSE TO DISTURBANCE
 PLANT RESPONSE TO DISTURBANCE This discussion is based on: Briske, D. D. 1991. Developmental morphology and physiology of grasses. p. 85-108. In: Grazing Management: An Ecological Perspective. R. K. Heitschmidt
Ecosystems Chapter 4. What is an Ecosystem? Section 4-1
 Ecosystems Chapter 4 What is an Ecosystem? Section 4-1 Ecosystems Key Idea: An ecosystem includes a community of organisms and their physical environment. A community is a group of various species that
November 2018 Weather Summary West Central Research and Outreach Center Morris, MN
 November 2018 Weather Summary Lower than normal temperatures occurred for the second month. The mean temperature for November was 22.7 F, which is 7.2 F below the average of 29.9 F (1886-2017). This November
Utilization. Utilization Lecture. Residue Measuring Methods. Residual Measurements. 24 October Read: Utilization Studies and Residual Measurements
 Utilization Utilization Lecture 24 October Read: Utilization Studies and Residual Measurements Utilization is the proportion or degree of current year s forage production that is consumed or destroyed
September 2018 Weather Summary West Central Research and Outreach Center Morris, MN
 September 2018 Weather Summary The mean temperature for September was 60.6 F, which is 1.5 F above the average of 59.1 F (1886-2017). The high temperature for the month was 94 F on September 16 th. The
Forage Growth and Its Relationship. to Grazing Management
 1 of 5 4/9/2007 8:31 AM Forage Growth and Its Relationship to Grazing Management H. Alan DeRamus Department of Renewable Resources University of Southwestern Louisiana, Lafayette Introduction All green
Biomes Section 2. Chapter 6: Biomes Section 2: Forest Biomes DAY ONE
 Chapter 6: Biomes Section 2: Forest Biomes DAY ONE Of all the biomes in the world, forest biomes are the most widespread and the most diverse. The large trees of forests need a lot of water, so forests
WHEN CAN YOU SEED FALLOW GROUND IN THE FALL? AN HISTORICAL PERSPECTIVE ON FALL RAIN
 WHEN CAN YOU SEED FALLOW GROUND IN THE FALL? AN HISTORICAL PERSPECTIVE ON FALL RAIN Steve Petrie and Karl Rhinhart Abstract Seeding at the optimum time is one key to producing the greatest yield of any
Lecture 24 Plant Ecology
 Lecture 24 Plant Ecology Understanding the spatial pattern of plant diversity Ecology: interaction of organisms with their physical environment and with one another 1 Such interactions occur on multiple
Ecology Test Biology Honors
 Do Not Write On Test Ecology Test Biology Honors Multiple Choice Identify the choice that best completes the statement or answers the question. 1. The study of the interaction of living organisms with
Range Cattle Research and Education Center January CLIMATOLOGICAL REPORT 2012 Range Cattle Research and Education Center.
 1 Range Cattle Research and Education Center January 2013 Research Report RC-2013-1 CLIMATOLOGICAL REPORT 2012 Range Cattle Research and Education Center Brent Sellers Weather conditions strongly influence
Variability of Crested Wheatgrass Production
 RANGELANDS 1(3), June 199 153 Variability of Crested Wheatgrass Production over 35 Years Lee A. Sharp, Ken Sanders, and Neil Rimbey In the fall of 195, the Burley Idaho District of the Bureau of Land Management,
Autecology of Plains Rough Fescue on the Northern Mixed Grass Prairie
 Autecology of Plains Rough Fescue on the Northern Mixed Grass Prairie Llewellyn L. Manske PhD Research Professor of Range Science North Dakota State University Dickinson Research Extension Center Report
CLIMATOLOGICAL REPORT 2002
 Range Cattle Research and Education Center Research Report RC-2003-1 February 2003 CLIMATOLOGICAL REPORT 2002 Range Cattle Research and Education Center R. S. Kalmbacher Professor, IFAS, Range Cattle Research
TREES. Functions, structure, physiology
 TREES Functions, structure, physiology Trees in Agroecosystems - 1 Microclimate effects lower soil temperature alter soil moisture reduce temperature fluctuations Maintain or increase soil fertility biological
Climate Change Impact on Air Temperature, Daily Temperature Range, Growing Degree Days, and Spring and Fall Frost Dates In Nebraska
 EXTENSION Know how. Know now. Climate Change Impact on Air Temperature, Daily Temperature Range, Growing Degree Days, and Spring and Fall Frost Dates In Nebraska EC715 Kari E. Skaggs, Research Associate
Ecology - the study of how living things interact with each other and their environment
 Ecology Ecology - the study of how living things interact with each other and their environment Biotic Factors - the living parts of a habitat Abiotic Factors - the non-living parts of a habitat examples:
Nutrient Cycling in Land Vegetation and Soils
 Nutrient Cycling in Land Vegetation and Soils OCN 401 - Biogeochemical Systems 13 September 2012 Reading: Schlesinger, Chapter 6 Outline 1. The annual Intrasystem Nutrient Cycle 2. Mass balance of the
Good Morning! When the bell rings we will be filling out AP Paper work.
 Good Morning! Turn in HW into bin or email to smithm9@fultonschools.org If you do not want to tear the lab out of your notebook take a picture and email it. When the bell rings we will be filling out AP
Growth and Defoliation of Pasture Plants: how the biology of pasture plants relates to grazing levels and pasture productivity
 Growth and Defoliation of Pasture Plants: how the biology of pasture plants relates to grazing levels and pasture productivity David B. Hannaway Forage Program Director Crop & Soil Science Department Oregon
Student Name: Teacher: Date: District: London City. Assessment: 07 Science Science Test 4. Description: Life Science Final 1.
 Student Name: Teacher: Date: District: London City Assessment: 07 Science Science Test 4 Description: Life Science Final 1 Form: 301 1. A food chain is shown. Sunlight Grass Rabbit Snake What is the abiotic
Assisted colonization of native forbs the use of climate-adjusted provenances. Sue McIntyre
 Assisted colonization of native forbs the use of climate-adjusted provenances Sue McIntyre Why move grassland forbs? Grassland forbs need help populations are depleted and fragmented. Climate change likely
Name ECOLOGY TEST #1 Fall, 2014
 Name ECOLOGY TEST #1 Fall, 2014 Answer the following questions in the spaces provided. The value of each question is given in parentheses. Devote more explanation to questions of higher point value. 1.
Trophic and community ecology
 Trophic and community ecology Top carnivore Trophic levels Carnivore Herbivore Plant Trophic ecology Trophic related to feeding Autotrophs: synthesize their food Heterotrophs: eat other organisms Trophic
Range Cattle Research and Education Center January CLIMATOLOGICAL REPORT 2016 Range Cattle Research and Education Center.
 1 Range Cattle Research and Education Center January 2017 Research Report RC-2017-1 CLIMATOLOGICAL REPORT 2016 Range Cattle Research and Education Center Brent Sellers Weather conditions strongly influence
What is insect forecasting, and why do it
 Insect Forecasting Programs: Objectives, and How to Properly Interpret the Data John Gavloski, Extension Entomologist, Manitoba Agriculture, Food and Rural Initiatives Carman, MB R0G 0J0 Email: jgavloski@gov.mb.ca
environment Biotic Abiotic
 1 Ecology is the study of the living world and the interactions among organisms and where they live; it is the study of interactions between living (animals, plants) and nonliving (earth, air, sun water)
Ecology Student Edition. A. Sparrows breathe air. B. Sparrows drink water. C. Sparrows use the sun for food. D. Sparrows use plants for shelter.
 Name: Date: 1. Which of the following does not give an example of how sparrows use resources in their environment to survive? A. Sparrows breathe air. B. Sparrows drink water. C. Sparrows use the sun for
Desert Patterns. Plants Growth and reproduction Water loss prevention Defenses. Animals Growth and reproduction Water loss prevention Defenses
 Desert Patterns Plants Growth and reproduction Water loss prevention Defenses Animals Growth and reproduction Water loss prevention Defenses Abiotic Features Introduction A major emphasis in ecology is
Interrelationships. 1. Temperature Wind Fire Rainfall Soil Type Floods Sunlight Altitude Earthquake
 Interrelationships Abiotic Factors A. A Partial List 1. Temperature Wind Fire Rainfall Soil Type Floods Sunlight Altitude Earthquake B. Aquatic Adaptations 1. Pumping salt out a. Salt water fish 2. Pumping
Honors Biology Unit 5 Chapter 34 THE BIOSPHERE: AN INTRODUCTION TO EARTH S DIVERSE ENVIRONMENTS
 Honors Biology Unit 5 Chapter 34 THE BIOSPHERE: AN INTRODUCTION TO EARTH S DIVERSE ENVIRONMENTS 1. aquatic biomes photic zone aphotic zone 2. 9 terrestrial (land) biomes tropical rain forest savannah (tropical
10/6/ th Grade Ecology and the Environment. Chapter 2: Ecosystems and Biomes
 7 th Grade Ecology and the Environment Chapter 2: Ecosystems and Biomes Lesson 1 (Energy Flow in Ecosystems) Each organism in an ecosystem fills an energy role. Producer an organism that can make its own
Biogeographic Processes
 Biogeographic Processes Energy and Matter Flow in Ecosystems Ecological Biogeography Ecological Succession Historical Biogeography Biogeographic Processes Biogeography examines the distribution of plants
Earth s Major Terrerstrial Biomes. *Wetlands (found all over Earth)
") Biomes Biome: the major types of terrestrial ecosystems determined primarily by climate 2 main factors: Depends on ; proximity to ocean; and air and ocean circulation patterns Similar traits of plants
Biomes Biome: the major types of terrestrial ecosystems determined primarily by climate 2 main factors: Depends on ; proximity to ocean; and air and ocean circulation patterns Similar traits of plants
Biogeochemical Processes of Nitrogen in Rangeland Soils
 Biogeochemical Processes of Nitrogen in Rangeland Soils Llewellyn L. Manske PhD Research Professor of Range Science North Dakota State University Dickinson Research Extension Center Report DREC 15-3066
Meteorology. Circle the letter that corresponds to the correct answer
 Chapter 3 Worksheet 1 Meteorology Name: Circle the letter that corresponds to the correct answer 1) If the maximum temperature for a particular day is 26 C and the minimum temperature is 14 C, the daily
BIO B.4 Ecology You should be able to: Keystone Vocabulary:
 Name Period BIO B.4 Ecology You should be able to: 1. Describe ecological levels of organization in the biosphere 2. Describe interactions and relationships in an ecosystem.. Keystone Vocabulary: Ecology:
INTERACTIONS IN AN ENVIRONMENT
 reflect Earth is full of living things. Our planet has many kinds of organisms including bacteria, fungi (like mushrooms), plants, and animals. In some ways, living things are alike. Almost all living
UNIT 5: ECOLOGY Chapter 15: The Biosphere
 CORNELL NOTES Directions: You must create a minimum of 5 questions in this column per page (average). Use these to study your notes and prepare for tests and quizzes. Notes will be stamped after each assigned
Variability of Reference Evapotranspiration Across Nebraska
 Know how. Know now. EC733 Variability of Reference Evapotranspiration Across Nebraska Suat Irmak, Extension Soil and Water Resources and Irrigation Specialist Kari E. Skaggs, Research Associate, Biological
ACCURACY OF MODELS FOR PREDICTING PHENOLOGY OF BLACKHEADED FIREWORM AND IMPLICATIONS FOR IMPROVED PEST MANAGEMENT
 ACCURACY OF MODELS FOR PREDICTING PHENOLOGY OF BLACKHEADED FIREWORM AND IMPLICATIONS FOR IMPROVED PEST MANAGEMENT Stephen D. Cockfield and Daniel L. Mahr Department of Entomology University of Wisconsin-Madison
Chapter 6 Vocabulary. Environment Population Community Ecosystem Abiotic Factor Biotic Factor Biome
 Biomes Chapter 6 Vocabulary Environment Population Community Ecosystem Abiotic Factor Biotic Factor Biome How Are Organisms On Earth Connected? All living things on Earth share resources, such as air,
Figure 2 If birds eat insects that feed on corn, which pyramid level in the diagram would birds occupy? 1. A 3. C 2. B 4. D
 Ecology Week 1 Assignment. This week's assignment will count as a quiz grade. Please speak to Mr. Roes about any questions that you would like help on! 1. The fact that no organism exists as an entity
Mycorrhizal Fungi. Symbiotic relationship with plants -- form sheath around fine roots and extend hyphae into soil and sometimes into root cells
 Mycorrhizal Fungi Symbiotic relationship with plants -- form sheath around fine roots and extend hyphae into soil and sometimes into root cells Mycorrhizae transfer nutrients to roots (important in infertile
A summary of the weather year based on data from the Zumwalt weather station
 ZUMWALT PRAIRIE WEATHER 2016 A summary of the weather year based on data from the Zumwalt weather station Figure 1. An unusual summer storm on July 10, 2016 brought the second-largest precipitation day
TUNDRA. Column 1 biome name Column 2 biome description Column 3 examples of plant adaptations
 Biome Cards (pp. 1 of 7) Cut out each biome card and divide each card into three sections. Place all sections in a plastic storage bag. Have one bag for every two students. Column 1 biome name Column 2
EFFECT OF CUTTING HEIGHT ON TILLER POPULATION DENSITY AND HERBAGE BIOMASS OF BUFFEL GRASS
 EFFECT OF CUTTING HEIGHT ON TILLER POPULATION DENSITY AND HERBAGE BIOMASS OF BUFFEL GRASS ID # 01-32 L.S. Beltrán, P.J. Pérez, G.A. Hernández, M.E. García, S.J. Kohashi and H.J.G. Herrera Instituto de
BIOSPHERE KEY QUESTION 1. IV. BIOSPHERE: The living organisms that have established themselves in the
 BIOSPHERE KEY QUESTION 1 IV. BIOSPHERE: The living organisms that have established themselves in the other three spheres A. In this module, two contrasting ecosystems should be studied to a greater depth
Why Sample Vegetation? Vegetation Sampling. Vegetation Sampling Metrics. Enumeration and Density
 Vegetation Sampling Key concepts Types of vegetation sampling Methods of vegetation sampling Definitions Density Cover Growth Vigor Utilization Transect Macroplot Quadrat Physiological status Why Sample
Plant responses to climate change in the Negev
 Ben-Gurion University of the Negev Plant responses to climate change in the Negev 300 200 150? Dr. Bertrand Boeken Dry Rangeland Ecology and Management Lab The Wyler Dept. of Dryland Agriculture Jacob
8.L Which example shows a relationship between a living thing and a nonliving thing?
 Name: Date: 1. Which example shows a relationship between a living thing and a nonliving thing?. n insect is food for a salmon. B. Water carries a rock downstream.. tree removes a gas from the air. D.
Illinois Drought Update, December 1, 2005 DROUGHT RESPONSE TASK FORCE Illinois State Water Survey, Department of Natural Resources
 Illinois Drought Update, December 1, 2005 DROUGHT RESPONSE TASK FORCE Illinois State Water Survey, Department of Natural Resources For more drought information please go to http://www.sws.uiuc.edu/. SUMMARY.
LESSON FOUR: Rangeland Plant Classification
 LESSON FOUR: Rangeland Plant Classification Classification of Range Plants Plant Type: The anatomical type of plant Origin: Where the plant developed Life Span: How long a plant lives Season of Growth:
Global Biogeography. Natural Vegetation. Structure and Life-Forms of Plants. Terrestrial Ecosystems-The Biomes
 Global Biogeography Natural Vegetation Structure and Life-Forms of Plants Terrestrial Ecosystems-The Biomes Natural Vegetation natural vegetation is the plant cover that develops with little or no human
Ecosystems. 1. Population Interactions 2. Energy Flow 3. Material Cycle
 Ecosystems 1. Population Interactions 2. Energy Flow 3. Material Cycle The deep sea was once thought to have few forms of life because of the darkness (no photosynthesis) and tremendous pressures. But
FOSS California Environments Module Glossary 2007 Edition. Adult: The last stage in a life cycle when the organism is mature and can reproduce.
 FOSS California Environments Module Glossary 2007 Edition Adult: The last stage in a life cycle when the organism is mature and can reproduce. Algae: A large group of water organisms. Amphibian: An organism,
Communities Structure and Dynamics
 Communities Structure and Dynamics (Outline) 1. Community & niche. 2. Inter-specific interactions with examples. 3. The trophic structure of a community 4. Food chain: primary, secondary, tertiary, and
Growth Stages of Wheat: Identification and Understanding Improve Crop Management
 Growth Stages of Wheat: Identification and Understanding Improve Crop Management B y Travis D. Miller Understanding growth stages of wheat is important in matching management decisions and inputs with
ZUMWALT WEATHER AND CLIMATE ANNUAL REPORT ( )
") ZUMWALT WEATHER AND CLIMATE ANNUAL REPORT (26-29) FINAL DRAFT (9 AUGUST 21) J.D. HANSEN 1, R.V. TAYLOR 2, AND V.S. JANSEN 3 INTRODUCTION The Zumwalt Prairie in northeastern Oregon is a unique grassland
ZUMWALT WEATHER AND CLIMATE ANNUAL REPORT (26-29) FINAL DRAFT (9 AUGUST 21) J.D. HANSEN 1, R.V. TAYLOR 2, AND V.S. JANSEN 3 INTRODUCTION The Zumwalt Prairie in northeastern Oregon is a unique grassland
Dynamic and Succession of Ecosystems
 Dynamic and Succession of Ecosystems Kristin Heinz, Anja Nitzsche 10.05.06 Basics of Ecosystem Analysis Structure Ecosystem dynamics Basics Rhythms Fundamental model Ecosystem succession Basics Energy
Environmental Science: Biomes Test
 Name: Date: Pd. VERSION 1 Environmental Science: Biomes Test 1. Eland are large herbivores with loose skin under the throat and neck. This patch of skin aids in lowering the body temperature when temperatures
Levels of Organization in Ecosystems. Ecologists organize ecosystems into three major levels. These levels are: population, community, and ecosystem.
 Levels of Organization in Ecosystems Ecologists organize ecosystems into three major levels. These levels are: population, community, and ecosystem. Population A population is a group of individuals of
Plants have observalbe life cycles and are essential to all life.
 3.3.4.A -- Essential Know the similarities and differences of living things. Identify life processes of living things. Know that some organisms have similar external characteristics and that similarities
Review Quizzes Chapters 45-50
 Review Quizzes Chapters 45-50 1) Which of the following is a non-density-dependent factor that affects a population? a. spread of disease b. space c. earthquake d. food e. mating and reproduction 1) Which
Chapter 4 AND 5 Practice
 Name: Chapter 4 AND 5 Practice 1. Events that occur in four different ecosystems are shown in the chart below. Which ecosystem would most likely require the most time for ecological succession to restore
Yakın Doğu Üniversitesi Mimarlık Fakültesi Peyzaj Mimarlığı Bölümü. PM 317 Human and Environment Assoc. Prof. Dr. Salih GÜCEL
 Yakın Doğu Üniversitesi Mimarlık Fakültesi Peyzaj Mimarlığı Bölümü PM 317 Human and Environment Assoc. Prof. Dr. Salih GÜCEL Ecology & Ecosystems Principles of Ecology Ecology is the study of the interactions
NIDIS Intermountain West Drought Early Warning System April 18, 2017
 1 of 11 4/18/2017 3:42 PM Precipitation NIDIS Intermountain West Drought Early Warning System April 18, 2017 The images above use daily precipitation statistics from NWS COOP, CoCoRaHS, and CoAgMet stations.
Define Ecology. study of the interactions that take place among organisms and their environment
 Ecology Define Ecology Define Ecology study of the interactions that take place among organisms and their environment Describe each of the following terms: Biosphere Biotic Abiotic Describe each of the
National Wildland Significant Fire Potential Outlook
 National Wildland Significant Fire Potential Outlook National Interagency Fire Center Predictive Services Issued: September, 2007 Wildland Fire Outlook September through December 2007 Significant fire
8/18/ th Grade Ecology and the Environment. Lesson 1 (Living Things and the Environment) Chapter 1: Populations and Communities
 Chapter 1: Populations and Communities") Lesson 1 (Living Things and the Environment) 7 th Grade Ecology and the Environment Chapter 1: Populations and Communities organism a living thing (plant, animal, bacteria, protist, fungi) Different types
Lesson 1 (Living Things and the Environment) 7 th Grade Ecology and the Environment Chapter 1: Populations and Communities organism a living thing (plant, animal, bacteria, protist, fungi) Different types
PHYSICAL PROPERTIES TAHOE.UCDAVIS.EDU 8
 PHYSICAL PROPERTIES 8 Lake surface level Daily since 1900 Lake surface level varies throughout the year. Lake level rises due to high stream inflow, groundwater inflow, and precipitation directly onto
Nutrient Cycling in Land Vegetation and Soils
 Nutrient Cycling in Land Vegetation and Soils OCN 401 - Biogeochemical Systems 15 September 2016 Reading: Schlesinger & Bernhardt, Chapter 6 2016 Frank Sansone Outline 1. The annual Intrasystem Nutrient
remain on the trees all year long) Example: Beaverlodge, Alberta, Canada
 Example: Beaverlodge, Alberta, Canada") Coniferous Forest Temperature: -40 C to 20 C, average summer temperature is 10 C Precipitation: 300 to 900 millimeters of rain per year Vegetation: Coniferous-evergreen trees (trees that produce cones
Coniferous Forest Temperature: -40 C to 20 C, average summer temperature is 10 C Precipitation: 300 to 900 millimeters of rain per year Vegetation: Coniferous-evergreen trees (trees that produce cones
1. The graph below represents a change in event A that leads to changes in events B and C.
 1. The graph below represents a change in event A that leads to changes in events B and C. Which row in the chart best identifies each event in the graph? A) 1 B) 2 C) 3 D) 4 2. A stable ecosystem is characterized
BUNDLE 9: ENERGY AND ECOLOGY Review
 BUNDLE 9: ENERGY AND ECOLOGY Review 1. Describe Cellular Respiration, what happens, where does it happen, what type of organism does it take place in? What is the equation for respiration? Happens in the
Control. Crabgrass. in Georgia Hayfields
 Crabgrass Control in Georgia Hayfields Patrick McCullough, Extension specialist Crabgrass (Digitaria spp.) is a warm season annual grass that is commonly found in pastures and hayfields in Georgia. Relative
Communities Structure and Dynamics
 Communities Structure and Dynamics (Outline) 1. Community & niche. 2. Inter-specific interactions with examples. 3. The trophic structure of a community 4. Food chain: primary, secondary, tertiary, and
Life Science Strand Grades K-8
 Life Science Strand Grades K-8 KINDERGARTEN K.L.1: Compare characteristics of animals that make them alike and different from other animals and nonliving things. K.L.1.1: Compare different types of the
How does the greenhouse effect maintain the biosphere s temperature range? What are Earth s three main climate zones?
 Section 4 1 The Role of Climate (pages 87 89) Key Concepts How does the greenhouse effect maintain the biosphere s temperature range? What are Earth s three main climate zones? What Is Climate? (page 87)
Mrs. Fanek Ecology Date
 Name Period Mrs. Fanek Ecology Date 1. The graph below represents a change in event A that leads to changes in events B and C. Which row in the chart best identifies each event in the graph? A) 1 B) 2