Accepted Article. Molecular-clock methods for estimating evolutionary rates and. timescales
|
|
|
- Sara O’Connor’
- 5 years ago
- Views:
Transcription
1 Received Date : 23-Jun-2014 Revised Date : 29-Sep-2014 Accepted Date : 30-Sep-2014 Article type : Invited Reviews and Syntheses Molecular-clock methods for estimating evolutionary rates and timescales Simon Y. W. Ho and Sebastián Duchêne School of Biological Sciences, University of Sydney, Sydney NSW 2006, Australia Corresponding author: Simon Y. W. Ho School of Biological Sciences Edgeworth David Building University of Sydney Sydney NSW 2006 This article has been accepted for publication and undergone full peer review but has not been through the copyediting, typesetting, pagination and proofreading process, which may lead to differences between this version and the Version of Record. Please cite this article as doi: /mec.12953
2 Australia Fax: Keywords: relaxed clock, local clock, rate variation, lineage effects, Bayesian phylogenetics, calibration Running head: Molecular-clock methods in phylogenetics Abstract The molecular clock presents a means of estimating evolutionary rates and timescales using genetic data. These estimates can lead to important insights into evolutionary processes and mechanisms, as well as providing a framework for further biological analyses. In order to deal with rate variation among genes and among lineages, a diverse range of molecular-clock methods have been developed. These methods have been implemented in various software packages and differ in their statistical properties, ability to handle different models of rate variation, capacity to incorporate various forms of calibrating information, and tractability for analysing large data sets. Choosing a suitable molecularclock model can be a challenging exercise, but a number of model-selection techniques are available. In this review, we describe the different forms of evolutionary rate heterogeneity and explain how they can be accommodated in molecular-clock analyses. We provide an outline of the various clock methods and models that are available, including the strict clock, local clocks, discrete clocks, and relaxed clocks. Techniques for calibration and clock-model selection are also described, along with methods for handling multilocus data sets. We conclude our review with some comments about the future of molecular clocks.
3 Introduction Understanding evolutionary rates and timeframes can provide useful insights into biological processes and mechanisms, as well as forming an important basis for a range of further analyses and interpretation. Until the past few decades, our knowledge of evolutionary timescales was based entirely on the fossil record. This was transformed by the development of the molecular clock in the 1960s (Doolittle & Blombäck, 1964; Margoliash, 1963; Zuckerkandl & Pauling, 1962; Zuckerkandl & Pauling, 1965), which raised the possibility of inferring evolutionary timescales using genetic data. The molecular clock posits a constant rate of genetic change among lineages, such that estimates of rates can be extrapolated across the Tree of Life to infer the timing of evolutionary divergence events. For this reason, the molecular clock has become a valuable component of phylogenetic analysis. In its original and simplest form, the molecular clock assumes homogeneous rates among taxa (Zuckerkandl & Pauling, 1962). This is sometimes expressed as a linear relationship between genetic distance and time since divergence, with the slope of this line corresponding to the evolutionary rate. The inadequacy of this simple model was exposed by burgeoning evidence of rate variation among species, especially among divergent taxa, providing substantial impetus for methodological development (Welch & Bromham, 2005). As a result, molecular clocks have undergone considerable evolution over the five decades since they were first used (Bromham & Penny, 2003; Ho, 2014; Kumar, 2005). One of the most notable features of the progress in molecular-clock methods and models has been an increase in their complexity. This has been made possible by the growing availability of genetic data, dramatic improvements in computational power, and the development of the Bayesian phylogenetic framework (Heath & Moore, 2014). A wide range of molecular-clock models and methods, implemented in various statistical phylogenetic settings, are now available to biologists. Choosing among these is not a trivial task and there are various statistical and practical factors that need to be considered (Sauquet, 2013; Wilke et
4 al., 2009). These include the size of the data set, which has important implications for the performance of different methods and for computational requirements. In addition, all molecular clocks need to be calibrated using independent temporal information so that they yield estimates of absolute, rather than relative, ages. Calibrations are usually based on fossil or geological evidence and their choice can have an enormous impact on molecular estimates of evolutionary timescales (Hipsley & Muller, 2014; Ho & Phillips, 2009; Inoue et al., 2010; Parham et al., 2012). Here we provide an overview of molecular-clock analysis, focusing on the developments of the past two decades. We begin by summarising the process of estimating evolutionary timescales from genetic data, then we compare different patterns of evolutionary rate variation and explain how they can be taken into account in molecular-clock studies. After presenting an outline of the different methods and models, we describe some of the available techniques for model selection. Finally, we highlight a number of areas for further research. Estimating evolutionary timescales Estimating evolutionary rates and timescales from genetic data is a complex procedure that typically involves the use of several different methods and programs. The process can be divided into five major steps (Sauquet, 2013): assembling a data set, choosing calibrations, choosing a molecularclock method and model of rate variation, running the analysis, and interpreting the results. Each of these steps requires considerable care and the researcher must choose from a variety of methods that are available. Most molecular-clock analyses involve protein or DNA sequences, although various other forms of genetic data have also been used (e.g., Sun et al., 2009; Wang et al., 2011). Protein sequences were among the main sources of information for molecular evolutionary analyses until the development of
5 DNA-sequencing techniques in the 1970s. DNA sequences are now the dominant form of data used in molecular-clock analyses, although protein sequences are still used for studying deep divergences because DNA sequences are saturated over such timeframes (e.g., Blank & Sánchez-Baracaldo, 2010; Matari & Blair, 2014). An increase in size has been an obvious trend among the data sets used to estimate evolutionary rates and timescales. Most of the early molecular-clock studies were based on single genes, particularly from the mitochondrial and chloroplast genomes. Data sets comprising multiple genes, often including markers from both nuclear and organellar genomes, became commonplace from the late 1990s onwards. More recently, genome-scale data sets have become available, bringing substantial challenges for molecular-clock analyses because of their size, complexity, and computational demands (dos Reis & Yang, 2011; Guindon, 2010; Ho, 2014). In all molecular dating analyses, the single most important component is the choice of calibrations (Box 1; Figure 1). The molecular clock can be calibrated by incorporating information about the absolute rate or absolute node ages. In the absence of a known substitution rate, node-based calibrations provide the sole source of information about absolute times. Errors in these calibrations can be propagated throughout the tree, leading to errors in all of the estimates of divergence times. These problems can partly be mitigated by employing calibrations at multiple nodes throughout the tree, which generally leads to an improvement in estimates of rates and node times (Duchêne et al., 2014a; Lukoschek et al., 2012; Paradis, 2013). If reliable calibrations are unavailable, molecular-clock analysis should not be attempted unless the objective is to estimate relative rather than absolute node times. Provided that at least one reliable calibration can be identified, the next step in a molecular-clock study is to choose appropriate
6 methods and models. These include the method of analysis, model of nucleotide substitution, and the molecular-clock model. In Bayesian molecular-clock analyses, the prior distribution of node ages also needs to be specified (Box 2). Methods for selecting the best-fitting model of nucleotide substitution have been reviewed in detail elsewhere (Sullivan & Joyce, 2005). Here we focus on the different methods and molecular-clock models that are available, with their fit being dependent on the patterns of rate variation in the data. Below we summarise the different forms of rate variation before describing the models that have been developed to account for this heterogeneity. Variation in rates of molecular evolution In its original form, the molecular clock hypothesis proposed a constancy of rates among lineages but allowed different genes to evolve at different rates. Variation in rates among genes was attributed to differences in functional importance, with the substitution rate being negatively related to the proportion of selectively constrained sites in each gene (Dickerson, 1971; Kimura & Ohta, 1974). Subsequent work has also revealed that rates vary among lineages and that the pattern and extent of this among-lineage rate heterogeneity can differ across genes. Accordingly, rate variation can be partitioned into three components: gene effects, lineage effects, and gene-by-lineage effects (Muse & Gaut, 1997; Smith & Eyre-Walker, 2003). Factors that cause rate variation across sites, known as site effects, are sometimes treated separately (Gaut et al., 2011), but we subsume these into our discussion of gene effects for convenience. In addition, site effects are primarily accommodated by nucleotide substitution models (Yang, 1994), rather than by molecular-clock models. Gene effects, also known as locus effects, lead to differences in absolute evolutionary rates across genes. In mammals, for example, fibrinopeptides evolve more rapidly than haemoglobin and cytochrome c, which both evolve more rapidly than histones (Kimura & Ohta, 1974). This can be a consequence of among-site rate variation (site effects) and disparities among genes in the proportion of sites under selection (Mouchiroud et al., 1995; Zuckerkandl, 1976). Mutation rates can also vary
7 across regions and between nuclear and organellar genomes (Brown et al., 1982; Wolfe et al., 1987), being influenced by nucleotide composition and other factors (Bulmer et al., 1991). Lineage effects refer to factors that cause rates to vary among taxa, but that act across the genome so that all genes are affected equally (Gillespie, 1989). This includes factors that cause systematic variation in mutation rates among lineages. Mutations can be the result of copying errors or spontaneous DNA damage, such that rates of mutation are influenced by the frequency of DNA replication (generation time), metabolic rates, exposure to UV radiation, and the efficiency of DNA repair mechanisms (Bromham, 2011). The effect of generation time on substitution rates has received considerable attention and has been detected in a range of taxa (e.g., Kim et al., 2006; Thomas et al., 2010). Gene and lineage effects can occur in combination, leading to a pattern in which gene-specific rates vary in a fixed ratio among lineages (Snir et al., 2012). For example, gene A might evolve at twice the rate of gene B, with this ratio remaining constant among lineages even as the absolute rate varies among lineages. This form of rate heterogeneity can be accommodated by most available molecular-clock models, as described in the next section. Interactions between gene and lineage effects, also referred to as residual effects (Gillespie, 1991), can lead to much more complex patterns in which the extent and distribution of among-lineage rate variation differs among genes (Muse & Gaut, 1997). Various studies have uncovered evidence of residual effects in mitochondrial, chloroplast, and nuclear genes (Duchêne & Ho, 2014; Mower et al., 2007; Muse & Gaut, 1997). Residual effects can be caused by changes in population size, which lead to changes in proportions of effectively neutral sites among genes (Takahata, 1987). Selection can act on a subset of genes in a particular set of taxa, leading to disparate gene effects along different
8 branches of the tree (Cutler, 2000). Even when the evolutionary process is dominated by neutral mutations, various factors have the potential to produce residual effects (Takahata, 1987). Not all molecular-clock models are able to account explicitly for residual effects. Molecular-clock methods and models The simplest molecular-clock model assumes homogeneous rates among branches of the phylogeny. This is usually referred to as a strict or global molecular clock. The strict-clock model has only a single parameter: the rate of evolution. The rate is typically expressed in substitutions per site per year or substitutions per site per million years, depending on the temporal scope of the analysis. The strict clock is often used in analyses of sequence data sampled at the intraspecific level, for which there is an expectation of low rate variation among branches (Brown & Yang, 2011). This is because many of the factors associated with lineage effects, such as differences in generation time and DNA repair mechanisms, are unlikely to show measurable variation among conspecific individuals. The strict clock is also used as a null model for testing for the presence of among-lineage rate heterogeneity, often as one of the first steps in a molecular dating analysis (Peterson, 2006). The strict clock has been implemented in several different ways and in a wide range of phylogenetic software (Table 1). Many of the earlier molecular-clock studies calculated linear regressions on plots of pairwise genetic distances against divergence times inferred from the fossil record (e.g., Dickerson, 1971; Doolittle et al., 1996; Runnegar, 1982). Unknown times of divergence could then be estimated by applying the equation of the regression line to genetic distances estimated from the taxa of interest. This approach was largely made obsolete by phylogenetic implementations of the strict clock, which took evolutionary relationships into account and allowed the simultaneous estimation of divergence times throughout the tree (Langley & Fitch, 1974). More recently, the strict clock has been incorporated into Bayesian phylogenetic methods, permitting greater flexibility in
9 accounting for uncertainty in the tree topology and in the calibrations (e.g., Drummond et al., 2006; Ronquist et al., 2012b). With the exception of sequences sampled at the population level, lineage effects cause most genetic data to exhibit significant departures from the strict molecular clock. To accommodate this rate variation among branches, a number of molecular-clock models relax the assumption of rate homogeneity. Most of the available models assume that the rate is constant along each branch, but permit variation among the branch-specific rates. These models can be categorised in a number of ways, depending on their statistical motivations, assumptions about how rates vary among branches, and the extent to which they allow co-estimation of other parameters (Rutschmann, 2006; Welch & Bromham, 2005). In order to classify molecular-clock models, we find it convenient to distinguish among them on the basis of the number of distinct rates (k) that are assigned to branches across the tree (Table 1; Figure 2). In this regard, k=1 represents the strict-clock model described above. In contrast, a relaxedclock model is one in which k equals the number of branches in the tree (n), such that each branch is permitted to have a distinct rate. When 1<k<n, there is a limited number of rates across the tree and some branches share the same rate; the number of distinct rates is usually much smaller than the number of branches. We call these the multi-rate clock models. We draw a further distinction between multi-rate clocks that merely involve a limited number of distinct rates across the tree and those that assign rates to groups of neighbouring branches. We also distinguish among relaxed clocks on the basis of whether they are implemented in rate-smoothing methods or as parametric models of rate variation in Bayesian and likelihood-based phylogenetic methods.
10 Multi-rate molecular clocks In multi-rate clock models, there is limited rate variation across the phylogeny, with the number of distinct substitution rates being greater than 1 but smaller than the number of branches in the tree. In some multi-rate clock models, the branches sharing the same rate are clustered together to form local clocks. In other multi-rate clock models, which we refer to as discrete clocks (following Fourment & Holmes, 2014), the branches sharing the same rate are distributed throughout the tree rather than being locally clustered. Some of the methods that implement multi-rate clock models can employ both local and discrete variants, depending on how the user assigns rates to branches (Table 1). These include the software PAML (Yang, 2007) and r8s (Sanderson, 2003). Local clocks are based on the assumption that closely related lineages are more likely to share evolutionary rates. In these models, the phylogeny is assumed to comprise clusters of branches, with each cluster having a distinct substitution rate. The clusters are often defined on some biological basis, for example by allowing different taxonomic groups to have distinct rates (Hasegawa et al., 1989; Yoder & Yang, 2000). Some methods require the assignment of rates to branches to be done prior to the analysis, such that the tree topology needs to be fixed. In practice, there is not always a clear biological justification for choosing from among the numerous possible delineations of local clocks. One solution is to model the process of rate change across the tree, as in the compound Poisson process (Huelsenbeck et al., 2000; Ronquist et al., 2012b). In this approach, changes in the substitution rate occur across the tree according to a Poisson process. At each of these events, the ancestral rate is multiplied by a random number to give the descendent rate. The original version of the model was overparameterised (Rannala, 2002), but this problem was remedied in a subsequent implementation of the model in MrBayes (Ronquist et al., 2012a).
11 The random local clock (RLC) model, implemented in the Bayesian phylogenetic software BEAST (Drummond et al., 2012), allows simultaneous estimation of the phylogeny, node times, and rate-change events across the tree (Drummond & Suchard, 2010). In the RLC framework, an approach known as Bayesian stochastic search variable selection is used to infer whether a branch inherits the substitution rate from its parent or not. The Bayesian implementation of the RLC model makes it straightforward to account for phylogenetic uncertainty, because the tree topology is sampled during the Markov chain Monte Carlo analysis. The posterior estimate of the number of distinct rates and the assignment of rates to branches are thus integrated across the uncertainty in the tree. In their RLC analysis of three example data sets (mammals, primates, and influenza virus), Drummond and Suchard (2010) found that rate variation could be described using a small number of local clocks. In discrete multi-rate clocks, rates are shared by branches that are not necessarily adjacent to each other. The assignment of rates to branches can be biologically informed or they can be estimated. In some cases, the assignment of rates to branches depends on the distribution of particular biological characteristics that are believed to influence substitution rates. For example, separate substitution rates might be assigned to parasitic versus non-parasitic lineages (Bromham et al., 2013) or to sexually versus asexually reproducing lineages (Neiman et al., 2010). This provides a useful framework for testing hypotheses about the causes of evolutionary rate variation (Lanfear, 2011). In the absence of information about how rates might vary among lineages, the number (k) and/or assignment of rates among branches can be determined statistically. In the ad-hoc rate smoothing (AHRS) method described by Yang (2004), branch-specific rates are grouped into a chosen number of rate categories. Prior to this step, the rate variation among branches is estimated using an autocorrelated model of rate change (described in the next section). A subsequent modification of the AHRS method included automatic selection of the number of rate categories (Aris-Brosou, 2007).
12 Heath et al. (2012) used a Dirichlet process prior (DPP) to assign the branch-specific rates to k categories. This DPP model, implemented in the programs DPPDiv and RevBayes (Table 1), includes as special cases the strict clock (k=1) and the relaxed clock (k equal to the number of branches). The rates for the categories are drawn from a gamma distribution, in which the concentration parameter (α) governs both the number of rate categories as well as the number of branches that are assigned the rate in each category. A simulation study showed that the DPP model yielded estimates with greater accuracy than several other models of rate variation, without substantially compromising precision (Heath et al., 2012). In the DPP and AHRS methods, assignments of branch-specific rates to categories are statistically motivated and are not necessarily biologically meaningful. Relaxed clocks: Rate-smoothing methods Relaxed clocks allow a distinct substitution rate along each branch in the tree. The earliest relaxedclock methods were inspired by the idea of rate autocorrelation, whereby rates change gradually along lineages because they are tied to life-history and environmental factors that exhibit some degree of temporal autocorrelation (Gillespie, 1991). Accordingly, the aim of these methods was to minimise or smooth changes in rates between adjacent branches in the phylogeny (Sanderson, 1997; Sanderson, 2002). There are now several different methods based on a such a rate-smoothing approach (Table 1), including non-parametric rate smoothing (Sanderson, 1997), penalised likelihood (Sanderson, 2002), mean path length (Britton et al., 2002), and Pathd8 (Britton et al., 2007). Non-parametric rate smoothing and penalised likelihood are both available in the program r8s (Sanderson, 2003), but there are also implementations of penalised likelihood in the R package APE (Paradis, 2013) and treepl (Smith & O'Meara, 2012). Non-parametric rate smoothing uses an optimisation algorithm to minimise differences in substitution rates among lineages (Sanderson, 1997). The objective function is the sum of squared differences in rates between adjacent branches. For convenience, the rate at the root node is assigned
13 the mean rate across the tree. The method allows the use of multiple calibrations, whereby the optimisation is restricted to parameter space within the constraints imposed by the calibrations. Sanderson (1997) proposed the use of bootstrapping to obtain confidence intervals for estimates of node ages. However, this approach has been criticised because it does not account for uncertainties in the calibrations and can lead to confidence intervals that are deceptively narrow, especially if the amount of sequence data is large (Thorne & Kishino, 2005; Yang, 2014). Penalised likelihood is a semi-parametric method that applies a penalty to rate changes between neighbouring branches (Sanderson, 2002). The method includes a smoothing parameter, λ, which governs the magnitude of the penalty. The optimal value of the smoothing parameter can be determined using leave-one-out cross-validation based on removal of terminal branches (Sanderson, 2002). The penalised likelihood is then optimised, allowing estimation of the branch-specific rates and divergence times across the tree. Estimates of uncertainty in node times can be obtained via parametric bootstrapping (Sanderson, 1997; Sanderson, 2003) or by reporting the spread of node times within 2 log-likelihood units of the maximum-likelihood estimates (Smith & O'Meara, 2012). Mean path length (MPL; Britton et al., 2002) and Pathd8 (Britton et al., 2007) are rate-smoothing methods that average the differences in rates between sister lineages. Both methods are based on path lengths, which are the sums of the lengths of branches that connect each of the internal nodes to its descendent tips. The MPL method estimates the relative node ages as the average length of the paths that descend from each node in the tree. The relative node ages can be rescaled to give absolute times by applying a calibration to one of the nodes. A limitation of this method is that the estimates of node times can be unreliable if there is large degree of among-lineage rate variation. This can be detected by testing whether sister paths descending from an internal node have significantly different lengths, so a P-value is computed for every node.
14 Pathd8 is based on the same principle as the MPL method, but can incorporate high levels of among lineage rate variation by including multiple calibrations (Britton et al., 2007). The calibrations can impose large rate differences along the tree. For example, if a tree has two calibrating nodes, the subtree descending from each node can have a very distinct substitution rate. The relative node ages are estimated as a weighted average of the mean path length of the subtrees (Britton et al., 2007). This technique can result in a lower degree of rate smoothing than in the MPL method. Rate-smoothing methods rely on other methods to estimate the tree topology and branch lengths. This can be done using fast phylogenetic methods (e.g., Stamatakis et al., 2012), meaning that ratesmoothing methods are readily scalable to genomic data sets. Generally, rate-smoothing methods are very fast even for data sets with large numbers of taxa (Britton et al., 2007; Smith & O'Meara, 2012). Although they require a fixed tree topology for estimating rates and divergence times, phylogenetic uncertainty can be taken into account using ad-hoc methods (Aris-Brosou, 2007). Nevertheless, a more satisfying and direct solution is provided in some of the Bayesian relaxed-clock methods described below. In addition, Bayesian methods allow uncertainty in calibrations to be taken into account appropriately, in contrast with rate-smoothing methods and other likelihood-based methods for molecular dating (Yang, 2014). Relaxed clocks: Parametric and Bayesian methods Bayesian phylogenetic methods can incorporate parameter-rich models of evolution, providing a suitable context for implementing relaxed molecular clocks. By using Markov chain Monte Carlo sampling to estimate posterior distributions of parameters, Bayesian methods can deal with complex evolutionary models that would otherwise be intractable in a maximum-likelihood framework (Heath & Moore, 2014; Huelsenbeck et al., 2001). Bayesian relaxed-clock methods estimate the rate along each branch, either using a fixed tree topology or while co-estimating the phylogeny and node times (Table 1).
15 Bayesian relaxed clocks include two classes of models, autocorrelated and uncorrelated clocks, which differ in their assumptions about the nature of rate variation among branches. Autocorrelated relaxed clocks assume that neighbouring branches share similar rates (Lepage et al., 2006; Thorne et al., 1998). In this sense, the motivating principle behind autocorrelated relaxed-clock models is similar to that of local-clock models, but the methods differ in the number of branch-specific rates across the tree. Autocorrelated relaxed-clock models are available in various Bayesian phylogenetic programs, including BEAST (Drummond et al., 2012), MCMCtree in PAML (Yang, 2007), MrBayes (Ronquist et al., 2012b), Multidivtime (Thorne et al., 1998), PhyloBayes (Lartillot et al., 2009), PhyTime (Guindon, 2013), and RevBayes ( Rate autocorrelation has been modelled in several different ways. In the autocorrelated lognormal relaxed-clock model, the rate along each branch is drawn from a lognormal distribution with a mean equal to the rate along the parent branch (Kishino et al., 2001; Thorne et al., 1998). The autocorrelated gamma relaxed clock is similar, but each rate is drawn from a gamma distribution with a mean equal to the parent rate (Aris-Brosou & Yang, 2002). In both cases, the variance of the distribution is proportional to the time duration of the branch. In this way, the rate can be regarded as a quantitative trait that evolves through time, perhaps in correlation with life-history characteristics. One problem with these autocorrelated relaxed-clock models is that there is no bound to the potential increase in substitution rate over time (Lepage et al., 2006). The more complex Ornstein-Uhlenbeck process (Aris-Brosou & Yang, 2002) and Cox-Ingersoll-Ross models (Lepage et al., 2006) were implemented with the aim of correcting this non-stationary behaviour, but the Ornstein-Uhlenbeck-process model involves a systematic decline in the rate over time (Welch et al., 2005). Rate changes in the autocorrelated exponential relaxed-clock model occur in a time-independent manner (Aris-Brosou & Yang, 2002). In this model, each branch-specific rate is sampled from an exponential distribution with mean equal to the rate along the parent branch. The standard deviation is
16 equal to the mean in the exponential distribution, such that variance in the rate depends on the magnitude of the mean rate rather than on the time elapsed. This time-independence of rate autocorrelation, reflecting a punctuated or episodic mode of rate change, is a feature shared with the rate-smoothing methods described above. In uncorrelated relaxed-clock models, also known as independent-rates models, there is no assumption of correlation between rates in neighbouring branches (Drummond et al., 2006; Lepage et al., 2007; Rannala & Yang, 2007). Instead, the branch-specific rates are all sampled from a chosen distribution, such as a lognormal, exponential, or gamma distribution. A lognormal distribution would suggest that the branch-specific rates tend to cluster around a mean value, whereas an exponential distribution would suggest that many branches have low substitution rates. The parameters of the chosen rate distribution are estimated in the analysis and can provide a measure of rate heterogeneity among lineages. In addition, the degree of autocorrelation can potentially be estimated by examining the relationship between rates along neighbouring branches in the tree (Drummond et al., 2006; Linder et al., 2011). In all uncorrelated relaxed-clock models, substitution rates change abruptly at nodes in the tree but remain constant along branches, similar to some of the rate-smoothing methods and the autocorrelated exponential relaxed clock. Although uncorrelated relaxed clocks are mostly available in Bayesian phylogenetic methods, they have also been implemented in a penalised-likelihood framework by Paradis (2013). This differs from the penalised-likelihood approach described in the previous section in that the penalty term is not based on the magnitude of rate changes between branches, but on the fit of the branch-specific rates to a distribution chosen by the user. Paradis (2013) suggested the use of a gamma distribution for this purpose. Although penalised-likelihood relaxed clocks carry the benefit of low computational burden, they have the considerable disadvantage of being unable to account readily for uncertainty in the tree topology and calibrations.
17 The different models of among-lineage rate heterogeneity have varying levels of biological plausibility (Ho, 2009; Welch & Bromham, 2005). In particular, the relative fit of autocorrelated and uncorrelated models of rate change is a subject of ongoing inquiry. Different studies have yielded support for either autocorrelated rates (Lepage et al., 2007) or uncorrelated rates (Drummond et al., 2006; Linder et al., 2011). The variation among these results might be due to the difficulty in detecting autocorrelation in evolutionary rates using phylogenetic molecular-clock methods (Battistuzzi et al., 2010; Ho, 2009; Ho et al., 2014; Paradis, 2013). In addition, the degree of autocorrelation in a data set might depend on the scale of analysis and the density of taxon sampling, with lower rate autocorrelation expected when phylogenetic distances are large (Lepage et al., 2007; Linder et al., 2011). Comparisons of the various relaxed-clock models, including simulation studies and analyses of a range of data sets, are needed to improve our understanding of this aspect of molecular-clock analysis (Heath & Moore, 2014). Models for multilocus data Phylogenetic analyses often involve data sets comprising sequences from multiple loci. Common practice is to partition the data set, such as by gene or by codon position, and to assign separate substitution models to the data subsets (Yang, 1996). In molecular-clock analyses, the simplest approach is to apply a single model of among-lineage rate variation to the whole sequence alignment. However, this fails to account for heterogeneity among genes, which might have evolved under very different conditions. For example, multilocus data sets might include combinations of markers from mitochondrial, chloroplast, and nuclear genomes. To account for gene effects in the data set, each gene can be assigned a parameter that describes its substitution rate (Figures 3a and 3b). This parameter represents the global rate in the strict-clock model, the ancestral rate at the root in autocorrelated relaxed-clock models, or the mean rate in uncorrelated relaxed-clock models (dos Reis et al., 2014). Thorne and Kishino (2002) used a gamma
18 prior distribution for the gene-specific rates. However, dos Reis et al. (2014) pointed out that this approach can strongly mislead estimates of divergence times when the data set comprises many genes and if the prior is misspecified. To correct this problem, they proposed the use of a Dirichlet prior for the gene-specific rates. Multilocus data sets can exhibit more complex patterns of rate variation in the form of residual effects, whereby the pattern of among-lineage rate heterogeneity varies among genes. In these cases, a separate relaxed-clock model might need to be assigned to each gene (Thorne & Kishino, 2002), although this approach is only possible in a few molecular-clock methods (Table 1). When the data set comprises a large number of genes, implementing multiple relaxed-clock models can lead to an excessive number of parameters. Instead, a limited number of clock models can be applied to chosen subsets of the data (Figure 3c). For example, one relaxed clock might be assigned to nuclear genes and another to organellar genes (Thornhill et al., 2012). In some cases, assigning separate relaxed clocks to different codon positions might be appropriate (Ho & Lanfear, 2010). Choosing a clockpartitioning scheme poses an interesting challenge and can have a considerable influence on the resulting estimates of divergence times (Duchêne et al., 2014a). Fortunately, methods are available for this purpose, as described in the next section. Model selection Selecting an appropriate molecular-clock model for the data is crucial. As with all model selection, this involves identifying an acceptable balance between model complexity and goodness of fit (Burnham & Anderson, 2002). In particular, the aim is to identify the simplest model that captures the essential biological features of the data (Steel, 2005). The fit of different candidate models is not always intuitively obvious and best practice involves objective statistical comparison. A poor choice of clock model can result in highly misleading estimates of divergence times (e.g., Worobey et al., 2014).
19 In most molecular-clock analyses, the first step is to test the hypothesis of a strict clock (Peterson, 2006). This determines whether there is sufficient rate variation among lineages to warrant the use of more complex clock models. If the hypothesis of rate constancy is unable to be rejected, the use of a strict clock is preferred because it has the fewest parameters and generally leads to the most precise estimates of divergence times (Brown & Yang, 2011; Ho et al., 2005). However, the growing size of data sets that are used in molecular-dating analyses means that the strict clock is now almost invariably rejected. The first tests of the strict molecular clock involved the comparison of rates along the branches leading to two taxa while using a third taxon as a reference point. Known as relative-rates tests, these have been implemented in various statistical settings (Muse & Weir, 1992; Wu & Li, 1985). The advantage of relative-rates tests is that they do not require the evolutionary relationships to be known, except that the two taxa being compared need to be more closely related to each other than to the reference taxon. Methods based on whole phylogenetic trees are more generally useful because they not only allow the strict-clock model to be tested, but also allow comparisons of various models of rate variation among branches. Therefore, our focus here is on whole-tree methods. Likelihood-based methods There are several likelihood-based selection criteria for clock models. The likelihood-ratio test (LRT) provides a means of comparing nested models, including clock models (Felsenstein, 1981). The statistic used in this test is twice the difference in log likelihoods, which is approximately chi-squared distributed with degrees of freedom equal to the difference in the number of free parameters between the two models being compared. The LRT is regularly used to test the strict clock against a model in which there are no constraints on branch lengths (the unconstrained model).
20 Non-nested evolutionary models, such as the different relaxed-clock models, can be compared using likelihood-based criteria such as the Φ information criterion (ΦIC, Paradis, 2013). The ΦIC is similar to the Akaike information criterion, but includes the contribution of a penalty term that constrains among-lineage rate variation. In the autocorrelated relaxed clock, this penalty term, along with its associated smoothing parameter, correspond to those in the penalised-likelihood method of Sanderson (2002). In the uncorrelated relaxed clock, the penalty term is based on the fit of the branchspecific rates to a chosen distribution. A simulation study showed that the performance of the ΦIC was mixed, with the strict-clock model favoured even when data were generated using an autocorrelated relaxed clock (Paradis, 2013). The utility of this model-selection criterion remains unclear. Bayesian methods The most common method of Bayesian model selection involves the calculation of marginal likelihoods. These allow pairwise comparisons of models, regardless of whether they are nested or not, using Bayes factors (Jeffreys, 1935; Jeffreys, 1961; Kass & Raftery, 1995). There are several different methods for calculating marginal likelihoods and Bayes factors, varying in their performance and computational demands (Box 3). In addition to comparing different models of rate variation among branches, Bayes factors can be used to compare the fit of different parameter values for the same clock model. For example, different numbers of rate categories (k) in the Dirichlet-process-prior model can be compared, with k=1 indicating a strict clock (Heath et al., 2012). In the framework of the random local clock, Bayes factors can be used to test the strict-clock model, in which all of the branches across the tree have inherited the substitution rate at the root (Drummond & Suchard, 2010). In some relaxed-clock models, posterior estimates of parameters can provide insights into whether the model is appropriate for the data. For example, the variance parameter of the autocorrelated lognormal clock can be estimated to quantify the degree of rate autocorrelation
21 (Thorne et al., 1998). More generally, the extent of rate heterogeneity among lineages can be determined by the coefficient of rate variation, given as the standard deviation of the branch-specific rates divided by the mean of these rates. Very small values of the coefficient of rate variation are consistent with a strict clock (Drummond et al., 2006). In addition, the covariance of rates between neighbouring branches can be measured, providing a measure of rate autocorrelation throughout the tree (Drummond et al., 2006). However, this method does not appear to perform well in practice, having failed to detect any evidence of autocorrelated rates across a diverse range of studies and simulation scenarios (Battistuzzi et al., 2010; Ho et al., 2014; Linder et al., 2011). The choice of priors on branch-specific rates and node times, as well as the hyperpriors for the parameters of these models, can have considerable impacts on Bayesian estimates of evolutionary rates and timescales (e.g., Ho et al., 2005; Welch et al., 2005). This highlights the importance of evaluating the sensitivity of the estimates to the choice of priors and hyperpriors. Given the range of clock models and other priors available to the user, however, comprehensive assessments of the robustness of molecular-clock estimates might not always be feasible (Heath & Moore, 2014). Bayesian model averaging In a Bayesian setting, a model-averaging approach can be used when multiple candidate clock models are available (Li & Drummond, 2012). This involves sampling the different clock models in proportion to their probability during the Markov chain Monte Carlo simulation. As a result, the estimates of rates, divergence times, and other parameters are integrated across the uncertainty in the clock model, weighted according to the probabilities of the candidate models. A key advantage of this approach is that it accounts for model uncertainty, which can be substantial if many different models provide comparable fit to the data. In addition, the candidate clock models can be compared by examining their posterior probabilities. The maximum a posteriori model can be chosen as the bestfitting of the models being considered (Li & Drummond, 2012).
22 The utility of model averaging depends on the suite of candidate models that are available for comparison. In analyses of simulated data using the software BEAST (Drummond et al., 2012), the clock model used for simulation was usually, but not always, chosen correctly as the maximum a posteriori model (Baele et al., 2013; Duchêne et al., 2014a). The performance of this model-selection approach was found to be better than that of Bayes factors calculated using the harmonic-mean estimator of the marginal likelihood, and comparable to those estimated using path-sampling and stepping-stone estimators (see Box 3; Baele et al., 2013). There is a limited range of clock models that can be compared using available Bayesian model-averaging methods, but further development of this framework is a promising area of work (Heath & Moore, 2014). Partitioned molecular clocks Clock-model selection for multilocus data sets is a complex exercise. Not only does the best-fitting clock model need to be identified, but the user must also decide whether or not to assign separate clock models to different subsets of the data. When residual effects are present, multiple clock models are needed to capture the rate heterogeneity among genes (Thorne & Kishino, 2002). Given the number of different ways of partitioning multilocus data sets, however, an exhaustive comparison is rarely feasible. As with selecting partitioning schemes for substitution models (Lanfear et al., 2012), a heuristic approach needs to be adopted. One method of data partitioning involves identifying clusters of loci that share similar patterns of rate variation among branches. This can be done by using a clustering algorithm to group the genes according to some criterion, such as the distances between their inferred trees (dos Reis et al., 2012; Duchêne et al., 2014b). In this way, a separate clock model can be applied to clusters of genes that share the same patterns of among-lineage rate variation. These clusters might be expected to correspond to the biological functions of the genes, but analyses of sequence data from bacterial and archaeal taxa have suggested that this is not the case (Wolf et al., 2013).
23 Concluding remarks Biologists are faced with a wide choice of molecular-clock methods for estimating evolutionary rates and timescales. Accurate inference relies on access to informative sequence data, careful model selection, and reliable calibrations. Further development of molecular-clock methods should address these three components. In particular, new methods will need to meet the challenges of analysing large, genome-scale data sets (Ho, 2014). With the growing amount of sequence data, the performance of molecular-clock analyses will increasingly rely on rigorous model selection and the identification of accurate, informative calibrations. Recent work has highlighted the declining marginal benefit in increasing the size of the data sets used to estimate evolutionary timescales (dos Reis & Yang, 2013; Rannala & Yang, 2007; Yang, 2014; Yang & Rannala, 2006). Even with data sets of moderate size, there is little error in estimates of branch lengths and the uncertainty in divergence-time estimates is primarily driven by the calibrations (dos Reis & Yang, 2013; Thorne & Kishino, 2002; Xia & Yang, 2011; Yang & Rannala, 2006). Therefore, molecular estimates of evolutionary rates and timescales will be most substantially improved by the continued discovery and description of informative fossils, as well as development of methods for incorporating calibrations into the analysis. With careful employment of molecular-clock methods and models, estimates of rates and timescales can make an extremely valuable contribution to our understanding of the evolutionary process. Acknowledgements The authors thank Louis Bernatchez, Stéphane Aris-Brosou, and an anonymous reviewer for their detailed and constructive comments. SYWH was supported by the Australian Research Council (grant number DP ). SD was supported by a Francisco José de Caldas Scholarship from the Colombian government and by a University of Sydney World Scholars Award.
24 Author contributions SYWH and SD wrote the paper. Box 1. Calibrating molecular clocks Molecular clocks need to be calibrated so that they give measurements on an absolute timescale rather than providing relative times. In some cases, the speed of the clock is set using previous estimates of evolutionary rates. Given that many data sets now comprise a diverse range of genes and taxa, the validity of applying such secondary rates is becoming increasingly dubious. Accordingly, most work has focused on the implementation and improvement of age calibrations for phylogenetic trees. Such calibrations can come from various independent sources, including the fossil record, geological evidence, or the ages of the samples being analysed. This calibrating information can be incorporated in a number of different ways, of which the most common is to constrain the age of a node in the phylogenetic tree (Figure 1). In Bayesian methods, this is usually done by specifying an informative prior distribution for the age of the corresponding node (Drummond et al., 2006; Thorne et al., 1998). Most molecular-clock methods allow multiple calibrations to be implemented throughout the tree, enabling temporal information from various sources to be taken into account. Simulation studies have demonstrated that calibrations at deeper nodes generally lead to rate and date estimates with lower error and higher precision (Duchêne et al., 2014a). Methods for calibrating molecular clocks have been reviewed in detail elsewhere (Benton & Donoghue, 2007; Forest, 2009; Heath & Moore, 2014; Hipsley & Muller, 2014; Ho, 2007; Ho & Phillips, 2009; Parham et al., 2012); here we provide a summary of these methods and focus on new approaches.
25 Fossil calibrations Calibrations are often based on palaeontological evidence, whereby a minimum constraint on the age of a clade is based on the timing of its earliest fossil representative. There has been extensive research into the use of fossil data for calibrating molecular clocks (Gandolfo et al., 2008; Parham et al., 2012). Most molecular-clock methods use fossil data indirectly, by guiding the user to specify age constraints or a prior age distribution for a node in the tree. In the latter case, the purpose of the distribution is to describe the presumed relationship between the calibration node and the age of the oldest fossil attached to the descendent lineages. The way in which the constraint is implemented, including the choice of prior density and its parameters, is often subjective and based on an overall interpretation of factors that are difficult to quantify individually (Heath, 2012; Ho & Phillips, 2009; Inoue et al., 2010). Various authors have attempted to formalise this process by proposing methods for estimating uncertainty, such as by modelling preservation or sampling probabilities (Dornburg et al., 2011; Marshall, 2008; Matschiner & Bouckaert, 2014; Nowak et al., 2013; Wilkinson et al., 2011). An alternative is to use a hierarchical approach in which the calibration priors can be grouped into subsets that share the same parameters. For example, Heath (2012) sampled calibrations from a mixture of exponential distributions, with the number and assignments of exponential distributions to calibration nodes being estimated. This approach shows considerable potential because it obviates the need for the user to choose the parameters of the calibration priors (Heath, 2012; Heath & Moore, 2014). When the data set comprises a combination of morphological and molecular characters, fossil taxa can be included in the analysis. In such cases, the fossil taxa are only represented by morphological, but not molecular, characters. The fossil taxa should be assigned non-zero ages so that they are not treated as contemporaneous with the extant taxa in the data set (Didier et al., 2012; Stadler, 2010). This allows the evolutionary relationships of the fossil taxa to be estimated, while the age of each fossil acts to constrain the times of the ancestral nodes in the tree (Pyron, 2011; Ronquist
26 et al., 2012a). The accuracy of this approach depends on the model of morphological evolution and on the choice of characters. In the fossilised birth-death (FBD) model, developed by Heath et al. (2014), calibration of the divergence-time estimates is based on fossil occurrences. The only information needed about these fossils is their age and attachment to internal nodes in the tree. The probabilities of node times are then estimated using a model of speciation and extinction. Notably, the estimates in the FBD model are improved by increasing the amount of fossil data for nodes that already have calibrating information. This is in contrast with the strictly node-based methods described above, in which the age constraint placed on a node is based predominantly or even exclusively on the oldest fossil representative of the descendent clade. Geological and biogeographic calibrations If the phylogenetic tree contains lineage divergences that are thought to be associated with particular geological events, the estimated age of each geological event can be used to calibrate the molecular clock. These can include any geological events that promote reproductive isolation or produce a founder effect, ranging from ancient continental drift to recent island colonisations (Kodandaramaiah, 2011). However, biogeographic calibrations are often controversial because of the strong assumption that genetic divergence is tied to geological events. This practice is susceptible to a range of confounding factors, including errors in the estimation of geological ages, the degree of association between geological events and genetic divergences, and the impacts of taxon sampling and lineage extinction (Heads, 2011; Kodandaramaiah, 2011). Newer approaches to geological calibrations include tying them to demographic events, rather than to genetic divergences. This reduces the impact of the discrepancy between population and
27 genetic divergence, which can be a considerable source of estimation bias (Edwards & Beerli, 2000; Ho et al., 2011; Peterson & Masel, 2009). In a study of marine invertebrates, Crandall et al. (2012) assumed that the timing of sea-level rise following the Last Glacial Maximum was tied to population expansion, rather than to the most recent common ancestor of the sampled individuals. Similar analyses using demography-based calibrations will provide further insights into the utility and effectiveness of this approach. Heterochronous sequence data In data sets comprising nucleotide or amino acid sequences from ancient specimens or viruses, the samples often have distinct ages. If the temporal span of the samples is sufficient to allow the accumulation of genetic variation, the ages of the samples can be used for calibration (Drummond et al., 2003; Rambaut, 2000). In studies of viruses, sample ages are often known from collection dates, patient records, or other forms of medical and historical documentation. In contrast, ancient DNA sequences are often obtained from samples of unknown age. These samples can be dated using radiometric methods, from the dates of associated remains, or from stratigraphic analysis. Uncertainty in sample ages, such as the error in radiocarbon dating, can be incorporated into the analysis (Molak et al., 2014). However, accounting for uncertainty in sample ages often has only a small impact on the resulting estimates of rates and divergence times (Molak et al., 2013). If the ages of the heterochronous sequences are unknown, they can be estimated as part of the molecular-clock analysis (Shapiro et al., 2011). Multiple calibrations Most molecular-clock methods allow the use of multiple calibrations. For example, age constraints or informative prior distributions can be chosen for several nodes in the tree, or the data set might include heterochronous sequences with known ages. The use of multiple calibrations has several advantages. The influence of any erroneous calibrations can be overcome by the other calibrations, if
28 the latter are sufficiently informative. Increasing the number of calibrations generally leads to an improvement in estimates of rates and divergence times (Conroy & van Tuinen, 2003; Duchêne et al., 2014a). This is partly because the presence of multiple calibrations reduces the distance of the nodes of unknown age from the calibrating nodes (Rutschmann et al., 2007). Using multiple calibrations brings a number of potential risks. Calibrations vary in their reliability, and the impact of including erroneous age constraints might substantially outweigh any benefits. Generally, the accuracy of different sources of calibrating information is not well understood (Gandolfo et al., 2008; Hipsley & Muller, 2014; Kodandaramaiah, 2011; Sauquet et al., 2012). In some Bayesian molecular-clock methods, the prior age distributions specified for individual calibrating nodes interact multiplicatively with the prior on node times, leading to marginal priors that no longer reflect the temporal information provided by the calibrations (Heled & Drummond, 2012; Ho & Phillips, 2009; Kishino et al., 2001; Warnock et al., 2012). This problem can be addressed by inspecting the effective prior distributions of node times or by employing methods that use conditional constructions of calibration priors (Heled & Drummond, 2012; Yang & Rannala, 2006). In any case, the user-specified calibration densities are subject to constraints imposed by the tree topology, because the age of each node needs to fall within the interval bounded by its ancestral and descendent nodes (Ho & Phillips, 2009; Warnock et al., 2012). Box 2. Prior distribution of node ages In Bayesian molecular-clock analyses, separate prior distributions are specified for the branch-specific rates and node times. The priors on branch-specific rates are provided by the clock model. The prior distribution of node times can be generated using a stochastic branching or coalescent model, or the node times can be assumed to follow a chosen statistical distribution.
29 The simplest model for the prior distribution of node times has the age of the root as the only parameter, with an exponential or uniform prior. It is known as the uniform model because the age of each node has a uniform prior distribution between the age of its parent node and its oldest descendent node (Lepage et al., 2007). This process is repeated in a traversal of the tree from the tips towards the root. An alternative is the Dirichlet model. One of its parameters is the age of the root, which can be given a gamma or uniform prior distribution, for example. The intervals of node times, as a proportion of the total time along a path in the tree (branches connecting an internal node to a tip), follow a Dirichlet distribution and are governed by the concentration parameter, α (Kishino et al., 2001). When the Dirichlet distribution has an α value of 1, it is equivalent to the uniform model. The Dirichlet and uniform models are not explicitly based on biological processes and can be used for data sets with any taxonomic scope. They are particularly useful for analyses of data sets comprising a mixture of population- and species-level samples. When the data set comprises sequences from distinct species, the prior distribution of node times can be generated using a stochastic branching model based on the speciation process. This can be a pure-birth model (Yule, 1924), which is typically parameterised with the probability of speciation along a lineage, known as the birth rate. The birth rate is assumed to remain constant through time and among lineages. In practice, the Yule model is perhaps inappropriate for most data sets because it excludes the possibility of extinction. The birth-death model considers extinction in addition to speciation via the death and birth rate parameters, respectively (Nee et al., 1994; Rannala & Yang, 1996). An extension of this model includes a sampling parameter that allows incomplete taxon sampling to be taken into account (Yang & Rannala, 1997). In analyses of intraspecific data, a coalescent model can be used to generate the prior distribution of node times. These models typically assume random sampling from a panmictic population, but vary in their description of the population history. The simplest demographic model assumes a
30 constant population size through time, with the size of the population being the only parameter (Kingman, 1982). A growing population can be described using the exponential-growth model, in which the population size changes through time according to an exponential function (Griffiths & Tavaré, 1994). Flexible models that allow the population size to be estimated at different time intervals in the tree, such as the Bayesian skyline (Drummond et al., 2005) or skyride (Minin et al., 2008), can be used when the demographic history is either unknown or is to be treated as a nuisance parameter (Ho & Shapiro, 2011). The Bayesian skyline allows abrupt changes in population size, whereas the Bayesian skyride assumes a stronger autocorrelation in population size through time. The choice of prior on node times can have a substantial impact on the estimates of node ages, especially when the information content of the data set is low (Lepage et al., 2007; Welch & Bromham, 2005). For example, metazoan divergence times estimated by Aris-Brosou and Yang (2003) were strongly influenced by the birth-death-process prior used in the analysis (Ho et al., 2005; Welch et al., 2005). Selecting the node-time prior can be guided by biological considerations, such as the taxonomic level of sampling, or by computing Bayes factors. In any case, investigating the sensitivity of the results to the node-time priors is prudent practice (Heath et al., 2012; Stadler & Yang, 2013). Box 3. Computing Bayes factors Bayes factors provide a means of model comparison in a Bayesian statistical framework (Jeffreys, 1935; Jeffreys, 1961). The Bayes factor (BF) comparing Model 1 (M 1 ) against Model 2 (M 2 ) is given by:
31 where is the probability of the data under model M i. This is also known as the marginal likelihood of model M i. Bayes factors have an intuitive interpretation. In the equation above, the BF represents the level of support for M 1 relative to M 2. If BF > 1, M 1 has higher support than M 2, whereas BF < 1 indicates the reverse. In contrast with some frequentist methods for model selection, the candidate models do not need to be nested. For these reasons, Bayes factors have a wide range of applications in phylogenetics, including selection of substitution models (Huelsenbeck et al., 2004), clock models (Lepage et al., 2007; Linder et al., 2011), and demographic models (Baele et al., 2012). However, the use of Bayes factors to compare priors, including clock models and demographic models, is an unconventional statistical practice (Yang, 2014). In most phylogenetic studies, Bayes factors and marginal likelihoods are expressed on a logarithmic scale, so that: For model selection, a threshold needs to be adopted for the interpretation of Bayes factors. A widely accepted standard is that reported by Kass and Raftery (1995), who suggested guidelines for interpreting the value of 2log(BF). Values between 0 and 6 indicate positive evidence for model M 1, values between 6 and 10 indicate strong evidence, and values over 10 indicate decisive evidence. When the value of log(bf) is between 0 and 2, the Bayes factor is inconclusive and it is appropriate to select the model with fewer parameters. Calculating marginal likelihoods accurately is crucial for reliable model selection using Bayes factors. There are various methods for calculating marginal likelihoods, most of which are
32 computationally intensive. The least computationally demanding approach is to use a harmonic-mean estimator, which can use the samples drawn from a Markov chain Monte Carlo simulation (Newton & Raftery, 1994; Suchard et al., 2001). The use of this estimator has been deprecated, however, because it overestimates the marginal likelihood and tends to favour more complex models (Baele et al., 2012; Lartillot & Philippe, 2006; Xie et al., 2011). More accurate estimates of marginal likelihoods can be obtained using stepping-stone sampling and path-sampling techniques (Gelman & Meng, 1998; Lartillot & Philippe, 2006; Xie et al., 2011). These methods require Markov chain Monte Carlo samples from a range of power posterior distributions, which represent the path between the prior and the posterior distributions. Path sampling involves estimating the marginal likelihood for every power posterior sample. In contrast, steppingstone sampling estimates the likelihood ratio for a series of power posterior samples. The accuracy of these two methods is very similar, but stepping-stone sampling is more computationally efficient because it requires fewer samples from the power posterior. Although both of these methods are more accurate than the harmonic-mean estimator, they come at the cost of a substantially increased computational burden. References Aris-Brosou S (2007) Dating phylogenies with hybrid local molecular clocks. PLOS ONE 2, e879. Aris-Brosou S, Yang Z (2002) Effects of models of rate evolution on estimation of divergence dates with special reference to the metazoan 18S ribosomal RNA phylogeny. Systematic Biology 51, Aris-Brosou S, Yang Z (2003) Bayesian models of episodic evolution support a late precambrian explosive diversification of the Metazoa. Molecular Biology and Evolution 20,
33 Baele G, Lemey P, Bedford T, et al. (2012) Improving the accuracy of demographic and molecular clock model comparison while accommodating phylogenetic uncertainty. Molecular Biology and Evolution 29, Baele G, Li WL, Drummond AJ, Suchard MA, Lemey P (2013) Accurate model selection of relaxed molecular clocks in bayesian phylogenetics. Molecular Biology and Evolution 30, Battistuzzi FU, Filipski A, Hedges SB, Kumar S (2010) Performance of relaxed-clock methods in estimating evolutionary divergence times and their credibility intervals. Molecular Biology and Evolution 27, Benton MJ, Donoghue PC (2007) Paleontological evidence to date the tree of life. Molecular Biology and Evolution 24, Blank CE, Sánchez-Baracaldo P (2010) Timing of morphological and ecological innovations in the cyanobacteria--a key to understanding the rise in atmospheric oxygen. Geobiology 8, Britton T, Anderson CL, Jacquet D, Lundqvist S, Bremer K (2007) Estimating divergence times in large phylogenetic trees. Systematic Biology 56, Britton T, Oxelman B, Vinnersten A, Bremer K (2002) Phylogenetic dating with confidence intervals using mean path lengths. Molecular Phylogenetics and Evolution 24, Bromham L (2011) The genome as a life-history character: why rate of molecular evolution varies between mammal species. Philosophical Transactions of the Royal Society of London B 366, Bromham L, Cowman PF, Lanfear R (2013) Parasitic plants have increased rates of molecular evolution across all three genomes. BMC Evolutionary Biology 13, 126. Bromham L, Penny D (2003) The modern molecular clock. Nature Reviews Genetics 4, Brown RP, Yang Z (2011) Rate variation and estimation of divergence times using strict and relaxed clocks. BMC Evolutionary Biology 11, 271. Brown WM, Prager EM, Wang A, Wilson AC (1982) Mitochondrial DNA sequences of primates: tempo and mode of evolution. Journal of Molecular Evolution 18, Bulmer M, Wolfe KH, Sharp PM (1991) Synonymous nucleotide substitution rates in mammalian genes: implications for the molecular clock and the relationship of mammalian orders. Proceedings of the National Academy of Sciences of the USA 88, Burnham KP, Anderson DR (2002) Model selection and multimodel inference, 2nd edn. Springer- Verlag, New York. Conroy CJ, van Tuinen M (2003) Extracting time from phylogenies: Positive interplay between fossil and genetic data. Journal of Mammalogy 84,
34 Crandall ED, Sbrocco EJ, DeBoer TS, Barber PH, Carpenter KE (2012) Expansion dating: Calibrating molecular clocks in marine species from expansions onto the Sunda Shelf Following the Last Glacial Maximum. Molecular Biology and Evolution 29, Cutler DJ (2000) Understanding the overdispersed molecular clock. Genetics 154, Dickerson RE (1971) The structures of cytochrome c and the rates of molecular evolution. Journal of Molecular Evolution 1, Didier G, Royer-Carenzi M, Laurin M (2012) The reconstructed evolutionary process with the fossil record. Journal of Theoretical Biology 315, Doolittle RF, Blombäck B (1964) Amino-acid sequence investigations of fibrinopeptides from various mammals: Evolutionary implications. Nature 202, Doolittle RF, Feng D-F, Tsang S, Cho G, Little E (1996) Determining divergence times of the major kingdoms of living organisms with a protein clock. Science 271, Dornburg A, Beaulieu JM, Oliver JC, Near TJ (2011) Integrating fossil preservation biases in the selection of calibrations for molecular divergence time estimation. Systematic Biology 60, dos Reis M, Inoue J, Hasegawa M, et al. (2012) Phylogenomic datasets provide both precision and accuracy in estimating the timescale of placental mammal phylogeny. Proceedings of the Royal Society of London B 279, dos Reis M, Yang Z (2011) Approximate likelihood calculation on a phylogeny for Bayesian estimation of divergence times. Molecular Biology and Evolution 28, dos Reis M, Yang Z (2013) The unbearable uncertainty of Bayesian divergence time estimation. Journal of Systematics and Evolution 51, dos Reis M, Zhu T, Yang Z (2014) The impact of the rate prior on Bayesian estimation of divergence times with multiple loci. Systematic Biology 63, Drummond AJ, Ho SYW, Phillips MJ, Rambaut A (2006) Relaxed phylogenetics and dating with confidence. PLOS Biology 4, e88. Drummond AJ, Pybus OG, Rambaut A, Forsberg R, Rodrigo AG (2003) Measurably evolving populations. Trends in Ecology and Evolution 18, Drummond AJ, Rambaut A, Shapiro B, Pybus OG (2005) Bayesian coalescent inference of past population dynamics from molecular sequences. Molecular Biology and Evolution 22, Drummond AJ, Suchard MA (2010) Bayesian random local clocks, or one rate to rule them all. BMC Biology 8, 114. Drummond AJ, Suchard MA, Xie D, Rambaut A (2012) Bayesian phylogenetics with BEAUti and the BEAST 1.7. Molecular Biology and Evolution 29,
35 Duchêne S, Ho SYW (2014) Using multiple relaxed-clock models to estimate evolutionary timescales from DNA sequence data. Molecular Phylogenetics and Evolution 77, Duchêne S, Lanfear R, Ho SYW (2014a) The impact of calibration and clock-model choice on molecular estimates of divergence times. Molecular Phlyogenetics and Evolution 78, Duchêne S, Molak M, Ho SYW (2014b) ClockstaR: choosing the number of relaxed-clock models in molecular phylogenetic analysis. Bioinformatics 30, Edwards SV, Beerli P (2000) Perspective: gene divergence, population divergence, and the variance in coalescence time in phylogeographic studies. Evolution 54, Felsenstein J (1981) Evolutionary trees from DNA sequences: a maximum likelihood approach. Journal of Molecular Evolution 17, Forest F (2009) Calibrating the Tree of Life: fossils, molecules and evolutionary timescales. Annals of Botany 104, Fourment M, Holmes EC (2014) Novel non-parametric models to estimate evolutionary rates and divergence times from heterochronous sequence data. BMC Evolutionary Biology 14, 163. Gandolfo MA, Nixon KC, Crepet WL (2008) Selection of fossils for calibration of molecular dating models. Annals of the Missouri Botanical Garden 95, Gaut B, Yang L, Takuno S, Eguiarte LE (2011) The patterns and causes of variation in plant nucleotide substitution rates. Annual Review of Ecology Evolution and Systematics 42, Gelman A, Meng X-L (1998) Simulating normalizing constants: From importance sampling to bridge sampling to path sampling. Statistical Science 13, Gillespie JH (1989) Lineage effects and the index of dispersion of molecular evolution. Molecular Biology and Evolution 6, Gillespie JH (1991) The Causes of Molecular Evolution. Oxford University Press, New York, USA. Griffiths RC, Tavaré S (1994) Sampling theory for neutral alleles in a varying environment. Philosophical Transactions of the Royal Society of London B 344, Guindon S (2010) Bayesian estimation of divergence times from large sequence alignments. Molecular Biology and Evolution 27, Guindon S (2013) From trajectories to averages: an improved description of the heterogeneity of substitution rates along lineages. Systematic Biology 62, Hasegawa M, Kishino H, Yano T (1989) Estimation of branching dates among primates by molecular clocks of nuclear DNA which slowed down in Hominoidea. Journal of Human Evolution 18, Heads M (2011) Old taxa on young islands: a critique of the use of island age to date islandendemic clades and calibrate phylogenies. Systematic Biology 60,
36 Heath TA (2012) A hierarchical Bayesian model for calibrating estimates of species divergence times. Systematic Biology 61, Heath TA, Holder MT, Huelsenbeck JP (2012) A Dirichlet process prior for estimating lineagespecific substitution rates. Molecular Biology and Evolution 29, Heath TA, Huelsenbeck JP, Stadler T (2014) The fossilized birth-death process for coherent calibration of divergence-time estimates. Proceedings of the National Academy of Sciences of the USA 111, E2957-E2966. Heath TA, Moore BR (2014) Bayesian inference of species divergence times. In: Bayesian phylogenetics: Methods algorithms, and applications (eds. Chen M-H, Kuo L, Lewis PO), pp CRC Press, Boca Raton, Florida. Heled J, Drummond AJ (2012) Calibrated tree priors for relaxed phylogenetics and divergence time estimation. Systematic Biology 61, Himmelmann L, Metzler D (2009) TreeTime: an extensible C++ software package for Bayesian phylogeny reconstruction with time-calibration. Bioinformatics 25, Hipsley CA, Muller J (2014) Beyond fossil calibrations: realities of molecular clock practices in evolutionary biology. Frontiers in Genetics 5, 138. Ho SYW (2007) Calibrating molecular estimates of substitution rates and divergence times in birds. Journal of Avian Biology 38, Ho SYW (2009) An examination of phylogenetic models of substitution rate variation among lineages. Biology Letters 5, Ho SYW (2014) The changing face of the molecular clock. Trends in Ecology and Evolution 29, Ho SYW, Duchêne S, Duchêne D (2014) Simulating and detecting autocorrelation in molecular evolutionary rates among lineages. Molecular Ecology Resources, in press. Ho SYW, Lanfear R (2010) Improved characterisation of among-lineage rate variation in cetacean mitogenomes using codon-partitioned relaxed clocks. Mitochondrial DNA 21, Ho SYW, Lanfear R, Bromham L, et al. (2011) Time-dependent rates of molecular evolution. Molecular Ecology 20, Ho SYW, Phillips MJ (2009) Accounting for calibration uncertainty in phylogenetic estimation of evolutionary divergence times. Systematic Biology 58, Ho SYW, Phillips MJ, Drummond AJ, Cooper A (2005) Accuracy of rate estimation using relaxedclock models with a critical focus on the early metazoan radiation. Molecular Biology and Evolution 22, Ho SYW, Shapiro B (2011) Skyline-plot methods for estimating demographic history from nucleotide sequences. Molecular Ecology Resources 11,
37 Huelsenbeck JP, Larget B, Alfaro ME (2004) Bayesian phylogenetic model selection using reversible jump Markov chain Monte Carlo. Molecular Biology and Evolution 21, Huelsenbeck JP, Larget B, Swofford D (2000) A compound poisson process for relaxing the molecular clock. Genetics 154, Huelsenbeck JP, Ronquist F, Nielsen R, Bollback JP (2001) Bayesian inference of phylogeny and its impact on evolutionary biology. Science 294, Inoue J, Donoghue PC, Yang Z (2010) The impact of the representation of fossil calibrations on Bayesian estimation of species divergence times. Systematic Biology 59, Jeffreys H (1935) Some tests of significance, treated by the theory of probability.. Proceedings of the Cambridge Philosophical Society 31, Jeffreys H (1961) The theory of probability. Oxford University Press, Oxford. Kass RE, Raftery AE (1995) Bayes factors. Journal of the American Statistical Association 90, Kim SH, Elango N, Warden C, Vigoda E, Yi SV (2006) Heterogeneous genomic molecular clocks in primates. PLOS Genetics 2, e163. Kimura M, Ohta T (1974) On some principles governing molecular evolution. Proceedings of the National Academy of Sciences of the USA 71, Kingman JFC (1982) The coalescent. Stochastic Processes and their Applications 13, Kishino H, Thorne JL, Bruno WJ (2001) Performance of a divergence time estimation method under a probabilistic model of rate evolution. Molecular Biology and Evolution 18, Kodandaramaiah U (2011) Tectonic calibrations in molecular dating. Current Zoology 57, Kumar S (2005) Molecular clocks: four decades of evolution. Nature Reviews Genetics 6, Lanfear R (2011) The local-clock permutation test: a simple test to compare rates of molecular evolution on phylogenetic trees. Evolution 65, Lanfear R, Calcott B, Ho SYW, Guindon S (2012) Partitionfinder: combined selection of partitioning schemes and substitution models for phylogenetic analyses. Molecular Biology and Evolution 29, Langley CH, Fitch WM (1974) An examination of the constancy of the rate of molecular evolution. Journal of Molecular Evolution 3, Lartillot N, Lepage T, Blanquart S (2009) PhyloBayes 3: a Bayesian software package for phylogenetic reconstruction and molecular dating. Bioinformatics 25,
38 Lartillot N, Philippe H (2006) Computing Bayes factors using thermodynamic integration. Systematic Biology 55, Lepage T, Bryant D, Philippe H, Lartillot N (2007) A general comparison of relaxed molecular clock models. Molecular Biology and Evolution 24, Lepage T, Lawi S, Tupper P, Bryant D (2006) Continuous and tractable models for the variation of evolutionary rates. Mathematic Biosciences 199, Li WL, Drummond AJ (2012) Model averaging and Bayes factor calculation of relaxed molecular clocks in Bayesian phylogenetics. Molecular Biology and Evolution 29, Linder M, Britton T, Sennblad B (2011) Evaluation of Bayesian models of substitution rate evolution--parental guidance versus mutual independence. Systematic Biology 60, Lukoschek V, Keogh JS, Avise JC (2012) Evaluating fossil calibrations for dating phylogenies in light of rates of molecular evolution: a comparison of three approaches. Systematic Biology 61, Margoliash E (1963) Primary structure and evolution of cytochrome c. Proceedings of the National Academy of Sciences of the USA 50, Marshall CR (2008) A simple method for bracketing absolute divergence times on molecular phylogenies using multiple fossil calibration points. American Naturalist 171, Matari NH, Blair JE (2014) A multilocus timescale for oomycete evolution estimated under three distinct molecular clock models. BMC Evolutionary Biology 14, 101. Matschiner M, Bouckaert R (2014) CladeAge. University of Oslo, Norway. Minin VN, Bloomquist EW, Suchard MA (2008) Smooth skyride through a rough skyline: Bayesian coalescent-based inference of population dynamics. Molecular Biology and Evolution 25, Molak M, Lorenzen ED, Shapiro B, Ho SYW (2013) Phylogenetic estimation of timescales using ancient DNA: the effects of temporal sampling scheme and uncertainty in sample ages. Molecular Biology and Evolution 30, Molak M, Suchard MA, Ho SYW, Beilman DW, Shapiro B (2014) Empirical calibrated radiocarbon sampler: a tool for incorporating radiocarbon-date and calibration error into Bayesian phylogenetic analyses of ancient DNA. Molecular Ecology Resources, in press. Mouchiroud D, Gautier C, Bernardi G (1995) Frequencies of synonymous substitutions in mammals are gene-specific and correlated with frequencies of nonsynonymous substitutions. Journal of Molecular Evolution 40, Mower JP, Touzet P, Gummow JS, Delph LF, Palmer JD (2007) Extensive variation in synonymous substitution rates in mitochondrial genes of seed plants. BMC Evolutionary Biology 7, 135.
39 Muse SV, Gaut BS (1997) Comparing patterns of nucleotide substitution rates among chloroplast loci using the relative ratio test. Genetics 146, Muse SV, Weir BS (1992) Testing for equality of evolutionary rates. Genetics 132, Nee S, Holmes EC, May RM, Harvey PH (1994) Extinction rates can be estimated from molecular phylogenies. Philosophical Transactions of the Royal Society of London B 344, Neiman M, Hehman G, Miller JT, Logsdon JM, Jr., Taylor DR (2010) Accelerated mutation accumulation in asexual lineages of a freshwater snail. Molecular Biology and Evolution 27, Newton MA, Raftery AE (1994) Approximate Bayesian inference with the weighted likelihood bootstrap. Journal of the Royal Statistical Society B 56, Nowak MD, Smith AB, Simpson C, Zwickl DJ (2013) A simple method for estimating informative node age priors for the fossil calibration of molecular divergence time analyses. PLOS ONE 8, e Paradis E (2013) Molecular dating of phylogenies by likelihood methods: a comparison of models and a new information criterion. Molecular Phylogenetics and Evolution 67, Parham JF, Donoghue PC, Bell CJ, et al. (2012) Best practices for justifying fossil calibrations. Systematic Biology 61, Peterson AT (2006) Application of molecular clocks in ornithology revisited. Journal of Avian Biology 37, Peterson GI, Masel J (2009) Quantitative prediction of molecular clock and ka/ks at short timescales. Molecular Biology and Evolution 26, Pyron RA (2011) Divergence time estimation using fossils as terminal taxa and the origins of Lissamphibia. Systematic Biology 60, Rambaut A (2000) Estimating the rate of molecular evolution: incorporating noncontemporaneous sequences into maximum likelihood phylogenies. Bioinformatics 16, Rannala B (2002) Identifiability of parameters in MCMC Bayesian inference of phylogeny. Systematic Biology 51, Rannala B, Yang Z (1996) Probability distribution of molecular evolutionary trees: a new method of phylogenetic inference. Journal of Molecular Evolution 43, Rannala B, Yang Z (2007) Inferring speciation times under an episodic molecular clock. Systematic Biology 56, Ronquist F, Klopfstein S, Vilhelmsen L, et al. (2012a) A total-evidence approach to dating with fossils, applied to the early radiation of the Hymenoptera. Systematic Biology 61,
40 Ronquist F, Teslenko M, van der Mark P, et al. (2012b) MrBayes 3.2: efficient Bayesian phylogenetic inference and model choice across a large model space. Systematic Biology 61, Runnegar B (1982) A molecular-clock date for the origin of the animal phyla. Lethaia 15, Rutschmann F (2006) Molecular dating of phylogenetic trees: A brief review of current methods that estimate divergence times. Diversity and Distributions 12, Rutschmann F, Eriksson T, Salim KA, Conti E (2007) Assessing calibration uncertainty in molecular dating: the assignment of fossils to alternative calibration points. Systematic Biology 56, Sanderson MJ (1997) A nonparametric approach to estimating divergence times in the absence of rate constancy. Molecular Biology and Evolution 14, Sanderson MJ (2002) Estimating absolute rates of molecular evolution and divergence times: a penalized likelihood approach. Molecular Biology and Evolution 19, Sanderson MJ (2003) r8s: inferring absolute rates of molecular evolution and divergence times in the absence of a molecular clock. Bioinformatics 19, Sauquet H (2013) A practical guide to molecular dating. Comptes Rendus Palevol 12, Sauquet H, Ho SYW, Gandolfo MA, et al. (2012) Testing the impact of calibration on molecular divergence times using a fossil-rich group: the case of Nothofagus (Fagales). Systematic Biology 61, Shapiro B, Ho SYW, Drummond AJ, et al. (2011) A Bayesian phylogenetic method to estimate unknown sequence ages. Molecular Biology and Evolution 28, Smith NG, Eyre-Walker A (2003) Partitioning the variation in mammalian substitution rates. Molecular Biology and Evolution 20, Smith SA, O'Meara BC (2012) treepl: divergence time estimation using penalized likelihood for large phylogenies. Bioinformatics 28, Snir S, Wolf YI, Koonin EV (2012) Universal pacemaker of genome evolution. PLOS Computational Biology 8, e Stadler T (2010) Sampling-through-time in birth-death trees. Journal of Theoretical Biology 267, Stadler T, Yang Z (2013) Dating phylogenies with sequentially sampled tips. Systematic Biology 62, Stamatakis A, Aberer AJ, Goll C, et al. (2012) RAxML-Light: a tool for computing terabyte phylogenies. Bioinformatics 28,
41 Steel M (2005) Should phylogenetic models be trying to 'fit an elephant'? Trends in Genetics 21, Suchard MA, Weiss RE, Sinsheimer JS (2001) Bayesian selection of continuous-time Markov chain evolutionary models. Molecular Biology and Evolution 18, Sullivan J, Joyce P (2005) Model selection in phylogenetics. Annual Review of Ecology Evolution and Systematics 36, Sun JX, Mullikin JC, Patterson N, Reich DE (2009) Microsatellites are molecular clocks that support accurate inferences about history. Molecular Biology and Evolution 26, Takahata N (1987) On the overdispersed molecular clock. Genetics 116, Tamura K, Battistuzzi FU, Billing-Ross P, et al. (2012) Estimating divergence times in large molecular phylogenies. Proceedings of the National Academy of Sciences of the USA 109, Thomas JA, Welch JJ, Lanfear R, Bromham L (2010) A generation time effect on the rate of molecular evolution in invertebrates. Molecular Biology and Evolution 27, Thorne JL, Kishino H (2002) Divergence time and evolutionary rate estimation with multilocus data. Systematic Biology 51, Thorne JL, Kishino H (2005) Estimation of divergence times from molecular sequence data. In: Statistical Methods in Molecular Evolution (ed. Nielsen R), pp Springer Verlag, New York. Thorne JL, Kishino H, Painter IS (1998) Estimating the rate of evolution of the rate of molecular evolution. Molecular Biology and Evolution 15, Thornhill AH, Popple LW, Carter RJ, Ho SYW, Crisp MD (2012) Are pollen fossils useful for calibrating relaxed molecular clock dating of phylogenies? A comparative study using Myrtaceae. Molecular Phylogenetics and Evolution 63, Wang M, Jiang YY, Kim KM, et al. (2011) A universal molecular clock of protein folds and its power in tracing the early history of aerobic metabolism and planet oxygenation. Molecular Biology and Evolution 28, Warnock RC, Yang Z, Donoghue PC (2012) Exploring uncertainty in the calibration of the molecular clock. Biology Letters 8, Welch JJ, Bromham L (2005) Molecular dating when rates vary. Trends in Ecology and Evolution 20, Welch JJ, Fontanillas E, Bromham L (2005) Molecular dates for the "Cambrian explosion": The influence of prior assumptions. Systematic Biology 54, Wilke T, Schultheiss R, Albrecht C (2009) As time goes by: A simple fool's guide to molecular clock approaches in invertebrates. American Malacological Bulletin 27,
42 Wilkinson RD, Steiper ME, Soligo C, et al. (2011) Dating primate divergences through an integrated analysis of palaeontological and molecular data. Systematic Biology 60, Wolf YI, Snir S, Koonin EV (2013) Stability along with extreme variability in core genome evolution. Genome Biology and Evolution 5, Wolfe KH, Li WH, Sharp PM (1987) Rates of nucleotide substitution vary greatly among plant mitochondrial, chloroplast, and nuclear DNAs. Proceedings of the National Academy of Sciences of the USA 84, Worobey M, Han GZ, Rambaut A (2014) A synchronized global sweep of the internal genes of modern avian influenza virus. Nature 508, Wu CI, Li WH (1985) Evidence for higher rates of nucleotide substitution in rodents than in man. Proceedings of the National Academy of Sciences of the USA 82, Xia X, Yang Q (2011) A distance-based least-square method for dating speciation events. Molecular Phlyogenetics and Evolution 59, Xie W, Lewis PO, Fan Y, Kuo L, Chen MH (2011) Improving marginal likelihood estimation for Bayesian phylogenetic model selection. Systematic Biology 60, Yang Z (1994) Maximum likelihood phylogenetic estimation from DNA sequences with variable rates over sites: approximate methods. Journal of Molecular Evolution 39, Yang Z (1996) Maximum-likelihood models for combined analyses of multiple sequence data. Journal of Molecular Evolution 42, Yang Z (2004) A heuristic rate smoothing procedure for maximum likelihood estimtion of species divergence times. Acta Zoologica Sinica 50, Yang Z (2007) PAML 4: phylogenetic analysis by maximum likelihood. Molecular Biology and Evolution 24, Yang Z (2014) Molecular Evolution: A Statistical Approach. Oxford University Press, Oxford. Yang Z, Rannala B (1997) Bayesian phylogenetic inference using DNA sequences: a Markov chain Monte Carlo method. Molecular Biology and Evolution 17, Yang Z, Rannala B (2006) Bayesian estimation of species divergence times under a molecular clock using multiple fossil calibrations with soft bounds. Molecular Biology and Evolution 23, Yoder AD, Yang Z (2000) Estimation of primate speciation dates using local molecular clocks. Molecular Biology and Evolution 17, Yule GU (1924) A mathematical theory of evolution, based on the conclusions of Dr. J. C. Willis, F.R.S. Philosophical Transactions of the Royal Society of London B 213,
43 Zuckerkandl E (1976) Evolutionary processes and evolutionary noise at the molecular level. I. Functional density in proteins. Journal of Molecular Evolution 7, Zuckerkandl E, Pauling L (1962) Molecular Disease, Evolution, and Genic Heterogeneity. In: Horizons in Biochemistry (eds. Kasha M, Pullman B), pp Academic Press, New York, USA. Zuckerkandl E, Pauling L (1965) Evolutionary divergence and convergence in proteins. In: Evolving Genes and Proteins (eds. Bryson V, Vogek HJ), pp Academic Press, New York. Table 1. Phylogenetic software for estimating evolutionary rates and timescales from genetic sequence data. Software DAMBE PATHd8 r8s APEchronos PAMLbaseml Method Distancebased Distancebased Nonparametri c rate smoothin g and likelihood Likelihoo d Likelihoo d S C Models of rate variation a L C Calibrat ions b D C A R C U R C Constrai nts Constrai nts Constrai nts Constrai nts Constrai nts Mult iple loci c Tip date s Tree topolo gy Fixed Fixed Uncerta inty of node ages Bootstra p Bootstra p Fixed Bootstra p Fixed R Fixed Bootstra p S.E./Boo tstrap Re f. d
44 Physher RelTime treepl Likelihoo d Likelihoo d Likelihoo d BEAST Bayesian Constrai nts Constrai nts Constrai nts Priors R Fixed Fixed Fixed Estima ted Bootstra p S.E./Boo tstrap Bootstra p Posterior 9 DPPDiv Bayesian Priors Fixed Posterior 10 MrBayes Bayesian Multidivti me PAML- MCMCtre e PhyloBaye s Bayesian Bayesian Bayesian Priors R Estima ted Posterior 11 Priors R Fixed Posterior 12 Priors R Fixed Posterior 5 Priors G Fixed Posterior 13 PhyTime Bayesian Priors Fixed Posterior 14 RevBayes Bayesian TreeTime Bayesian Priors R Priors Estima ted Estima ted Posterior 15 Posterior 16 a Models of rate variation among branches: strict clock (SC), local multi-rate clock (LC), discrete multi-rate clock (DC), autocorrelated relaxed clock (ARC), and uncorrelated relaxed clock (URC). b Methods either implement calibrations as constraints on node ages (Constraints) or as prior distributions on node ages (Priors). All methods are able to implement calibrations at multiple nodes in the tree simultaneously. c Some methods allow distinct clock models for different loci, equivalent to accounting for residual effects (R). Some methods allow different loci to have a different rate, but assume that all loci share the same pattern of rate variation among branches. This is equivalent to accounting for gene effects (G). All of the listed methods are able to account for lineage effects through the use of models of rate variation among branches.
45 d References: (1) Xia and Yang (2011); (2) Britton et al. (2007); (3) Sanderson (2003); (4) Paradis (2013); (5) Yang (2007); (6) Fourment and Holmes (2014); (7) Tamura et al. (2012); (8) Smith and O'Meara (2012); (9) Drummond et al. (2012); (10) Heath et al. (2012); (11) Ronquist et al. (2012b); (12) Thorne et al. (1998); (13) Lartillot et al. (2009); (14) Guindon (2010, 2013); (15) (16) Himmelmann and Metzler (2009). Figure captions Figure 1. Different approaches for representing uncertainty in calibrations in a phylogenetic tree. Calibrations at internal nodes (red), from top to bottom: normal distribution, lognormal distribution, exponential distribution (Drummond et al., 2006), uniform distribution with hard minimum and soft maximum bounds (Yang & Rannala, 2006), uniform distribution with hard minimum and maximum bounds, point value, and fossilised birth-death model (Heath et al., 2014). F 1 and F 2 represent fossil occurrences of known age. Calibrations at terminal nodes (blue), from top to bottom: empirical calibrated radiocarbon sampler (Molak et al., 2014), normal distribution, uniform distribution with hard minimum and maximum bounds, and point value. Figure 2. Phylogenetic trees showing differences among models of rate variation. Panel (a) shows a chronogram with branch lengths measured in time units. The scale bar indicates 1 time unit. The remaining panels show phylograms with branch lengths generated under a range of different clock models: (b) strict clock, with a constant rate among branches; (c) local multi-rate clock, with a distinct rate in each of three groups of branches; (d) discrete multi-rate clock, with a small number of branchspecific rates distributed throughout the tree; (e) autocorrelated relaxed clock, with a distinct rate along each branch that is correlated with the rate along its parent branch; and (f) uncorrelated relaxed
46 clock, with a distinct rate along each branch drawn from a chosen probability distribution. In panels (b) to (f), scale bars represent 0.01 substitutions per site. Figure 3. Clock-model schemes for dealing with different patterns of rate variation in a four-gene data set. (a) When only gene effects are present, a strict-clock model can be used, with a different rate (μ i ) for each gene. (b) When gene and lineage effects are both present, a relaxed-clock model can be used, with the branch-specific rates being scaled differently for each gene. The ratio of rates along different branches are identical across genes. (c) When gene-by-lineage (residual) effects are present, separate relaxed-clock models should be applied to clusters of genes that share the same pattern of among-lineage rate variation. Each gene also has a different ancestral rate (autocorrelated relaxed clock) or mean rate (uncorrelated relaxed clock).
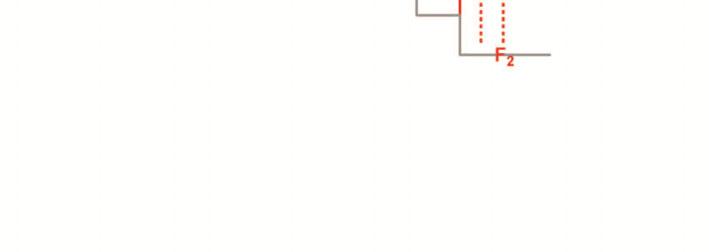
47
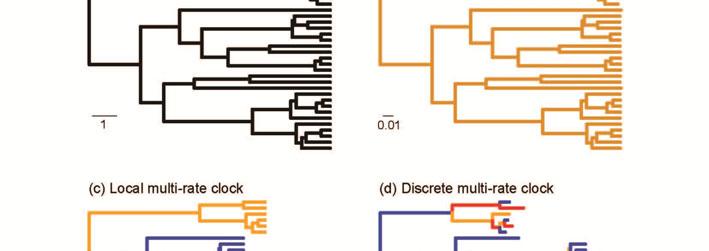
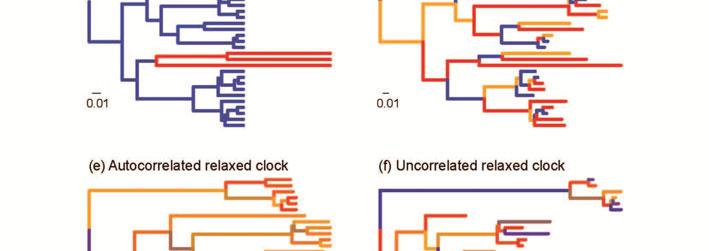
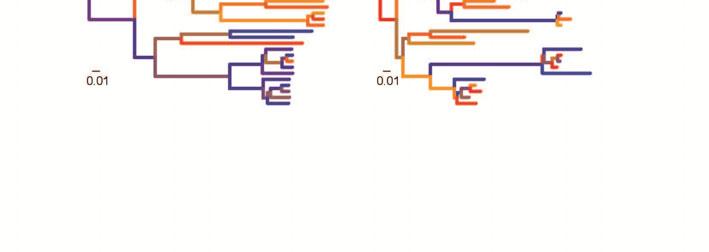
48
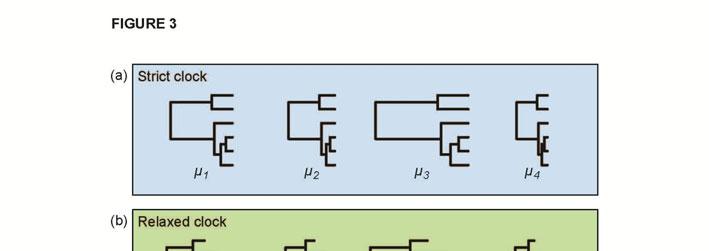
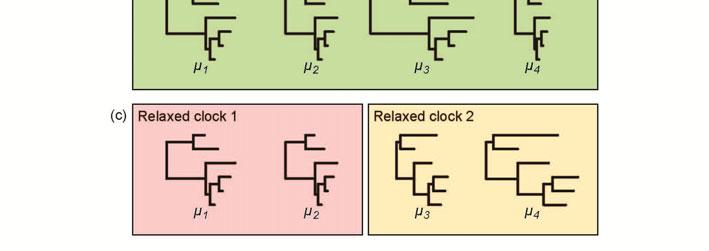
49
Integrative Biology 200 "PRINCIPLES OF PHYLOGENETICS" Spring 2018 University of California, Berkeley
 Integrative Biology 200 "PRINCIPLES OF PHYLOGENETICS" Spring 2018 University of California, Berkeley B.D. Mishler Feb. 14, 2018. Phylogenetic trees VI: Dating in the 21st century: clocks, & calibrations;
Using phylogenetics to estimate species divergence times... Basics and basic issues for Bayesian inference of divergence times (plus some digression)
") Using phylogenetics to estimate species divergence times... More accurately... Basics and basic issues for Bayesian inference of divergence times (plus some digression) "A comparison of the structures
Using phylogenetics to estimate species divergence times... More accurately... Basics and basic issues for Bayesian inference of divergence times (plus some digression) "A comparison of the structures
Concepts and Methods in Molecular Divergence Time Estimation
 Concepts and Methods in Molecular Divergence Time Estimation 26 November 2012 Prashant P. Sharma American Museum of Natural History Overview 1. Why do we date trees? 2. The molecular clock 3. Local clocks
Inferring Speciation Times under an Episodic Molecular Clock
 Syst. Biol. 56(3):453 466, 2007 Copyright c Society of Systematic Biologists ISSN: 1063-5157 print / 1076-836X online DOI: 10.1080/10635150701420643 Inferring Speciation Times under an Episodic Molecular
Amira A. AL-Hosary PhD of infectious diseases Department of Animal Medicine (Infectious Diseases) Faculty of Veterinary Medicine Assiut
 Faculty of Veterinary Medicine Assiut") Amira A. AL-Hosary PhD of infectious diseases Department of Animal Medicine (Infectious Diseases) Faculty of Veterinary Medicine Assiut University-Egypt Phylogenetic analysis Phylogenetic Basics: Biological
Amira A. AL-Hosary PhD of infectious diseases Department of Animal Medicine (Infectious Diseases) Faculty of Veterinary Medicine Assiut University-Egypt Phylogenetic analysis Phylogenetic Basics: Biological
Local and relaxed clocks: the best of both worlds
 Local and relaxed clocks: the best of both worlds Mathieu Fourment and Aaron E. Darling ithree institute, University of Technology Sydney, Sydney, Australia ABSTRACT Time-resolved phylogenetic methods
DATING LINEAGES: MOLECULAR AND PALEONTOLOGICAL APPROACHES TO THE TEMPORAL FRAMEWORK OF CLADES
 Int. J. Plant Sci. 165(4 Suppl.):S7 S21. 2004. Ó 2004 by The University of Chicago. All rights reserved. 1058-5893/2004/1650S4-0002$15.00 DATING LINEAGES: MOLECULAR AND PALEONTOLOGICAL APPROACHES TO THE
Dr. Amira A. AL-Hosary
 Phylogenetic analysis Amira A. AL-Hosary PhD of infectious diseases Department of Animal Medicine (Infectious Diseases) Faculty of Veterinary Medicine Assiut University-Egypt Phylogenetic Basics: Biological
Dating r8s, multidistribute
 Phylomethods Fall 2006 Dating r8s, multidistribute Jun G. Inoue Software of Dating Molecular Clock Relaxed Molecular Clock r8s multidistribute r8s Michael J. Sanderson UC Davis Estimation of rates and
8/23/2014. Phylogeny and the Tree of Life
 Phylogeny and the Tree of Life Chapter 26 Objectives Explain the following characteristics of the Linnaean system of classification: a. binomial nomenclature b. hierarchical classification List the major
Phylogenetic Inference using RevBayes
 Phylogenetic Inference using RevBayes Model section using Bayes factors Sebastian Höhna 1 Overview This tutorial demonstrates some general principles of Bayesian model comparison, which is based on estimating
Constructing Evolutionary/Phylogenetic Trees
 Constructing Evolutionary/Phylogenetic Trees 2 broad categories: istance-based methods Ultrametric Additive: UPGMA Transformed istance Neighbor-Joining Character-based Maximum Parsimony Maximum Likelihood
An Evaluation of Different Partitioning Strategies for Bayesian Estimation of Species Divergence Times
 Syst. Biol. 67(1):61 77, 2018 The Author(s) 2017. Published by Oxford University Press, on behalf of the Society of Systematic Biologists. This is an Open Access article distributed under the terms of
MOLECULAR SYSTEMATICS: A SYNTHESIS OF THE COMMON METHODS AND THE STATE OF KNOWLEDGE
 CELLULAR & MOLECULAR BIOLOGY LETTERS http://www.cmbl.org.pl Received: 16 August 2009 Volume 15 (2010) pp 311-341 Final form accepted: 01 March 2010 DOI: 10.2478/s11658-010-0010-8 Published online: 19 March
Chapter 26: Phylogeny and the Tree of Life Phylogenies Show Evolutionary Relationships
 Chapter 26: Phylogeny and the Tree of Life You Must Know The taxonomic categories and how they indicate relatedness. How systematics is used to develop phylogenetic trees. How to construct a phylogenetic
Molecular Clocks. The Holy Grail. Rate Constancy? Protein Variability. Evidence for Rate Constancy in Hemoglobin. Given
 Molecular Clocks Rose Hoberman The Holy Grail Fossil evidence is sparse and imprecise (or nonexistent) Predict divergence times by comparing molecular data Given a phylogenetic tree branch lengths (rt)
"PRINCIPLES OF PHYLOGENETICS: ECOLOGY AND EVOLUTION" Integrative Biology 200B Spring 2009 University of California, Berkeley
 "PRINCIPLES OF PHYLOGENETICS: ECOLOGY AND EVOLUTION" Integrative Biology 200B Spring 2009 University of California, Berkeley B.D. Mishler Jan. 22, 2009. Trees I. Summary of previous lecture: Hennigian
Molecular dating of phylogenetic trees: A brief review of current methods that estimate divergence times
 Diversity and Distributions, (Diversity Distrib.) (2006) 12, 35 48 Blackwell Publishing, Ltd. CAPE SPECIAL FEATURE Molecular dating of phylogenetic trees: A brief review of current methods that estimate
Constructing Evolutionary/Phylogenetic Trees
 Constructing Evolutionary/Phylogenetic Trees 2 broad categories: Distance-based methods Ultrametric Additive: UPGMA Transformed Distance Neighbor-Joining Character-based Maximum Parsimony Maximum Likelihood
Markov chain Monte-Carlo to estimate speciation and extinction rates: making use of the forest hidden behind the (phylogenetic) tree
 tree") Markov chain Monte-Carlo to estimate speciation and extinction rates: making use of the forest hidden behind the (phylogenetic) tree Nicolas Salamin Department of Ecology and Evolution University of Lausanne
Markov chain Monte-Carlo to estimate speciation and extinction rates: making use of the forest hidden behind the (phylogenetic) tree Nicolas Salamin Department of Ecology and Evolution University of Lausanne
Phylogenetic Tree Reconstruction
 I519 Introduction to Bioinformatics, 2011 Phylogenetic Tree Reconstruction Yuzhen Ye (yye@indiana.edu) School of Informatics & Computing, IUB Evolution theory Speciation Evolution of new organisms is driven
POPULATION GENETICS Winter 2005 Lecture 17 Molecular phylogenetics
 POPULATION GENETICS Winter 2005 Lecture 17 Molecular phylogenetics - in deriving a phylogeny our goal is simply to reconstruct the historical relationships between a group of taxa. - before we review the
Phylogenetics: Bayesian Phylogenetic Analysis. COMP Spring 2015 Luay Nakhleh, Rice University
 Phylogenetics: Bayesian Phylogenetic Analysis COMP 571 - Spring 2015 Luay Nakhleh, Rice University Bayes Rule P(X = x Y = y) = P(X = x, Y = y) P(Y = y) = P(X = x)p(y = y X = x) P x P(X = x 0 )P(Y = y X
Some of these slides have been borrowed from Dr. Paul Lewis, Dr. Joe Felsenstein. Thanks!
 Some of these slides have been borrowed from Dr. Paul Lewis, Dr. Joe Felsenstein. Thanks! Paul has many great tools for teaching phylogenetics at his web site: http://hydrodictyon.eeb.uconn.edu/people/plewis
Taming the Beast Workshop
 Workshop and Chi Zhang June 28, 2016 1 / 19 Species tree Species tree the phylogeny representing the relationships among a group of species Figure adapted from [Rogers and Gibbs, 2014] Gene tree the phylogeny
A (short) introduction to phylogenetics
 introduction to phylogenetics") A (short) introduction to phylogenetics Thibaut Jombart, Marie-Pauline Beugin MRC Centre for Outbreak Analysis and Modelling Imperial College London Genetic data analysis with PR Statistics, Millport Field
A (short) introduction to phylogenetics Thibaut Jombart, Marie-Pauline Beugin MRC Centre for Outbreak Analysis and Modelling Imperial College London Genetic data analysis with PR Statistics, Millport Field
Introduction to Phylogenetic Analysis
 Introduction to Phylogenetic Analysis Tuesday 23 Wednesday 24 July, 2013 School of Biological Sciences Overview This workshop will provide an introduction to phylogenetic analysis, leading to a focus on
Appendix from L. J. Revell, On the Analysis of Evolutionary Change along Single Branches in a Phylogeny
 008 by The University of Chicago. All rights reserved.doi: 10.1086/588078 Appendix from L. J. Revell, On the Analysis of Evolutionary Change along Single Branches in a Phylogeny (Am. Nat., vol. 17, no.
Likelihood Ratio Tests for Detecting Positive Selection and Application to Primate Lysozyme Evolution
 Likelihood Ratio Tests for Detecting Positive Selection and Application to Primate Lysozyme Evolution Ziheng Yang Department of Biology, University College, London An excess of nonsynonymous substitutions
UoN, CAS, DBSC BIOL102 lecture notes by: Dr. Mustafa A. Mansi. The Phylogenetic Systematics (Phylogeny and Systematics)
") - Phylogeny? - Systematics? The Phylogenetic Systematics (Phylogeny and Systematics) - Phylogenetic systematics? Connection between phylogeny and classification. - Phylogenetic systematics informs the
- Phylogeny? - Systematics? The Phylogenetic Systematics (Phylogeny and Systematics) - Phylogenetic systematics? Connection between phylogeny and classification. - Phylogenetic systematics informs the
Introduction to Phylogenetic Analysis
 Introduction to Phylogenetic Analysis Tuesday 24 Wednesday 25 July, 2012 School of Biological Sciences Overview This free workshop provides an introduction to phylogenetic analysis, with a focus on the
Phylogeny and systematics. Why are these disciplines important in evolutionary biology and how are they related to each other?
 Phylogeny and systematics Why are these disciplines important in evolutionary biology and how are they related to each other? Phylogeny and systematics Phylogeny: the evolutionary history of a species
Chapter 16: Reconstructing and Using Phylogenies
 Chapter Review 1. Use the phylogenetic tree shown at the right to complete the following. a. Explain how many clades are indicated: Three: (1) chimpanzee/human, (2) chimpanzee/ human/gorilla, and (3)chimpanzee/human/
Relaxing the Molecular Clock to Different Degrees for Different Substitution Types
 Relaxing the Molecular Clock to Different Degrees for Different Substitution Types Hui-Jie Lee,*,1 Nicolas Rodrigue, 2 and Jeffrey L. Thorne 1,3 1 Department of Statistics, North Carolina State University
Phylogenomics. Jeffrey P. Townsend Department of Ecology and Evolutionary Biology Yale University. Tuesday, January 29, 13
 Phylogenomics Jeffrey P. Townsend Department of Ecology and Evolutionary Biology Yale University How may we improve our inferences? How may we improve our inferences? Inferences Data How may we improve
Preliminaries. Download PAUP* from: Tuesday, July 19, 16
 Preliminaries Download PAUP* from: http://people.sc.fsu.edu/~dswofford/paup_test 1 A model of the Boston T System 1 Idea from Paul Lewis A simpler model? 2 Why do models matter? Model-based methods including
Reconstructing the history of lineages
 Reconstructing the history of lineages Class outline Systematics Phylogenetic systematics Phylogenetic trees and maps Class outline Definitions Systematics Phylogenetic systematics/cladistics Systematics
Assessing an Unknown Evolutionary Process: Effect of Increasing Site- Specific Knowledge Through Taxon Addition
 Assessing an Unknown Evolutionary Process: Effect of Increasing Site- Specific Knowledge Through Taxon Addition David D. Pollock* and William J. Bruno* *Theoretical Biology and Biophysics, Los Alamos National
7. Tests for selection
 Sequence analysis and genomics 7. Tests for selection Dr. Katja Nowick Group leader TFome and Transcriptome Evolution Bioinformatics group Paul-Flechsig-Institute for Brain Research www. nowicklab.info
Estimating the Rate of Evolution of the Rate of Molecular Evolution
 Estimating the Rate of Evolution of the Rate of Molecular Evolution Jeffrey L. Thorne,* Hirohisa Kishino, and Ian S. Painter* *Program in Statistical Genetics, Statistics Department, North Carolina State
Bustamante et al., Supplementary Nature Manuscript # 1 out of 9 Information #
 Bustamante et al., Supplementary Nature Manuscript # 1 out of 9 Details of PRF Methodology In the Poisson Random Field PRF) model, it is assumed that non-synonymous mutations at a given gene are either
Bayesian Inference using Markov Chain Monte Carlo in Phylogenetic Studies
 Bayesian Inference using Markov Chain Monte Carlo in Phylogenetic Studies 1 What is phylogeny? Essay written for the course in Markov Chains 2004 Torbjörn Karfunkel Phylogeny is the evolutionary development
(haemoglobins, cytochrome c, fibrinopeptides) from different species of mammals
 from different species of mammals") Bayesian molecular clock dating of species divergences in the genomics era Mario dos Reis 1,2, Philip CJ Donoghue 3 and Ziheng Yang 1 1. Department of Genetics, Evolution and Environment, University College
Bayesian molecular clock dating of species divergences in the genomics era Mario dos Reis 1,2, Philip CJ Donoghue 3 and Ziheng Yang 1 1. Department of Genetics, Evolution and Environment, University College
Integrative Biology 200A "PRINCIPLES OF PHYLOGENETICS" Spring 2012 University of California, Berkeley
 Integrative Biology 200A "PRINCIPLES OF PHYLOGENETICS" Spring 2012 University of California, Berkeley B.D. Mishler Feb. 7, 2012. Morphological data IV -- ontogeny & structure of plants The last frontier
Bayesian Models for Phylogenetic Trees
 Bayesian Models for Phylogenetic Trees Clarence Leung* 1 1 McGill Centre for Bioinformatics, McGill University, Montreal, Quebec, Canada ABSTRACT Introduction: Inferring genetic ancestry of different species
C3020 Molecular Evolution. Exercises #3: Phylogenetics
 C3020 Molecular Evolution Exercises #3: Phylogenetics Consider the following sequences for five taxa 1-5 and the known outgroup O, which has the ancestral states (note that sequence 3 has changed from
STA 4273H: Statistical Machine Learning
 STA 4273H: Statistical Machine Learning Russ Salakhutdinov Department of Computer Science! Department of Statistical Sciences! rsalakhu@cs.toronto.edu! h0p://www.cs.utoronto.ca/~rsalakhu/ Lecture 7 Approximate
Penalized Loss functions for Bayesian Model Choice
 Penalized Loss functions for Bayesian Model Choice Martyn International Agency for Research on Cancer Lyon, France 13 November 2009 The pure approach For a Bayesian purist, all uncertainty is represented
How should we organize the diversity of animal life?
 How should we organize the diversity of animal life? The difference between Taxonomy Linneaus, and Cladistics Darwin What are phylogenies? How do we read them? How do we estimate them? Classification (Taxonomy)
Consensus Methods. * You are only responsible for the first two
 Consensus Trees * consensus trees reconcile clades from different trees * consensus is a conservative estimate of phylogeny that emphasizes points of agreement * philosophy: agreement among data sets is
Understanding relationship between homologous sequences
 Molecular Evolution Molecular Evolution How and when were genes and proteins created? How old is a gene? How can we calculate the age of a gene? How did the gene evolve to the present form? What selective
Algorithms in Bioinformatics FOUR Pairwise Sequence Alignment. Pairwise Sequence Alignment. Convention: DNA Sequences 5. Sequence Alignment
 Algorithms in Bioinformatics FOUR Sami Khuri Department of Computer Science San José State University Pairwise Sequence Alignment Homology Similarity Global string alignment Local string alignment Dot
PHYLOGENY & THE TREE OF LIFE
 PHYLOGENY & THE TREE OF LIFE PREFACE In this powerpoint we learn how biologists distinguish and categorize the millions of species on earth. Early we looked at the process of evolution here we look at
"Nothing in biology makes sense except in the light of evolution Theodosius Dobzhansky
 MOLECULAR PHYLOGENY "Nothing in biology makes sense except in the light of evolution Theodosius Dobzhansky EVOLUTION - theory that groups of organisms change over time so that descendeants differ structurally
Modeling Noise in Genetic Sequences
 Modeling Noise in Genetic Sequences M. Radavičius 1 and T. Rekašius 2 1 Institute of Mathematics and Informatics, Vilnius, Lithuania 2 Vilnius Gediminas Technical University, Vilnius, Lithuania 1. Introduction:
Inferring Molecular Phylogeny
 Dr. Walter Salzburger he tree of life, ustav Klimt (1907) Inferring Molecular Phylogeny Inferring Molecular Phylogeny 55 Maximum Parsimony (MP): objections long branches I!! B D long branch attraction
Bayesian Phylogenetic Estimation of Clade Ages Supports Trans-Atlantic Dispersal of Cichlid Fishes
 Syst. Biol. 66(1):3 22, 2017 The Author(s) 2016. Published by Oxford University Press, on behalf of the Society of Systematic Biologists. All rights reserved. For Permissions, please email: journals.permissions@oup.com
Molecular Evolution & Phylogenetics
 Molecular Evolution & Phylogenetics Heuristics based on tree alterations, maximum likelihood, Bayesian methods, statistical confidence measures Jean-Baka Domelevo Entfellner Learning Objectives know basic
Inference of Viral Evolutionary Rates from Molecular Sequences
 Inference of Viral Evolutionary Rates from Molecular Sequences Alexei Drummond 1,2, Oliver G. Pybus 1 and Andrew Rambaut 1 * 1 Department of Zoology, University of Oxford, South Parks Road, Oxford, OX1
Phylogeny 9/8/2014. Evolutionary Relationships. Data Supporting Phylogeny. Chapter 26
 Phylogeny Chapter 26 Taxonomy Taxonomy: ordered division of organisms into categories based on a set of characteristics used to assess similarities and differences Carolus Linnaeus developed binomial nomenclature,
Estimating Divergence Dates from Molecular Sequences
 Estimating Divergence Dates from Molecular Sequences Andrew Rambaut and Lindell Bromham Department of Zoology, University of Oxford The ability to date the time of divergence between lineages using molecular
A Statistical Input Pruning Method for Artificial Neural Networks Used in Environmental Modelling
 A Statistical Input Pruning Method for Artificial Neural Networks Used in Environmental Modelling G. B. Kingston, H. R. Maier and M. F. Lambert Centre for Applied Modelling in Water Engineering, School
9/30/11. Evolution theory. Phylogenetic Tree Reconstruction. Phylogenetic trees (binary trees) Phylogeny (phylogenetic tree)
 Phylogeny (phylogenetic tree)") I9 Introduction to Bioinformatics, 0 Phylogenetic ree Reconstruction Yuzhen Ye (yye@indiana.edu) School of Informatics & omputing, IUB Evolution theory Speciation Evolution of new organisms is driven by
I9 Introduction to Bioinformatics, 0 Phylogenetic ree Reconstruction Yuzhen Ye (yye@indiana.edu) School of Informatics & omputing, IUB Evolution theory Speciation Evolution of new organisms is driven by
Classification and Phylogeny
 Classification and Phylogeny The diversity of life is great. To communicate about it, there must be a scheme for organization. There are many species that would be difficult to organize without a scheme
Biology 211 (2) Week 1 KEY!
 Week 1 KEY!") Biology 211 (2) Week 1 KEY Chapter 1 KEY FIGURES: 1.2, 1.3, 1.4, 1.5, 1.6, 1.7 VOCABULARY: Adaptation: a trait that increases the fitness Cells: a developed, system bound with a thin outer layer made of
Biology 211 (2) Week 1 KEY Chapter 1 KEY FIGURES: 1.2, 1.3, 1.4, 1.5, 1.6, 1.7 VOCABULARY: Adaptation: a trait that increases the fitness Cells: a developed, system bound with a thin outer layer made of
Biol 206/306 Advanced Biostatistics Lab 11 Models of Trait Evolution Fall 2016
 Biol 206/306 Advanced Biostatistics Lab 11 Models of Trait Evolution Fall 2016 By Philip J. Bergmann 0. Laboratory Objectives 1. Explore how evolutionary trait modeling can reveal different information
Phylogenetic Analysis
 Phylogenetic Analysis Aristotle Through classification, one might discover the essence and purpose of species. Nelson & Platnick (1981) Systematics and Biogeography Carl Linnaeus Swedish botanist (1700s)
Phylogenetic Analysis
 Phylogenetic Analysis Aristotle Through classification, one might discover the essence and purpose of species. Nelson & Platnick (1981) Systematics and Biogeography Carl Linnaeus Swedish botanist (1700s)
Phylogenetic Analysis
 Phylogenetic Analysis Aristotle Through classification, one might discover the essence and purpose of species. Nelson & Platnick (1981) Systematics and Biogeography Carl Linnaeus Swedish botanist (1700s)
CHAPTERS 24-25: Evidence for Evolution and Phylogeny
 CHAPTERS 24-25: Evidence for Evolution and Phylogeny 1. For each of the following, indicate how it is used as evidence of evolution by natural selection or shown as an evolutionary trend: a. Paleontology
Letter to the Editor. Department of Biology, Arizona State University
 Letter to the Editor Traditional Phylogenetic Reconstruction Methods Reconstruct Shallow and Deep Evolutionary Relationships Equally Well Michael S. Rosenberg and Sudhir Kumar Department of Biology, Arizona
Phylogenetic Analysis. Han Liang, Ph.D. Assistant Professor of Bioinformatics and Computational Biology UT MD Anderson Cancer Center
 Phylogenetic Analysis Han Liang, Ph.D. Assistant Professor of Bioinformatics and Computational Biology UT MD Anderson Cancer Center Outline Basic Concepts Tree Construction Methods Distance-based methods
Thanks to Paul Lewis and Joe Felsenstein for the use of slides
 Thanks to Paul Lewis and Joe Felsenstein for the use of slides Review Hennigian logic reconstructs the tree if we know polarity of characters and there is no homoplasy UPGMA infers a tree from a distance
arxiv: v2 [q-bio.pe] 18 Oct 2013
![arxiv: v2 [q-bio.pe] 18 Oct 2013](/thumbs/73/69069874.jpg "arxiv: v2 [q-bio.pe] 18 Oct 2013") arxiv:131.2968 The Fossilized Birth-Death Process: arxiv:131.2968v2 [q-bio.pe] 18 Oct 213 A Coherent Model of Fossil Calibration for Divergence Time Estimation Tracy A. Heath 1,2, John P. Huelsenbeck 1,3,
arxiv:131.2968 The Fossilized Birth-Death Process: arxiv:131.2968v2 [q-bio.pe] 18 Oct 213 A Coherent Model of Fossil Calibration for Divergence Time Estimation Tracy A. Heath 1,2, John P. Huelsenbeck 1,3,
A Phylogenetic Network Construction due to Constrained Recombination
 A Phylogenetic Network Construction due to Constrained Recombination Mohd. Abdul Hai Zahid Research Scholar Research Supervisors: Dr. R.C. Joshi Dr. Ankush Mittal Department of Electronics and Computer
Chapter Chemical Uniqueness 1/23/2009. The Uses of Principles. Zoology: the Study of Animal Life. Fig. 1.1
 Fig. 1.1 Chapter 1 Life: Biological Principles and the Science of Zoology BIO 2402 General Zoology Copyright The McGraw Hill Companies, Inc. Permission required for reproduction or display. The Uses of
As time goes by: A simple fool s guide to molecular clock approaches in invertebrates*
 Amer. Malac. Bull. 27: 25-45 (2009) As time goes by: A simple fool s guide to molecular clock approaches in invertebrates* Thomas Wilke, Roland Schultheiß, and Christian Albrecht Department of Animal Ecology
Estimating Evolutionary Trees. Phylogenetic Methods
 Estimating Evolutionary Trees v if the data are consistent with infinite sites then all methods should yield the same tree v it gets more complicated when there is homoplasy, i.e., parallel or convergent
Organizing Life s Diversity
 17 Organizing Life s Diversity section 2 Modern Classification Classification systems have changed over time as information has increased. What You ll Learn species concepts methods to reveal phylogeny
Homework Assignment, Evolutionary Systems Biology, Spring Homework Part I: Phylogenetics:
 Homework Assignment, Evolutionary Systems Biology, Spring 2009. Homework Part I: Phylogenetics: Introduction. The objective of this assignment is to understand the basics of phylogenetic relationships
A Simple Method for Estimating Informative Node Age Priors for the Fossil Calibration of Molecular Divergence Time Analyses
 A Simple Method for Estimating Informative Node Age Priors for the Fossil Calibration of Molecular Divergence Time Analyses Michael D. Nowak 1 *, Andrew B. Smith 2, Carl Simpson 3, Derrick J. Zwickl 4
EVOLUTIONARY DISTANCES
 EVOLUTIONARY DISTANCES FROM STRINGS TO TREES Luca Bortolussi 1 1 Dipartimento di Matematica ed Informatica Università degli studi di Trieste luca@dmi.units.it Trieste, 14 th November 2007 OUTLINE 1 STRINGS:
 that of Phylotree.org, mtdna tree Build 1756 (Supplementary TableS2). is resulted in 78 individuals allocated to the hg B4a1a1 and three individuals to hg Q. e control region (nps 57372 and nps 1602416526)
Thanks to Paul Lewis, Jeff Thorne, and Joe Felsenstein for the use of slides
 hanks to Paul Lewis, Jeff horne, and Joe Felsenstein for the use of slides Hennigian logic reconstructs the tree if we know polarity of characters and there is no homoplasy UPM infers a tree from a distance
Michael Yaffe Lecture #5 (((A,B)C)D) Database Searching & Molecular Phylogenetics A B C D B C D
C)D) Database Searching & Molecular Phylogenetics A B C D B C D") 7.91 Lecture #5 Database Searching & Molecular Phylogenetics Michael Yaffe B C D B C D (((,B)C)D) Outline Distance Matrix Methods Neighbor-Joining Method and Related Neighbor Methods Maximum Likelihood
7.91 Lecture #5 Database Searching & Molecular Phylogenetics Michael Yaffe B C D B C D (((,B)C)D) Outline Distance Matrix Methods Neighbor-Joining Method and Related Neighbor Methods Maximum Likelihood
Phylogenetic Networks, Trees, and Clusters
 Phylogenetic Networks, Trees, and Clusters Luay Nakhleh 1 and Li-San Wang 2 1 Department of Computer Science Rice University Houston, TX 77005, USA nakhleh@cs.rice.edu 2 Department of Biology University
InDel 3-5. InDel 8-9. InDel 3-5. InDel 8-9. InDel InDel 8-9
 Lecture 5 Alignment I. Introduction. For sequence data, the process of generating an alignment establishes positional homologies; that is, alignment provides the identification of homologous phylogenetic
BINF6201/8201. Molecular phylogenetic methods
 BINF60/80 Molecular phylogenetic methods 0-7-06 Phylogenetics Ø According to the evolutionary theory, all life forms on this planet are related to one another by descent. Ø Traditionally, phylogenetics
Statistical nonmolecular phylogenetics: can molecular phylogenies illuminate morphological evolution?
 Statistical nonmolecular phylogenetics: can molecular phylogenies illuminate morphological evolution? 30 July 2011. Joe Felsenstein Workshop on Molecular Evolution, MBL, Woods Hole Statistical nonmolecular
Proceedings of the SMBE Tri-National Young Investigators Workshop 2005
 Proceedings of the SMBE Tri-National Young Investigators Workshop 25 Control of the False Discovery Rate Applied to the Detection of Positively Selected Amino Acid Sites Stéphane Guindon,* Mik Black,*à
Classification and Phylogeny
 Classification and Phylogeny The diversity it of life is great. To communicate about it, there must be a scheme for organization. There are many species that would be difficult to organize without a scheme
Molecular phylogeny How to infer phylogenetic trees using molecular sequences
 Molecular phylogeny How to infer phylogenetic trees using molecular sequences ore Samuelsson Nov 2009 Applications of phylogenetic methods Reconstruction of evolutionary history / Resolving taxonomy issues
What is Phylogenetics
 What is Phylogenetics Phylogenetics is the area of research concerned with finding the genetic connections and relationships between species. The basic idea is to compare specific characters (features)
ESTIMATING DIVERGENCE TIMES FROM MOLECULAR DATA ON PHYLOGENETIC
 Annu. Rev. Ecol. Syst. 2002. 33:707 40 doi: 10.1146/annurev.ecolsys.33.010802.150500 Copyright c 2002 by Annual Reviews. All rights reserved ESTIMATING DIVERGENCE TIMES FROM MOLECULAR DATA ON PHYLOGENETIC
A Bayesian Approach to Phylogenetics
 A Bayesian Approach to Phylogenetics Niklas Wahlberg Based largely on slides by Paul Lewis (www.eeb.uconn.edu) An Introduction to Bayesian Phylogenetics Bayesian inference in general Markov chain Monte
Phylogenies & Classifying species (AKA Cladistics & Taxonomy) What are phylogenies & cladograms? How do we read them? How do we estimate them?
 What are phylogenies & cladograms? How do we read them? How do we estimate them?") Phylogenies & Classifying species (AKA Cladistics & Taxonomy) What are phylogenies & cladograms? How do we read them? How do we estimate them? Carolus Linneaus:Systema Naturae (1735) Swedish botanist &
Phylogenies & Classifying species (AKA Cladistics & Taxonomy) What are phylogenies & cladograms? How do we read them? How do we estimate them? Carolus Linneaus:Systema Naturae (1735) Swedish botanist &
Integrative Biology 200 "PRINCIPLES OF PHYLOGENETICS" Spring 2016 University of California, Berkeley. Parsimony & Likelihood [draft]
![Integrative Biology 200 PRINCIPLES OF PHYLOGENETICS Spring 2016 University of California, Berkeley. Parsimony & Likelihood [draft]](/thumbs/83/87443456.jpg "Integrative Biology 200 PRINCIPLES OF PHYLOGENETICS Spring 2016 University of California, Berkeley. Parsimony & Likelihood [draft]") Integrative Biology 200 "PRINCIPLES OF PHYLOGENETICS" Spring 2016 University of California, Berkeley K.W. Will Parsimony & Likelihood [draft] 1. Hennig and Parsimony: Hennig was not concerned with parsimony
Integrative Biology 200 "PRINCIPLES OF PHYLOGENETICS" Spring 2016 University of California, Berkeley K.W. Will Parsimony & Likelihood [draft] 1. Hennig and Parsimony: Hennig was not concerned with parsimony
The Importance of Data Partitioning and the Utility of Bayes Factors in Bayesian Phylogenetics
 Syst. Biol. 56(4):643 655, 2007 Copyright c Society of Systematic Biologists ISSN: 1063-5157 print / 1076-836X online DOI: 10.1080/10635150701546249 The Importance of Data Partitioning and the Utility
Experimental Design and Data Analysis for Biologists
 Experimental Design and Data Analysis for Biologists Gerry P. Quinn Monash University Michael J. Keough University of Melbourne CAMBRIDGE UNIVERSITY PRESS Contents Preface page xv I I Introduction 1 1.1
Molecular phylogeny How to infer phylogenetic trees using molecular sequences
 Molecular phylogeny How to infer phylogenetic trees using molecular sequences ore Samuelsson Nov 200 Applications of phylogenetic methods Reconstruction of evolutionary history / Resolving taxonomy issues