Weighted gene co-expression analysis. Yuehua Cui June 7, 2013
|
|
|
- Evan Washington
- 6 years ago
- Views:
Transcription
1 Weighted gene co-expression analysis Yuehua Cui June 7, 2013
2 Weighted gene co-expression network (WGCNA) A type of scale-free network: A scale-free network is a network whose degree distribution follows a power law, at least asymptotically. That is, the fraction P(k) of nodes in the network having k connections to other nodes goes for large values of k as p k = ck γ where c is a normalization constant and γ is a parameter whose value is typically in the range 2 < γ < 3, although occasionally it may lie outside these bounds. Scale-free networks are noteworthy because many empirically observed networks appear to be scale-free, including the world wide web, citation networks, biological networks, airline networks and some social networks. From Wikipedia
3 From Wikipedia
4 Reprinted from Linked: The New Science of Networks by Albert-Laszlo Barabasi Scale-Free Network Models in Epidemiology Adapted from J.B. Dunham and F.B. Berlin
 are most important! Courtesy of A.")
5 Flight connections and hub airports In a scale-free network, the nodes with the largest number of links (connections) are most important! Courtesy of A. Barabasi
6 Note: The rest of the slides about WGCNA are adapted or modified from the slides in Dr. Steve Horvath s website at: xpressionnetwork/
7 Philosophy of Weighted Gene Co- Expression Network Analysis Understand the system instead of reporting a list of individual parts Describe the functioning of the engine instead of enumerating individual nuts and bolts Focus on modules as opposed to individual genes this greatly alleviates multiple testing problem Network terminology is intuitive to biologists
8 How to define a gene coexpression network?
9 Gene Co-expression Networks In gene co-expression networks, each gene corresponds to a node. Two genes are connected by an edge if their expression values are highly correlated. Definition of high correlation is somewhat tricky One can use statistical significance But we propose a criterion for picking threshold parameter: scale free topology criterion.
10 Frequency P(k) vs k in scale free networks P(k) Frequency Distribution of Connectivity Scale Free Topology refers to the frequency distribution of the connectivity k p(k)=proportion of nodes that have connectivity k Connectivity k
11 How to check Scale Free Topology? Idea: Log transformation p(k) and k and look at scatter plots Linear model fitting R 2 index can be used to quantify goodness of fit
12 Our `holistic view. Weighted Network View Unweighted View All genes are connected Connection Widths=Connection strengths Some genes are connected All connections are equal Hard thresholding may lead to an information loss. If two genes are correlated with r=0.79, they are deemed unconnected with regard to a hard threshold of τ=0.8
13 Network=Adjacency Matrix A network can be represented by an adjacency matrix, A=[a ij ], that encodes whether/how a pair of nodes is connected. A is a symmetric matrix with entries in [0,1] For unweighted network, entries are 1 or 0 depending on whether or not 2 nodes are adjacent (connected) For weighted networks, the adjacency matrix reports the connection strength between gene pairs
14 Connectivity Gene connectivity = row sum of the adjacency matrix For unweighted networks=number of direct neighbors For weighted networks= sum of connection strengths to other nodes Connectivity k a i i ij ji
15 How to construct a weighted gene co-expression network?
16 Using an adjacency function to define a network Measure co-expression by a similarity s(i,j) in [0,1] e.g. absolute value of the Pearson correlation Define an adjacency matrix as A(i,j) using an adjacency function AF(s(i,j)) Here we consider 2 classes of AFs Step function AF(s)=I(s>) with parameter (unweighted network) Power function AF(s)=s b with parameter b (weighted network) The choice of the AF parameters (, b) determines the properties of the network.
17 Power adjacency function results in a weighted gene network a cor( x, x ) ij i j Often choosing beta=6 works well but in general we use the scale free topology criterion described in Zhang and Horvath 2005.
18 Comparing the power adjacency functions with the step function Adjacency =connection strength Gene Co-expression Similarity
19 The scale free topology criterion for choosing the parameter values of an adjacency function. A) CONSIDER ONLY THOSE PARAMETER VALUES THAT RESULT IN APPROXIMATE SCALE FREE TOPOLOGY B) SELECT THE PARAMETERS THAT RESULT IN THE HIGHEST MEAN NUMBER OF CONNECTIONS Criterion A is motivated by the finding that most metabolic networks (including gene co-expression networks, proteinprotein interaction networks and cellular networks) have been found to exhibit a scale free topology Criterion B leads to high power for detecting modules (clusters of genes) and hub genes.


20 General Framework for Network Analysis Define a Gene Co-expression Similarity Define a Family of Adjacency Functions Determine the AF Parameters Define a Measure of Node Dissimilarity Identify Network Modules (Clustering) Relate Network Concepts to Each Other Relate the Network Concepts to External Gene or Sample Information
21 How to detect network modules?
=1- abs(correlation) Choice by network community =1-Topological Overlap Matrix (TOM) Used here Use the dissimilarity in hierarchical clustering Define modules as")
22 Steps for defining gene modules Define a dissimilarity measure between the genes. Standard Choice: dissim(i,j)=1- abs(correlation) Choice by network community =1-Topological Overlap Matrix (TOM) Used here Use the dissimilarity in hierarchical clustering Define modules as branches of the hierarchical clustering tree Visualize the modules and the clustering results in a heatmap plot Heatmap
23 The topological overlap dissimilarity is used as input of hierarchical clustering TOM ij u a a a iu uj ij min( k, k ) 1a i j ij DistTOM ij 1TOM ij a cor( x, x ) ij i j Generalized in Zhang and Horvath (2005) to the case of weighted networks Generalized in Yip and Horvath (2006) to higher order interactions


24 Using the TOM matrix to cluster genes To group nodes with high topological overlap into modules (clusters), we typically use average linkage hierarchical clustering coupled with the TOM distance measure. Once a dendrogram is obtained from a hierarchical clustering method, we choose a height cutoff to arrive at a clustering. Here modules correspond to branches of the dendrogram Genes correspond to rows and columns TOM plot Hierarchical clustering dendrogram TOM matrix Module: Correspond to branches
 Color bands=modules Multi Dimensional Scaling Traditional View Idea: Use network distance in")
25 Different Ways of Depicting Gene Modules Topological Overlap Plot Gene Functions 1) Rows and columns correspond to genes 2) Red boxes along diagonal are modules 3) Color bands=modules Multi Dimensional Scaling Traditional View Idea: Use network distance in MDS

26 Heatmap view of module Columns= tissue samples Rows=Genes Color band indicates module membership Message: characteristic vertical bands indicate tight co-expression of module genes
27 Module Eigengene= measure of over-expression=average redness=1 st PC of a given module Rows,=genes, Columns=microarray brown brown The brown module eigengenes across samples


28 Genes Gene expression database a conceptual view Samples Sample annotations Gene expression matrix Gene annotations Gene expression levels
29 Singular value decomposition (SVD) Use SVD to get the eigengenes Let X denote an m x n matrix of real-valued data and rank r m n, m genes and n samples The equation for singular value decomposition of X is the following: where U is an m x n matrix, S is an n x n diagonal matrix, and V T is also an n x n matrix. 29

30 UU T =V T V=I 30
 X -1 =(V T ) -1 S -1 U -1 = V S -1 U T Columns of V k corresponds to")
31 T V U w n w X The w i are called the singular values of X If X is singular, some of the w i will be 0 In general rank(x) = number of nonzero w i SVD is mostly unique (up to permutation of singular values, or if some w i are equal) X -1 =(V T ) -1 S -1 U -1 = V S -1 U T Columns of V k corresponds to eigenvectors
32 Module eigengenes can be used to determine whether 2 modules are correlated. If correlation of MEs is high-> consider merging Martingale.Re ME.blue 0.08 ME.brow n ME.green Eigengenes can be used to build separate networks ME.grey ME.turquoise ME.yellow
 Eigengene networks for studying the relationships between co-expression modules.")
33 Consensus eigengene networks in male and female mouse liver data and their relationship to physiological traits Langfelder P, Horvath S (2007) Eigengene networks for studying the relationships between co-expression modules. BMC Systems Biology 2007
34 Important Task in Many Genomic Applications: Given a network (pathway) of interacting genes how to find the central players? Gene connectivity = row sum of the adjacency matrix For unweighted networks=number of direct neighbors For weighted networks= sum of connection strengths to other nodes k i So value of k i indicates the important of the gene in a network j a ij

")


35 A Case Study MC Oldham, S Horvath, DH Geschwind (2006) Conservation and evolution of gene coexpression networks in human and chimpanzee brain. PNAS
 1 Similarity is even higher in")
36 What changed? Despite pronounced phenotypic differences, genomic similarity is ~96% (including single-base substitutions and indels) 1 Similarity is even higher in protein-coding regions 1 Cheng, Z. et al. Nature 437, (2005) Image courtesy of Todd Preuss (Yerkes National Primate Research Center)
37 Assessing the contribution of regulatory changes to human evolution Hypothesis: Changes in the regulation of gene expression were critical during recent human evolution (King & Wilson, 1975) Microarrays are ideally suited to test this hypothesis by comparing expression levels for thousands of genes simultaneously
38 Gene expression is more strongly preserved than gene connectivity Chimp Chimp Expression Cor=0.93 Cor=0.60 Human Expression Human Connectivity Hypothesis: molecular wiring makes us human Raw data from Khaitovich et al., 2004 Mike Oldham

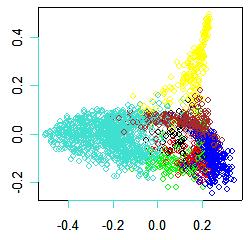
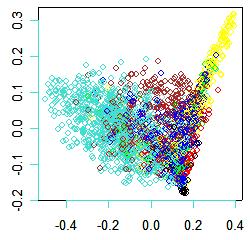
39 A B Human Chimp

40 p = 1.33x10⁻⁴ p = 8.93x10⁻⁴ p = 1.35x10⁻⁶ p = 1.33x10⁻⁴
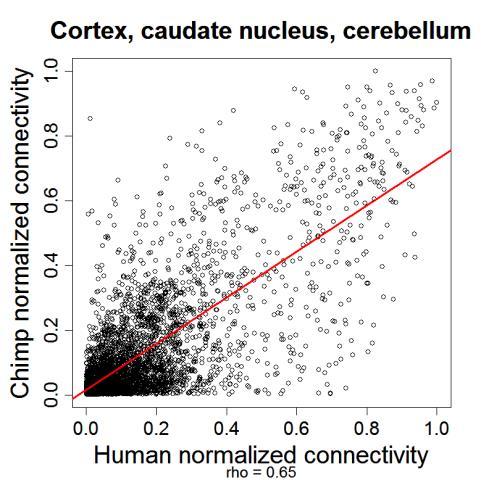
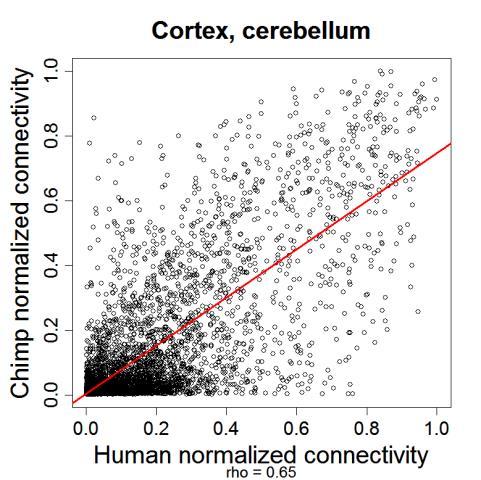
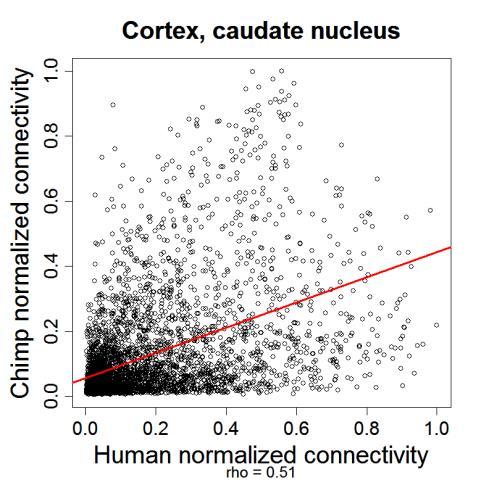

41 Connectivity diverges across brain regions whereas expression does not
42 Conclusions: chimp/human Gene expression is highly preserved across species brains Gene co-expression is less preserved Some modules are highly preserved Gene modules correspond roughly to brain architecture Species-specific hubs can be validated in silico using sequence comparisons
43 Software and Data Availability Sample data and R software tutorials can be found at the following webpage work An R package and accompanying tutorial can be found here: work/rpackages/wgcna/ Tutorial for this R package work/rpackages/wgcna/tutorialwgcnapackage.doc
44 What is different from other analyses? Emphasis on modules (pathways) instead of individual genes Greatly alleviates the problem of multiple comparisons Less than 20 comparisons versus comparisons Use of intramodular connectivity to find key drivers Quantifies module membership (centrality) Highly connected genes have an increased chance of validation Module definition is based on gene expression data No prior pathway information is used for module definition Two module (eigengenes) can be highly correlated Emphasis on a unified approach for relating variables Default: power of a correlation Rationale: puts different data sets on the same mathematical footing Considers effect size estimates (cor) and significance level p-values are highly affected by sample sizes (cor=0.01 is highly significant when dealing with observations) Technical Details: soft thresholding with the power adjacency function, topological overlap matrix to measure interconnectedness
A Geometric Interpretation of Gene Co-Expression Network Analysis. Steve Horvath, Jun Dong
 A Geometric Interpretation of Gene Co-Expression Network Analysis Steve Horvath, Jun Dong Outline Network and network concepts Approximately factorizable networks Gene Co-expression Network Eigengene Factorizability,
An Overview of Weighted Gene Co-Expression Network Analysis. Steve Horvath University of California, Los Angeles
 An Overview of Weighted Gene Co-Expression Network Analysis Steve Horvath University of California, Los Angeles Contents How to construct a weighted gene co-expression network? Why use soft thresholding?
A General Framework for Weighted Gene Co-Expression Network Analysis. Steve Horvath Human Genetics and Biostatistics University of CA, LA
 A General Framework for Weighted Gene Co-Expression Network Analysis Steve Horvath Human Genetics and Biostatistics University of CA, LA Content Novel statistical approach for analyzing microarray data:
Module preservation statistics
 Module preservation statistics Module preservation is often an essential step in a network analysis Steve Horvath University of California, Los Angeles Construct a network Rationale: make use of interaction
WGCNA User Manual. (for version 1.0.x)
") (for version 1.0.x) WGCNA User Manual A systems biologic microarray analysis software for finding important genes and pathways. The WGCNA (weighted gene co-expression network analysis) software implements
(for version 1.0.x) WGCNA User Manual A systems biologic microarray analysis software for finding important genes and pathways. The WGCNA (weighted gene co-expression network analysis) software implements
Weighted Correlation Network Analysis and Systems Biologic Applications. Steve Horvath University of California, Los Angeles
 Weighted Correlation Network Analysis and Systems Biologic Applications Steve Horvath University of California, Los Angeles Contents Weighted correlation network analysis (WGCNA) Module preservation statistics
identifiers matched to homologous genes. Probeset annotation files for each array platform were used to
 SUPPLEMENTARY METHODS Data combination and normalization Prior to data analysis we first had to appropriately combine all 1617 arrays such that probeset identifiers matched to homologous genes. Probeset
Functional Organization of the Transcriptome in Human Brain
 Functional Organization of the Transcriptome in Human Brain Michael C. Oldham Laboratory of Daniel H. Geschwind, UCLA BIOCOMP 08, Las Vegas, NV July 15, 2008 Neurons Astrocytes Oligodendrocytes Microglia
The Generalized Topological Overlap Matrix For Detecting Modules in Gene Networks
 The Generalized Topological Overlap Matrix For Detecting Modules in Gene Networks Andy M. Yip Steve Horvath Abstract Systems biologic studies of gene and protein interaction networks have found that these
Differential Modeling for Cancer Microarray Data
 Differential Modeling for Cancer Microarray Data Omar Odibat Department of Computer Science Feb, 01, 2011 1 Outline Introduction Cancer Microarray data Problem Definition Differential analysis Existing
Cell biology traditionally identifies proteins based on their individual actions as catalysts, signaling
 Lethality and centrality in protein networks Cell biology traditionally identifies proteins based on their individual actions as catalysts, signaling molecules, or building blocks of cells and microorganisms.
Eigengene Network Analysis of Human and Chimpanzee Microarray Data R Tutorial
 Eigengene Network Analysis of Human and Chimpanzee Microarray Data R Tutorial Peter Langfelder and Steve Horvath Correspondence: shorvath@mednet.ucla.edu, Peter.Langfelder@gmail.com This is a self contained
Self Similar (Scale Free, Power Law) Networks (I)
 Networks (I)") Self Similar (Scale Free, Power Law) Networks (I) E6083: lecture 4 Prof. Predrag R. Jelenković Dept. of Electrical Engineering Columbia University, NY 10027, USA {predrag}@ee.columbia.edu February 7, 2007
Self Similar (Scale Free, Power Law) Networks (I) E6083: lecture 4 Prof. Predrag R. Jelenković Dept. of Electrical Engineering Columbia University, NY 10027, USA {predrag}@ee.columbia.edu February 7, 2007
β. This soft thresholding approach leads to a weighted gene co-expression network.
 Network Concepts and their geometric Interpretation R Tutorial Motivational Example: weighted gene co-expression networks in different gender/tissue combinations Jun Dong, Steve Horvath Correspondence:
ProCoNA: Protein Co-expression Network Analysis
 ProCoNA: Protein Co-expression Network Analysis David L Gibbs October 30, 2017 1 De Novo Peptide Networks ProCoNA (protein co-expression network analysis) is an R package aimed at constructing and analyzing
Erzsébet Ravasz Advisor: Albert-László Barabási
 Hierarchical Networks Erzsébet Ravasz Advisor: Albert-László Barabási Introduction to networks How to model complex networks? Clustering and hierarchy Hierarchical organization of cellular metabolism The
Evidence for dynamically organized modularity in the yeast protein-protein interaction network
 Evidence for dynamically organized modularity in the yeast protein-protein interaction network Sari Bombino Helsinki 27.3.2007 UNIVERSITY OF HELSINKI Department of Computer Science Seminar on Computational
Course plan Academic Year Qualification MSc on Bioinformatics for Health Sciences. Subject name: Computational Systems Biology Code: 30180
 Course plan 201-201 Academic Year Qualification MSc on Bioinformatics for Health Sciences 1. Description of the subject Subject name: Code: 30180 Total credits: 5 Workload: 125 hours Year: 1st Term: 3
Supplementary Information
 Supplementary Information For the article"comparable system-level organization of Archaea and ukaryotes" by J. Podani, Z. N. Oltvai, H. Jeong, B. Tombor, A.-L. Barabási, and. Szathmáry (reference numbers
Computational approaches for functional genomics
 Computational approaches for functional genomics Kalin Vetsigian October 31, 2001 The rapidly increasing number of completely sequenced genomes have stimulated the development of new methods for finding
Zhongyi Xiao. Correlation. In probability theory and statistics, correlation indicates the
 Character Correlation Zhongyi Xiao Correlation In probability theory and statistics, correlation indicates the strength and direction of a linear relationship between two random variables. In general statistical
Network Biology: Understanding the cell s functional organization. Albert-László Barabási Zoltán N. Oltvai
 Network Biology: Understanding the cell s functional organization Albert-László Barabási Zoltán N. Oltvai Outline: Evolutionary origin of scale-free networks Motifs, modules and hierarchical networks Network
Quantile based Permutation Thresholds for QTL Hotspots. Brian S Yandell and Elias Chaibub Neto 17 March 2012
 Quantile based Permutation Thresholds for QTL Hotspots Brian S Yandell and Elias Chaibub Neto 17 March 2012 2012 Yandell 1 Fisher on inference We may at once admit that any inference from the particular
High-dimensional data: Exploratory data analysis
 High-dimensional data: Exploratory data analysis Mark van de Wiel mark.vdwiel@vumc.nl Department of Epidemiology and Biostatistics, VUmc & Department of Mathematics, VU University Contributions by Wessel
Clustering and Network
 Clustering and Network Jing-Dong Jackie Han jdhan@picb.ac.cn http://www.picb.ac.cn/~jdhan Copy Right: Jing-Dong Jackie Han What is clustering? A way of grouping together data samples that are similar in
Gene expression microarray technology measures the expression levels of thousands of genes. Research Article
 JOURNAL OF COMPUTATIONAL BIOLOGY Volume 7, Number 2, 2 # Mary Ann Liebert, Inc. Pp. 8 DOI:.89/cmb.29.52 Research Article Reducing the Computational Complexity of Information Theoretic Approaches for Reconstructing
Data Mining Techniques
 Data Mining Techniques CS 622 - Section 2 - Spring 27 Pre-final Review Jan-Willem van de Meent Feedback Feedback https://goo.gl/er7eo8 (also posted on Piazza) Also, please fill out your TRACE evaluations!
THEORY. Based on sequence Length According to the length of sequence being compared it is of following two types
 Exp 11- THEORY Sequence Alignment is a process of aligning two sequences to achieve maximum levels of identity between them. This help to derive functional, structural and evolutionary relationships between
Weighted Network Analysis
 Weighted Network Analysis Steve Horvath Weighted Network Analysis Applications in Genomics and Systems Biology ABC Steve Horvath Professor of Human Genetics and Biostatistics University of California,
V 5 Robustness and Modularity
 Bioinformatics 3 V 5 Robustness and Modularity Mon, Oct 29, 2012 Network Robustness Network = set of connections Failure events: loss of edges loss of nodes (together with their edges) loss of connectivity
Software WGCNA: an R package for weighted correlation network analysis Peter Langfelder 1 and Steve Horvath* 2
 BMC Bioinformatics BioMed Central Software WGCNA: an R package for weighted correlation network analysis Peter Langfelder 1 and Steve Horvath* 2 Open Access Address: 1 Department of Human Genetics, University
Web Structure Mining Nodes, Links and Influence
 Web Structure Mining Nodes, Links and Influence 1 Outline 1. Importance of nodes 1. Centrality 2. Prestige 3. Page Rank 4. Hubs and Authority 5. Metrics comparison 2. Link analysis 3. Influence model 1.
Clustering. Genome 559: Introduction to Statistical and Computational Genomics Elhanan Borenstein. Some slides adapted from Jacques van Helden
 Clustering Genome 559: Introduction to Statistical and Computational Genomics Elhanan Borenstein Some slides adapted from Jacques van Helden Gene expression profiling A quick review Which molecular processes/functions
The architecture of complexity: the structure and dynamics of complex networks.
 SMR.1656-36 School and Workshop on Structure and Function of Complex Networks 16-28 May 2005 ------------------------------------------------------------------------------------------------------------------------
An Efficient Algorithm for Protein-Protein Interaction Network Analysis to Discover Overlapping Functional Modules
 An Efficient Algorithm for Protein-Protein Interaction Network Analysis to Discover Overlapping Functional Modules Ying Liu 1 Department of Computer Science, Mathematics and Science, College of Professional
Clustering. Genome 559: Introduction to Statistical and Computational Genomics Elhanan Borenstein. Some slides adapted from Jacques van Helden
 Clustering Genome 559: Introduction to Statistical and Computational Genomics Elhanan Borenstein Some slides adapted from Jacques van Helden Small vs. large parsimony A quick review Fitch s algorithm:
Hierarchical Clustering
 Hierarchical Clustering Some slides by Serafim Batzoglou 1 From expression profiles to distances From the Raw Data matrix we compute the similarity matrix S. S ij reflects the similarity of the expression
A New Method to Build Gene Regulation Network Based on Fuzzy Hierarchical Clustering Methods
 International Academic Institute for Science and Technology International Academic Journal of Science and Engineering Vol. 3, No. 6, 2016, pp. 169-176. ISSN 2454-3896 International Academic Journal of
Eigengene Network Analysis: Four Tissues Of Female Mice R Tutorial
 Eigengene Network Analysis: Four Tissues Of Female Mice R Tutorial Peter Langfelder and Steve Horvath Correspondence: shorvath@mednet.ucla.edu, Peter.Langfelder@gmail.com This is a self contained R software
Dimension Reduc-on. Example: height of iden-cal twins. PCA, SVD, MDS, and clustering [ RI ] Twin 2 (inches away from avg)
![Dimension Reduc-on. Example: height of iden-cal twins. PCA, SVD, MDS, and clustering [ RI ] Twin 2 (inches away from avg)](/thumbs/74/70760823.jpg "Dimension Reduc-on. Example: height of iden-cal twins. PCA, SVD, MDS, and clustering [ RI ] Twin 2 (inches away from avg)") Dimension Reduc-on PCA, SVD, MDS, and clustering Example: height of iden-cal twins Twin (inches away from avg) 0 5 0 5 0 5 0 5 0 Twin (inches away from avg) Expression between two ethnic groups Frequency
Dimension Reduc-on PCA, SVD, MDS, and clustering Example: height of iden-cal twins Twin (inches away from avg) 0 5 0 5 0 5 0 5 0 Twin (inches away from avg) Expression between two ethnic groups Frequency
Networks as vectors of their motif frequencies and 2-norm distance as a measure of similarity
 Networks as vectors of their motif frequencies and 2-norm distance as a measure of similarity CS322 Project Writeup Semih Salihoglu Stanford University 353 Serra Street Stanford, CA semih@stanford.edu
Homework Assignment, Evolutionary Systems Biology, Spring Homework Part I: Phylogenetics:
 Homework Assignment, Evolutionary Systems Biology, Spring 2009. Homework Part I: Phylogenetics: Introduction. The objective of this assignment is to understand the basics of phylogenetic relationships
Quantile-based permutation thresholds for QTL hotspot analysis: a tutorial
 Quantile-based permutation thresholds for QTL hotspot analysis: a tutorial Elias Chaibub Neto and Brian S Yandell September 18, 2013 1 Motivation QTL hotspots, groups of traits co-mapping to the same genomic
Zhiguang Huo 1, Chi Song 2, George Tseng 3. July 30, 2018
 Bayesian latent hierarchical model for transcriptomic meta-analysis to detect biomarkers with clustered meta-patterns of differential expression signals BayesMP Zhiguang Huo 1, Chi Song 2, George Tseng
Correlation Networks
 QuickTime decompressor and a are needed to see this picture. Correlation Networks Analysis of Biological Networks April 24, 2010 Correlation Networks - Analysis of Biological Networks 1 Review We have
Context dependent visualization of protein function
 Article III Context dependent visualization of protein function In: Juho Rousu, Samuel Kaski and Esko Ukkonen (eds.). Probabilistic Modeling and Machine Learning in Structural and Systems Biology. 2006,
Clustering. Genome 559: Introduction to Statistical and Computational Genomics Elhanan Borenstein. Some slides adapted from Jacques van Helden
 Clustering Genome 559: Introduction to Statistical and Computational Genomics Elhanan Borenstein Some slides adapted from Jacques van Helden Gene expression profiling A quick review Which molecular processes/functions
Bioinformatics 2. Yeast two hybrid. Proteomics. Proteomics
 GENOME Bioinformatics 2 Proteomics protein-gene PROTEOME protein-protein METABOLISM Slide from http://www.nd.edu/~networks/ Citrate Cycle Bio-chemical reactions What is it? Proteomics Reveal protein Protein
Biological Networks: Comparison, Conservation, and Evolution via Relative Description Length By: Tamir Tuller & Benny Chor
 Biological Networks:,, and via Relative Description Length By: Tamir Tuller & Benny Chor Presented by: Noga Grebla Content of the presentation Presenting the goals of the research Reviewing basic terms
Interaction Network Analysis
 CSI/BIF 5330 Interaction etwork Analsis Young-Rae Cho Associate Professor Department of Computer Science Balor Universit Biological etworks Definition Maps of biochemical reactions, interactions, regulations
CS168: The Modern Algorithmic Toolbox Lectures #11 and #12: Spectral Graph Theory
 CS168: The Modern Algorithmic Toolbox Lectures #11 and #12: Spectral Graph Theory Tim Roughgarden & Gregory Valiant May 2, 2016 Spectral graph theory is the powerful and beautiful theory that arises from
Cluster Analysis of Gene Expression Microarray Data. BIOL 495S/ CS 490B/ MATH 490B/ STAT 490B Introduction to Bioinformatics April 8, 2002
 Cluster Analysis of Gene Expression Microarray Data BIOL 495S/ CS 490B/ MATH 490B/ STAT 490B Introduction to Bioinformatics April 8, 2002 1 Data representations Data are relative measurements log 2 ( red
Network Specializations, Symmetries, and Spectral Properties
 Brigham Young University BYU ScholarsArchive All Theses and Dissertations 2018-06-01 Network Specializations, Symmetries, and Spectral Properties Dallas C. Smith Brigham Young University Follow this and
Singapore Institute for Neurotechnology & Memory Network Programme, National University of Singapore, Singapore
 SUPPLEMENTARY INFORMATION: Gene expression links functional networks across cortex and striatum Kevin M Anderson 1, Fenna M Krienen 2, Eun Young Choi 3, Jenna M Reinen 1, B T Thomas Yeo 4,5, Avram J Holmes
Clustering & microarray technology
 Clustering & microarray technology A large scale way to measure gene expression levels. Thanks to Kevin Wayne, Matt Hibbs, & SMD for a few of the slides 1 Why is expression important? Proteins Gene Expression
Data science with multilayer networks: Mathematical foundations and applications
 Data science with multilayer networks: Mathematical foundations and applications CDSE Days University at Buffalo, State University of New York Monday April 9, 2018 Dane Taylor Assistant Professor of Mathematics
networks in molecular biology Wolfgang Huber
 networks in molecular biology Wolfgang Huber networks in molecular biology Regulatory networks: components = gene products interactions = regulation of transcription, translation, phosphorylation... Metabolic
Faloutsos, Tong ICDE, 2009
 Large Graph Mining: Patterns, Tools and Case Studies Christos Faloutsos Hanghang Tong CMU Copyright: Faloutsos, Tong (29) 2-1 Outline Part 1: Patterns Part 2: Matrix and Tensor Tools Part 3: Proximity
BioControl - Week 6, Lecture 1
 BioControl - Week 6, Lecture 1 Goals of this lecture Large metabolic networks organization Design principles for small genetic modules - Rules based on gene demand - Rules based on error minimization Suggested
Gene Ontology and Functional Enrichment. Genome 559: Introduction to Statistical and Computational Genomics Elhanan Borenstein
 Gene Ontology and Functional Enrichment Genome 559: Introduction to Statistical and Computational Genomics Elhanan Borenstein The parsimony principle: A quick review Find the tree that requires the fewest
FCModeler: Dynamic Graph Display and Fuzzy Modeling of Regulatory and Metabolic Maps
 FCModeler: Dynamic Graph Display and Fuzzy Modeling of Regulatory and Metabolic Maps Julie Dickerson 1, Zach Cox 1 and Andy Fulmer 2 1 Iowa State University and 2 Proctor & Gamble. FCModeler Goals Capture
Systems biology and biological networks
 Systems Biology Workshop Systems biology and biological networks Center for Biological Sequence Analysis Networks in electronics Radio kindly provided by Lazebnik, Cancer Cell, 2002 Systems Biology Workshop,
Weighted Network Analysis
 Weighted Network Analysis Steve Horvath Weighted Network Analysis Applications in Genomics and Systems Biology ABC Steve Horvath Professor of Human Genetics and Biostatistics University of California,
Advanced Statistical Methods: Beyond Linear Regression
 Advanced Statistical Methods: Beyond Linear Regression John R. Stevens Utah State University Notes 3. Statistical Methods II Mathematics Educators Worshop 28 March 2009 1 http://www.stat.usu.edu/~jrstevens/pcmi
Drosophila melanogaster and D. simulans, two fruit fly species that are nearly
 Comparative Genomics: Human versus chimpanzee 1. Introduction The chimpanzee is the closest living relative to humans. The two species are nearly identical in DNA sequence (>98% identity), yet vastly different
Algorithms in Bioinformatics
 Algorithms in Bioinformatics Sami Khuri Department of Computer Science San José State University San José, California, USA khuri@cs.sjsu.edu www.cs.sjsu.edu/faculty/khuri Distance Methods Character Methods
Overview of clustering analysis. Yuehua Cui
 Overview of clustering analysis Yuehua Cui Email: cuiy@msu.edu http://www.stt.msu.edu/~cui A data set with clear cluster structure How would you design an algorithm for finding the three clusters in this
Unsupervised machine learning
 Chapter 9 Unsupervised machine learning Unsupervised machine learning (a.k.a. cluster analysis) is a set of methods to assign objects into clusters under a predefined distance measure when class labels
Computational Biology: Basics & Interesting Problems
 Computational Biology: Basics & Interesting Problems Summary Sources of information Biological concepts: structure & terminology Sequencing Gene finding Protein structure prediction Sources of information
Networks. Can (John) Bruce Keck Founda7on Biotechnology Lab Bioinforma7cs Resource
 Bruce Keck Founda7on Biotechnology Lab Bioinforma7cs Resource") Networks Can (John) Bruce Keck Founda7on Biotechnology Lab Bioinforma7cs Resource Networks in biology Protein-Protein Interaction Network of Yeast Transcriptional regulatory network of E.coli Experimental
Networks Can (John) Bruce Keck Founda7on Biotechnology Lab Bioinforma7cs Resource Networks in biology Protein-Protein Interaction Network of Yeast Transcriptional regulatory network of E.coli Experimental
Link Analysis Ranking
 Link Analysis Ranking How do search engines decide how to rank your query results? Guess why Google ranks the query results the way it does How would you do it? Naïve ranking of query results Given query
SVD, Power method, and Planted Graph problems (+ eigenvalues of random matrices)
") Chapter 14 SVD, Power method, and Planted Graph problems (+ eigenvalues of random matrices) Today we continue the topic of low-dimensional approximation to datasets and matrices. Last time we saw the singular
Chapter 14 SVD, Power method, and Planted Graph problems (+ eigenvalues of random matrices) Today we continue the topic of low-dimensional approximation to datasets and matrices. Last time we saw the singular
Unravelling the biochemical reaction kinetics from time-series data
 Unravelling the biochemical reaction kinetics from time-series data Santiago Schnell Indiana University School of Informatics and Biocomplexity Institute Email: schnell@indiana.edu WWW: http://www.informatics.indiana.edu/schnell
BMD645. Integration of Omics
 BMD645 Integration of Omics Shu-Jen Chen, Chang Gung University Dec. 11, 2009 1 Traditional Biology vs. Systems Biology Traditional biology : Single genes or proteins Systems biology: Simultaneously study
How To Use CORREP to Estimate Multivariate Correlation and Statistical Inference Procedures
 How To Use CORREP to Estimate Multivariate Correlation and Statistical Inference Procedures Dongxiao Zhu June 13, 2018 1 Introduction OMICS data are increasingly available to biomedical researchers, and
8.1 Concentration inequality for Gaussian random matrix (cont d)
") MGMT 69: Topics in High-dimensional Data Analysis Falll 26 Lecture 8: Spectral clustering and Laplacian matrices Lecturer: Jiaming Xu Scribe: Hyun-Ju Oh and Taotao He, October 4, 26 Outline Concentration
MGMT 69: Topics in High-dimensional Data Analysis Falll 26 Lecture 8: Spectral clustering and Laplacian matrices Lecturer: Jiaming Xu Scribe: Hyun-Ju Oh and Taotao He, October 4, 26 Outline Concentration
25 : Graphical induced structured input/output models
 10-708: Probabilistic Graphical Models 10-708, Spring 2013 25 : Graphical induced structured input/output models Lecturer: Eric P. Xing Scribes: Meghana Kshirsagar (mkshirsa), Yiwen Chen (yiwenche) 1 Graph
Social Networks- Stanley Milgram (1967)
") Complex Networs Networ is a structure of N nodes and 2M lins (or M edges) Called also graph in Mathematics Many examples of networs Internet: nodes represent computers lins the connecting cables Social
Complex Networs Networ is a structure of N nodes and 2M lins (or M edges) Called also graph in Mathematics Many examples of networs Internet: nodes represent computers lins the connecting cables Social
Thematic review series: Systems Biology Approaches to Metabolic and Cardiovascular Disorders
 thematic review Thematic review series: Systems Biology Approaches to Metabolic and Cardiovascular Disorders Reverse engineering gene networks to identify key drivers of complex disease phenotypes Eric
SYSTEMS BIOLOGY 1: NETWORKS
 SYSTEMS BIOLOGY 1: NETWORKS SYSTEMS BIOLOGY Starting around 2000 a number of biologists started adopting the term systems biology for an approach to biology that emphasized the systems-character of biology:
Bioinformatics. Transcriptome
 Bioinformatics Transcriptome Jacques.van.Helden@ulb.ac.be Université Libre de Bruxelles, Belgique Laboratoire de Bioinformatique des Génomes et des Réseaux (BiGRe) http://www.bigre.ulb.ac.be/ Bioinformatics
USING BLAST TO IDENTIFY PROTEINS THAT ARE EVOLUTIONARILY RELATED ACROSS SPECIES
 USING BLAST TO IDENTIFY PROTEINS THAT ARE EVOLUTIONARILY RELATED ACROSS SPECIES HOW CAN BIOINFORMATICS BE USED AS A TOOL TO DETERMINE EVOLUTIONARY RELATIONSHPS AND TO BETTER UNDERSTAND PROTEIN HERITAGE?
6.047 / Computational Biology: Genomes, Networks, Evolution Fall 2008
 MIT OpenCourseWare http://ocw.mit.edu 6.047 / 6.878 Computational Biology: Genomes, Networks, Evolution Fall 2008 For information about citing these materials or our Terms of Use, visit: http://ocw.mit.edu/terms.
Design and characterization of chemical space networks
 Design and characterization of chemical space networks Martin Vogt B-IT Life Science Informatics Rheinische Friedrich-Wilhelms-University Bonn 16 August 2015 Network representations of chemical spaces
"Nothing in biology makes sense except in the light of evolution Theodosius Dobzhansky
 MOLECULAR PHYLOGENY "Nothing in biology makes sense except in the light of evolution Theodosius Dobzhansky EVOLUTION - theory that groups of organisms change over time so that descendeants differ structurally
Clustering. Genome 373 Genomic Informatics Elhanan Borenstein. Some slides adapted from Jacques van Helden
 Clustering Genome 373 Genomic Informatics Elhanan Borenstein Some slides adapted from Jacques van Helden The clustering problem The goal of gene clustering process is to partition the genes into distinct
Supplemental Material
 Supplemental Material Article title: Construction and comparison of gene co expression networks shows complex plant immune responses Author names and affiliation: Luis Guillermo Leal 1*, Email: lgleala@unal.edu.co
Preface. Contributors
 CONTENTS Foreword Preface Contributors PART I INTRODUCTION 1 1 Networks in Biology 3 Björn H. Junker 1.1 Introduction 3 1.2 Biology 101 4 1.2.1 Biochemistry and Molecular Biology 4 1.2.2 Cell Biology 6
Analysis of Biological Networks: Network Robustness and Evolution
 Analysis of Biological Networks: Network Robustness and Evolution Lecturer: Roded Sharan Scribers: Sasha Medvedovsky and Eitan Hirsh Lecture 14, February 2, 2006 1 Introduction The chapter is divided into
Lab 2 Worksheet. Problems. Problem 1: Geometry and Linear Equations
 Lab 2 Worksheet Problems Problem : Geometry and Linear Equations Linear algebra is, first and foremost, the study of systems of linear equations. You are going to encounter linear systems frequently in
Weighted Network Analysis for Groups:
 Weighted Network Analysis for Groups: Separating Differences in Cost from Differences in Topology Cedric E. Ginestet Department of Neuroimaging, King s College London Cedric E. Ginestet (KCL) Weighted
Pathline: " 1234B2# ="3;6<89>";>6"B A1"<6"A <?;>"=21 9>";52#A. Miriah Meyer 1,2
 1234567" 2839958:9;8"8:?7
Focus was on solving matrix inversion problems Now we look at other properties of matrices Useful when A represents a transformations.
 Previously Focus was on solving matrix inversion problems Now we look at other properties of matrices Useful when A represents a transformations y = Ax Or A simply represents data Notion of eigenvectors,
COMPSCI 514: Algorithms for Data Science
 COMPSCI 514: Algorithms for Data Science Arya Mazumdar University of Massachusetts at Amherst Fall 2018 Lecture 8 Spectral Clustering Spectral clustering Curse of dimensionality Dimensionality Reduction
Emergent Phenomena on Complex Networks
 Chapter 1 Emergent Phenomena on Complex Networks 1.0.1 More is different When many interacting elements give rise to a collective behavior that cannot be explained or predicted by considering them individually,
Graph Theory and Networks in Biology
 Graph Theory and Networks in Biology Oliver Mason and Mark Verwoerd Hamilton Institute, National University of Ireland Maynooth, Co. Kildare, Ireland {oliver.mason, mark.verwoerd}@nuim.ie January 17, 2007
CS224W: Social and Information Network Analysis
 CS224W: Social and Information Network Analysis Reaction Paper Adithya Rao, Gautam Kumar Parai, Sandeep Sripada Keywords: Self-similar networks, fractality, scale invariance, modularity, Kronecker graphs.
Proteomics. Yeast two hybrid. Proteomics - PAGE techniques. Data obtained. What is it?
 Proteomics What is it? Reveal protein interactions Protein profiling in a sample Yeast two hybrid screening High throughput 2D PAGE Automatic analysis of 2D Page Yeast two hybrid Use two mating strains
Co-expression analysis of RNA-seq data
 Co-expression analysis of RNA-seq data Etienne Delannoy & Marie-Laure Martin-Magniette & Andrea Rau Plant Science Institut of Paris-Saclay (IPS2) Applied Mathematics and Informatics Unit (MIA-Paris) Genetique
Bioinformatics I. CPBS 7711 October 29, 2015 Protein interaction networks. Debra Goldberg
 Bioinformatics I CPBS 7711 October 29, 2015 Protein interaction networks Debra Goldberg debra@colorado.edu Overview Networks, protein interaction networks (PINs) Network models What can we learn from PINs