Using Spatial Statistics Social Service Applications Public Safety and Public Health
|
|
|
- Laurence Cunningham
- 5 years ago
- Views:
Transcription


1 Using Spatial Statistics Social Service Applications Public Safety and Public Health Lauren Rosenshein 1


2 Regression analysis Regression analysis allows you to model, examine, and explore spatial relationships, in order to better understand the factors behind observed spatial patterns or to predict outcomes. Ordinary Least Square Geographically Weighted Regression 100 Population Feature Class Income Feature Class Output Feature Class Observed Values 0 Predicted Values Intercept + Coefficient Surface + Coefficient Surface = Crime
.")
: values, computed by the regression tool, reflecting explanatory to dependent variable relationships.")
3 Regression analysis terms and concepts Dependent variable (Y): what you are trying to model or predict (Residential Burglary, for example). Explanatory variables (X): variables you believe cause or explain the dependent variable (like: income, vandalism, households). Coefficients (β): values, computed by the regression tool, reflecting explanatory to dependent variable relationships. Residuals (ε): the portion of the dependent variable that isn t explained by the model; the model under and over predictions. 3
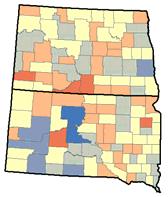
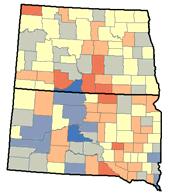
4 DEMO Mortality Data Analysis 4


5 Use OLS to test hypotheses Why are people dying young in South Dakota? Do economic factors explain this spatial pattern? Poverty rates explain 66% of the variation in the average age of death dependent variable: Adjusted R-Squared [2]: However, significant spatial autocorrelation among model residuals indicates important explanatory variables are missing from the model. 5


6 Build a multivariate regression model Explore variable relationships using the scatterplot matrix Consult theory and field experts Look for spatial variables Run OLS (this is an iterative, often tedious, trial and error, process) 6

7 Interpreting OLS results Use the notes on interpretation as a guide to understanding OLS model output. 7


8 Coefficient significance Look for statistically significant explanatory variables. Consult the robust probabilities when the Koenker test is statistically significant * Statistically significant at the 0.05 level. Probability Robust_Prob * * * * * * * * * * Koenker(BP) Statistic [5]: Prob(>chi-squared),(5) degrees of freedom: * 8

9 Multicollinearity Find a set of explanatory variables that have low VIF values. In a strong model, each explanatory variable gets at a different facet of the dependent variable. What did one regression coefficient say to the other regression coefficient? I m partial to you! VIF [1] Large VIF (> 7.5, for example) indicates explanatory variable redundancy. 9

10 Model performance Compare models by looking for the lowest AIC value. As long as the dependent variable remains fixed, the AIC value for different OLS/GWR models are comparable Look for a model with a high Adjusted R-Squared value. [2] Measure of model fit/performance. Akaike s Information Criterion (AIC) [2]: Adjusted R-Squared [2]:

![Joint F-Statistic [3]: Joint Wald Statistic [4]: Koenker (BP) Statistic [5]: 151.](/docs-images/89/98898850/images/11-3.jpg "985705 Prob(>F), (4,113) degrees of freedom: 0.000000* 496.057428 Prob(>chi-sq), 5 degrees of freedom: 0.")
11 Model significance The Joint F-Statistic and Joint Wald Statistic measure overall model significance. Consult the Joint Wald statistic when the Koenker test is statistically significant. Joint F-Statistic [3]: Joint Wald Statistic [4]: Koenker (BP) Statistic [5]: Prob(>F), (4,113) degrees of freedom: * Prob(>chi-sq), 5 degrees of freedom: * Prob(>chi-sq), 5 degrees of freedom: * 11
![Model bias [6] Significant p-value](/docs-images/89/98898850/images/12-0.jpg "indicates residuals deviate from a normal")


12 Model bias [6] Significant p-value indicates residuals deviate from a normal distribution. When the Jarque-Bera test is statistically significant: the model is biased results are not reliable often this indicates that a key variable is missing from the model Jarque-Bera Statistic [6]: Prob(>chi-sq), (2) degrees of freedom:


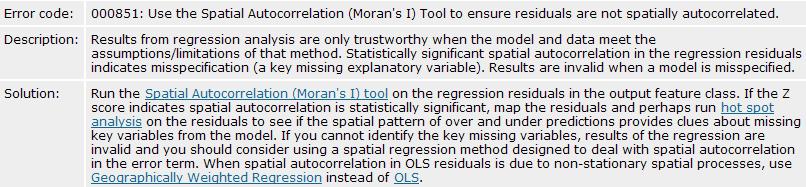
13 Spatial Autocorrelation Statistically significant clustering of under and over predictions. Random spatial pattern of under and over predictions. 13


14 Check OLS results 1 Coefficients have the expected sign. 2 No redundancy among model explanatory variables. 3 Coefficients are statistically significant. 4 Residuals are normally distributed. 5 Strong Adjusted R-Square value. 6 Relationships do not vary significantly across the study area. 14
 variables Do not include variables with little value variation Selecting a bandwidth and kernel Fixed or Adaptive")
15 Run Geographically Weighted Regression (GWR) GWR is a local, spatial, regression model Global Regression methods, like OLS, break down when the strength of model relationships vary across the study area GWR variables are the same as OLS, except: Do not include spatial regime (dummy) variables Do not include variables with little value variation Selecting a bandwidth and kernel Fixed or Adaptive AIC, Cross Validation (CV), bandwidth parameter Condition numbers 15


16 Interpreting GWR results Compare GWR R2 and AIC values to OLS R2 and AIC values. The better model has a lower AIC and a high R2. Residual maps show model under and over predictions. They shouldn t be clustered. Coefficient maps show how modeled relationships vary across the study area. Model predictions, residuals, standard errors, coefficients, and condition numbers are written to the output feature class. 16


17 GWR prediction Calibrate the GWR model using known values for the dependent variable and all of the explanatory variables. Observed Modeled Predicted Provide a feature class of prediction locations containing values for all of the explanatory variables. GWR will create an output feature class with the computed predictions. 17
18 Resources for learning more The ESRI Guide to GIS Analysis, Vol. 2 Geographically Weighted Regression, by Fotheringham, Brundson, and Charlton 911 emergency call analysis demo: Virtual campus free web seminar Articles (keyword search: Spatial Statistics ) ArcGIS 9.3 Web Help: Regression Analysis Basics Interpreting OLS Results Interpreting GWR Results Watch for updates GP Resource Center LScott@ESRI.com 18


19 QUESTIONS? 19
GIS Analysis: Spatial Statistics for Public Health: Lauren M. Scott, PhD; Mark V. Janikas, PhD
 Some Slides to Go Along with the Demo Hot spot analysis of average age of death Section B DEMO: Mortality Data Analysis 2 Some Slides to Go Along with the Demo Do Economic Factors Alone Explain Early Death?
Modeling Spatial Relationships using Regression Analysis
 Esri International User Conference San Diego, CA Technical Workshops July 2011 Modeling Spatial Relationships using Regression Analysis Lauren M. Scott, PhD Lauren Rosenshein, MS Mark V. Janikas, PhD Answering
Modeling Spatial Relationships Using Regression Analysis
 Esri International User Conference San Diego, California Technical Workshops July 24, 2012 Modeling Spatial Relationships Using Regression Analysis Lauren M. Scott, PhD Lauren Rosenshein Bennett, MS Answering
Modeling Spatial Relationships Using Regression Analysis. Lauren M. Scott, PhD Lauren Rosenshein Bennett, MS
 Modeling Spatial Relationships Using Regression Analysis Lauren M. Scott, PhD Lauren Rosenshein Bennett, MS Workshop Overview Answering why? questions Introduce regression analysis - What it is and why
Summary of OLS Results - Model Variables
 Summary of OLS Results - Model Variables Variable Coefficient [a] StdError t-statistic Probability [b] Robust_SE Robust_t Robust_Pr [b] VIF [c] Intercept 12.722048 1.710679 7.436839 0.000000* 2.159436
Exploratory Spatial Data Analysis (ESDA)
") Exploratory Spatial Data Analysis (ESDA) VANGHR s method of ESDA follows a typical geospatial framework of selecting variables, exploring spatial patterns, and regression analysis. The primary software
Exploratory Spatial Data Analysis (ESDA) VANGHR s method of ESDA follows a typical geospatial framework of selecting variables, exploring spatial patterns, and regression analysis. The primary software
A GEOSTATISTICAL APPROACH TO PREDICTING A PHYSICAL VARIABLE THROUGH A CONTINUOUS SURFACE
 Katherine E. Williams University of Denver GEOG3010 Geogrpahic Information Analysis April 28, 2011 A GEOSTATISTICAL APPROACH TO PREDICTING A PHYSICAL VARIABLE THROUGH A CONTINUOUS SURFACE Overview Data
GeoDa-GWR Results: GeoDa-GWR Output (portion only): Program began at 4/8/2016 4:40:38 PM
: Program began at 4/8/2016 4:40:38 PM") New Mexico Health Insurance Coverage, 2009-2013 Exploratory, Ordinary Least Squares, and Geographically Weighted Regression Using GeoDa-GWR, R, and QGIS Larry Spear 4/13/2016 (Draft) A dataset consisting
New Mexico Health Insurance Coverage, 2009-2013 Exploratory, Ordinary Least Squares, and Geographically Weighted Regression Using GeoDa-GWR, R, and QGIS Larry Spear 4/13/2016 (Draft) A dataset consisting
Spatial Variation in Infant Mortality with Geographically Weighted Poisson Regression (GWPR) Approach
 Approach") Spatial Variation in Infant Mortality with Geographically Weighted Poisson Regression (GWPR) Approach Kristina Pestaria Sinaga, Manuntun Hutahaean 2, Petrus Gea 3 1, 2, 3 University of Sumatera Utara,
Spatial Variation in Infant Mortality with Geographically Weighted Poisson Regression (GWPR) Approach Kristina Pestaria Sinaga, Manuntun Hutahaean 2, Petrus Gea 3 1, 2, 3 University of Sumatera Utara,
Regression Analysis. A statistical procedure used to find relations among a set of variables.
 Regression Analysis A statistical procedure used to find relations among a set of variables. Understanding relations Mapping data enables us to examine (describe) where things occur (e.g., areas where
Models for Count and Binary Data. Poisson and Logistic GWR Models. 24/07/2008 GWR Workshop 1
 Models for Count and Binary Data Poisson and Logistic GWR Models 24/07/2008 GWR Workshop 1 Outline I: Modelling counts Poisson regression II: Modelling binary events Logistic Regression III: Poisson Regression
Objectives Define spatial statistics Introduce you to some of the core spatial statistics tools available in ArcGIS 9.3 Present a variety of example a
 Introduction to Spatial Statistics Opportunities for Education Lauren M. Scott, PhD Mark V. Janikas, PhD Lauren Rosenshein Jorge Ruiz-Valdepeña 1 Objectives Define spatial statistics Introduce you to some
1Department of Demography and Organization Studies, University of Texas at San Antonio, One UTSA Circle, San Antonio, TX
 Well, it depends on where you're born: A practical application of geographically weighted regression to the study of infant mortality in the U.S. P. Johnelle Sparks and Corey S. Sparks 1 Introduction Infant
This report details analyses and methodologies used to examine and visualize the spatial and nonspatial
 Analysis Summary: Acute Myocardial Infarction and Social Determinants of Health Acute Myocardial Infarction Study Summary March 2014 Project Summary :: Purpose This report details analyses and methodologies
Shana K. Pascal Department of Resource Analysis, Saint Mary s University of Minnesota, Minneapolis, MN 55408
 An Analysis Using Regression Models of Urban Solitary Bee Population with Regards to Perennial Gardens Along the Lake Street Corridor in Minneapolis Minnesota Shana K. Pascal Department of Resource Analysis,
LECTURE 10. Introduction to Econometrics. Multicollinearity & Heteroskedasticity
 LECTURE 10 Introduction to Econometrics Multicollinearity & Heteroskedasticity November 22, 2016 1 / 23 ON PREVIOUS LECTURES We discussed the specification of a regression equation Specification consists
Terms ABBR Definition
 Affect Akaike s Information Criterion AIC Affect is a verb referring to the act of influencing or causing a change in something else (not to be confused with effect) Akaike s Information Criterion (AIC)
Explorative Spatial Analysis of Coastal Community Incomes in Setiu Wetlands: Geographically Weighted Regression
 Explorative Spatial Analysis of Coastal Community Incomes in Setiu Wetlands: Geographically Weighted Regression Z. Syerrina 1, A.R. Naeim, L. Muhamad Safiih 3 and Z. Nuredayu 4 1,,3,4 School of Informatics
The multiple regression model; Indicator variables as regressors
 The multiple regression model; Indicator variables as regressors Ragnar Nymoen University of Oslo 28 February 2013 1 / 21 This lecture (#12): Based on the econometric model specification from Lecture 9
CHAPTER 6: SPECIFICATION VARIABLES
 Recall, we had the following six assumptions required for the Gauss-Markov Theorem: 1. The regression model is linear, correctly specified, and has an additive error term. 2. The error term has a zero
ESRI 2008 Health GIS Conference
 ESRI 2008 Health GIS Conference An Exploration of Geographically Weighted Regression on Spatial Non- Stationarity and Principal Component Extraction of Determinative Information from Robust Datasets A
Gis Based Analysis of Supply and Forecasting Piped Water Demand in Nairobi
 International Journal of Engineering Science Invention ISSN (Online): 2319 6734, ISSN (Print): 2319 6726 Volume 4 Issue 2 February 2015 PP.01-11 Gis Based Analysis of Supply and Forecasting Piped Water
Spatial Pattern Analysis: Mapping Trends and Clusters
 Esri International User Conference San Diego, California Technical Workshops July 24, 2012 Spatial Pattern Analysis: Mapping Trends and Clusters Lauren M. Scott, PhD Lauren Rosenshein Bennett, MS Presentation
Steps in Regression Analysis
 MGMG 522 : Session #2 Learning to Use Regression Analysis & The Classical Model (Ch. 3 & 4) 2-1 Steps in Regression Analysis 1. Review the literature and develop the theoretical model 2. Specify the model:
Daniel Fuller Lise Gauvin Yan Kestens
 Examining the spatial distribution and relationship between support for policies aimed at active living in transportation and transportation behavior Daniel Fuller Lise Gauvin Yan Kestens Introduction
A geographically weighted regression
 The Spatial Distribution of Poverty A geographically weighted regression by Introduction Problem How can we explore the spatial distribution of poverty and determine its correlates? This exercise examines
Statistics: A review. Why statistics?
 Statistics: A review Why statistics? What statistical concepts should we know? Why statistics? To summarize, to explore, to look for relations, to predict What kinds of data exist? Nominal, Ordinal, Interval
Spatial Regression Modeling
 Spatial Regression Modeling Paul Voss & Katherine Curtis The Center for Spatially Integrated Social Science Santa Barbara, CA July 12-17, 2009 Day 4 Plan for today Focus on spatial heterogeneity A bit
The cover page of the Encyclopedia of Health Economics (2014) Introduction to Econometric Application in Health Economics
 Introduction to Econometric Application in Health Economics") PHPM110062 Teaching Demo The cover page of the Encyclopedia of Health Economics (2014) Introduction to Econometric Application in Health Economics Instructor: Mengcen Qian School of Public Health What
PHPM110062 Teaching Demo The cover page of the Encyclopedia of Health Economics (2014) Introduction to Econometric Application in Health Economics Instructor: Mengcen Qian School of Public Health What
Running head: GEOGRAPHICALLY WEIGHTED REGRESSION 1. Geographically Weighted Regression. Chelsey-Ann Cu GEOB 479 L2A. University of British Columbia
 Running head: GEOGRAPHICALLY WEIGHTED REGRESSION 1 Geographically Weighted Regression Chelsey-Ann Cu 32482135 GEOB 479 L2A University of British Columbia Dr. Brian Klinkenberg 9 February 2018 GEOGRAPHICALLY
Lecture 8. Using the CLR Model. Relation between patent applications and R&D spending. Variables
 Lecture 8. Using the CLR Model Relation between patent applications and R&D spending Variables PATENTS = No. of patents (in 000) filed RDEP = Expenditure on research&development (in billions of 99 $) The
Answers to Problem Set #4
 Answers to Problem Set #4 Problems. Suppose that, from a sample of 63 observations, the least squares estimates and the corresponding estimated variance covariance matrix are given by: bβ bβ 2 bβ 3 = 2
Econometrics Review questions for exam
 Econometrics Review questions for exam Nathaniel Higgins nhiggins@jhu.edu, 1. Suppose you have a model: y = β 0 x 1 + u You propose the model above and then estimate the model using OLS to obtain: ŷ =
GeoDa and Spatial Regression Modeling
 GeoDa and Spatial Regression Modeling June 9, 2006 Stephen A. Matthews Associate Professor of Sociology & Anthropology, Geography and Demography Director of the Geographic Information Analysis Core Population
In matrix algebra notation, a linear model is written as
 DM3 Calculation of health disparity Indices Using Data Mining and the SAS Bridge to ESRI Mussie Tesfamicael, University of Louisville, Louisville, KY Abstract Socioeconomic indices are strongly believed
envision Technical Report Archaeological Prediction Maps Kapiti Coast
 envision Technical Report Archaeological Prediction Maps Kapiti Coast Elise Smith September 2012 Contents HYPOTHESIS:... 3 Technical challenges... 3 Alternative methods of analysis considered:... 3 Approach
Multilevel modeling and panel data analysis in educational research (Case study: National examination data senior high school in West Java)
") Multilevel modeling and panel data analysis in educational research (Case study: National examination data senior high school in West Java) Pepi Zulvia, Anang Kurnia, and Agus M. Soleh Citation: AIP Conference
Multilevel modeling and panel data analysis in educational research (Case study: National examination data senior high school in West Java) Pepi Zulvia, Anang Kurnia, and Agus M. Soleh Citation: AIP Conference
Modeling the Ecology of Urban Inequality in Space and Time
 Modeling the Ecology of Urban Inequality in Space and Time Corina Graif PhD Candidate, Department Of Sociology Harvard University Presentation for the Workshop on Spatial and Temporal Modeling, Center
REED TUTORIALS (Pty) LTD ECS3706 EXAM PACK
 LTD ECS3706 EXAM PACK") REED TUTORIALS (Pty) LTD ECS3706 EXAM PACK 1 ECONOMETRICS STUDY PACK MAY/JUNE 2016 Question 1 (a) (i) Describing economic reality (ii) Testing hypothesis about economic theory (iii) Forecasting future
REED TUTORIALS (Pty) LTD ECS3706 EXAM PACK 1 ECONOMETRICS STUDY PACK MAY/JUNE 2016 Question 1 (a) (i) Describing economic reality (ii) Testing hypothesis about economic theory (iii) Forecasting future
Geographically Weighted Regression as a Statistical Model
 Geographically Weighted Regression as a Statistical Model Chris Brunsdon Stewart Fotheringham Martin Charlton October 6, 2000 Spatial Analysis Research Group Department of Geography University of Newcastle-upon-Tyne
Empirical Economic Research, Part II
 Based on the text book by Ramanathan: Introductory Econometrics Robert M. Kunst robert.kunst@univie.ac.at University of Vienna and Institute for Advanced Studies Vienna December 7, 2011 Outline Introduction
Statistical and Econometric Methods for Transportation Data Analysis
 Statistical and Econometric Methods for Transportation Data Analysis Chapter 5 Simultaneous-Equation Models Example 5.2 (with 3SLS Extensions) Seemingly Unrelated Regression Estimation and 3SLS A survey
Modeling the Spatial Effects on Demand Estimation of Americans with Disabilities Act Paratransit Services
 Modeling the Spatial Effects on Demand Estimation of Americans with Disabilities Act Paratransit Services Pei-Fen Kuo, Chung-Wei Shen, and Luca Quadrifoglio A reliable method for predicting paratransit
Spatial Regression. 3. Review - OLS and 2SLS. Luc Anselin. Copyright 2017 by Luc Anselin, All Rights Reserved
 Spatial Regression 3. Review - OLS and 2SLS Luc Anselin http://spatial.uchicago.edu OLS estimation (recap) non-spatial regression diagnostics endogeneity - IV and 2SLS OLS Estimation (recap) Linear Regression
Spatial Pattern Analysis: Mapping Trends and Clusters. Lauren M. Scott, PhD Lauren Rosenshein Bennett, MS
 Spatial Pattern Analysis: Mapping Trends and Clusters Lauren M. Scott, PhD Lauren Rosenshein Bennett, MS Presentation Outline Spatial statistics overview Describing spatial patterns Quantifying spatial
Geographically weighted regression approach for origin-destination flows
 Geographically weighted regression approach for origin-destination flows Kazuki Tamesue 1 and Morito Tsutsumi 2 1 Graduate School of Information and Engineering, University of Tsukuba 1-1-1 Tennodai, Tsukuba,
Spatial Investigation of Mineral Transportation Characteristics in the State of Washington
 Khachatryan, Jessup 1 Spatial Investigation of Mineral Transportation Characteristics in the State of Washington Hayk Khachatryan Graduate Student Email: hkhachatryan@wsu.edu Eric L. Jessup Assistant Professor
Econometrics Honor s Exam Review Session. Spring 2012 Eunice Han
 Econometrics Honor s Exam Review Session Spring 2012 Eunice Han Topics 1. OLS The Assumptions Omitted Variable Bias Conditional Mean Independence Hypothesis Testing and Confidence Intervals Homoskedasticity
Statistical and Econometric Methods for Transportation Data Analysis
 Statistical and Econometric Methods for Transportation Data Analysis Chapter 5 Simultaneous-Equation Models Example 5.2 Seemingly Unrelated Regression Estimation A survey of 206 people was conducted on
GIS in Locating and Explaining Conflict Hotspots in Nepal
 GIS in Locating and Explaining Conflict Hotspots in Nepal Lila Kumar Khatiwada Notre Dame Initiative for Global Development 1 Outline Brief background Use of GIS in conflict study Data source Findings
Why do people want to get married?
 Why do people want to get married? Colineaux Yvanne - Marine Dufau ENAC May 24, 2013 Introduction What are the individual characteristics that impact on their desire to get married? Composition of the
Model Estimation Example
 Ronald H. Heck 1 EDEP 606: Multivariate Methods (S2013) April 7, 2013 Model Estimation Example As we have moved through the course this semester, we have encountered the concept of model estimation. Discussions
Day 4: Shrinkage Estimators
 Day 4: Shrinkage Estimators Kenneth Benoit Data Mining and Statistical Learning March 9, 2015 n versus p (aka k) Classical regression framework: n > p. Without this inequality, the OLS coefficients have
ECON 497 Midterm Spring
 ECON 497 Midterm Spring 2009 1 ECON 497: Economic Research and Forecasting Name: Spring 2009 Bellas Midterm You have three hours and twenty minutes to complete this exam. Answer all questions and explain
Ordinary Least Squares Regression Explained: Vartanian
 Ordinary Least Squares Regression Explained: Vartanian When to Use Ordinary Least Squares Regression Analysis A. Variable types. When you have an interval/ratio scale dependent variable.. When your independent
An Introduction to Econometrics. A Self-contained Approach. Frank Westhoff. The MIT Press Cambridge, Massachusetts London, England
 An Introduction to Econometrics A Self-contained Approach Frank Westhoff The MIT Press Cambridge, Massachusetts London, England How to Use This Book xvii 1 Descriptive Statistics 1 Chapter 1 Prep Questions
Spatial Pattern Analysis: Mapping Trends and Clusters
 2013 Esri International User Conference July 8 12, 2013 San Diego, California Technical Workshop Spatial Pattern Analysis: Mapping Trends and Clusters Lauren Rosenshein Bennett Brett Rose Presentation
Testing methodology. It often the case that we try to determine the form of the model on the basis of data
 Testing methodology It often the case that we try to determine the form of the model on the basis of data The simplest case: we try to determine the set of explanatory variables in the model Testing for
Repeated observations on the same cross-section of individual units. Important advantages relative to pure cross-section data
 Panel data Repeated observations on the same cross-section of individual units. Important advantages relative to pure cross-section data - possible to control for some unobserved heterogeneity - possible
Regression of Inflation on Percent M3 Change
 ECON 497 Final Exam Page of ECON 497: Economic Research and Forecasting Name: Spring 2006 Bellas Final Exam Return this exam to me by midnight on Thursday, April 27. It may be e-mailed to me. It may be
Section 2 NABE ASTEF 65
 Section 2 NABE ASTEF 65 Econometric (Structural) Models 66 67 The Multiple Regression Model 68 69 Assumptions 70 Components of Model Endogenous variables -- Dependent variables, values of which are determined
Multiple Regression. Peerapat Wongchaiwat, Ph.D.
 Peerapat Wongchaiwat, Ph.D. wongchaiwat@hotmail.com The Multiple Regression Model Examine the linear relationship between 1 dependent (Y) & 2 or more independent variables (X i ) Multiple Regression Model
CS6220: DATA MINING TECHNIQUES
 CS6220: DATA MINING TECHNIQUES Matrix Data: Prediction Instructor: Yizhou Sun yzsun@ccs.neu.edu September 14, 2014 Today s Schedule Course Project Introduction Linear Regression Model Decision Tree 2 Methods
Regression Analysis of 911 call frequency in Portland, OR Urban Areas in Relation to Call Center Vicinity Elyse Maurer March 13, 2015
 Regression Analysis of 911 call frequency in Portland, OR Urban Areas in Relation to Call Center Vicinity Elyse Maurer March 13, 2015 Introduction: Using the Linear Regression and Geographically Weighted
Geographically Weighted Regression and Kriging: Alternative Approaches to Interpolation A Stewart Fotheringham
 Geographically Weighted Regression and Kriging: Alternative Approaches to Interpolation A Stewart Fotheringham National Centre for Geocomputation National University of Ireland, Maynooth http://ncg.nuim.ie
Prospect. February 8, Geographically Weighted Analysis - Review and. Prospect. Chris Brunsdon. The Basics GWPCA. Conclusion
 bruary 8, 0 Regression (GWR) In a nutshell: A local statistical technique to analyse spatial variations in relationships Global averages of spatial data are not always helpful: climate data health data
BOOtstrapping the Generalized Linear Model. Link to the last RSS article here:factor Analysis with Binary items: A quick review with examples. -- Ed.
 MyUNT EagleConnect Blackboard People & Departments Maps Calendars Giving to UNT Skip to content Benchmarks ABOUT BENCHMARK ONLINE SEARCH ARCHIVE SUBSCRIBE TO BENCHMARKS ONLINE Columns, October 2014 Home»
APPLICATION OF GEOGRAPHICALLY WEIGHTED REGRESSION ANALYSIS TO LAKE-SEDIMENT DATA FROM AN AREA OF THE CANADIAN SHIELD IN SASKATCHEWAN AND ALBERTA
 APPLICATION OF GEOGRAPHICALLY WEIGHTED REGRESSION ANALYSIS TO LAKE-SEDIMENT DATA FROM AN AREA OF THE CANADIAN SHIELD IN SASKATCHEWAN AND ALBERTA Nadia Yavorskaya 1, Stephen Amor 2 1 450 Bonner Av., Winnipeg,
Spatial Modeling of Residential Crowding in Alexandria Governorate, Egypt: A Geographically Weighted Regression (GWR) Technique
 Technique") Journal of Geographic Information System, 2015, 7, 369-383 Published Online August 2015 in SciRes. http://www.scirp.org/journal/jgis http://dx.doi.org/10.4236/jgis.2015.74029 Spatial Modeling of Residential
Journal of Geographic Information System, 2015, 7, 369-383 Published Online August 2015 in SciRes. http://www.scirp.org/journal/jgis http://dx.doi.org/10.4236/jgis.2015.74029 Spatial Modeling of Residential
Problem Set 10: Panel Data
 Problem Set 10: Panel Data 1. Read in the data set, e11panel1.dta from the course website. This contains data on a sample or 1252 men and women who were asked about their hourly wage in two years, 2005
Heteroscedasticity 1
 Heteroscedasticity 1 Pierre Nguimkeu BUEC 333 Summer 2011 1 Based on P. Lavergne, Lectures notes Outline Pure Versus Impure Heteroscedasticity Consequences and Detection Remedies Pure Heteroscedasticity
Finding Instrumental Variables: Identification Strategies. Amine Ouazad Ass. Professor of Economics
 Finding Instrumental Variables: Identification Strategies Amine Ouazad Ass. Professor of Economics Outline 1. Before/After 2. Difference-in-difference estimation 3. Regression Discontinuity Design BEFORE/AFTER
Geospatial dynamics of Northwest. fisheries in the 1990s and 2000s: environmental and trophic impacts
 Geospatial dynamics of Northwest Atlantic ti cod and crustacean fisheries in the 1990s and 2000s: environmental and trophic impacts Matthew J.S. WINDLE 1, George A. ROSE 2, Rodolphe DEVILLERS 3, and Marie-Josée
Introduction to Econometrics
 Introduction to Econometrics T H I R D E D I T I O N Global Edition James H. Stock Harvard University Mark W. Watson Princeton University Boston Columbus Indianapolis New York San Francisco Upper Saddle
Techniques for Science Teachers: Using GIS in Science Classrooms.
 Techniques for Science Teachers: Using GIS in Science Classrooms. After ESRI, 2008 GIS A Geographic Information System A collection of computer hardware, software, and geographic data used together for
Föreläsning /31
 1/31 Föreläsning 10 090420 Chapter 13 Econometric Modeling: Model Speci cation and Diagnostic testing 2/31 Types of speci cation errors Consider the following models: Y i = β 1 + β 2 X i + β 3 X 2 i +
Lecture 1: OLS derivations and inference
 Lecture 1: OLS derivations and inference Econometric Methods Warsaw School of Economics (1) OLS 1 / 43 Outline 1 Introduction Course information Econometrics: a reminder Preliminary data exploration 2
Course Introduction and Overview Descriptive Statistics Conceptualizations of Variance Review of the General Linear Model
 Course Introduction and Overview Descriptive Statistics Conceptualizations of Variance Review of the General Linear Model EPSY 905: Multivariate Analysis Lecture 1 20 January 2016 EPSY 905: Lecture 1 -
Dr Arulsivanathan Naidoo Statistics South Africa 18 October 2017
 ESRI User Conference 2017 Space Time Pattern Mining Analysis of Matric Pass Rates in Cape Town Schools Dr Arulsivanathan Naidoo Statistics South Africa 18 October 2017 Choose one of the following Leadership
Statistical and Econometric Methods for Transportation Data Analysis
 Statistical and Econometric Methods for Transportation Data Analysis Chapter 5 Simultaneous-Equation Models Example 5.2 (with 3SLS Extensions) Using 2017 USF Survey data Seemingly Unrelated Regression
Practice Questions for the Final Exam. Theoretical Part
 Brooklyn College Econometrics 7020X Spring 2016 Instructor: G. Koimisis Name: Date: Practice Questions for the Final Exam Theoretical Part 1. Define dummy variable and give two examples. 2. Analyze the
Economics 471: Econometrics Department of Economics, Finance and Legal Studies University of Alabama
 Economics 471: Econometrics Department of Economics, Finance and Legal Studies University of Alabama Course Packet The purpose of this packet is to show you one particular dataset and how it is used in
Ph.D. Preliminary Examination Statistics June 2, 2014
 Ph.D. Preliminary Examination Statistics June, 04 NOTES:. The exam is worth 00 points.. Partial credit may be given for partial answers if possible.. There are 5 pages in this exam paper. I have neither
Regression Analysis. BUS 735: Business Decision Making and Research. Learn how to detect relationships between ordinal and categorical variables.
 Regression Analysis BUS 735: Business Decision Making and Research 1 Goals of this section Specific goals Learn how to detect relationships between ordinal and categorical variables. Learn how to estimate
Statistical and Econometric Methods for Transportation Data Analysis
 Statistical and Econometric Methods for Transportation Data Analysis Chapter 5 Simultaneous-Equation Models Example 5.2 (with 3SLS Extensions) Using 2015 USF Survey data Seemingly Unrelated Regression
Outline. Nature of the Problem. Nature of the Problem. Basic Econometrics in Transportation. Autocorrelation
 1/30 Outline Basic Econometrics in Transportation Autocorrelation Amir Samimi What is the nature of autocorrelation? What are the theoretical and practical consequences of autocorrelation? Since the assumption
Activity #12: More regression topics: LOWESS; polynomial, nonlinear, robust, quantile; ANOVA as regression
 Activity #12: More regression topics: LOWESS; polynomial, nonlinear, robust, quantile; ANOVA as regression Scenario: 31 counts (over a 30-second period) were recorded from a Geiger counter at a nuclear
LINEAR REGRESSION ANALYSIS. MODULE XVI Lecture Exercises
 LINEAR REGRESSION ANALYSIS MODULE XVI Lecture - 44 Exercises Dr. Shalabh Department of Mathematics and Statistics Indian Institute of Technology Kanpur Exercise 1 The following data has been obtained on
Applied Microeconometrics (L5): Panel Data-Basics
: Panel Data-Basics") Applied Microeconometrics (L5): Panel Data-Basics Nicholas Giannakopoulos University of Patras Department of Economics ngias@upatras.gr November 10, 2015 Nicholas Giannakopoulos (UPatras) MSc Applied Economics
Applied Microeconometrics (L5): Panel Data-Basics Nicholas Giannakopoulos University of Patras Department of Economics ngias@upatras.gr November 10, 2015 Nicholas Giannakopoulos (UPatras) MSc Applied Economics
Mapping Your Educational Research: Putting Spatial Concepts into Practice with GIS. Mark Hogrebe Washington University in St.
 Mapping Your Educational Research: Putting Spatial Concepts into Practice with GIS Mapping Your Educational Research: Putting Spatial Concepts into Practice with GIS Mark Hogrebe Washington University
Fixed and Random Effects Models: Vartanian, SW 683
 : Vartanian, SW 683 Fixed and random effects models See: http://teaching.sociology.ul.ie/dcw/confront/node45.html When you have repeated observations per individual this is a problem and an advantage:
The OLS Estimation of a basic gravity model. Dr. Selim Raihan Executive Director, SANEM Professor, Department of Economics, University of Dhaka
 The OLS Estimation of a basic gravity model Dr. Selim Raihan Executive Director, SANEM Professor, Department of Economics, University of Dhaka Contents I. Regression Analysis II. Ordinary Least Square
An overview of applied econometrics
 An overview of applied econometrics Jo Thori Lind September 4, 2011 1 Introduction This note is intended as a brief overview of what is necessary to read and understand journal articles with empirical
36-309/749 Experimental Design for Behavioral and Social Sciences. Dec 1, 2015 Lecture 11: Mixed Models (HLMs)
") 36-309/749 Experimental Design for Behavioral and Social Sciences Dec 1, 2015 Lecture 11: Mixed Models (HLMs) Independent Errors Assumption An error is the deviation of an individual observed outcome (DV)
36-309/749 Experimental Design for Behavioral and Social Sciences Dec 1, 2015 Lecture 11: Mixed Models (HLMs) Independent Errors Assumption An error is the deviation of an individual observed outcome (DV)
Attribute Data. ArcGIS reads DBF extensions. Data in any statistical software format can be
 This hands on application is intended to introduce you to the foundational methods of spatial data analysis available in GeoDa. We will undertake an exploratory spatial data analysis, of 1,387 southern
Introduction. Part I: Quick run through of ESDA checklist on our data
 CSDE GIS Workshop Series Spatial Regression Chris Fowler csfowler@uw.edu Introduction The goal of these exercises is to give you a chance to put the concepts we have just discussed into practice. Keep
Medical GIS: New Uses of Mapping Technology in Public Health. Peter Hayward, PhD Department of Geography SUNY College at Oneonta
 Medical GIS: New Uses of Mapping Technology in Public Health Peter Hayward, PhD Department of Geography SUNY College at Oneonta Invited research seminar presentation at Bassett Healthcare. Cooperstown,
Spatial Analysis 1. Introduction
 Spatial Analysis 1 Introduction Geo-referenced Data (not any data) x, y coordinates (e.g., lat., long.) ------------------------------------------------------ - Table of Data: Obs. # x y Variables -------------------------------------
Lecture 4: Multivariate Regression, Part 2
 Lecture 4: Multivariate Regression, Part 2 Gauss-Markov Assumptions 1) Linear in Parameters: Y X X X i 0 1 1 2 2 k k 2) Random Sampling: we have a random sample from the population that follows the above
Final Exam - Solutions
 Ecn 102 - Analysis of Economic Data University of California - Davis March 19, 2010 Instructor: John Parman Final Exam - Solutions You have until 5:30pm to complete this exam. Please remember to put your