arxiv: v2 [astro-ph.co] 22 Mar 2017
|
|
|
- Laureen Black
- 5 years ago
- Views:
Transcription
1 Mon. Not. R. Astron. Soc., 1 14 () Printed 23 March 217 (MN LaT E X style file v2.2) The clustering of galaxies in the completed SDSS-III Baryon Oscillation Spectroscopic Survey: tomographic BAO analysis of DR12 combined sample in configuration space arxiv: v2 [astro-ph.co] 22 Mar 217 Yuting Wang 1,2, Gong-Bo Zhao 1,2, Chia-Hsun Chuang 3,4, Ashley J. Ross 5, Will J. Percival 2, Héctor Gil-Marín 2, Antonio J. Cuesta 6, Francisco-Shu Kitaura 4, Sergio Rodriguez-Torres 3,7,8, Joel R. Brownstein 9, Daniel J. Eisenstein 1, Shirley Ho 11,12,13, Jean-Paul Kneib 14, Matthew D. Olmstead 15, Francisco Prada 7, Graziano Rossi 16, Ariel G. Sánchez 17, Salvador Salazar-Albornoz 18,17, Daniel Thomas 2, Jeremy Tinker 19, Rita Tojeiro 2, Mariana Vargas-Magaña 21, Fangzhou Zhu 22 1 National Astronomy Observatories, Chinese Academy of Science, Beijing, 112, P. R. China 2 Institute of Cosmology & Gravitation, University of Portsmouth, Dennis Sciama Building, Portsmouth, PO1 3FX, UK 3 Instituto de Física Teórica, (UAM/CSIC), Universidad Autónoma de Madrid, Cantoblanco, E-2849 Madrid, Spain 4 Leibniz-Institut für Astrophysik Potsdam (AIP), An der Sternwarte 16, Potsdam, Germany 5 Center for Cosmology and AstroParticle Physics, The Ohio State University, Columbus, OH 4321, USA 6 Institut de Ciències del Cosmos (ICCUB), Universitat de Barcelona (IEEC- UB), Martí i Franquès 1, E-828 Barcelona, Spain 7 Campus of International Excellence UAM+CSIC, Cantoblanco, E-2849 Madrid, Spain 8 Departamento de Física Teórica, Universidad Autónoma de Madrid, Cantoblanco, E-2849, Madrid, Spain 9 Department of Physics and Astronomy, University of Utah, 115 S 14 E, Salt Lake City, UT 84112, USA 1 Harvard-Smithsonian Center for Astrophysics, 6 Garden St., Cambridge, MA 2138, USA 11 McWilliams Center for Cosmology, Department of Physics, Carnegie Mellon University, 5 Forbes Ave., Pittsburgh, PA Lawrence Berkeley National Laboratory, 1 Cyclotron Rd, Berkeley, CA Department of Physics, University of California, Berkeley, CA Laboratoire d Astrophysique, Ecole Polytechnique Fédérale de Lausanne (EPFL), Observatoire de Sauverny, CH-129 Versoix, Switzerland 15 Department of Chemistry and Physics, King s College, 133 North River St, Wilkes Barre, PA 18711, USA 16 Department of Astronomy and Space Science, Sejong University, Seoul , Korea 17 Max-Planck-Institut für extraterrestrische Physik, Postfach 1312, Giessenbachstr., Garching, Germany 18 Universität Sternwarte Muänchen, Ludwig Maximilian Universität, Munich, Germany 19 Center for Cosmology and Particle Physics, Department of Physics, New York University, 4 Washington Place, New York, NY 13, USA 2 School of Physics and Astronomy, University of St Andrews, North Haugh, St Andrews KY16 9SS, UK 21 Instituto de Fisica, Universidad Nacional Autonoma de Mexico, Apdo. Postal 2-364, Mexico 22 Department of Physics, Yale University, New Haven, CT 6511, USA 23 March 217 c RAS
2 2 Wang et al. ABSTRACT We perform a tomographic baryon acoustic oscillations analysis using the two-point galaxy correlation function measured from the combined sample of BOSS DR12, which covers the redshift range of.2 < z <.75. Splitting the sample into multiple overlapping redshift slices to extract the redshift information of galaxy clustering, we obtain a measurement of D A (z)/r d and H(z)r d at nine effective redshifts with the full covariance matrix calibrated using MultiDark-Patchy mock catalogues. Using the reconstructed galaxy catalogues, we obtain the precision of 1.3% 2.2% for D A (z)/r d and 2.1% 6.% for H(z)r d. To quantify the gain from the tomographic information, we compare the constraints on the cosmological parameters using our 9-bin BAO measurements, the consensus 3-bin BAO and RSD measurements at three effective redshifts in Alam et al. (216), and the non-tomographic (1-bin) BAO measurement at a single effective redshift. Comparing the 9-bin with 1-bin constraint result, it can improve the dark energy Figure of Merit by a factor of 1.24 for the Chevallier-Polarski- Linder parametrisation for equation of state parameter w DE. The errors of w and w a from 9-bin constraints are slightly improved when compared to the 3-bin constraint result. Key words: baryon acoustic oscillations, distance scale, dark energy 1 INTRODUCTION The accelerating expansion of the Universe was discovered by the observation of type Ia supernovae (Riess et al. 1998; Perlmutter et al. 1999). Understanding the physics of the cosmic acceleration is one of the major challenges in cosmology. In the framework of general relatively (GR), a new energy component with a negative pressure, dubbed dark energy (DE), can be the source driving the cosmic acceleration. Observations reveal that the DE component dominates the current Universe (Weinberg et al. 213). However, the nature of DE remains unknown. Large cosmological surveys, especially for galaxy redshift surveys, can provide key observational support for the study of DE. Galaxy redshift surveys are used to map the large scale structure of the Universe, and extract the signal of baryon acoustic oscillation (BAO). The BAO, produced by the competition between gravity and radiation due to the couplings between baryons and photons before the cosmic recombination, leave an imprint on the distribution of galaxies at late times. After the photons decouple, the acoustic oscillations are frozen and correspond to a characteristic scale, determined by the comoving sound horizon at the drag epoch, r d 15 Mpc. This feature corresponds to an excess on the 2-point correlation function, or a series of wiggles on the power spectrum. The acoustic scale is regarded as a standard ruler to measure the cosmic expansion history, and to constrain cosmological parameters (Eisenstein et al. 25). If assuming an isotropic galaxies clustering, the combined volume distance, D V (z) [ cz(1 + z) 2 D A(z) 2 H 1 (z) ] 1/3, where H(z) is the Hubble parameter and D A(z) is the angular diameter distance, can be measured using the angle-averaged 2-point correlation function, ξ (s) (Eisenstein et al. 25; Kazin et al. 21; Beutler et al. 211; Blake et al. 211) or power spectrum P (k) (Tegmark et al. 26; Percival et al. 27; Reid et al. 21). However, in principle the clustering of galaxies is anisotropic, the BAO scale can be measured in the radial and transverse directions to provide the Hubble parameter, H(z), and angular diameter distance, D A(z), respec- ytwang@nao.cas.cn gbzhao@nao.cas.cn tively. As proposed by Padmanabhan & White 28, the multipole projection of the full 2D measurement of power spectrum, P l (k), were used to break the degeneracy of H(z) and D A(z). This multipole method was applied into the correlation function (Chuang & Wang 212, 213; Xu et al. 213). Alternative wedge projection of correlation function, ξ µ(s), was used to constrain parameters, H(z) and D A(z) (Kazin et al. 212, 213). In Anderson et al. (214), the anisotropic BAO analysis was performed using these two projections of correlation function from SDSS-III Baryon Oscillation Spectroscopic Survey (BOSS) DR1 and DR11 samples. The BOSS (Dawson et al. 213), which is part of SDSS-III (Eisenstein et al. 211), has provided the Data Release 12 (Alam et al. 215). With a redshift cut, the whole samples are split into the low-redshift samples (LOWZ) in the redshift range.15 < z <.43 and constant stellar mass samples (CMASS) in the redshift range.43 < z <.7. Using these catalogues, the BAO peak position was measured at two effective redshifts, z eff =.32 and z eff =.57, in the multipoles of correlation function (Cuesta et al. 216) or power spectrum (Gil-Marín et al. 216). Chuang et al. 216 proposed to divide each sample of LOWZ and CMASS into two independent redshift bins, thus to test the extraction of redshift information from galaxy clustering. They performed the measurements on BAO and growth rate at four effective redshifts, z eff =.24,.37,.49 and.64 (Chuang et al. 216). The completed data release of BOSS will provide a combined sample, covering the redshift range from.2 to.75. The sample is divided into three redshift bins, i.e., two independent redshift bins,.2 < z <.5 and.5 < z <.75, and an overlapping redshift bin,.4 < z <.6. The BAO signal is measured at the three effective redshifts, z eff =.38,.51 and.61 using the configurationspace correlation function (Ross et al. 216; Vargas-Magaña et al. 216) or Fourier-space power spectrum (Beutler et al. 216a). As the tomographic information of galaxy clustering is important to constrain the property of DE (Salazar-Albornoz et al. 214; Zhao et al. 217), we will extract the information of redshift evolution from the combined catalogue as much as possible. To achieve this, we adopt the binning method. The binning scheme is determined through the forecasting result using Fisher matrix method. c RAS, MNRAS, 1 14
3 Tomographic BAO analysis of BOSS DR12 sample 3 We split the whole sample into nine overlapping redshift bins to make sure that the measurement precision of the isotropic BAO signal is better than 3% in each bin. We perform the measurements on the an/isotropic BAO positions in the nine overlapping bins using the correlation functions of the pre- and post-reconstruction catalogues. To test the constraining power of our tomographic BAO measurements, we perform the fitting of cosmological parameters. The analysis is part of a series of papers analysing the clustering of the completed BOSS DR12 (Alam et al. 216; Zhao et al. 216; Beutler et al. 216a,b; Ross et al. 216; Sanchez et al. 216b,a; Salazar-Albornoz et al. 216a; Vargas-Magaña et al. 216; Grieb et al. 216; Chuang et al. 216; Salazar-Albornoz et al. 216b). The same tomographic BAO analysis is performed using galaxy power spectrum in Fourier space (Zhao et al. 216). Another tomographic analysis is performed using the angular correlation function in many thin redshift shells and their angular cross-correlations in the companion paper, Salazar-Albornoz et al. (216a), to extract the time evolution of the clustering signal. In Section 2, we introduce the data and mocks used in this paper. We present the forecast result in Section 3. In Section 4, we describe the methodology to measure the BAO signal using multipoles of correlation function. In Section 5, we constrain cosmological models using the BAO measurement from the postreconstructed catalogues. Section 6 is devoted to the conclusion. In this paper, we use a fiducial ΛCDM cosmology with the parameters: Ω m =.37, Ω b h 2 =.22, h =.6777, n s =.96, σ 8 = The comoving sound horizon in this cosmology is rd fid = Mpc. 2 DATA AND MOCKS We use the completed catalogue of BOSS DR12, which covers the redshift range from.2 to.75. In the North Galactic Cap (NGC), 864, 923 galaxies over the effective coverage area of deg 2 are observed and the South Galactic Cap (SGC) contains 333, 81 with the effective coverage area of deg 2. The volume density distribution from observation is shown in solid curves of Figure 1. In oder to correct for observational effects, the catalogue is given a set of weights, including weights for the redshift failure, w zf, close pair due to fiber collisions, w cp and for systematics, w sys. In addition, the FKP weight to achieve a balance between the regions of high density and low density (Feldman et al. 1994) is added w FKP = n(z)p, (1) where n(z) is the number density of galaxies, and P is set to 1, h 3 Mpc 3. Thus each galaxy is counted by adding a total weight as below w tot = w FKPw sys(w cp + w zf 1). (2) The details about the observational systematic weights are described in Ross et al. (216). The correlation function is measured by comparing the galaxy distribution to a randomly distributed catalogue, which is reconstructed with the same radial selection function as the real catalogue, but without clustering structure. We use a random catalogue consisting of 5 times random galaxies of the observed sample. During the cosmic evolution, non-linear structure formation and redshift space distortions (RSD) can weaken the significance of the BAO peak thus degrade the precision of BAO measurements. The BAO signal can be boosted to some extent by the reconstruction procedure, which effectively moves the galaxies to the positions as if there was no RSD and nonlinear effects (Eisenstein et al. 27a). We will also present BAO measurements using the catalogue, which is reconstructed through the reconstruction algorithm as described in Padmanabhan et al. (212). Mock galaxy catalogues are required to determine the data covariance matrix, and to test the methodology. We use the MultiDark-Patchy mock catalogues (Kitaura et al. 216). The mock catalogues are constructed to match the observed data on the angular selection function, redshift distribution, and clustering statistics (e.g. 2-point and 3-point correlation functions). We utilise 245 mock catalogues for the pre-reconstruction, and 1 mocks for the post-reconstruction. We perform the measurement for each mock catalogue, then estimate the covariance matrix of data correlation function using the method proposed in Percival et al. (214). 3 BAO FORECASTS We first determine the binning scheme through the Fisher matrix method. We use the Fisher matrix formulism in (Tegmark 1997; Seo & Eisenstein 27) to predict the BAO distance parameters. Starting with the galaxy power spectrum, P (k, µ), the fisher matrix is F ij = 1 kmax 1 ln P (k, µ) ln P (k, µ) k min p i p j V eff (k, µ) k2 dkdµ 8π 2, (3) here we set k min = 2π/V 1/3 sur h Mpc 1 and k max =.3 h Mpc 1. In order to ensure that the isotropic BAO measurement precision in each bin is better than 3%, we split the whole redshift range, i.e. [.2,.75] into 9 overlapping bins. The width of the first and last bins is.19, and other bins have the same bin width, i.e. z =.15. In Table 1, we present the 9 overlapping redshift ranges, the effective redshifts and numbers of the samples in the NGC and SGC. In Figure 1, the overlapping histograms denote the average number density in each bin. Combining the results of NGC and SGC samples as, F NGC+SGC ij = F NGC ij + F SGC ij, (4) we present the forecast result on the precision of the BAO distance parameters, including the angular diameter distance D A(z), Hubble parameter H(z) and volume distance D V (z) in Table 2. It is seen that the isotropic BAO prediction in each bin can reach, σ DV /D V < 3%. With the 5% reconstructed efficiency, which means that the nonlinear damping scales, Σ and Σ, are reduced by a factor.5 and there is the remaining 5% nonlinearity, the isotropic BAO precision is within.8% 1.2%. The predictions on the precision of anisotropic BAO parameters are within 1.8% 2.9% for the angular diameter distance and 4.2% 7.1% for the Hubble parameter without the reconstruction. Considering the 5% reconstruction, the best prediction can reach 1.1% for D A(z) and 2.1% for H(z). The contour plot of D A(z) and H(z) within 2 σ error is displayed in Figure 2, where the black points are the fiducial values. The left panel in Figure 2 shows the forecast result without reconstruction, and the right panel presents the 5% reconstructed result. c RAS, MNRAS, 1 14


 [km/s Mpc -1 ] Pre-recon \"5%\" recon Table 1.")
[mpc] n(z) [h 3 /Mpc 3 ].5.")


 estimator: ξ(s, µ) = DD(s, µ) 2DR(s, µ) + RR(s,")


 using the combination of")
 = 2l + 1 2 1 1 dµ ξ(s, µ)l l (µ), (6) where L l (µ) is")

 2DS(s, µ) + SS(s, µ), (7) RR(s, µ) here we used the")


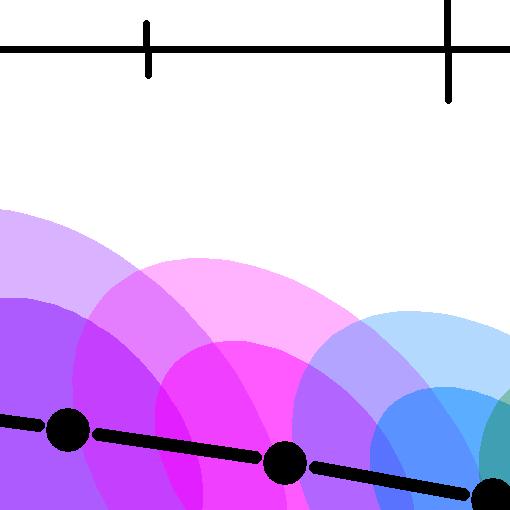
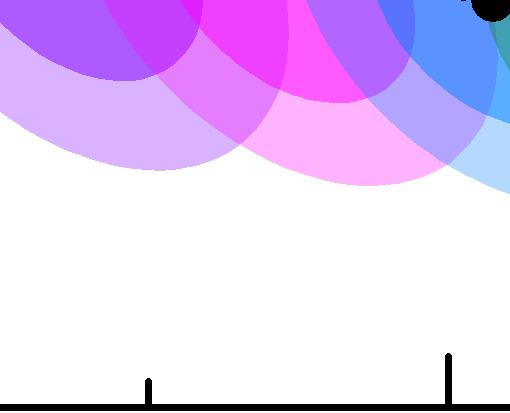
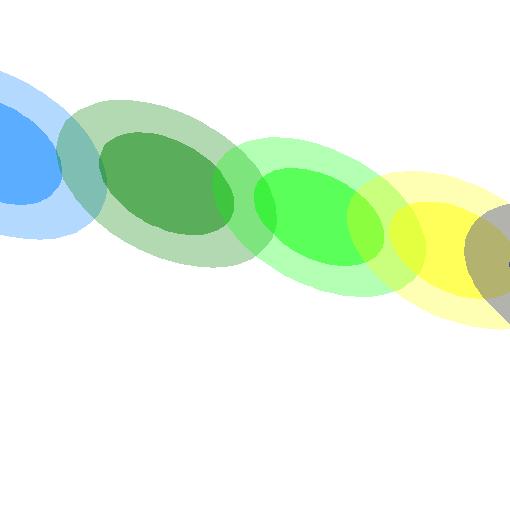


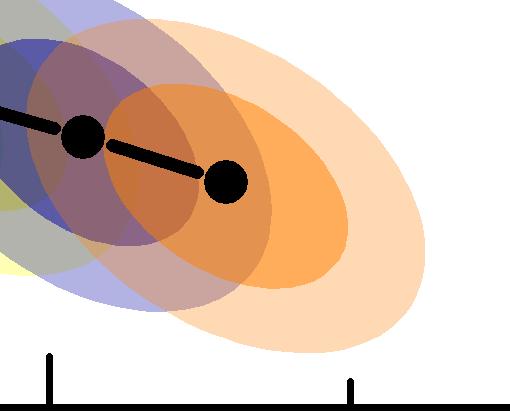
4 4 Wang et al. z bins z eff NGC SGC.2 < z < < z < < z < < z < < z < < z < < z < < z < < z < H(z) [km/s Mpc -1 ] Pre-recon "5%" recon Table 1. The 9 overlapping redshift bins, the effective redshift and the number of samples in each bin. D A (z)[mpc] n(z) [h 3 /Mpc 3 ] NGC SGC Figure 2. The 68 and 95% CL contour plots of the transverse and radial distance parameters, D A (z) and H(z), in 9 redshift bins are shown one by one from left to right. The left panel shows the result without the reconstruction, and the right panel is the result with 5% reconstructed efficiency. The multipole projections of the correlation function can be calculated through redshift z redshift z Figure 1. The overlapping histograms in different colours are the average number densities in 9 redshift bins, which is used to do the forecasts. The solid lines are the number densities for the NGC/SGC samples. 4 BAO MEASUREMENTS 4.1 The estimator for the 2-pt correlation function We measure the correlation function of the combined sample using the Landy & Szalay (1993) estimator: ξ(s, µ) = DD(s, µ) 2DR(s, µ) + RR(s, µ), (5) RR(s, µ) where DD, DR and RR are the weighted data-data pair counts, datarandom pair counts and random-random pair counts with the separation, s and the cosine of the angle of the pair to the line of sight, µ. Table 2. The forecast results on the BAO distance parameters without reconstruction (and 5% reconstruction) using the combination of NGC and SGC samples. ξ l (s) = 2l dµ ξ(s, µ)l l (µ), (6) where L l (µ) is the Legendre Polynomial. We also measure the correlation function of the reconstructed catalogue using the Landy & Szalay (1993) estimator: ξ(s, µ) = DD(s, µ) 2DS(s, µ) + SS(s, µ), (7) RR(s, µ) here we used the shifted data and randoms for DD, DS, and SS. The measured monopole and quadruple of correlation function from data and mocks in each redshift bin are shown in Figure 3 for the pre-reconstruction measurements, and in Figure 4 for the post-reconstruction measurements, where the red squares with 1 σ error bar are the measurements of monopole from data. The red shaded regions correspond to the standard deviation from the mocks around the average. The blue points with 1 σ error bar are the data measurements of quadrupole, and the blue shaded regions denote the average with a standard deviation from the mocks. The 2D correlation functions measured in 9 redshift bins using the pre-reconstructed and post-reconstructed catalogues are plotted in Figure 5, where the BAO ring in each redshift slice is visualised. As expected, the BAO ring becomes clear after reconstruction. z eff σ DA /D A σ H /H σ DV /D V (159).75 (39).236 (114) (159).681 (37).229 (113) (145).616 (281).27 (14) (13).553 (253).185 (93) (118).52 (23).167 (85) (11).464 (214).155 (79) (18).441 (28).147 (77) (113).436 (214).147 (8) (122).418 (222).144 (85) 4.2 The template The isotropic BAO position is parameterised by the scale dilation parameter, α DV (z)r d,fid D fid(z)r. (8) d V We adopt the template for the correlation function in the isotropic case (Eisenstein et al. 27b), ξ mod k 2 dk (s) = 2π P mod 2 dw (k)f (k, Σ s)j (ks), (9) c RAS, MNRAS, 1 14
5 Tomographic BAO analysis of BOSS DR12 sample 5 s 2 ξ (2 ) [h -2 M p c 2 ] 1.2 < z < < z < < z < < z < < z < < z < < z < < z < s [h -1 M p c ].5 6 < z < Figure 3. The measured monopole and quadrupole of correlation function using the pre-reconstructed catalogue in each redshift bin: in each panel the red square with 1 σ error bar is the measured monopole and the red shaded band is the average of monopoles from mocks with a standard deviation. The blue point with 1 σ error bar is the measured quadrupole and the blue shaded band is the average of quadruples from mocks with a standard deviation. The solid lines show the fitting results. s 2 ξ (2 ) [h -2 M p c 2 ] 1.2 < z < < z < < z < < z < < z < < z < < z < < z < s [h -1 M p c ].5 6 < z < Figure 4. The measured monopole and quadrupole of correlation function using the post-reconstructed catalogue in each redshift bin: in each panel the red square with 1 σ error bar is the measured monopole and the red shaded band is the average of monopoles from mocks with a standard deviation. The blue point with 1 σ error bar is the measured quadrupole and the blue shaded band is the average of quadruples from mocks with a standard deviation. The solid lines show the fitting results. where the damping term is given by F (k, Σ s) = 1 (1 + k 2 Σ 2 s/2) 2. (1) Here we set the parameter Σ s = 4 h 1 Mpc, which is the same as used in (Ross et al. 216). The de-wiggled power spectrum, Pdw mod (k), is given by [ ] Pdw mod (k) = P nw (k) + P lin (k) P nw (k) e 2 1 k2 Σ 2 nl, (11) where P nw (k) is the no-wiggle power spectrum, where the BAO feature is erased, which is obtained using the fitting formulae in Eisenstein & Hu (1998). The linear power spectrum P lin (k) is calculated by CAMB 1 (Lewis et al. 2). Σ nl in the Gaussian term is a damping parameter. Then, allowing an unknown bias factor B ξ, which rescales the amplitude of the input template, the correlation function is given by ξ fit (s) = B 2 ξ ξ mod (αs) + A ξ (s), (12) which includes the polynomial terms for systematics A ξ (s) = a1 s + a2 + 2 a3. (13) s Before doing the fitting, we normalise the model to the data at the scale s = 5 h 1 Mpc, as done in Xu et al. (213); Anderson et al. (214). While performing the fitting, we add a Gaussian prior on log(b 2 ξ) = ±.4 (Xu et al. 213; Anderson et al. 214). So in the isotropic case, we have 5 free parameter, i.e. [log(bξ 2 ), α, a 1, a 2, a 3]. The BAO feature can be measured in both the transverse and line-of-sight directions. This can be parametrised by α and α, respectively α = DA(z)rfid d DA fid(z)r d, α = Hfid (z)rd fid. (14) H(z)r d The anisotropic correlation function is modelled as a transform of the 2D power spectrum, P (k, µ) = (1 + βµ 2 ) 2 F (k, µ, Σ s)p dw (k, µ), (15) where the (1 + βµ 2 ) 2 term corresponds to the Kaiser model for large-scale RSD (Kaiser 1987). For the reconstruction, this term is replaced by [1 + βµ 2 (1 S(k))] 2 with the smoothing, S(k) = e k2 Σ 2 r /2 and Σ r = 15 h 1 Mpc (Seo et al. 215). The term F (k, µ, Σ s) = 1 (1 + k 2 µ 2 Σ 2 s/2) 2 (16) is introduced to model the small-scale FoG effect. The 2D dewiggled power spectrum, compared to Eq. 11, becomes P dw (k, µ) = [P lin (k) P nw(k)] [ exp k2 µ 2 Σ 2 + k 2 (1 µ 2 )Σ 2 ] + P nw(k), 2 (17) here the Gaussian damping term is also anisotropic. Σ and Σ are the line-of-sight and transverse components of Σ nl, i.e. Σ 2 nl = (Σ 2 + 2Σ 2 )/3. Here we set Σ = 4 h 1 Mpc and Σ = 2.5 h 1 Mpc for the post-reconstruction and Σ = 1 h 1 Mpc and Σ = 6 h 1 Mpc for the pre-reconstruction (Ross et al. 216). Given the 2D power spectrum P (k, µ), which can be decomposed into Legendre moments, then the multipoles of power spectrum are P l (k) = 2l P (k, µ)l l (µ)dµ, (18) which can be transformed to the multipoles of correlation function by ξ l (s) = il k 2 P 2π 2 l (k)j l (ks)dk. (19) Using the Legendre polynomials, we have ξ(s, µ) = l 1 ξ l (s)l l (µ). (2) c RAS, MNRAS, 1 14
6 6 Wang et al. s [h -1 Mpc] s [h -1 Mpc] correlation function s s [h -1 M p c ] s [h -1 M p c ] c o rre la tio n fu n c tio n s 2 ξ Figure 5. The 2D pre-reconstruction correlation functions (left panel) and post-reconstruction correlation functions (right panel) in 9 redshift bins, which is assembled using the measured monopole and quadruple from the NGC and SGC samples, i.e. ξ(s, µ) = ξ (s)l (µ) + ξ 2 (s)l 2 (µ), here s = sµ and s = s 1 µ 2. Then the model multipoles of correlation function are 1 ξ l (s, α, α ) = 2l + 1 ξ(s, µ )L l (µ)dµ, (21) 2 1 where s = s µ 2 α 2 + (1 µ2 )α 2 and µ = µα / µ 2 α 2 + (1 µ2 )α 2 are respectively the separation between two galaxies and the cosine of the angle of the pair to the line of sight in the true cosmology,. In addition, we use a bias parameter B to adjust the amplitude of the input template and include the model for systematics using the polynomial terms A l (s) = a l,1 s 2 + a l,2 s + a l,3. (22) So we fit the data using the model multipoles ξ mod (s) = B ξ (s, α, α ) + A (s), (23) ξ mod 2 (s) = ξ 2(s, α, α ) + A 2(s). (24) As in the isotropic case, the monopole template is normalised to the measurement at s = 5 h 1 Mpc. So in the anisotropic case, we have 1 free parameter, i.e. [α, α, log(b 2 ), β, a l,1 3 ]. While performing the fitting, a Gaussian prior on log(b 2 ) = ±.4 is applied. We also add a Gaussian prior for the RSD parameter, i.e. β =.4 ±.2 (Anderson et al. 214). 4.3 Covariance matrix When fitting the BAO parameters, p, we use the MCMC to search for the minimum χ 2, l,l [ ] [ ] χ 2 (p) ξl th (s i, p) ξ l (s i) F l,l ij ξ th l (sj, p) ξ l (sj). i,j where F l,l ij is the inverse of the covariance matrix, C l,l ij, which is estimated using mock catalogues, C l,l ij = 1 N 1 [ ξl k (s i) ξ ] [ l (s i) ξ k l (sj) ξ ] l (s j), (25) k where the average multipoles is given by ξ l (s i) = 1 ξl k (s i), (26) N k here N is the number of mocks: N = 245 in the prereconstruction case and N = 1 in the post-reconstruction case. The unbiased estimation for the inverse covariance matrix is given by C 1 ij = N N b 2 C 1 ij. (27) N 1 where N b is the number of the scale bins. In order to include the error propagation from the error in the covariance matrix into the fitting parameters (Percival et al. 214) we rescale the covariance matrix, C ij, by M = 1 + B(N b N p) 1 + A + B(N p + 1) here N p is the number of the fitting parameters, and (28) 2 A = (N N b 1)(N N b 4), (29) N N b 2 B = (N N b 1)(N N b 4). (3) The normalised covariance matrix showing the correlations between monopole, quadrupole and their cross correlation in each bin is plotted in Figure 6 in the pre-reconstruction case and Figure 7 in the post-reconstruction case. From Figure 6 and Figure 7, it is seen that after reconstruction, there is less auto-correlation of multipoles and cross-correlation between multipoles. 5 TESTS ON MOCK CATALOGUES We present the mock tests for the BAO analysis using 1 pre-reconstructed and post-reconstructed mocks. We perform the isotropic and anisotropic BAO measurements using each individual mock catalogue in both cases. The results are shown in Table 3, where we list the average of fitting value from each mock, standard derivations, and the average of 1σ error for the parameters, α, α c RAS, MNRAS, 1 14
7 Tomographic BAO analysis of BOSS DR12 sample 7 4 C 2 C 3 2 C C 2.2<z<.39.28<z<.43.32<z< < z < < z < < z < < z < < z < < z < <z<.51.4<z<.55.44<z<.59.48<z< <z< <z< Figure 6. The correlations between monopole, C, quadrupole, C 2 and their cross correlation, C C 2 for the pre-reconstruction < z < < z < < z < Figure 8. The 1D distribution of the parameter α from the pre-reconstructed mock catalogue (blue histograms), galaxy catalogue (blue curves) and from the post-reconstructed mock catalogue (red histograms), galaxy catalogue (red curves). α 4 C 2 C C < z < < z < < z < C < z < < z < < z < < z < < z < < z < p o s t-re c o n s tru c tio n σ α < z < < z < < z < < z < < z < < z < < z < < z < < z < Figure 7. The correlations between monopole, C, quadrupole, C 2 and their cross correlation, C C 2 for the post-reconstruction. and α. The fiducial cosmology we use here corresponds to the input cosmology of the mocks, therefore we expect that the average values of parameters α, α and α are equal to 1. Our recovered parameter values in nine redshift bins are well consistent with the input cosmology. For the isotropic results, we find that the greatest bias in α for the pre-reconstruction result is less than.4%, and is less than.2% in the post-reconstruction case. The 1D distribution of the parameter α from mocks is shown in the histograms of Figure 8, where the blue histograms are the pre-reconstruction results, and the red histograms are the postreconstruction results. As expected, the BAO signals measured from the post-reconstructed mocks are more significant, as shown in the scatter plots of Figure 9, where each point in the plot corresponds to the 1 σ error value from each pre- and post-reconstructed mock. For the anisotropic results, on average the biases in the anisotropic parameters are less than.5%. We display the 1D distributions of the parameters, α and α from mocks in the histograms p re -re c o n s tru c tio n σ α Figure 9. The scatter plot of error of α using pre- and post reconstruction mock catalogue. Each magenta point denotes the 1 σ error of α from each mock (totally 1 mocks) and the cross (blue) is the error measured by data. of Figure 1. The scatter plots for the parameters, α and α are shown in Figure RESULTS 6.1 Isotropic BAO measurements The correlation functions are measured with the bin width of 5 h 1 Mpc bins, as shown in Figure 3 and Figure 4. We perform the fitting in the range 5 15 h 1 Mpc. We present the constraints on the isotropic BAO scale in all redshift bins in Table 4. Using the values of DV fid (z)/rd fid for the fiducial cosmology, we derive the constraint on D V (z)/r d, as listed in the last two columns of Table 4. The measurement precic RAS, MNRAS, 1 14
8 8 Wang et al. Table 3. The statistics of the isotropic and anisotropic BAO fittings using the pre-reconstructed and post-reconstructed mocks. α, α and α are the average of the fitting mean value from each mock. S α, S α and S α are the standard derivation of the parameters α, α and α, respectively. σ α, σ α and σ α correspond to the average of 1σ error of these three parameters from each mock. z eff α S α σ α χ 2 /dof α S α σ α α S α σ α χ 2 /dof pre-reconstruction: / / / / / / / / / / / / / / / / / /3 post-reconstruction: / / / / / / / / / / / / / / / / / / < z < < z < < z < < z < < z < < z < < z < < z < < z < < z < < z < < z < < z < < z < < z < < z < < z < < z < α α Figure 1. The 1D distributions of the parameters α (left panel) and α (right panel) from the pre-reconstructed mock catalogue (blue histograms), galaxy catalogue (blue curves) and from the post-reconstructed mock catalogue (red histograms), galaxy catalogue (red curves). sion on D V (z)/r d from the pre-reconstruction catalogue can reach 1.8% 3.3%. For the post-reconstruction, the precision is improved to be 1.1% 1.8%. The improvement on the measurement precision of α after reconstruction can be seen in Figure 12, where we show our tomographic measurements in terms of the redshift in blue squares. The pre-reconstruction constraints are plotted in upper panel, and the lower panel shows the result after reconstruction. Since our redshift slices are highly correlated within the overlapping range, which is visualised in Figure 1, it is important to determine the correlations between redshift slices. We repeat the fitting on BAO parameter using each mock measurement, derive the covariance matrix between the ith z bin and jth z bin using C ij α iα j α i α j, then calculate the correlation coefficient with r ij = C ij/ C iic jj. The normalised correlations of α between redshift slices for the post-reconstruction are plotted in Figure 13. It is seen that each bin is correlated to the 3 redshift bins next to it. c RAS, MNRAS, 1 14
9 9 Tomographic BAO analysis of BOSS DR12 sample < z < < z < < z < < z < < z < < z < < z < < z < < z < < z < < z < < z < < z < < z <.5 1 p o s t - r e c o n s t r u c t i o n σα p o s t - r e c o n s t r u c t i o n σα..4 4 < z < < z < < z < < z < p r e - r e c o n s t r u c t i o n σα p r e - r e c o n s t r u c t i o n σα Figure 11. The scatter plots of errors of α (left panel) and α (right panel) using pre- and post reconstruction mock catalogue. Each magenta point denotes the 1 σ error from each mock (totally 1 mocks) and the cross (blue) is the error measured by data. Table 4. The measurements on the isotropic BAO parameters and the reduced χ2 using the pre- and post-reconstruction catalogues, respectively. α.9916 ± ± ± ± ± ± ± ± ±.212 DV /rd 8.31 ± ± ± ± ± ± ± ± ±.32 χ2 /dof 12.6/ /15 2.9/ / / / /15 21./ /15 post-reconstruction : ± ± ± ± ± ± ± ± ± ± ± ± ± ± ± ± ± ± / /15 22./ /15 39./ /15 1.6/ /15 2.7/ p o s t-re c o n Anisotropic BAO measurements We present the fitting result on the anisotropic BAO parameters in Table 5 before and after reconstruction. Our measurements on α and αk are plotted in terms of redshift in blue squares of Figure 14 and 15, respectively. fid Based on the input fiducial values for DA /rdfid and H fid rdfid, we can obtain the constraints on the transverse and radial distance parameters, DA (z)/rd and H(z)rd, as listed in Table 6. The measurement precisions are within 2.3% 3.5% for DA (z)/rd and 3.9% 8.1% for H(z)rd before the reconstruction. Using the reconstructed catalogues, the precisions are improved, which can reach 1.3% 2.2% for DA (z)/rd and 2.1% 6.% for H(z)rd. c RAS, MNRAS, 1 14 T o m o g ra p h ic R o s s e t a l ξ( s ) C o m p re sse d p re -re c o n.9 5 α pre-reconstruction : zeff α re d s h ift z Figure 12. The fitting results on the isotropic BAO parameter, α using the pre- and post-reconstruction catalogues, respectively. We determine the correlations between overlapping redshift slices using the measurements from mock catalogue. The calculation procedure has described in Section 6.1. The normalised correlated matrix of the parameters, α and αk, between different redshift slices for the post-reconstruction are plotted in Figure Result comparisons We compare our pre-reconstructed results on the isotropic and anisotropic BAO parameters with the tomographic measurements using the power spectrum in Fourier space (Zhao et al. 216). The comparison is plotted in Figure 17. We can see that the isotropic results (blue points) agree well with each other. Because of the high correlations between anisotropic parameters, the comparison looks scattered, especially for the parameter αk. Within the 1 σ error, the results are consistent. The main difference is that Zhao et al.
10 1 Wang et al. Table 5. The fitting results on the anisotropic BAO parameters, α and α, and their correlation coeffecient r using the pre- and post-reconstruction catalogues, respectively. pre-reconstruction post-reconstruction z eff α α r χ 2 /dof α α r χ 2 /dof ± ± / ± ± / ± ± / ± ± / ± ± / ± ± / ± ± / ± ± / ± ± /3 1.2 ± ± / ± ± / ± ± / ± ± / ± ± / ± ± / ± ± / ± ± / ± ± / Figure 13. The normalized correlation of the parameters, α, between different redshift slices. (216) use the monopole, quadrupole and hexadecapole in power spectrum, while we do not include the hexadecapole in our prereconstruction case. The role of the hexadecapole on anisotropic BAO constraints is discussed in detail (Zhao et al. 216). In order to test the consistency between our measurements and the measurements in 3 redshift bins (Ross et al. 216), we compressed our measurements into 3 redshift bins. Namely, we compressed the first 4 redshift bins, which covers the redshift range from.2 to.51, into one measurement. The compression is performed by introducing a parameter and fitting it to the measurements in these 4 redshift bins with their covariance matrix. The 5th and 6th bins (.4 < z <.59) are compressed as the second measurement value. The last compressed measurement are from the remaining bins (.48 < z <.75). The compression results are shown in red triangles of Figure 12, 14 and 15. In these figures, the green points denote the results within 3 redshift bins from ξ(s) measurements in Ross et al. (216), i.e. two bins without overlapping between each other, [.2,.5] and [.5,.75], and an overlapping bin, [.4,.6]. It is seen that with less redshift bins, more precise measurements and much tighter constraints can be obtained. In contrast, dividing more redshift bins in the tomographic case can capture the redshift information of galaxy clustering with more measurements at different effective redshifts. The comparison is plotted in Figure 18. We can see that our results are consistent with the measurements in Ross et al. (216) Table 6. The fitting results on the anisotropic BAO parameters, D A /r d and Hr d using the pre- and post-reconstruction catalogues, respectively. pre-reconstruction: z eff D A /r d Hr d 1 3 [km/s] ± ± ± ± ± ± ± ± ± ± ± ± ± ± ± ± ± ±.65 post-reconstruction: z eff D A /r d Hr d 1 3 [km/s] ± ± ± ± ± ± ± ± ± ± ± ± ± ± ± ± ± ±.44 The comparisons of our anisotropic BAO measurements with the three bins consensus measurements in Alam et al. (216) are shown in Figure 19 and 2, where the black squares are our measurements, and the red points are the consensus result, which are the combined constraints from the correlation function and power spectrum in (Alam et al. 216). The blue bands correspond to the 68 and 95% CL constraints in the ΛCDM using the Planck data assuming a ΛCDM model (Planck Collaboration et al. 216). We can see these results are consistent. 7 CONSTRAINTS ON COSMOLOGICAL MODELS Using our tomographic measurements on Hubble parameters, we do the Om diagnostic, proposed by Sahni et al. (28). It is defined by the Hubble parameter Om(z) [H(z)/H]2 1 (1 + z) 3 1. (31) c RAS, MNRAS, 1 14
11 Tomographic BAO analysis of BOSS DR12 sample 11 α p re -re c o n T o m o g ra p h ic R o s s e t a l ξ(s ) C o m p re s s e d 1.1 α α α p o s t-re c o n α P 1. α re d s h ift z Figure 14. The fitting results on the anisotropic BAO parameter, α using the pre- and post-reconstruction catalogues, respectively α ξ Figure 17. The comparison of our result on isotropic and anisotropic BAO parameters from the pre-reconstructed data with that in Zhao et al. (216), measured in Fourier space. α α p re -re c o n p o s t-re c o n T o m o g ra p h ic R o s s e t a l ξ(s ) C o m p re s s e d re d s h ift z Figure 15. The fitting results on the anisotropic BAO parameter, α using the pre- and post-reconstruction catalogues, respectively. α ξ (R o s s e t a l) α α α α ξ (W a n g e t a l) Figure 18. The comparison of our result on isotropic and anisotropic BAO parameters from the post-reconstructed data in the compressed 3 redshift bins with that in Ross et al. (216), also measured in configuration space Figure 16. The normalised correlation of the parameters, α and α, between different redshift slices (D M r fid )/r d d [M p c ] P la n c k L C D M T o m o g ra p h ic D R 1 2 C o n s e n s u s re d s h ift z Figure 19. Our tomographic measurements on D M rd fid/r d (black squares) in terms of redshift, compared with the consensus result (red points) in Alam et al. (216) and the prediction from Planck assuming a ΛCDM model (blue bands). Here D M = (1 + z)d A. c RAS, MNRAS, 1 14
12 12 Wang et al. H r d /r fid [k m /s M p c -1 ] d P la n c k L C D M T o m o g ra p h ic D R 1 2 C o n s e n s u s re d s h ift z Figure 2. Our tomographic measurements on H(z)r d /rd fid (black squares) in terms of redshift, compared with the consensus result (red points) in Alam et al. (216) and the prediction from Planck assuming a ΛCDM model (blue bands). In ΛCDM, Om(z) = Ω m. Using our measurements of H(z)r d and combining the fiducial values of r d = Mpc and H = 67.8 km/s/mpc, we convert our measurements to Om(z), as shown in Figure 21, where the blue squares are the prereconstruction tomographic measurements, the red points are the post-reconstruction tomographic measurements, and the black triangles are the consensus result in Alam et al. (216). To quantify the possible deviation from ΛCDM, we make a fit to the Om(z) values with the covariance matrix between different redshift slices using a single parameter. As shown in Figure 21, the black dashed line with the grey band are the best-fit value with 1 σ error using the 3 zbin" consensus result, the blue dashed line with the blue band are the 9 zbin" pre-reconstruction tomographic result and the red dashed line with the red band are the 9 zbin" post-reconstruction tomographic result. We obtain the fitting value, Ω m =.32 ±.25, with χ 2 = 1.73 from the consensus result. Therefore, within 2 σ regions there is no deviation from a constant Ω m(z). Using our pre-reconstruction tomographic result, the fitting result is Ω m =.266 ±.36. The Om(z) values in the pre-reconstruction case deviate from the fitting constant Ω m(z) at about 2.1 σ level. From our post-reconstruction result, the Om(z) values deviate from the fitting result, Ω m =.37±.21, at about 2.78 σ. We present the cosmological implications with our tomographic BAO measurements. We use the Cosmomc 2 (Lewis & Bridle 22) code to perform the fittings on dark energy parameters in a time-varying dark energy with EoS, w DE(a) = w + w a(1 a) (Chevallier & Polarski 21; Linder 23). We are using the combined data set, including the temperature and polarization power spectra from Planck 215 data release (Planck Collaboration et al. 216), the Joint Light-curve Aalysis" (JLA) sample of type Ia SNe (Sako et al. 214), the BOSS DR12 BAO distance measurements. We compare the constraining power of different BAO measurements, i.e. tomographic 9 zbin" BAO measurements from the post-reconstructed catalogues, consensus 3 zbin" measurements on BAO and RSD in Alam et al. (216), and the compressed 1 zbin" BAO result from the post-reconstruction tomographic measurements. 2 O m (z ).5 p re -re c o n p o s t-re c o n D R 1 2 c o n s e n s u s re d s h ift z Figure 21. The Om(z) values converted by our measurements on Hubble parameter in 9 redshift bins. Table 7. Joint data constraints on dark energy EoS parameters w and w a in the w w acdm. Here we compare the constraining power of the BOSS DR12 BAO measurements, i.e. the tomographic 9 zbin" measurements in this work, consensus 3 zbin" measurements in Alam et al. (216), and the compressed 1 zbin" result from tomographic measurements. Planck+JLA+BOSS w w a Tomographic (9 zbin).957 ± ±.358 DR12 Consensus (3 zbin).942 ± ±.359 Compressed (1 zbins).917 ± ±.414 The results of the parameters w and w a are presented in Table 7. We can see the uncertainties of parameters are improved with the 9 zbin" BAO measurements in our work. In w w acdm, comparing the tomographic 9 zbin" with the non-tomographic 1 zbin" results, the errors of w and w a are improved by 6% and 16%, respectively. Using the Figure of Merit (FoM) (Albrecht et al. 29), which is inversely proportional to the area of the contour as shown in Figure 22, to quantify this improvement, the FoM is improved by a factor of 1.24 (FoM=49 for the grey contour from the 1 zbin" result and FoM=61 for the blue contour from the 9 zbin" result in Figure 22). Comparing the 9 zbin" with 3 zbin" results, the 9 zbin" BAO measurement give the slightly tighter constraints. 8 CONCLUSION Measurements of the BAO distance scales have become a robust way to map the expansion history of the Universe. A precise BAO distance measurement at a single effective redshift can be achieved using the entire galaxies in the survey, covering a wide redshift range. However, the tomographic information is largely lost. To extract the redshift information from the samples, one possible way is to use overlapping redshift slices. Using the combined sample of BOSS DR12, we perform a tomographic baryon acoustic oscillations analysis using the twopoint galaxy correlation function. We split the whole redshift range of sample,.2 < z <.75, into multiple overlapping redshift slices, and measured correlation functions in all the bins. With the full covariance matrix calibrated using MultiDark-Patchy mock c RAS, MNRAS, 1 14
13 Tomographic BAO analysis of BOSS DR12 sample 13 wa w wa 1zbin 3zbin 9zbin Figure 22. The 1D posterior distribution of w and w a and their 2D contour plots in the CPL model from the compressed 1 zbin" BAO (grey line and contour), consensus 3 zbin" BAO and RSD (red line and contour), and tomographic 9 zbin" BAO (blue line and contour). ACKNOWLEDGEMENTS YW is supported by the NSFC grant No GBZ and YW are supported by National Astronomical Observatories, Chinese Academy of Sciences, and by University of Portsmouth. Funding for SDSS-III has been provided by the Alfred P. Sloan Foundation, the Participating Institutions, the National Science Foundation, and the US Department of Energy Office of Science. The SDSS-III web site is SDSS-III is managed by the Astrophysical Research Consortium for the Participating Institutions of the SDSS-III Collaboration including the University of Arizona, the Brazilian Participation Group, Brookhaven National Laboratory, Carnegie Mellon University, University of Florida, the French Participation Group, the German Participation Group, Harvard University, the Instituto de Astrofisica de Canarias, the Michigan State/Notre Dame/JINA Participation Group, Johns Hopkins University, Lawrence Berkeley National Laboratory, Max Planck Institute for Astrophysics, Max Planck Institute for Extraterrestrial Physics, New Mexico State University, New York University, Ohio State University, Pennsylvania State University, University of Portsmouth, Princeton University, the Spanish Participation Group, University of Tokyo, University of Utah, Vanderbilt University, University of Virginia, University of Washington, and Yale University. This research used resources of the National Energy Research Scientific Computing Center, which is supported by the Office of Science of the U.S. Department of Energy under Contract No. DE- AC2-5CH11231, the SCIAMA cluster supported by University of Portsmouth, and the ZEN cluster supported by NAOC. catalogues, we obtained the isotropic and anisotropic BAO measurements. In the isotropic case, the measurement precision on D V (z)/r d from the pre-reconstruction catalogue can reach 1.8% 3.3%. For the post-reconstruction, the precision is improved, and becomes 1.1% 1.8%. In the anisotropic case, the measurement precision is within 2.3% 3.5% for D A(z)/r d and 3.9% 8.1% for H(z)r d before the reconstruction. Using the reconstructed catalogues, the precision is improved, which can reach 1.3% 2.2% for D A(z)/r d and 2.1% 6.% for H(z)r d. We present the comparison of our measurements with that in a companion paper (Zhao et al. 216), where the tomographic BAO is measured using multipole power spectrum in Fourier space. We find an agreement within the 1 σ confidence level. The derived 3- bin results from our tomographic measurements are also compared to the 3-bin measurements in Ross et al. (216), and a consistency is found. We perform cosmological constraints using the tomographic 9-bin BAO measurements, the consensus 3-bin BAO and RSD measurements, and the compressed 1-bin BAO measurement. Comparing the constraints on w w acdm from 9-bin and 1-bin BAO distance measurements, the uncertainties of the parameters, w and w a are improved by 6% and 16%, respectively. The dark energy FoM is improved by a factor of Comparing the 9 zbin" with 3 zbin" results, the 9 zbin" BAO measurement give the slightly tighter constraints. The future galaxy surveys will cover a larger and larger cosmic volume, and there is rich tomographic information in redshifts to be extracted. The method developed in this work can be easily applied to the upcoming galaxy surveys and the gain in the temporal information is expected to be more significant. REFERENCES Alam S. et al., 215, ApJS, 219, 12 Alam S. et al., 216, ArXiv e-prints: Albrecht A. et al., 29, ArXiv e-prints: Anderson L. et al., 214, MNRAS, 441, 24 Beutler F. et al., 211, MNRAS, 416, 317 Beutler F. et al., 216a, ArXiv e-prints: Beutler F. et al., 216b, ArXiv e-prints: Blake C. et al., 211, MNRAS, 418, 177 Chevallier M., Polarski D., 21, International Journal of Modern Physics D, 1, 213 Chuang C.-H. et al., 216, ArXiv e-prints: Chuang C.-H., Wang Y., 212, MNRAS, 426, 226 Chuang C.-H., Wang Y., 213, MNRAS, 431, 2634 Cuesta A. J. et al., 216, MNRAS, 457, 177 Dawson K. S. et al., 213, AJ, 145, 1 Eisenstein D. J., Hu W., 1998, ApJ, 496, 65 Eisenstein D. J., Seo H.-J., White M., 27a, ApJ, 664, 66 Eisenstein D. J., Seo H.-J., White M., 27b, ApJ, 664, 66 Eisenstein D. J. et al., 211, AJ, 142, 72 Eisenstein D. J. et al., 25, ApJ, 633, 56 Feldman H. A., Kaiser N., Peacock J. A., 1994, ApJ, 426, 23 Gil-Marín H. et al., 216, MNRAS, 46, 421 Grieb J. N. et al., 216, ArXiv e-prints: Kaiser N., 1987, MNRAS, 227, 1 Kazin E. A. et al., 21, ApJ, 71, 1444 Kazin E. A., Sánchez A. G., Blanton M. R., 212, MNRAS, 419, 3223 Kazin E. A. et al., 213, MNRAS, 435, 64 Kitaura F.-S. et al., 216, MNRAS, 456, 4156 c RAS, MNRAS, 1 14
BAO & RSD. Nikhil Padmanabhan Essential Cosmology for the Next Generation VII December 2017
 BAO & RSD Nikhil Padmanabhan Essential Cosmology for the Next Generation VII December 2017 Overview Introduction Standard rulers, a spherical collapse picture of BAO, the Kaiser formula, measuring distance
BAO analysis from the DR14 QSO sample
 BAO analysis from the DR14 QSO sample Héctor Gil-Marín (on behalf of the eboss QC WG) Laboratoire de Physique Nucleaire et de Hautes Energies (LPNHE) Institut Lagrange de Paris (ILP) Understanding Cosmological
BAO from the DR14 QSO sample
 BAO analysis from the DR14 QSO sample Héctor Gil-Marín (on behalf of the eboss QC WG) Laboratoire de Physique Nucleaire et de Hautes Energies (LPNHE) Institut Lagrange de Paris (ILP) COSMO17 @ Paris 28th
arxiv: v2 [astro-ph.co] 14 Oct 2016
![arxiv: v2 [astro-ph.co] 14 Oct 2016](/thumbs/72/67481804.jpg "arxiv: v2 [astro-ph.co] 14 Oct 2016") Preprint 17 October 2016 Compiled using MNRAS LATEX style file v3.0 The clustering of galaxies in the completed SDSS-III Baryon Oscillation Spectroscopic Survey: Observational systematics and baryon acoustic
Preprint 17 October 2016 Compiled using MNRAS LATEX style file v3.0 The clustering of galaxies in the completed SDSS-III Baryon Oscillation Spectroscopic Survey: Observational systematics and baryon acoustic
Results from the Baryon Oscillation Spectroscopic Survey (BOSS)
") Results from the Baryon Oscillation Spectroscopic Survey (BOSS) Beth Reid for SDSS-III/BOSS collaboration Hubble Fellow Lawrence Berkeley National Lab Outline No Ly-α forest here, but very exciting!! (Slosar
Results from the Baryon Oscillation Spectroscopic Survey (BOSS) Beth Reid for SDSS-III/BOSS collaboration Hubble Fellow Lawrence Berkeley National Lab Outline No Ly-α forest here, but very exciting!! (Slosar
An accurate determination of the Hubble constant from baryon acoustic oscillation datasets
 . Article. SCIENCE CHINA Physics, Mechanics & Astronomy September 2015 Vol. 58 No. 9: 599801 doi: 10.1007/s11433-015-5684-5 An accurate determination of the Hubble constant from baryon acoustic oscillation
Baryon Acoustic Oscillations (BAO) in the Sloan Digital Sky Survey Data Release 7 Galaxy Sample
 in the Sloan Digital Sky Survey Data Release 7 Galaxy Sample") Baryon Acoustic Oscillations (BAO) in the Sloan Digital Sky Survey Data Release 7 Galaxy Sample BOMEE LEE 1. Brief Introduction about BAO In our previous class we learned what is the Baryon Acoustic Oscillations(BAO).
Baryon Acoustic Oscillations (BAO) in the Sloan Digital Sky Survey Data Release 7 Galaxy Sample BOMEE LEE 1. Brief Introduction about BAO In our previous class we learned what is the Baryon Acoustic Oscillations(BAO).
Measuring the Cosmic Distance Scale with SDSS-III
 Measuring the Cosmic Distance Scale with SDSS-III Daniel Eisenstein (Harvard University) Motivation & Outline Dark Energy pushes us to measure the cosmic distance scale and the behavior of gravity to high
Baryon Acoustic Oscillations and Beyond: Galaxy Clustering as Dark Energy Probe
 Baryon Acoustic Oscillations and Beyond: Galaxy Clustering as Dark Energy Probe Yun Wang Univ. of Oklahoma II Jayme Tiomno School of Cosmology August 6-10, 2012 Plan of the Lectures Lecture I: Overview
arxiv: v1 [astro-ph.co] 19 Mar 2013
![arxiv: v1 [astro-ph.co] 19 Mar 2013](/thumbs/80/81999822.jpg "arxiv: v1 [astro-ph.co] 19 Mar 2013") Mon. Not. R. Astron. Soc., () Printed 2 March 213 (MN LATEX style file v2.2) The clustering of galaxies in the SDSS-III Baryon Oscillation Spectroscopic Survey: Measuring D A and H at z =.57 from the Baryon
Mon. Not. R. Astron. Soc., () Printed 2 March 213 (MN LATEX style file v2.2) The clustering of galaxies in the SDSS-III Baryon Oscillation Spectroscopic Survey: Measuring D A and H at z =.57 from the Baryon
Determining the Membership of Globular Cluster, M2 with APOGEE Data
 Determining the Membership of Globular Cluster, M2 with APOGEE Data VA-NC Alliance Summer Research Program The Leadership Alliance National Symposium July 29 th, 2017 BY: ZANIYAH DOCK What s the point?
arxiv: v1 [astro-ph.co] 8 Jan 2019
![arxiv: v1 [astro-ph.co] 8 Jan 2019](/thumbs/93/113153870.jpg "arxiv: v1 [astro-ph.co] 8 Jan 2019") Can the homogeneity scale be used as a standard ruler? IFT-UAM/CSIC-19-6 Savvas Nesseris and Manuel Trashorras Instituto de Física Teórica UAM-CSIC, Universidad Autonóma de Madrid, Cantoblanco, 2849 Madrid,
Can the homogeneity scale be used as a standard ruler? IFT-UAM/CSIC-19-6 Savvas Nesseris and Manuel Trashorras Instituto de Física Teórica UAM-CSIC, Universidad Autonóma de Madrid, Cantoblanco, 2849 Madrid,
Baryon acoustic oscillations A standard ruler method to constrain dark energy
 Baryon acoustic oscillations A standard ruler method to constrain dark energy Martin White University of California, Berkeley Lawrence Berkeley National Laboratory... with thanks to Nikhil Padmanabhan
Is there a hope of discovering new physics in the Euclid era? Francisco Prada Instituto de Física Teórica UAM-CSIC, Madrid IAA-CSIC, Granada
 Is there a hope of discovering new physics in the Euclid era? Francisco Prada Instituto de Física Teórica UAM-CSIC, Madrid IAA-CSIC, Granada ESAC,&October&15 th,&2015 Our$view$of$the$distant$Universe:$
arxiv: v2 [astro-ph.co] 28 Sep 2015 Submitted to MNRAS
![arxiv: v2 [astro-ph.co] 28 Sep 2015 Submitted to MNRAS](/thumbs/91/104768721.jpg "arxiv: v2 [astro-ph.co] 28 Sep 2015 Submitted to MNRAS") Mon. Not. R. Astron. Soc. 000, 000 000 (0000) Printed 20 August 2018 (MN LATEX style file v2.2) Improving the precision matrix for precision cosmology Dante J. Paz 1,2 and Ariel G. Sánchez 3 1 Instituto
Mon. Not. R. Astron. Soc. 000, 000 000 (0000) Printed 20 August 2018 (MN LATEX style file v2.2) Improving the precision matrix for precision cosmology Dante J. Paz 1,2 and Ariel G. Sánchez 3 1 Instituto
Testing General Relativity with Redshift Surveys
 Testing General Relativity with Redshift Surveys Martin White University of California, Berkeley Lawrence Berkeley National Laboratory Information from galaxy z-surveys Non-Gaussianity? BOSS Redshi' Survey
Anisotropic Clustering Measurements using Fourier Space Wedges
 Anisotropic Clustering Measurements using Fourier Space Wedges and the status of the BOSS DR12 analysis Jan Niklas Grieb Max-Planck-Institut für extraterrestrische Physik, Garching bei München Universitäts-Sternwarte
Francisco Prada Campus de Excelencia Internacional UAM+CSIC Instituto de Física Teórica (UAM/CSIC) Instituto de Astrofísica de Andalucía (CSIC)
 Instituto de Astrofísica de Andalucía (CSIC)") Francisco Prada Campus de Excelencia Internacional UAM+CSIC Instituto de Física Teórica (UAM/CSIC) Instituto de Astrofísica de Andalucía (CSIC) Fuerteventura, June 6 th, 2014 The Mystery of Dark Energy
Francisco Prada Campus de Excelencia Internacional UAM+CSIC Instituto de Física Teórica (UAM/CSIC) Instituto de Astrofísica de Andalucía (CSIC) Fuerteventura, June 6 th, 2014 The Mystery of Dark Energy
Baryon Acoustic Oscillations Part I
 Baryon Acoustic Oscillations Part I Yun Wang (on behalf of the Euclid collaboration) ESTEC, November 17, 2009 Outline Introduction: BAO and galaxy clustering BAO as a standard ruler BAO as a robust dark
arxiv: v1 [astro-ph.co] 11 Jul 2016
![arxiv: v1 [astro-ph.co] 11 Jul 2016](/thumbs/93/111499036.jpg "arxiv: v1 [astro-ph.co] 11 Jul 2016") Mon. Not. R. Astron. Soc., 5 (3) Printed 3 July 6 (MN LaT E X style file v.) The clustering of galaxies in the completed SDSS-III Baryon Oscillation Spectroscopic Survey: Baryon Acoustic Oscillations in
Mon. Not. R. Astron. Soc., 5 (3) Printed 3 July 6 (MN LaT E X style file v.) The clustering of galaxies in the completed SDSS-III Baryon Oscillation Spectroscopic Survey: Baryon Acoustic Oscillations in
The Power. of the Galaxy Power Spectrum. Eric Linder 13 February 2012 WFIRST Meeting, Pasadena
 The Power of the Galaxy Power Spectrum Eric Linder 13 February 2012 WFIRST Meeting, Pasadena UC Berkeley & Berkeley Lab Institute for the Early Universe, Korea 11 Baryon Acoustic Oscillations In the beginning...
arxiv: v1 [astro-ph.co] 3 Apr 2019
![arxiv: v1 [astro-ph.co] 3 Apr 2019](/thumbs/95/124870951.jpg "arxiv: v1 [astro-ph.co] 3 Apr 2019") Forecasting Cosmological Bias due to Local Gravitational Redshift Haoting Xu, Zhiqi Huang, Na Zhang, and Yundong Jiang School of Physics and Astronomy, Sun Yat-sen University, 2 Daxue Road, Tangjia, Zhuhai,
Forecasting Cosmological Bias due to Local Gravitational Redshift Haoting Xu, Zhiqi Huang, Na Zhang, and Yundong Jiang School of Physics and Astronomy, Sun Yat-sen University, 2 Daxue Road, Tangjia, Zhuhai,
Measuring Baryon Acoustic Oscillations with Angular Two-Point Correlation Function
 Measuring Baryon Acoustic Oscillations with Angular Two-Point Correlation Function Jailson S. Alcaniz, Gabriela C. Carvalho, Armando Bernui, Joel C. Carvalho and Micol Benetti Abstract The Baryon Acoustic
arxiv: v2 [astro-ph.co] 27 May 2016
![arxiv: v2 [astro-ph.co] 27 May 2016](/thumbs/76/74247897.jpg "arxiv: v2 [astro-ph.co] 27 May 2016") Mon. Not. R. Astron. Soc., () Printed 3 May 26 (MN LATEX style file v2.2) The clustering of galaxies in the SDSS-III Baryon Oscillation Spectroscopic Survey: RSD measurement from the LOS-dependent power
Mon. Not. R. Astron. Soc., () Printed 3 May 26 (MN LATEX style file v2.2) The clustering of galaxies in the SDSS-III Baryon Oscillation Spectroscopic Survey: RSD measurement from the LOS-dependent power
Cosmology with high (z>1) redshift galaxy surveys
 redshift galaxy surveys") Cosmology with high (z>1) redshift galaxy surveys Donghui Jeong Texas Cosmology Center and Astronomy Department University of Texas at Austin Ph. D. thesis defense talk, 17 May 2010 Cosmology with HETDEX
Cosmology with high (z>1) redshift galaxy surveys Donghui Jeong Texas Cosmology Center and Astronomy Department University of Texas at Austin Ph. D. thesis defense talk, 17 May 2010 Cosmology with HETDEX
arxiv: v2 [astro-ph.co] 12 May 2016
![arxiv: v2 [astro-ph.co] 12 May 2016](/thumbs/80/81021660.jpg "arxiv: v2 [astro-ph.co] 12 May 2016") Mon. Not. R. Astron. Soc. 000, 000 000 (0000) Printed 13 May 2016 (MN LATEX style file v2.2) Modeling the reconstructed BAO in Fourier space arxiv:1511.00663v2 [astro-ph.co] 12 May 2016 Hee-Jong Seo 1,
Mon. Not. R. Astron. Soc. 000, 000 000 (0000) Printed 13 May 2016 (MN LATEX style file v2.2) Modeling the reconstructed BAO in Fourier space arxiv:1511.00663v2 [astro-ph.co] 12 May 2016 Hee-Jong Seo 1,
arxiv: v1 [astro-ph.co] 11 Sep 2013
![arxiv: v1 [astro-ph.co] 11 Sep 2013](/thumbs/88/116992309.jpg "arxiv: v1 [astro-ph.co] 11 Sep 2013") To be submitted to the Astrophysical Journal Preprint typeset using L A TEX style emulateapj v. 5/2/11 COSMOLOGICAL DEPENDENCE OF THE MEASUREMENTS OF LUMINOSITY FUNCTION, PROJECTED CLUSTERING AND GALAXY-GALAXY
To be submitted to the Astrophysical Journal Preprint typeset using L A TEX style emulateapj v. 5/2/11 COSMOLOGICAL DEPENDENCE OF THE MEASUREMENTS OF LUMINOSITY FUNCTION, PROJECTED CLUSTERING AND GALAXY-GALAXY
arxiv: v1 [astro-ph.co] 18 Jul 2016
![arxiv: v1 [astro-ph.co] 18 Jul 2016](/thumbs/75/71652039.jpg "arxiv: v1 [astro-ph.co] 18 Jul 2016") Mon. Not. R. Astron. Soc. 000, 000 000 (0000) Printed 20 July 2016 (MN LATEX style file v2.2) arxiv:1607.05297v1 [astro-ph.co] 18 Jul 2016 The length of the low-redshift standard ruler Licia Verde 1,2,3,4,5,
Mon. Not. R. Astron. Soc. 000, 000 000 (0000) Printed 20 July 2016 (MN LATEX style file v2.2) arxiv:1607.05297v1 [astro-ph.co] 18 Jul 2016 The length of the low-redshift standard ruler Licia Verde 1,2,3,4,5,
BAO and Lyman-α with BOSS
 BAO and Lyman-α with BOSS Nathalie Palanque-Delabrouille (CEA-Saclay) BAO and Ly-α The SDSS-III/BOSS experiment Current results with BOSS - 3D BAO analysis with QSOs - 1D Ly-α power spectra and ν mass
Large-scale structure as a probe of dark energy. David Parkinson University of Sussex, UK
 Large-scale structure as a probe of dark energy David Parkinson University of Sussex, UK Question Who was the greatest actor to portray James Bond in the 007 movies? a) Sean Connery b) George Lasenby c)
Cosmological Constraints from Redshift Dependence of Galaxy Clustering Anisotropy
 Cosmological Constraints from Redshift Dependence of Galaxy Clustering Anisotropy Changbom Park (Korea Institute for Advanced Study) with Xiao-Dong Li, Juhan Kim (KIAS), Sungwook Hong, Cris Sabiu, Hyunbae
Recent BAO observations and plans for the future. David Parkinson University of Sussex, UK
 Recent BAO observations and plans for the future David Parkinson University of Sussex, UK Baryon Acoustic Oscillations SDSS GALAXIES CMB Comparing BAO with the CMB CREDIT: WMAP & SDSS websites FLAT GEOMETRY
THE PAU (BAO) SURVEY. 1 Introduction
 SURVEY. 1 Introduction") THE PAU (BAO) SURVEY E. Fernández Department of Physics, Universitat Autònoma de Barcelona/IFAE, Campus UAB, Edif. Cn, 08193 Bellaterra, Barcelona, Spain In this talk we present a proposal for a new galaxy
THE PAU (BAO) SURVEY E. Fernández Department of Physics, Universitat Autònoma de Barcelona/IFAE, Campus UAB, Edif. Cn, 08193 Bellaterra, Barcelona, Spain In this talk we present a proposal for a new galaxy
arxiv: v1 [astro-ph.co] 11 Jul 2016
![arxiv: v1 [astro-ph.co] 11 Jul 2016](/thumbs/79/79903833.jpg "arxiv: v1 [astro-ph.co] 11 Jul 2016") Mon. Not. R. Astron. Soc. 000, 1 38 (2016) Printed 13 July 2016 (MN LATEX style file v2.2) The clustering of galaxies in the completed SDSS-III Baryon Oscillation Spectroscopic Survey: cosmological analysis
Mon. Not. R. Astron. Soc. 000, 1 38 (2016) Printed 13 July 2016 (MN LATEX style file v2.2) The clustering of galaxies in the completed SDSS-III Baryon Oscillation Spectroscopic Survey: cosmological analysis
arxiv: v2 [astro-ph.co] 14 Aug 2015
![arxiv: v2 [astro-ph.co] 14 Aug 2015](/thumbs/88/115352747.jpg "arxiv: v2 [astro-ph.co] 14 Aug 2015") Mon. Not. R. Astron. Soc., () Printed 16 October 218 (MN LATEX style file v2.2) Measuring line-of-sight-dependent Fourier-space clustering using s Davide Bianchi, Héctor Gil-Marín, Rossana Ruggeri & Will
Mon. Not. R. Astron. Soc., () Printed 16 October 218 (MN LATEX style file v2.2) Measuring line-of-sight-dependent Fourier-space clustering using s Davide Bianchi, Héctor Gil-Marín, Rossana Ruggeri & Will
Beyond BAO: Redshift-Space Anisotropy in the WFIRST Galaxy Redshift Survey
 Beyond BAO: Redshift-Space Anisotropy in the WFIRST Galaxy Redshift Survey David Weinberg, Ohio State University Dept. of Astronomy and CCAPP Based partly on Observational Probes of Cosmic Acceleration
Mapping the Universe spectroscopic surveys for BAO measurements Meeting on fundamental cosmology, june 2016, Barcelona, Spain Johan Comparat
 Mapping the Universe spectroscopic surveys for BAO measurements Meeting on fundamental cosmology, june 2016, Barcelona, Spain Johan Comparat 1 Baryonic acoustic oscillations The acoustic length scale is
arxiv: v3 [astro-ph.co] 20 Nov 2017
![arxiv: v3 [astro-ph.co] 20 Nov 2017](/thumbs/95/122831320.jpg "arxiv: v3 [astro-ph.co] 20 Nov 2017") DES 2017-0232 FERMILAB-PUB-17-162-A-AE Preprint 22 November 2017 Compiled using MNRAS LATEX style file v3.0 arxiv:1705.05442v3 [astro-ph.co] 20 Nov 2017 Optimized Clustering Estimators for BAO Measurements
DES 2017-0232 FERMILAB-PUB-17-162-A-AE Preprint 22 November 2017 Compiled using MNRAS LATEX style file v3.0 arxiv:1705.05442v3 [astro-ph.co] 20 Nov 2017 Optimized Clustering Estimators for BAO Measurements
BARYON ACOUSTIC OSCILLATIONS. Cosmological Parameters and You
 BARYON ACOUSTIC OSCILLATIONS Cosmological Parameters and You OUTLINE OF TOPICS Definitions of Terms Big Picture (Cosmology) What is going on (History) An Acoustic Ruler(CMB) Measurements in Time and Space
Three ways to measure cosmic distances. Chris Blake, Swinburne
 Three ways to measure cosmic distances Chris Blake, Swinburne The WiggleZ Dark Energy Survey 1000 sq deg, 0.2 < z < 1.0 200,000 redshifts blue star-forming galaxies Aug 2006 - Jan 2011 Sky coverage Redshift
arxiv: v2 [astro-ph.co] 21 Feb 2015
![arxiv: v2 [astro-ph.co] 21 Feb 2015](/thumbs/96/127743300.jpg "arxiv: v2 [astro-ph.co] 21 Feb 2015") Mon. Not. R. Astron. Soc. 000, 000 000 (0000) Printed February 24, 2015 (MN LATEX style file v2.2) Modelling The Redshift-Space Three-Point Correlation Function in SDSS-III arxiv:1409.7389v2 [astro-ph.co]
Mon. Not. R. Astron. Soc. 000, 000 000 (0000) Printed February 24, 2015 (MN LATEX style file v2.2) Modelling The Redshift-Space Three-Point Correlation Function in SDSS-III arxiv:1409.7389v2 [astro-ph.co]
MEMBERSHIP ANALYSIS OF GLOBULAR CLUSTER M92 WITH APOGEE (APACHE POINT OBSERVATORY GALACTIC EVOLUTION EXPERIMENT) DATA
 DATA") MEMBERSHIP ANALYSIS OF GLOBULAR CLUSTER M92 WITH APOGEE (APACHE POINT OBSERVATORY GALACTIC EVOLUTION EXPERIMENT) DATA TEMI OLATINWO-SPELMAN COLLEGE VA-NC ALLIANCE LEADERSHIP ALLIANCE NATIONAL SYMPOSIUM
MEMBERSHIP ANALYSIS OF GLOBULAR CLUSTER M92 WITH APOGEE (APACHE POINT OBSERVATORY GALACTIC EVOLUTION EXPERIMENT) DATA TEMI OLATINWO-SPELMAN COLLEGE VA-NC ALLIANCE LEADERSHIP ALLIANCE NATIONAL SYMPOSIUM
Measuring BAO using photometric redshift surveys.
 Measuring BAO using photometric redshift surveys. Aurelio Carnero Rosell. E. Sanchez Alvaro, Juan Garcia-Bellido, E. Gaztanaga, F. de Simoni, M. Crocce, A. Cabre, P. Fosalba, D. Alonso. 10-08-10 Punchline
LSST + BigBOSS. 3.5 deg. 3 deg
 LSST + BigBOSS 3.5 deg 3 deg Natalie Roe LSST Dark Energy Science Collaboration Workshop U. Penn, June 12, 2012 Outline BigBOSS Overview BigBOSS-N Science Goals BigBOSS-S + LSST Summary 3.5 deg 3 deg Natalie
Dark Energy in Light of the CMB. (or why H 0 is the Dark Energy) Wayne Hu. February 2006, NRAO, VA
 Wayne Hu. February 2006, NRAO, VA") Dark Energy in Light of the CMB (or why H 0 is the Dark Energy) Wayne Hu February 2006, NRAO, VA If its not dark, it doesn't matter! Cosmic matter-energy budget: Dark Energy Dark Matter Dark Baryons Visible
Dark Energy in Light of the CMB (or why H 0 is the Dark Energy) Wayne Hu February 2006, NRAO, VA If its not dark, it doesn't matter! Cosmic matter-energy budget: Dark Energy Dark Matter Dark Baryons Visible
Resolved Star Formation Surface Density and Stellar Mass Density of Galaxies in the Local Universe. Abstract
 Resolved Star Formation Surface Density and Stellar Mass Density of Galaxies in the Local Universe Abdurrouf Astronomical Institute of Tohoku University Abstract In order to understand how the stellar
Measuring Neutrino Masses and Dark Energy
 Huitzu Tu UC Irvine June 7, 2007 Dark Side of the Universe, Minnesota, June 5-10 2007 In collaboration with: Steen Hannestad, Yvonne Wong, Julien Lesgourgues, Laurence Perotto, Ariel Goobar, Edvard Mörtsell
Galaxy Kinematics and Cosmology from Accurately Modeling the Redshift-Space Galaxy Clustering. Zheng Zheng( 郑政 ) University of Utah
 University of Utah") Galaxy Kinematics and Cosmology from Accurately Modeling the Redshift-Space Galaxy Clustering Zheng Zheng( 郑政 ) University of Utah National Astronomical Observatories, CAS July 12, 2017 Ben Bromley Professor
Galaxy Kinematics and Cosmology from Accurately Modeling the Redshift-Space Galaxy Clustering Zheng Zheng( 郑政 ) University of Utah National Astronomical Observatories, CAS July 12, 2017 Ben Bromley Professor
Cosmology on small scales: Emulating galaxy clustering and galaxy-galaxy lensing into the deeply nonlinear regime
 Cosmology on small scales: Emulating galaxy clustering and galaxy-galaxy lensing into the deeply nonlinear regime Ben Wibking Department of Astronomy Ohio State University with Andres Salcedo, David Weinberg,
Precise measurement of the radial BAO scale in galaxy redshift surveys
 Precise measurement of the radial BAO scale in galaxy redshift surveys David Alonso (Universidad Autónoma de Madrid - IFT) Based on the work arxiv:1210.6446 In collaboration with: E. Sánchez, F. J. Sánchez,
The State of Tension Between the CMB and LSS
 The State of Tension Between the CMB and LSS Tom Charnock 1 in collaboration with Adam Moss 1 and Richard Battye 2 Phys.Rev. D91 (2015) 10, 103508 1 Particle Theory Group University of Nottingham 2 Jodrell
Relativistic effects in large-scale structure
 Relativistic effects in large-scale structure Camille Bonvin University of Geneva, Switzerland COSMO August 2017 Galaxy survey The distribution of galaxies is sensitive to: Credit: M. Blanton, SDSS the
From quasars to dark energy Adventures with the clustering of luminous red galaxies
 From quasars to dark energy Adventures with the clustering of luminous red galaxies Nikhil Padmanabhan 1 1 Lawrence Berkeley Labs 04-15-2008 / OSU CCAPP seminar N. Padmanabhan (LBL) Cosmology with LRGs
Theoretical developments for BAO Surveys. Takahiko Matsubara Nagoya Univ.
 Theoretical developments for BAO Surveys Takahiko Matsubara Nagoya Univ. Baryon Acoustic Oscillations Photons and baryons are strongly coupled by Thomson & Coulomb scattering before photon decoupling (z
Large Scale Structure I
 Large Scale Structure I Shirley Ho Lawrence Berkeley National Laboratory/ UC Berkeley/ Carnegie Mellon University With lots of materials borrowed from Martin White (Berkeley) 3 ime Motivations z~0 z~6
ISSN Communication. Isolated Galaxies versus Interacting Pairs with MaNGA
 Galaxies 2015, xx, 1-x; doi:10.3390/ OPEN ACCESS galaxies ISSN 2075-4434 www.mdpi.com/journal/galaxies Communication Isolated Galaxies versus Interacting Pairs with MaNGA María del Carmen Argudo Fernández
The WiggleZ Dark Energy Survey: testing the cosmological model with baryon acoustic oscillations at z = 0.6
 Mon. Not. R. Astron. Soc. 000, 000 000 (0000) Printed 14 May 2011 (MN LATEX style file v2.2) The WiggleZ Dark Energy Survey: testing the cosmological model with baryon acoustic oscillations at z = 0.6
Science with large imaging surveys
 Science with large imaging surveys Hiranya V. Peiris University College London Science from LSS surveys: A case study of SDSS quasars Boris Leistedt (UCL) with Daniel Mortlock (Imperial) Aurelien Benoit-Levy
MaNGA: Mapping Nearby Galaxies at Apache Point Observatory
 MaNGA: Mapping Nearby Galaxies at Apache Point Observatory Anne-Marie Weijmans 1 on behalf of the MaNGA team 1 School of Physics and Astronomy, University of St Andrews, North Haugh, St Andrews, KY16 9SS,
Énergie noire Formation des structures. N. Regnault C. Yèche
 Énergie noire Formation des structures N. Regnault C. Yèche Outline Overview of DE probes (and recent highlights) Hubble Diagram of supernovae Baryon accoustic oscillations Lensing Matter clustering (JLA)
Testing gravity on Large Scales
 EPJ Web of Conferences 58, 02013 (2013) DOI: 10.1051/ epjconf/ 20135802013 C Owned by the authors, published by EDP Sciences, 2013 Testing gravity on Large Scales Alvise Raccanelli 1,2,a 1 Jet Propulsion
BAO & RSD. Nikhil Padmanabhan Essential Cosmology for the Next Generation December, 2017
 BAO & RSD Nikhil Padmanabhan Essential Cosmology for the Next Generation December, 2017 BAO vs RSD BAO uses the position of a large-scale feature; RSD uses the shape of the power spectrum/correlation function
arxiv: v3 [astro-ph.co] 2 Nov 2009
![arxiv: v3 [astro-ph.co] 2 Nov 2009](/thumbs/73/68724348.jpg "arxiv: v3 [astro-ph.co] 2 Nov 2009") Mon. Not. R. Astron. Soc. 000, 000 000 (0000) Printed 2 November 2009 (MN LATEX style file v2.2) Baryon Acoustic Oscillations in the Sloan Digital Sky Survey Data Release 7 Galaxy Sample arxiv:0907.1660v3
Mon. Not. R. Astron. Soc. 000, 000 000 (0000) Printed 2 November 2009 (MN LATEX style file v2.2) Baryon Acoustic Oscillations in the Sloan Digital Sky Survey Data Release 7 Galaxy Sample arxiv:0907.1660v3
Cosmological Constraints from a Combined Analysis of Clustering & Galaxy-Galaxy Lensing in the SDSS. Frank van den Bosch.
 Cosmological Constraints from a Combined Analysis of Clustering & Galaxy-Galaxy Lensing in the SDSS In collaboration with: Marcello Cacciato (Leiden), Surhud More (IPMU), Houjun Mo (UMass), Xiaohu Yang
What do we really know about Dark Energy?
 What do we really know about Dark Energy? Ruth Durrer Département de Physique Théorique & Center of Astroparticle Physics (CAP) ESTEC, February 3, 2012 Ruth Durrer (Université de Genève ) Dark Energy ESTEC
The WiggleZ Dark Energy Survey: testing the cosmological model with baryon acoustic oscillations at z = 0.6
 Mon. Not. R. Astron. Soc. 415, 2892 2909 (2011) doi:10.1111/j.1365-2966.2011.19077.x The WiggleZ Dark Energy Survey: testing the cosmological model with baryon acoustic oscillations at z = 0.6 Chris Blake,
arxiv: v2 [astro-ph.co] 2 Aug 2013
![arxiv: v2 [astro-ph.co] 2 Aug 2013](/thumbs/74/69719305.jpg "arxiv: v2 [astro-ph.co] 2 Aug 2013") New Constraints on the Early Expansion History Alireza Hojjati 1, Eric V. Linder 1,2, Johan Samsing 3 1 Institute for the Early Universe WCU, Ewha Womans University, Seoul 120-750, Korea 2 Berkeley Center
New Constraints on the Early Expansion History Alireza Hojjati 1, Eric V. Linder 1,2, Johan Samsing 3 1 Institute for the Early Universe WCU, Ewha Womans University, Seoul 120-750, Korea 2 Berkeley Center
arxiv: v1 [astro-ph.co] 16 Jun 2011
![arxiv: v1 [astro-ph.co] 16 Jun 2011](/thumbs/81/82869023.jpg "arxiv: v1 [astro-ph.co] 16 Jun 2011") Mon. Not. R. Astron. Soc., () Printed June 11 (MN LATEX style file v.) The 6dF Galaxy Survey: Baryon Acoustic Oscillations and the Local Hubble Constant arxiv:116.3366v1 [astro-ph.co] 16 Jun 11 Florian
Mon. Not. R. Astron. Soc., () Printed June 11 (MN LATEX style file v.) The 6dF Galaxy Survey: Baryon Acoustic Oscillations and the Local Hubble Constant arxiv:116.3366v1 [astro-ph.co] 16 Jun 11 Florian
Dark Energy. Cluster counts, weak lensing & Supernovae Ia all in one survey. Survey (DES)
") Dark Energy Cluster counts, weak lensing & Supernovae Ia all in one survey Survey (DES) What is it? The DES Collaboration will build and use a wide field optical imager (DECam) to perform a wide area,
Dark Energy Cluster counts, weak lensing & Supernovae Ia all in one survey Survey (DES) What is it? The DES Collaboration will build and use a wide field optical imager (DECam) to perform a wide area,
arxiv: v2 [astro-ph.co] 28 Oct 2013
![arxiv: v2 [astro-ph.co] 28 Oct 2013](/thumbs/74/70285281.jpg "arxiv: v2 [astro-ph.co] 28 Oct 2013") Mon. Not. R. Astron. Soc. 000, 1 18 (2012) Printed 29 October 2013 (MN LATEX style file v2.2) The Clustering of Galaxies in the SDSS-III DR10 Baryon Oscillation Spectroscopic Survey: No Detectable Colour
Mon. Not. R. Astron. Soc. 000, 1 18 (2012) Printed 29 October 2013 (MN LATEX style file v2.2) The Clustering of Galaxies in the SDSS-III DR10 Baryon Oscillation Spectroscopic Survey: No Detectable Colour
Enhanced constraints from multi-tracer surveys
 Enhanced constraints from multi-tracer surveys or How to beat cosmic variance Raul Abramo Physics Institute, USP & LabCosmos @ USP & J-PAS / Pau-Brasil Collaboration J-PAS Galaxy surveys are evolving We
arxiv: v1 [astro-ph.co] 21 Jan 2019
![arxiv: v1 [astro-ph.co] 21 Jan 2019](/thumbs/88/116250039.jpg "arxiv: v1 [astro-ph.co] 21 Jan 2019") Extracting the BAO scale from BOSS DR1 dataset arxiv:191.v1 [astro-ph.co] 1 Jan 19 Eugenio Noda 1,, Marco Peloso,, Massimo Pietroni 1, 1 Dipartimento di Scienze Matematiche, Fisiche ed Informatiche dell
Extracting the BAO scale from BOSS DR1 dataset arxiv:191.v1 [astro-ph.co] 1 Jan 19 Eugenio Noda 1,, Marco Peloso,, Massimo Pietroni 1, 1 Dipartimento di Scienze Matematiche, Fisiche ed Informatiche dell
Introduction to CosmoMC
 Introduction to CosmoMC Part I: Motivation & Basic concepts Institut de Ciències del Cosmos - Universitat de Barcelona Dept. de Física Teórica y del Cosmos, Universidad de Granada, 1-3 Marzo 2016 What
2013: A Good Year for Cosmology A Brief History of Contemporary Cosmology
 2013: A Good Year for Cosmology A Brief History of Contemporary Cosmology Cristiano Sabiu School of Physics, KIAS The Universe on large scales seems to obey the proposed cosmological principle; it is homogeneous
Cosmology II: The thermal history of the Universe
 .. Cosmology II: The thermal history of the Universe Ruth Durrer Département de Physique Théorique et CAP Université de Genève Suisse August 6, 2014 Ruth Durrer (Université de Genève) Cosmology II August
arxiv: v2 [astro-ph.co] 5 Oct 2017
![arxiv: v2 [astro-ph.co] 5 Oct 2017](/thumbs/74/70433956.jpg "arxiv: v2 [astro-ph.co] 5 Oct 2017") Missing baryons in the cosmic web revealed by the Sunyaev-Zel dovich effect Anna de Graaff 1, Yan-Chuan Cai 1, Catherine Heymans 1 & John A. Peacock 1 1 Institute for Astronomy, University of Edinburgh,
Missing baryons in the cosmic web revealed by the Sunyaev-Zel dovich effect Anna de Graaff 1, Yan-Chuan Cai 1, Catherine Heymans 1 & John A. Peacock 1 1 Institute for Astronomy, University of Edinburgh,
Lyman-α Cosmology with BOSS Julián Bautista University of Utah. Rencontres du Vietnam Cosmology 2015
 Lyman-α Cosmology with BOSS Julián Bautista University of Utah Rencontres du Vietnam Cosmology 2015 Lyman-α Forest of a Quasar (by Andrew Pontzen) F ( obs )= Observed flux Unabsorbed flux ( obs) 2 Lyman-α
Vasiliki A. Mitsou. IFIC Valencia TAUP International Conference on Topics in Astroparticle and Underground Physics
 Vasiliki A. Mitsou IFIC Valencia TAUP 2009 International Conference on Topics in Astroparticle and Underground Physics Rome, Italy, 1-5 July 2009 Dark energy models CDM Super-horizon CDM (SHCDM) [Kolb,
The WiggleZ Dark Energy Survey: improved distance measurements to z = 1 with reconstruction of the baryonic acoustic feature
 doi:10.1093/mnras/stu778 The WiggleZ Dark Energy Survey: improved distance measurements to z = 1 with reconstruction of the baryonic acoustic feature Eyal A. Kazin, 1,2 Jun Koda, 1,2 Chris Blake, 1 Nikhil
Chapter 9. Cosmic Structures. 9.1 Quantifying structures Introduction
 Chapter 9 Cosmic Structures 9.1 Quantifying structures 9.1.1 Introduction We have seen before that there is a very specific prediction for the power spectrum of density fluctuations in the Universe, characterised
The WiggleZ Dark Energy Survey: joint measurements of the expansion and growth history at z < 1
 Mon. Not. R. Astron. Soc. 425, 405 414 (2012) doi:10.1111/j.1365-2966.2012.21473.x The WiggleZ Dark Energy Survey: joint measurements of the expansion and growth history at z < 1 Chris Blake, 1 Sarah Brough,
Figures of Merit for Dark Energy Measurements
 Figures of Merit for Dark Energy Measurements Dragan Huterer Department of Physics University of Michigan What next for Dark Energy? Theory Model Building Which flavor of DE? Experiment Systematics control
Precision Cosmology from Redshift-space galaxy Clustering
 27th June-1st July, 2011 WKYC2011@KIAS Precision Cosmology from Redshift-space galaxy Clustering ~ Progress of high-precision template for BAOs ~ Atsushi Taruya RESearch Center for the Early Universe (RESCEU),
arxiv:astro-ph/ v1 4 Jan 2007
 IMPROVED FORECASTS FOR THE BARYON ACOUSTIC OSCILLATIONS AND COSMOLOGICAL DISTANCE SCALE Hee-Jong Seo & Daniel J. Eisenstein Steward Observatory, University of Arizona, 933 North Cherry Avenue, Tucson,
Modified gravity as an alternative to dark energy. Lecture 3. Observational tests of MG models
 Modified gravity as an alternative to dark energy Lecture 3. Observational tests of MG models Observational tests Assume that we manage to construct a model How well can we test the model and distinguish
Physical Cosmology 18/5/2017
 Physical Cosmology 18/5/2017 Alessandro Melchiorri alessandro.melchiorri@roma1.infn.it slides can be found here: oberon.roma1.infn.it/alessandro/cosmo2017 Summary If we consider perturbations in a pressureless
Mapping the Dark Energy Equation of State
 **TITLE** ASP Conference Series, Vol. **VOLUME***, **YEAR OF PUBLICATION** **NAMES OF EDITORS** Mapping the Dark Energy Equation of State Eric V. Linder Berkeley Lab, 1 Cyclotron Road, M/S 50R5008, Berkeley,
arxiv: v1 [astro-ph.co] 8 Jul 2013
![arxiv: v1 [astro-ph.co] 8 Jul 2013](/thumbs/92/108318504.jpg "arxiv: v1 [astro-ph.co] 8 Jul 2013") Updated constraints from the PLANCK experiment on modified gravity Andrea Marchini 1 and Valentina Salvatelli 1 1 Physics Department and INFN, Università di Roma La Sapienza, Ple Aldo Moro 2, 00185, Rome,
Updated constraints from the PLANCK experiment on modified gravity Andrea Marchini 1 and Valentina Salvatelli 1 1 Physics Department and INFN, Università di Roma La Sapienza, Ple Aldo Moro 2, 00185, Rome,
Bayesian redshift-space distortions correction from galaxy redshift surveys
 MNRAS 457, L113 L117 (2016) doi:10.1093/mnrasl/slw009 Bayesian redshift-space distortions correction from galaxy redshift surveys Francisco-Shu Kitaura, 1 Metin Ata, 1 Raul E. Angulo, 2 Chia-Hsun Chuang,
arxiv: v2 [astro-ph.co] 13 Jul 2017
![arxiv: v2 [astro-ph.co] 13 Jul 2017](/thumbs/94/121645369.jpg "arxiv: v2 [astro-ph.co] 13 Jul 2017") Dynamical dark energy in light of the latest observations Gong-Bo Zhao 1,2, Marco Raveri 3,4, Levon Pogosian 5,2, Yuting Wang 1,2, Robert G. Crittenden 2, Will J. Handley 6,7, Will J. Percival 2, Florian
Dynamical dark energy in light of the latest observations Gong-Bo Zhao 1,2, Marco Raveri 3,4, Levon Pogosian 5,2, Yuting Wang 1,2, Robert G. Crittenden 2, Will J. Handley 6,7, Will J. Percival 2, Florian
Whitepaper: For a Comprehensive Space-Based Dark Energy Mission
 Whitepaper: For a Comprehensive Space-Based Dark Energy Mission Authors Gary M. Bernstein, University of Pennsylvania Robert N. Cahn, Lawrence Berkeley National Laboratory Wendy L. Freedman, Carnegie Institution
A FIGURE OF MERIT ANALYSIS OF CURRENT CONSTRAINTS ON TESTING GENERAL RELATIVITY USING THE LATEST COSMOLOGICAL DATA SETS.
 A FIGURE OF MERIT ANALYSIS OF CURRENT CONSTRAINTS ON TESTING GENERAL RELATIVITY USING THE LATEST COSMOLOGICAL DATA SETS. Jason Dossett OUTLINE Motivations Ways to Test Gravity Growth Equations Modified
Redshift Space Distortion Introduction
 Redshift Space Distortion Introduction Yi ZHENG ( 郑逸 ) Korea Institute of Advanced Study (KIAS) Cosmology School in the Canary Islands - Fuerteventura, Sep.18-22, 2017 Outline What s RSD? Anisotropic properties
Planck constraints on neutrinos. Massimiliano Lattanzi Università di Ferrara on behalf of the Planck Collaboration
 Planck constraints on neutrinos Massimiliano Lattanzi Università di Ferrara on behalf of the Planck Collaboration The Cosmic Neutrino Background (CnB) The presence of a background of relic neutrinos is
The Degeneracy of Dark Energy and Curvature
 The Degeneracy of Dark Energy and Curvature Department of Physics and Astronomy, UWC, Cape Town Department of MAM, UCT, Cape Town PhD student: Amadeus Witzemann Collaborators: Philip Bull, HIRAX coll.
Jorge Cervantes-Cota, ININ. on behalf of the DESI Collaboration
 Jorge Cervantes-Cota, ININ on behalf of the DESI Collaboration PPC 2014 DESI Overview DESI is the Dark Energy Spectroscopic Instrument Pioneering Stage-IV Experiment recommended by Community DE report
The 6dF Galaxy Survey: baryon acoustic oscillations and the local Hubble constant
 Mon. Not. R. Astron. Soc. 416, 317 332 (211) doi:1.1111/j.1365-2966.211.1925.x The 6dF Galaxy Survey: baryon acoustic oscillations and the local Hubble constant Florian Beutler, 1 Chris Blake, 2 Matthew
Basic BAO methodology Pressure waves that propagate in the pre-recombination universe imprint a characteristic scale on
 Precision Cosmology With Large Scale Structure, Ohio State University ICTP Cosmology Summer School 2015 Lecture 3: Observational Prospects I have cut this lecture back to be mostly about BAO because I
arxiv:astro-ph/ v3 31 Mar 2006
 astro-ph/61453 Observational constraints on the acceleration of the Universe Yungui Gong College of Electronic Engineering, Chongqing University of Posts and Telecommunications, Chongqing 465, China and
Infrared Effects at the BAO Scale
 Infrared Effects at the BAO Scale Gabriele Trevisan CosPA 2017 Senatore, Trevisan: arxiv 1710.02178, Scoccimarro, Trevisan: arxiv xxxx.xxxx BAO in pictures Eisenstein et al. 0604361 BAO in pictures Eisenstein