Climate briefing: Wairarapa dry conditions
|
|
|
- Timothy Oliver
- 5 years ago
- Views:
Transcription

1 Climate briefing: Wairarapa dry conditions Wellington region, April 2016 Alex Pezza and Mike Thompson Environmental Science Department For more information, contact the Greater Wellington Regional Council: Wellington PO Box T F Masterton PO Box 41 T F April info@gw.govt.nz
2 DISCLAIMER This report has been prepared by Environmental Science staff of Greater Wellington Regional Council (GWRC) and as such does not constitute Council policy. In preparing this report, the authors have used the best currently available data and have exercised all reasonable skill and care in presenting and interpreting these data. Nevertheless, GWRC does not accept any liability, whether direct, indirect, or consequential, arising out of the provision of the data and associated information within this report. Furthermore, as GWRC endeavours to continuously improve data quality, amendments to data included in, or used in the preparation of, this report may occur without notice at any time. GWRC requests that if excerpts or inferences are drawn from this report for further use, due care should be taken to ensure the appropriate context is preserved and is accurately reflected and referenced in subsequent written or verbal communications. Any use of the data and information enclosed in this report, for example, by inclusion in a subsequent report or media release, should be accompanied by an acknowledgement of the source.
3 Executive summary Overview: Rainfall has been persistently below average in most of the Wellington region since the end of 2014, coinciding with a climate pattern where several dry years have occurred within the last decade or so. Some partial recovery occurred in early January 2016, but rainfall subsequent to this and to date has been well below average. The latest satellite information suggests that the level of dryness experienced this season may have already peaked (as of 31 st March), and that vegetation health and soil moisture are now slowly improving in response to cooler temperatures and decreased solar radiation. Additionally, the current El Niño is dissipating more quickly than expected and will possibly revert to a La Niña mode from early winter. Statistically speaking, under neutral or La Niña conditions we would expect closer to average rainfall this winter and next spring and summer (2017), compared to this year. This means that, in the absence of other climate drivers (ie, mechanisms that influence the global climate such as oceanic temperatures, the strength of westerly winds, etc.) rainfall in the Wairarapa should return to normal levels by late autumn this year. Wairarapa dry conditions compared to past years: The Vegetation Health Index (VHI) and Drought Stress Index (D) derived by satellite (NOAA/US) show that most of the Wairarapa is under considerable drought stress, and certainly worse than last year for this late in the season. Virtual Climate Station data (VCN) supplied by NIWA also present a picture of severe climatological drought-stress and corroborate the satellitederived indices. The southern Wairarapa Valley in particular is currently experiencing conditions that are drier than any previous event in recent decades, including the 1997/1998 El Niño which was amongst the driest on record over most of the Wairarapa. For the north-eastern Wairarapa valley, the rainfall deficit has been worse this year compared to previous El Niño events. However other water stress indicators more closely associated with drought effects show conditions to the north are not quite as severe as in southern Wairarapa (relative to other years). This could be due to reduced winds this summer, which prevented even further drying. Drought indicators: Both satellite and VCN data unequivocally show that droughtstress (or dryness) this year in the Wairarapa is quite severe and has extended further south than the 1997/1998 event. The level of severity varies depending on the variables, period and area analysed. A key feature of the current situation is how late in the season the dryness is persisting, as well as the extension of the stressed area further south compared to previous years. There are many additional indicators that need to be considered in order to assess drought more formally. In this briefing only rainfall, potential evapotranspiration, soil moisture and satellite-derived drought indices based on vegetation health are assessed. While GWRC is not able to make explicit statements or recommendations about formal drought declaration, we note that in the short-term conditions are unlikely to become drier due to the sharply decreasing solar radiation levels at this time of the year and rapid dissipation of the El Niño (ENSO) phenomenon. Further climate briefings will be prepared by GWRC as the season unfolds. I
4 Summary of key findings: 1. Satellite, VCN and station data all confirm that most of the Wairarapa is currently under severe drought stress. 2. For most of the Wairarapa, the indicators of drought stress (rainfall, potential evapotranspiration (PET), and vegetation condition) appear similar to, although not quite as severe, as the 1997/1998 El Niño event. The exception is the southern Wairarapa Valley, where the current drought stress is worse than in 1998 and possibly the worst in recent decades. 3. Drought stress has become more frequent in recent years, primarily due to increased evapotranspiration as a result of higher air temperatures. This is largely consistent with climate change predictions. 4. It is very unlikely that the current dryness will further worsen before and into winter even if rainfall remains below average, due to rapidly decreasing solar radiation and evaporation over the next four months. 5. Long-term seasonal climate forecasts are favourable to a return of normal rainfall pattern in the Wairarapa into winter, as the current El Niño event is dissipating faster than originally predicted. II
5 Contents Executive summary i 1. Climate drivers El Niño Southern Oscillation (ENSO) Southern Annular Mode (SAM) Atmospheric blocking Sea ice extent Sea surface temperatures 5 2. Wairarapa dry conditions compared to past years Satellite-derived vegetation health and drought stress indices Soil moisture assessment from the NIWA-Drought Monitor Virtual Climate Station (VCN) analysis Observed rainfall and soil moisture conditions for selected sites Rainfall accumulation since 1 July Soil moisture content since 1 July Overall assessment of rainfall accumulation and soil moisture Updated climate outlook for the remaining of autumn 23 Acknowledgments 24
6
 The 2015/2016 El Niño was very strong, comparable in intensity to the recordbreaking El Niño events of 1982/1983 and 1997/998 as shown in Figure 1.")
7 1. Climate drivers 1.1 El Niño Southern Oscillation (ENSO) The 2015/2016 El Niño was very strong, comparable in intensity to the recordbreaking El Niño events of 1982/1983 and 1997/998 as shown in Figure 1.1 (upper panel). The current El Niño peak has now passed and is losing intensity. Although some uncertainty remains, the best guidance from international predictions is that the event will rapidly dissipate and possibly switch to La Niña conditions by early winter (Figure 1.1 lower panel). This means that the drying effects of the El Niño should decrease in the next few months, returning to a more normal rainfall pattern depending on the behaviour of the other climate drivers (see sections 1.2 to 1.5). Established statistical relationships between seasonal low rainfall and ENSO phase in our region suggest that if La Niña conditions eventuate, this will not increase the probability of low winter rainfall, placing the Wellington region under much more favourable conditions compared to the present El Niño regime. PAGE 1 OF 24

8 Figure 1.1: Latest ENSO Sea Surface Temperature anomalies in historical context (upper panel) and projections for the remaining of the year (lower panel). Source: NOAA/US and BOM. The figure shows that the 2015/2016 El Niño event was of very similar magnitude to the record events of 1982/1983 and 1997/1998, and that either neutral or weak La Niña conditions are predicted from mid-winter. PAGE 2 OF 24
9 1.2 Southern Annular Mode (SAM) The Southern Annular Mode (SAM) describes the movement of the westerly wind belt that encircles Antarctica in the Southern Ocean. Although the SAM is normally negative during El Niño years, Figure 1.2 shows that this climate driver has been mostly positive since the beginning of summer. A positive SAM is associated with more anticyclones over New Zealand causing more settled weather, less wind and hotter temperatures during summer. It is not possible to predict the behaviour of this climate driver over the next season other than the predicted short term tendency (shown in red on the right corner). The latest guidance from the US National Oceanic Atmospheric Administration (NOAA) suggests that the SAM will briefly shift to negative in the second half of April 2016 before returning to positive, possibly indicating that rainfall will remain below average at least until May The GWRC autumn climate outlook (section 3) reflects these predicted changes in SAM. Figure 1.2: Evolution of the Southern Annular Mode, as measured by the Antarctic Oscillation Index (AAO). A persistence of positive values is seen for much of 2016, with forecasts for the remaining of April (in red) indicating a brief shift to negative values. The persistence of the positive phase of this index tends to be associated with blocking anticyclones to the east of New Zealand and a reduction of the westerly winds, causing warmer than normal temperatures and lack of rainfall in the warm season. Source: NOAA/US PAGE 3 OF 24

10 1.3 Atmospheric blocking Atmospheric blocking is associated with SAM and the other drivers. It is measured by the persistency of anticyclones around New Zealand, which block the normal westerly flow and tend to produce low winds, higher temperatures and low rainfall during the warm season. Figure 1.3 shows that the blocking has been very active over the entire period from 1 January to present, helping explain the anomalous conditions observed, that is, less fronts, less wind, hotter temperatures and much less rainfall than normal in some areas. Rainfall can only return to more normal levels after this pattern is completely dissipated. There is a good chance that this pattern will break down once the more vigorous winter fronts become established and the SAM reverts to negative, but present guidance suggests, as discussed above, that this is unlikely to happen until later in May Figure 1.3: Mean Sea Level Pressure anomalies (hpa) over the New Zealand sector for the period 1 Jan 2016 to 11 April A very vigorous blocking high is seen to the east of New Zealand, with a small low pressure area to the north-west of the country. As a result of this pattern New Zealand has seen less fronts, less wind, higher temperatures and much less rainfall than normal in some areas, of which the Wellington region and Wairarapa in particular have been one of the most affected. Source: NCEP reanalysis/us. PAGE 4 OF 24

11 1.4 Sea ice extent The sea ice extent is very important to New Zealand because of our relative proximity to Antarctica. The ice strengthens the cold fronts that affect New Zealand during winter. It also interacts with the Southern Annular Mode potentially affecting the rainfall anomalies, as discussed in section 1.2. The Antarctic sea ice extent is currently close to average (not shown), different from last year when the ice extent was significantly greater than average. 1.5 Sea surface temperatures The latest sea surface temperature for March 2016 shows that the oceanic waters to the west of New Zealand have been the warmest on record, while the waters to the south of New Zealand have been the coldest on record. The warm waters help explain the unusually warm and settled weather that has persisted since the beginning of the year. However, as the fronts strengthen towards the winter they shift cold water towards New Zealand, as well as becoming more vigorous (ie, colder) while sitting on top of cooler than normal water around Antarctica. This means that once the blocking pattern (section 1.3) finally breaks down the region will likely experience a quite vigorous climate reversal towards very cold and wet conditions. Figure 1.4: Sea Surface Temperature Anomalies for March Areas of record warm or record cold are marked by the contour lines. Warmest on record waters to the west of New Zealand help explain the very warm and stable weather observed since the beginning of this year, but as we progress into the colder season the cold fronts will be amplified by the record cold waters to the south of New Zealand, as well as possibly bringing this colder water mass towards New Zealand. This configuration has the potential to generate an abrupt shift into cold and wet conditions by the end of autumn. Source: Australian Bureau of Meteorology. PAGE 5 OF 24
 for week 13 (ending 31 March) for the years 1983 (El Niño), 1998 (El Niño), 2013 (drought-declared year in the North Island) and 2016.")
12 2. Wairarapa dry conditions compared to past years 2.1 Satellite-derived vegetation health and drought stress indices Figure 2.1 shows the satellite-derived Vegetation Heath Index (VHI) for week 13 (ending 31 March) for the years 1983 (El Niño), 1998 (El Niño), 2013 (drought-declared year in the North Island) and Indices below 40 (yellow and red tones) indicate vegetation stress with likely losses of crop and pasture production; while an index above 60 (dark green and blue) would imply plentiful production 1. Figure 2.1 shows that although the drought-declared year of 2013 was overall much worse in the North Island, for the Wairarapa the worst years were 1997 and A closer inspection of the Wellington region shows that the present dryness (2016) is much worse than in 1997 for the western part of the region. For the Wairarapa, the area south and south-east of Lake Wairarapa, which appears as light green (ie, relatively healthy) in 1997, is significantly worse in 2016 (see enlarged comparison in Figure 2.2) Figure 2.1: Vegetation Health Index (anomaly based on a 25 year climatology) comparing week 13 (31 March) for the years 1983 (strong El Niño), 1998 (strong El Niño), 2013 (declared drought in the North Island) and Yellow and red show drought-stress with likely losses of crop and pasture production; dark greens and blues show healthier vegetation compared to normal. The images show that, although the North Island as a whole had its worst year in 2013, in the Wairarapa the current condition is comparable to the 1997 El Niño event, but actually worse than 1997 to the south of Lake Wairarapa. Source: Images produced by NOAA/US. Resolution: 4km resolution pixels used. 1 Koga, F. and Guo,W. 2015: mega-drought in the western USA and its monitoring from space data. Geomatics, Natural Hazards and Risk, published online, DOI: / PAGE 6 OF 24


13 Figure 2.2: VHI as per Figure 2.1, but zoomed in comparing 1998 (left) with 2016 (right). The area south of Lake Wairarapa, which appears relatively green in 1998, is considerably worse in Importantly, the VHI and D-index convey the actual anomaly calculated based on robust (25 year) climatology, taking into account the vegetation health as well as temperature related stress compared to the long-term average. Hence, an indication of stressed conditions means that the stress is higher than what would normally be expected for the time of the year. Although not specifically calibrated for New Zealand conditions, the satellite vegetation and droughtstress indices offer a good sense of relative change from year to year. These satellite products are used by the US-drought monitor ( Figure 2.3 shows the week ending 31 March 2016 zoomed in for the Wellington region, albeit using the same 4km resolution as in Figure 2.1. The left panel shows the VHI as in Figure 2.1, while the right panel shows the Drought-stress index (D) derived from VHI, which basically highlights the areas that are drought-stressed on a progressive scale from low to high. We can see that the vegetation is highly stressed for most of inland Wairarapa, less so in the hill country. These maps are not intended to be used at a scale of less than 4km so very localised features will not be accurately shown. Figure 2.3: Satellite-derived images of Vegetation Health Index (left) and Droughtstress Index (right) for the week ending 31 March VHI scale (left) as per Figure 2.1. Drought index scale (right) as per follows: 0 (moderate or no stress), 1 (severe stress), 2 (extreme stress), 3 (exceptional stress). All metrics are in relation to a 25 year period base climatology. Source: NOAA/US, resolution 4km. PAGE 7 OF 24

14 2.2 Soil moisture assessment from the NIWA-Drought Monitor Figure 2.4 below shows the soil moisture deficit from the NIWA national drought monitor zoomed in for the Wellington region for 7 th April As very little rain fell between 31 March and 7 April, this map should be comparable to the satellite previously shown. We can see that the driest area according to the NIWA soil moisture deficit indicator more or less matches the area indicated as severe by the satellite generated indices, with the difference that the NIWA map doesn t reflect the severity of the dryness south of Lake Wairarapa, possibly because the data coverage is very sparse for the area. Figure 2.4: Soil moisture deficit for 7 April Source: NIWA drought monitor. PAGE 8 OF 24

15 2.3 Virtual Climate Station (VCN) analysis Modelled daily climate data from the NIWA Virtual Climate Network (VCN) have been used to compare the current summer with those over the past 35 years. Three sites were selected to generally represent the major geographical and climate sub-zones of the Wairarapa (Figure 2.5): Southern Wairarapa Valley (VCN site 30242) Northern Wairarapa Valley (VCN site 27781) Eastern Wairarapa (VCN site 28831) Three indicators of water stress have been chosen to characterise the relative severity of the current summer. These are: Accumulated summer rainfall (mm) Accumulated summer potential evapotranspiration, PET (mm), defined as the total evapotranspiration that would occur if sufficient moisture is available Number of days of severe soil moisture deficit. A severe deficit is defined as 130 mm or more and is consistent with the threshold commonly used in New Zealand. A deficit of 130 mm means that this amount of effective rainfall (ie, penetrating the soil) is needed in order to bring the soil back to saturation. For the purposes of this exercise, summer was defined as the six month period October to March inclusive, to generally coincide with the time of year that water stress begins to emerge. Different definitions of what constitutes summer may lead to slightly different results. Figure 2.5: Map of available VCN sites with subset of three sites selected for analysis highlighted in yellow PAGE 9 OF 24
16 Summary data for each indicator is ranked by year (Figures 2.6, 2.7 and 2.8) for each of the three VCN sites. In each plot, the current year is highlighted (red) and the summers of 1997/98 and 1982/83 in orange. These summers correspond to the previous strongest on record recorded El Niño events. The horizontal black line is the average for the 35 year period (which broadly meets the criteria of a standard climatological period). Key observations: This summer has been extremely dry across most of the Wairarapa, confirming the findings of both satellite data and soil moisture deficit from the NIWA drought monitor previously shown. All indicators at all sites suggest a higher water stress than normal. In south Wairarapa Valley (VCN site 30342), summer rainfall this year is about as low as last summer which was the lowest since Summer PET was much higher than normal and on a par with the highest on record (which have all been recorded in the last several years). Days of severe deficit were much higher than normal, similar to last summer. Only 2000/01 has been more extreme. Across all three indicators, water stress in the southern Wairarapa Valley has been higher this year than in either the 1997/98 or 1982/83 El Niño years. Rainfall has been the lowest since 1980 in the northern Wairarapa Valley (VCN site 27781) but, compared with the southern Valley, PET and days of severe deficit do not present such an extreme overall picture of water stress. The 1997/98 El Niño year appears to have been more significant in the northern Valley. Parts of the climatic reason for this could be due to the fact that this summer had very little wind compared to previous years, due to the effects of atmospheric blocking mentioned in section 1.3. The picture to the east (VCN site 28831) is also one of extreme dryness, although not quite as severe as 1997/98. The finding of drought effects at all three sites doesn t seem to be a random pattern. Seven out of the ten highest ranked PET years occurred in the last 10 years for the south and north-eastern Wairarapa, with nine out of ten in the eastern Wairarapa. For rainfall, the figure for all sites is only three out of ten dry years occurring over the last decade. Hence, we can conclude that environmental conditions leading to drought stress have become dramatically more pronounced over the last decade irrespective of rainfall not following a similar proportional decrease. This tendency for increasing dryness over the last 10 years matches the increase in global temperatures associated with increasing levels of atmospheric CO 2. Warmer temperatures increase the potential for evaporation and hence more water loss from both the soil and plants. PAGE 10 OF 24
17 Accumulated rainfall (Oct to March) Summer rainfall (mm) / / / / / / / / / / / / / / / / / / / / / / / / / / / / / / / / / /89 This summer 2014/15 Accumulated PET (Oct to March) / / / / / / / / / / / / / / / / / / / /95 Summer PET (mm) 1989/ / / / / / / / / / / /98 This summer 2012/ / /11 Total days in severe soil moisture deficit (>130 mm) Number of days with 'severe' deficit / / / / / / / / / / / / / / / / / / / / / / / / / / / / / / / / /81 This summer Figure 2.6: South Wairarapa Valley (VCN site 30242). Rankings of years by climate indicators with summer 2015/16 (shown in red) and summers 1997/98 and 1982/83 (shown in orange). 2014/ /01 PAGE 11 OF 24
18 Accumulated rainfall (Oct to March) / / / / / / / /02 Summer rainfall (mm) 1991/ / / / / / / / / / / / / / / / / / / / / / / / / / /85 This summer Accumulated PET (Oct to March) Summer PET (mm) / / / / / / / / / / / / / / / / / / / / / / / / /90 This summer 2009/ / / / / / / / / /11 Total days in severe soil moisture deficit (>130 mm) Number of days of 'severe' deficit / / / / / / / / / / / / / / / / / / / / / / / / / / / / / /87 This summer 1982/ / /15 Figure 2.7: Northeastern Wairarapa Valley (VCN site 27781). Rankings of years by climate indicators with summer 2015/16 (shown in red) and summers 1997/98 and 1982/83 (shown in orange). 2012/ /98 PAGE 12 OF 24
19 Accumulated rainfall (Oct to March) / / / / / / / / / / / / / / / / / / / / / / / / / / / / / / / / /98 Summer rainfall (mm) This summer 1993/ /89 Accumulated PET (Oct to March) Summer PET (mm) / / / / / / / / / / / / / / / / / / / / / / / / / / /07 This summer 2009/ / / / / / / /11 Total days in severe soil moisture deficit (>130 mm) / / / / / / / / / /14 Number of days of 'severe' deficit 1998/ / / / / / / / / / / / / / / / / / / / / / / /01 This summer 1997/98 Figure 2.8: Eastern Wairarapa coast (VCN site 28831). Rankings of years by climate indicators with summer 2015/16 (shown in red) and summers 1997/98 and 1982/83 (shown in orange). PAGE 13 OF 24

20 2.4 Observed rainfall and soil moisture conditions for selected sites Figure 2.9 shows the location of selected GWRC rainfall and soil moisture monitoring sites. Plots of accumulated rainfall and soil moisture trends are provided in the following pages. Figure 2.9: Map of rainfall and soil moisture monitoring locations Rainfall accumulation since 1 July 2015 The following rainfall plots show total rainfall accumulation (mm) since 1 July For comparative purposes, cumulative plots for selected historic years with notably dry summers in the Wairarapa have been included, as well as the site mean. Many of the GWRC telemetered rain gauge sites in the lower lying parts of the Wairarapa (ie, not Tararua Range gauges installed for flood warning purposes) have only been operating since the late 1990s so the period of data presented is somewhat constrained to the past two decades. For each historical record plotted, an indication of ENSO climate state (El Niño, La Niña or neutral) at that time is also given. GWRC does not operate a rain gauge in the southern-most parts of the Wairarapa Valley that is suitable for presenting data in this report. This means that we cannot be confident that the rainfall patterns seen elsewhere extend to this part of the region other than the satellite and VCN data already presented. PAGE 14 OF 24
21 Kapiti Coast Southwest (Wellington city) PAGE 15 OF 24
22 Hutt and Tararua Range PAGE 16 OF 24
23 Wairarapa PAGE 17 OF 24
24 PAGE 18 OF 24
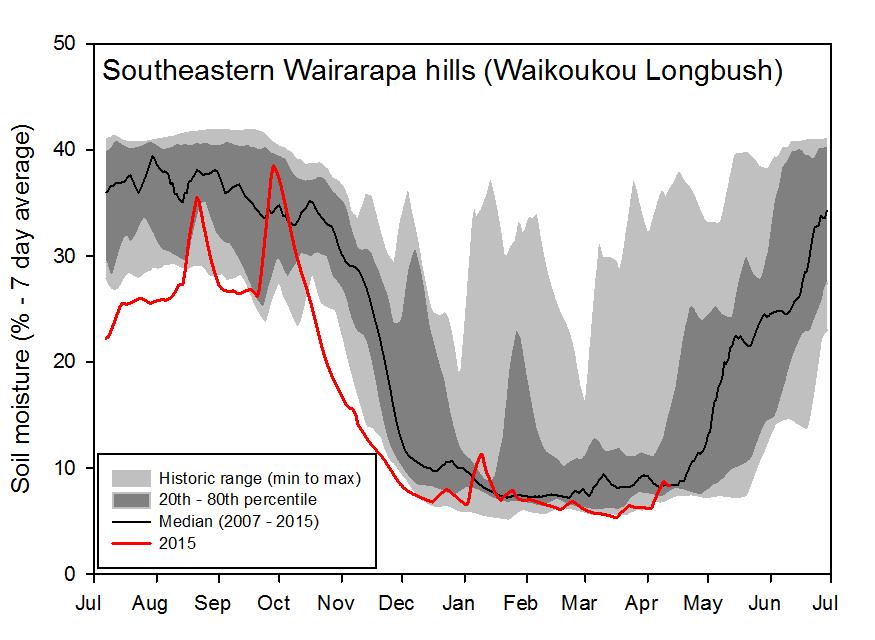
 is also provided to give an indication of how the current soil moisture compares with that for a similar time of the season in past")
25 2.4.2 Soil moisture content since 1 July 2015 The soil moisture plots show seven day rolling average soil moisture (%) since 1 July An envelope plot of the historic range of data (and site mean) is also provided to give an indication of how the current soil moisture compares with that for a similar time of the season in past years. While the soil moisture plots are useful for tracking change within the current season and comparing relative differences between years, they do not provide the absolute moisture content (%) as many of the GWRC soil moisture sites have not yet been fully calibrated. Hutt Valley PAGE 19 OF 24

26 Wairarapa PAGE 20 OF 24

27 2.4.3 Overall assessment of rainfall accumulation and soil moisture Cumulative rainfall as of April 2016 is well below normal for all sites analysed, with the exception of Kapiti coast where accumulated rainfall is closer to average. A few sites are currently sitting at the lowest on record for the cumulative period, including the Karori Sanctuary and the Tauherenikau site near Featherston. The accumulation over the ranges (Angle Knob) has also been quite low. The Karori site is very important as it has a very long data series, and observations from this site are consistent with the satellite appraisal that this year has been much worse than any previous El Niño years in the west part of the region. In the Wairarapa the sites have been installed much more PAGE 21 OF 24
28 recently, and places like Tanawa Hutt may be subject to localized topographic rainfall which is not representative of the overall low lying dry areas depicted by satellite. Overall, the station data was highly influenced by a very heavy and short duration rainfall event that occurred in September. This event wasn t included in the VCN analysis provided in section 2.3 because summer was defined as starting in October, which is when water stress normally starts to affect the agricultural sector. Hence, the satellite and VCN analysis are probably more representative of the actual water stress rather than the full year hydrological plots provided above. Unlike rainfall, soil moisture measurements are only available for recent years. Hence, a direct comparison with previous El Niño years is not possible. Also, because the last decade has been exceptionally dry (as discussed in section 2.3), the deviation from average will be proportionally smaller as the average is already relatively dry. Nonetheless, the measured soil moisture shows near lowest on record for the north-eastern Wairarapa with a very slight recent recovery, and near driest on record for the south-eastern Wairarapa for most of summer with some recovery early in April. The sites around Masterton and Featherston show persistent low moisture levels with no signs of recovery so far, while the average moisture for this time of the year should already be strongly increasing. In short, the locally measured soil moisture is consistent with the satellite information showing overall dry conditions in the Wairarapa and particularly so for this late in the season, although signs of a slight recovery have already started in the south-eastern hills. As mentioned earlier in the report, it is extremely unlikely that the current dryness (as measured by the specific parameters discussed in this report) will worsen as we head into winter, due to the sharp decline in solar radiation experienced this time of the year. PAGE 22 OF 24

29 3. Updated climate outlook for the remaining of autumn An update of the climate outlook for autumn previously included in in the Climate and Water Resources Summary for the Wellington Region, Summer 2015/16 is presented in Table 3.1. This outlook was prepared by GWRC based on in-house expertise, and information provided by NIWA, Metservice and international centres. This information is qualitative only. The extended seasonal climate reports for the Wellington region can be found here: As the current El Niño is already declining, and showing an unusual atmospheric pattern with very warm waters around New Zealand, it is unlikely that the traditional statistical relationship will hold too strongly, and short duration heavy rainfall episodes are possible. Even then, the probability of above average rainfall on a seasonal basis is very small (estimated at only 20% by NIWA). Table 3.1: Climate outlook for autumn (updated from the Climate and Water Resources Summary for the Wellington Region, Summer 2015/16) 2 2 This climate outlook was prepared by GWRC based on our own expertise, and information provided by NIWA, MetService and international centres such as the International Research Institute for Climate and Society of Columbia university ( This guidance is qualitative only, and GWRC takes no responsibility for the use or accuracy of this information. For more details on long-term climate forecasts at a national level the reader should refer to NIWA in the first instance ( PAGE 23 OF 24
30 Acknowledgments We would like to thank the National Oceanic and Atmospheric Administration (NOAA/US) for kindly providing us with satellite-derived drought indices. We would also like to acknowledge NIWA for granting access to selected VCN sites. PAGE 24 OF 24
Climate briefing. Wellington region, May Alex Pezza and Mike Thompson Environmental Science Department
 Climate briefing Wellington region, May 2016 Alex Pezza and Mike Thompson Environmental Science Department For more information, contact the Greater Wellington Regional Council: Wellington PO Box 11646
Regional overview Autumn 2016
 Autumn 2016 (March to May inclusive) was drier than average for most of the region. The south and east of the Wairarapa were the driest areas with west coast areas being the wettest. Autumn rainfall The
Percentage of normal rainfall for April 2018 Departure from average air temperature for April 2018
 New Zealand Climate Update No 227, May 2018 Current climate April 2018 Overall, April 2018 was characterised by lower pressure than normal over and to the southeast of New Zealand. Unlike the first three
Percentage of normal rainfall for August 2017 Departure from average air temperature for August 2017
 New Zealand Climate Update No 219, August 2017 Current climate August 2017 Overall, mean sea level pressure was lower than normal over and to the west of New Zealand during August while higher than normal
New Zealand Climate Update No 222, November 2017 Current climate November 2017
 New Zealand Climate Update No 222, November 2017 Current climate November 2017 November 2017 was characterised by higher than normal sea level pressure over New Zealand and the surrounding seas, particularly
New Zealand Climate Update No 226, April 2018 Current climate March 2018
 New Zealand Climate Update No 226, April 2018 Current climate March 2018 March 2018 was characterised by significantly higher pressure than normal to the east of New Zealand. This pressure pattern, in
An ENSO-Neutral Winter
 An ENSO-Neutral Winter This issue of the Blue Water Outlook newsletter is devoted towards my thoughts on the long range outlook for winter. You will see that I take a comprehensive approach to this outlook
Summary report for Ruamāhanga Whaitua Committee The climate of the Ruamāhanga catchment
 Summary report for Ruamāhanga Whaitua Committee The climate of the Ruamāhanga catchment The Tararua and Rimutaka ranges have a large influence on the climate of the Ruamāhanga catchment. The ranges shelter
Seasonal Climate Watch January to May 2016
 Seasonal Climate Watch January to May 2016 Date: Dec 17, 2015 1. Advisory Most models are showing the continuation of a strong El-Niño episode towards the latesummer season with the expectation to start
Weather and Climate Summary and Forecast Summer 2017
 Weather and Climate Summary and Forecast Summer 2017 Gregory V. Jones Southern Oregon University August 4, 2017 July largely held true to forecast, although it ended with the start of one of the most extreme
Weather and Climate Summary and Forecast February 2018 Report
 Weather and Climate Summary and Forecast February 2018 Report Gregory V. Jones Linfield College February 5, 2018 Summary: For the majority of the month of January the persistent ridge of high pressure
New Zealand Climate Update No 221, October 2017 Current climate October 2017
 New Zealand Climate Update No 221, October 2017 Current climate October 2017 October 2017 was characterised by higher than normal sea level pressure over New Zealand and the surrounding seas. This consistent
NIWA Outlook: October - December 2015
 October December 2015 Issued: 1 October 2015 Hold mouse over links and press ctrl + left click to jump to the information you require: Overview Regional predictions for the next three months: Northland,
By: J Malherbe, R Kuschke
 2015-10-27 By: J Malherbe, R Kuschke Contents Summary...2 Overview of expected conditions over South Africa during the next few days...3 Significant weather events (27 October 2 November)...3 Conditions
Climate Outlook through 2100 South Florida Ecological Services Office Vero Beach, FL January 13, 2015
 Climate Outlook through 2100 South Florida Ecological Services Office Vero Beach, FL January 13, 2015 Short Term Drought Map: Short-term (
Weather and Climate Summary and Forecast Fall/Winter 2016
 Weather and Climate Summary and Forecast Fall/Winter 2016 Gregory V. Jones Southern Oregon University November 5, 2016 After a year where we were seemingly off by a month in terms of temperatures (March
National Wildland Significant Fire Potential Outlook
 National Wildland Significant Fire Potential Outlook National Interagency Fire Center Predictive Services Issued: September, 2007 Wildland Fire Outlook September through December 2007 Significant fire
Weather and Climate Summary and Forecast March 2018 Report
 Weather and Climate Summary and Forecast March 2018 Report Gregory V. Jones Linfield College March 7, 2018 Summary: The ridge pattern that brought drier and warmer conditions from December through most
NIWA Outlook: March-May 2015
 March May 2015 Issued: 27 February 2015 Hold mouse over links and press ctrl + left click to jump to the information you require: Overview Regional predictions for the next three months: Northland, Auckland,
Weather and Climate Summary and Forecast November 2017 Report
 Weather and Climate Summary and Forecast November 2017 Report Gregory V. Jones Linfield College November 7, 2017 Summary: October was relatively cool and wet north, while warm and very dry south. Dry conditions
NIWA Outlook: April June 2019
 April June 2019 Issued: 28 March 2019 Hold mouse over links and press ctrl + left click to jump to the information you require: Outlook Summary Regional predictions for the next three months Northland,
Weather and Climate Summary and Forecast Winter
 Weather and Climate Summary and Forecast Winter 2016-17 Gregory V. Jones Southern Oregon University February 7, 2017 What a difference from last year at this time. Temperatures in January and February
South & South East Asian Region:
 Issued: 15 th December 2017 Valid Period: January June 2018 South & South East Asian Region: Indonesia Tobacco Regions 1 A] Current conditions: 1] El Niño-Southern Oscillation (ENSO) ENSO Alert System
New Zealand Climate Update No 223, January 2018 Current climate December 2017
 New Zealand Climate Update No 223, January 2018 Current climate December 2017 December 2017 was characterised by higher than normal sea level pressure over New Zealand and the surrounding seas. This pressure
2011 National Seasonal Assessment Workshop for the Eastern, Southern, & Southwest Geographic Areas
 2011 National Seasonal Assessment Workshop for the Eastern, Southern, & Southwest Geographic Areas On January 11-13, 2011, wildland fire, weather, and climate met virtually for the ninth annual National
Weather and Climate Summary and Forecast August 2018 Report
 Weather and Climate Summary and Forecast August 2018 Report Gregory V. Jones Linfield College August 5, 2018 Summary: July 2018 will likely go down as one of the top five warmest July s on record for many
Weather and Climate Summary and Forecast April 2018 Report
 Weather and Climate Summary and Forecast April 2018 Report Gregory V. Jones Linfield College April 4, 2018 Summary: A near Miracle March played out bringing cooler and wetter conditions to the majority
Seasonal Climate Watch November 2017 to March 2018
 Seasonal Climate Watch November 2017 to March 2018 Date issued: Oct 26, 2017 1. Overview The El Niño Southern Oscillation (ENSO) continues to develop towards a La Niña state, and is expected to be in at
UPDATE OF REGIONAL WEATHER AND SMOKE HAZE (December 2017)
") UPDATE OF REGIONAL WEATHER AND SMOKE HAZE (December 2017) 1. Review of Regional Weather Conditions for November 2017 1.1 In November 2017, Southeast Asia experienced inter-monsoon conditions in the first
UPDATE OF REGIONAL WEATHER AND SMOKE HAZE (December 2017) 1. Review of Regional Weather Conditions for November 2017 1.1 In November 2017, Southeast Asia experienced inter-monsoon conditions in the first
Weather and Climate Summary and Forecast October 2018 Report
 Weather and Climate Summary and Forecast October 2018 Report Gregory V. Jones Linfield College October 4, 2018 Summary: Much of Washington, Oregon, coastal California and the Bay Area and delta region
UPDATE OF REGIONAL WEATHER AND SMOKE HAZE (May 2017)
") UPDATE OF REGIONAL WEATHER AND SMOKE HAZE (May 2017) 1. Review of Regional Weather Conditions in April 2017 1.1 Inter monsoon conditions, characterised by afternoon showers and winds that are generally
UPDATE OF REGIONAL WEATHER AND SMOKE HAZE (May 2017) 1. Review of Regional Weather Conditions in April 2017 1.1 Inter monsoon conditions, characterised by afternoon showers and winds that are generally
2015: A YEAR IN REVIEW F.S. ANSLOW
 2015: A YEAR IN REVIEW F.S. ANSLOW 1 INTRODUCTION Recently, three of the major centres for global climate monitoring determined with high confidence that 2015 was the warmest year on record, globally.
Summer 2018 Southern Company Temperature/Precipitation Forecast
 Scott A. Yuknis High impact weather forecasts, climate assessment and prediction. 14 Boatwright s Loop Plymouth, MA 02360 Phone/Fax 508.927.4610 Cell: 508.813.3499 ClimateImpact@comcast.net Climate Impact
NIWA Outlook: September October November 2013
 September-November 2013 Issued: 30 August 2013 Hold mouse over links and press ctrl + left click to jump to the information you require: Overview Regional predictions for the next three months: Northland,
Climate Outlook through 2100 South Florida Ecological Services Office Vero Beach, FL September 9, 2014
 Climate Outlook through 2100 South Florida Ecological Services Office Vero Beach, FL September 9, 2014 Short Term Drought Map: Short-term (
Weather and Climate Summary and Forecast October 2017 Report
 Weather and Climate Summary and Forecast October 2017 Report Gregory V. Jones Linfield College October 4, 2017 Summary: Typical variability in September temperatures with the onset of fall conditions evident
The South Eastern Australian Climate Initiative
 The South Eastern Australian Climate Initiative Phase 2 of the South Eastern Australian Climate Initiative (SEACI) is a three-year (2009 2012), $9 million research program investigating the causes and
Weather and Climate Summary and Forecast January 2018 Report
 Weather and Climate Summary and Forecast January 2018 Report Gregory V. Jones Linfield College January 5, 2018 Summary: A persistent ridge of high pressure over the west in December produced strong inversions
The science behind southeast Australia s wet, cool summer.
 XXXX The science behind southeast Australia s wet, cool summer. Key facts: 1. For many years scientists have painted a clear picture: that the Earth s surface is warming rapidly and the climate is changing.
Weather and Climate Summary and Forecast December 2017 Report
 Weather and Climate Summary and Forecast December 2017 Report Gregory V. Jones Linfield College December 5, 2017 Summary: November was relatively cool and wet from central California throughout most of
Weather and Climate Summary and Forecast Winter
 Weather and Climate Summary and Forecast Winter 2016-17 Gregory V. Jones Southern Oregon University December 5, 2016 Well after an October that felt more like November, we just finished a November that
Seasonal Climate Watch February to June 2018
 Seasonal Climate Watch February to June 2018 Date issued: Jan 26, 2018 1. Overview The El Niño-Southern Oscillation (ENSO) is expected to remain in a weak La Niña phase through to early autumn (Feb-Mar-Apr).
MDA WEATHER SERVICES AG WEATHER OUTLOOK. Kyle Tapley-Senior Agricultural Meteorologist May 22, 2014 Chicago, IL
 MDA WEATHER SERVICES AG WEATHER OUTLOOK Kyle Tapley-Senior Agricultural Meteorologist May 22, 2014 Chicago, IL GLOBAL GRAIN NORTH AMERICA 2014 Agenda Spring Recap North America Forecast El Niño Discussion
NIDIS Intermountain West Drought Early Warning System October 30, 2018
 10/30/2018 NIDIS Drought and Water Assessment NIDIS Intermountain West Drought Early Warning System October 30, 2018 Precipitation The images above use daily precipitation statistics from NWS COOP, CoCoRaHS,
Monthly Overview. Rainfall
 Monthly Overview Rainfall during August occurred mainly over the Western and Eastern Cape provinces, and KwaZulu- Natal. Rain in these provinces were regularly accompanied by cold fronts as they made landfall
Current and future climate of the Cook Islands. Pacific-Australia Climate Change Science and Adaptation Planning Program
 Pacific-Australia Climate Change Science and Adaptation Planning Program Penrhyn Pukapuka Nassau Suwarrow Rakahanga Manihiki N o r t h e r n C o o k I s l a nds S o u t h e Palmerston r n C o o k I s l
Here s what a weak El Nino usually brings to the nation with temperatures:
 Time again for my annual Winter Weather Outlook. Here's just a small part of the items I considered this year and how I think they will play out with our winter of 2018-2019. El Nino / La Nina: When looking
Weather and Climate Summary and Forecast March 2019 Report
 Weather and Climate Summary and Forecast March 2019 Report Gregory V. Jones Linfield College March 2, 2019 Summary: Dramatic flip from a mild winter to a top five coldest February on record in many locations
UPDATE OF REGIONAL WEATHER AND SMOKE HAZE (February 2018)
") UPDATE OF REGIONAL WEATHER AND SMOKE HAZE (February 2018) 1. Review of Regional Weather Conditions for January 2018 1.1 The prevailing Northeast monsoon conditions over Southeast Asia strengthened in January
UPDATE OF REGIONAL WEATHER AND SMOKE HAZE (February 2018) 1. Review of Regional Weather Conditions for January 2018 1.1 The prevailing Northeast monsoon conditions over Southeast Asia strengthened in January
South & South East Asian Region:
 Issued: 10 th November 2017 Valid Period: December 2017 May 2018 South & South East Asian Region: Indonesia Tobacco Regions 1 A] Current conditions: 1] El Niño-Southern Oscillation (ENSO) ENSO Alert System
Monthly overview. Rainfall
 Monthly overview 1 to 10 April 2018 Widespread rainfall continued to fall over most parts of the summer rainfall region during this period. Unseasonably good rain fell over the eastern half of the Northern
Fire Weather Drivers, Seasonal Outlook and Climate Change. Steven McGibbony, Severe Weather Manager Victoria Region Friday 9 October 2015
 Fire Weather Drivers, Seasonal Outlook and Climate Change Steven McGibbony, Severe Weather Manager Victoria Region Friday 9 October 2015 Outline Weather and Fire Risk Environmental conditions leading to
NIDIS Intermountain West Regional Drought Early Warning System February 7, 2017
 NIDIS Drought and Water Assessment NIDIS Intermountain West Regional Drought Early Warning System February 7, 2017 Precipitation The images above use daily precipitation statistics from NWS COOP, CoCoRaHS,
Sudan Seasonal Monitor
 Sudan Seasonal Monitor Sudan Meteorological Authority Federal Ministry of Agriculture and Forestry Issue 5 August 2010 Summary Advanced position of ITCZ during July to most north of Sudan emerged wide
Chapter outline. Reference 12/13/2016
 Chapter 2. observation CC EST 5103 Climate Change Science Rezaul Karim Environmental Science & Technology Jessore University of science & Technology Chapter outline Temperature in the instrumental record
Weather and Climate Summary and Forecast Summer into Harvest 2016
 Weather and Climate Summary and Forecast Summer into Harvest 2016 Gregory V. Jones Southern Oregon University September 3, 2016 With school and football season starting a hint of fall is right on time
New Zealand Seasonal Fire Danger Outlook 2018/19
 New Zealand Seasonal Fire Danger Outlook 2018/19 ISSUE: South Island, January 2019 Current fire danger situation & outlook: to moderate fire dangers and fire climate severity currently exist in most areas
NIDIS Intermountain West Drought Early Warning System January 16, 2018
 NIDIS Drought and Water Assessment NIDIS Intermountain West Drought Early Warning System January 16, 2018 Precipitation The images above use daily precipitation statistics from NWS COOP, CoCoRaHS, and
West Africa: The 2015 Season
 HIGHLIGHTS The West Africa 2015 growing season developed under an evolving El Nino event that will peak in late 2015. This region tends to have seasonal rainfall deficits in the more marginal areas during
Monthly overview. Rainfall
 Monthly overview 1-10 August 2018 The month started off with light showers over the Western Cape. A large cold front made landfall around the 5th of the month. This front was responsible for good rainfall
Highlight: Support for a dry climate increasing.
 Scott A. Yuknis High impact weather forecasts, climate assessment and prediction. 14 Boatwright s Loop Plymouth, MA 02360 Phone/Fax 508.927.4610 Cell: 508.813.3499 ClimateImpact@comcast.net Climate Impact
How Patterns Far Away Can Influence Our Weather. Mark Shafer University of Oklahoma Norman, OK
 Teleconnections How Patterns Far Away Can Influence Our Weather Mark Shafer University of Oklahoma Norman, OK Teleconnections Connectedness of large-scale weather patterns across the world If you poke
Impacts of Climate on the Corn Belt
 Impacts of Climate on the Corn Belt Great Lakes Crop Summit 2015 2015 Evelyn Browning Garriss Conclusions Climate change is not linear. It ebbs and flows. Recent polar volcano eruptions created a cool
Mozambique. General Climate. UNDP Climate Change Country Profiles. C. McSweeney 1, M. New 1,2 and G. Lizcano 1
 UNDP Climate Change Country Profiles Mozambique C. McSweeney 1, M. New 1,2 and G. Lizcano 1 1. School of Geography and Environment, University of Oxford. 2.Tyndall Centre for Climate Change Research http://country-profiles.geog.ox.ac.uk
ENSO Cycle: Recent Evolution, Current Status and Predictions. Update prepared by Climate Prediction Center / NCEP July 26, 2004
 ENSO Cycle: Recent Evolution, Current Status and Predictions Update prepared by Climate Prediction Center / NCEP July 26, 2004 Outline Overview Recent Evolution and Current Conditions Oceanic NiZo Index
Oregon Water Conditions Report April 17, 2017
 Oregon Water Conditions Report April 17, 2017 Mountain snowpack continues to maintain significant levels for mid-april. By late March, statewide snowpack had declined to 118 percent of normal after starting
Southern Africa Growing Season : Recovery Hampered by Floods and Drought?
 Southern Africa Growing Season 2016-2017: Recovery Hampered by Floods and Drought? HIGHLIGHTS Good performance of the current growing season (October 2016 - April 2017) is badly needed for Southern Africa
Weather and Climate Summary and Forecast January 2019 Report
 Weather and Climate Summary and Forecast January 2019 Report Gregory V. Jones Linfield College January 4, 2019 Summary: December was mild and dry over much of the west, while the east was much warmer than
South Asian Climate Outlook Forum (SASCOF-6)
") Sixth Session of South Asian Climate Outlook Forum (SASCOF-6) Dhaka, Bangladesh, 19-22 April 2015 Consensus Statement Summary Below normal rainfall is most likely during the 2015 southwest monsoon season
Sixth Session of South Asian Climate Outlook Forum (SASCOF-6) Dhaka, Bangladesh, 19-22 April 2015 Consensus Statement Summary Below normal rainfall is most likely during the 2015 southwest monsoon season
Seasonal Climate Outlook for South Asia (June to September) Issued in May 2014
 Issued in May 2014") Ministry of Earth Sciences Earth System Science Organization India Meteorological Department WMO Regional Climate Centre (Demonstration Phase) Pune, India Seasonal Climate Outlook for South Asia (June
Ministry of Earth Sciences Earth System Science Organization India Meteorological Department WMO Regional Climate Centre (Demonstration Phase) Pune, India Seasonal Climate Outlook for South Asia (June
Presentation Overview. Southwestern Climate: Past, present and future. Global Energy Balance. What is climate?
 Southwestern Climate: Past, present and future Mike Crimmins Climate Science Extension Specialist Dept. of Soil, Water, & Env. Science & Arizona Cooperative Extension The University of Arizona Presentation
NIDIS Intermountain West Drought Early Warning System May 23, 2017
 NIDIS Drought and Water Assessment NIDIS Intermountain West Drought Early Warning System May 23, 2017 Precipitation The images above use daily precipitation statistics from NWS COOP, CoCoRaHS, and CoAgMet
Will a warmer world change Queensland s rainfall?
 Will a warmer world change Queensland s rainfall? Nicholas P. Klingaman National Centre for Atmospheric Science-Climate Walker Institute for Climate System Research University of Reading The Walker-QCCCE
UPDATE OF REGIONAL WEATHER AND SMOKE HAZE FOR MAY 2015
 UPDATE OF REGIONAL WEATHER AND SMOKE HAZE FOR MAY 2015 1. Review of Regional Weather Conditions in April 2015 1.1 Inter-Monsoon conditions prevailed over the ASEAN region in April 2015. The gradual northward
New Zealand Seasonal Fire Danger Outlook 2017/18
 New Zealand Seasonal Fire Danger Outlook 2017/18 ISSUE: North Island, March 2018 Current fire danger situation & outlook: Looking back at February, it was a very unsettled month. The tropics directed New
JEFF JOHNSON S Winter Weather Outlook
 JEFF JOHNSON S 2017-2018 Winter Weather Outlook TABLE OF CONTENTS ABOUT THE AUTHOR Components of the seasonal outlook... 2 ENSO state/ocean temperatures... 3 Sub-seasonal outlooks... 4 Forecast models...
ENSO: Recent Evolution, Current Status and Predictions. Update prepared by: Climate Prediction Center / NCEP 30 October 2017
 ENSO: Recent Evolution, Current Status and Predictions Update prepared by: Climate Prediction Center / NCEP 30 October 2017 Outline Summary Recent Evolution and Current Conditions Oceanic Niño Index (ONI)
Precipitation. Standardized Precipitation Index. NIDIS Intermountain West Drought Early Warning System September 5, 2017
 9/6/2017 NIDIS Drought and Water Assessment NIDIS Intermountain West Drought Early Warning System September 5, 2017 Precipitation The images above use daily precipitation statistics from NWS COOP, CoCoRaHS,
Seasonal Climate Watch July to November 2018
 Seasonal Climate Watch July to November 2018 Date issued: Jun 25, 2018 1. Overview The El Niño-Southern Oscillation (ENSO) is now in a neutral phase and is expected to rise towards an El Niño phase through
Monthly Long Range Weather Commentary Issued: May 15, 2014 Steven A. Root, CCM, President/CEO
 Monthly Long Range Weather Commentary Issued: May 15, 2014 Steven A. Root, CCM, President/CEO sroot@weatherbank.com APRIL 2014 REVIEW Climate Highlights The Month in Review The average temperature for
ENSO: Recent Evolution, Current Status and Predictions. Update prepared by: Climate Prediction Center / NCEP 9 November 2015
 ENSO: Recent Evolution, Current Status and Predictions Update prepared by: Climate Prediction Center / NCEP 9 November 2015 Outline Summary Recent Evolution and Current Conditions Oceanic Niño Index (ONI)
ENSO Cycle: Recent Evolution, Current Status and Predictions. Update prepared by Climate Prediction Center / NCEP 23 April 2012
 ENSO Cycle: Recent Evolution, Current Status and Predictions Update prepared by Climate Prediction Center / NCEP 23 April 2012 Outline Overview Recent Evolution and Current Conditions Oceanic Niño Index
PRMS WHITE PAPER 2014 NORTH ATLANTIC HURRICANE SEASON OUTLOOK. June RMS Event Response
 PRMS WHITE PAPER 2014 NORTH ATLANTIC HURRICANE SEASON OUTLOOK June 2014 - RMS Event Response 2014 SEASON OUTLOOK The 2013 North Atlantic hurricane season saw the fewest hurricanes in the Atlantic Basin
Seasonal Climate Watch April to August 2018
 Seasonal Climate Watch April to August 2018 Date issued: Mar 23, 2018 1. Overview The El Niño-Southern Oscillation (ENSO) is expected to weaken from a moderate La Niña phase to a neutral phase through
2013 Summer Weather Outlook. Temperatures, Precipitation, Drought, Hurricanes and why we care
 2013 Summer Weather Outlook Temperatures, Precipitation, Drought, Hurricanes and why we care Role of the ERCOT Meteorologist Forecasts Develop temperature input for hourly load forecasts (next day, days
Weather and Climate Summary and Forecast Summer 2016
 Weather and Climate Summary and Forecast Summer 2016 Gregory V. Jones Southern Oregon University June 6, 2016 May 2016 continued the warm trend for portions of the west, while providing some relief for
UPDATE OF REGIONAL WEATHER AND SMOKE HAZE November 2016
 UPDATE OF REGIONAL WEATHER AND SMOKE HAZE November 2016 1. Review of Regional Weather Conditions in November 2016 1.1 Southwest Monsoon conditions prevailed on most days in October 2016 and the winds were
Seasonal Climate Forecast August October 2013 Verification (Issued: November 17, 2013)
") Seasonal Climate Forecast August October 2013 Verification (Issued: November 17, 2013) Note: This product is published by the Oregon Department of Agriculture (ODA), in cooperation with the Oregon Department
Seasonal Climate Forecast August October 2013 Verification (Issued: November 17, 2013) Note: This product is published by the Oregon Department of Agriculture (ODA), in cooperation with the Oregon Department
Pacific Decadal Oscillation ( PDO ):
:") Time again for my annual Winter Weather Outlook. Here's just a small part of the items I considered this year and how I think they will play out with our winter of 2015-2016. El Nino / La Nina: When looking
Time again for my annual Winter Weather Outlook. Here's just a small part of the items I considered this year and how I think they will play out with our winter of 2015-2016. El Nino / La Nina: When looking
NIDIS Intermountain West Drought Early Warning System October 17, 2017
 NIDIS Drought and Water Assessment NIDIS Intermountain West Drought Early Warning System October 17, 2017 Precipitation The images above use daily precipitation statistics from NWS COOP, CoCoRaHS, and
East Africa The 2015 Season (Long Rains)
") East Africa The 2015 Season (Long Rains) EAST AFRICA SEASONAL ANALYSIS - 2015 HIGHLIGHTS The Long Rains season in the Horn of Africa has come to an end in May. With no further rainfall until the Short
East Africa The 2015 Season (Long Rains) EAST AFRICA SEASONAL ANALYSIS - 2015 HIGHLIGHTS The Long Rains season in the Horn of Africa has come to an end in May. With no further rainfall until the Short
Monthly Overview. Rainfall
 Monthly Overview October started off with the first summer thunderstorms over large parts of the summer rainfall region. Many areas reported 10 mm and more during the first 10 days of the month. Some noticeable
2013 ATLANTIC HURRICANE SEASON OUTLOOK. June RMS Cat Response
 2013 ATLANTIC HURRICANE SEASON OUTLOOK June 2013 - RMS Cat Response Season Outlook At the start of the 2013 Atlantic hurricane season, which officially runs from June 1 to November 30, seasonal forecasts
but 2012 was dry Most farmers pulled in a crop
 After a winter that wasn t, conditions late in the year pointed to a return to normal snow and cold conditions Most farmers pulled in a crop but 2012 was dry b y M i k e Wr o b l e w s k i, w e a t h e
SEASONAL RAINFALL FORECAST FOR ZIMBABWE. 28 August 2017 THE ZIMBABWE NATIONAL CLIMATE OUTLOOK FORUM
 2017-18 SEASONAL RAINFALL FORECAST FOR ZIMBABWE METEOROLOGICAL SERVICES DEPARTMENT 28 August 2017 THE ZIMBABWE NATIONAL CLIMATE OUTLOOK FORUM Introduction The Meteorological Services Department of Zimbabwe
Monthly Long Range Weather Commentary Issued: July 18, 2014 Steven A. Root, CCM, President/CEO
 Monthly Long Range Weather Commentary Issued: July 18, 2014 Steven A. Root, CCM, President/CEO sroot@weatherbank.com JUNE 2014 REVIEW Climate Highlights The Month in Review The average temperature for
IGAD Climate Prediction and and Applications Centre Monthly Bulletin, August May 2015
 . IGAD Climate Prediction and and Applications Centre Monthly Bulletin, August May 2015 For referencing within this bulletin, the Greater Horn of Africa (GHA) is generally subdivided into three sub-regions:
Zambia. General Climate. Recent Climate Trends. UNDP Climate Change Country Profiles. Temperature. C. McSweeney 1, M. New 1,2 and G.
 UNDP Climate Change Country Profiles Zambia C. McSweeney 1, M. New 1,2 and G. Lizcano 1 1. School of Geography and Environment, University of Oxford. 2. Tyndall Centre for Climate Change Research http://country-profiles.geog.ox.ac.uk
The New Normal or Was It?
 The New Normal or Was It? by Chuck Coffey The recent drought has caused many to reflect upon the past and wonder what is in store for the future. Just a couple of years ago, few agricultural producers
ENSO Cycle: Recent Evolution, Current Status and Predictions. Update prepared by Climate Prediction Center / NCEP 5 August 2013
 ENSO Cycle: Recent Evolution, Current Status and Predictions Update prepared by Climate Prediction Center / NCEP 5 August 2013 Outline Overview Recent Evolution and Current Conditions Oceanic Niño Index