Early Summer Heat Waves of 2013
|
|
|
- Audrey Perkins
- 5 years ago
- Views:
Transcription
1 Early Summer Heat Waves of 2013 Abstract: By Richard H. Grumm National Weather Service State College, PA And Trevor Alcott National Weather Service, Salt Lake City Utah From late June into mid-july large ridges brought periods of hot weather to the western and eastern United States. At least twice during the peak of the ridges the 500 hpa heights peaked at or over 6000m. During the third and final phase of the heat waves, the NCEP GEFS predicted a closed 6000m contour over Midwest at 1800 UTC 16 July Meteorologically, 500 hpa heights in excess of 6000 m are rare events. Despite the successful forecasts of 6000 m heights, the heat events of July in the eastern United States did not set many high temperature records. The ridges and warm episodes were all meteorologically and significant events. In the West, the late June ridge and dry air beneath it created ideal conditions for fires. Several fires and one deadly fire made National News as the heat wave in the west peaked. From a forecast perspective, the western ridge and high fire weather threat was well predicted by the larger scale models and the NCEP GEFS. As the ridge become pronounced in the East, it brought warm and relatively wet weather. Both surges of high heights in the East lacked deep low-level warm air. Thus, in the east as the ridge retrograded a plume of deep moisture brought on the western flanks of the system brought heavy rainfall to regions from the East Coast westward to the eastern plains. During the event, the 500 hpa heights peaked at around 6000m. Despite the large ridge in the mid-troposphere, the lowlevel temperature anomalies were generally on the order of +1s above normal. Thus, the event did not break a significant number of high temperature records. All three phases of the event showed how the use of R-Climate data in the forecast process can be of value. They also how these data, when a high impact event is being forecast, provide some confidence information when applied to ensemble forecasts systems. Large anomalies in ensemble forecast require that the system have good agreement on the intensity and location of the event and that these forecast are of a potential significant weather event..
2 1. Overview A series of subtropical ridges brought protracted periods of warm weather to the United States from about 26 June through 18 July The 500 hpa heights and observed Rawinsonde data approached and in some areas reached 6000 m several times during this interval. The first of the large ridges developed over the western United States (Fig. 1). During the period from 26 June through 2 July the 500 hpa heights were above normal over most the western United States, accompanied by above normal temperatures at 850 hpa and the surface. Despite the strong ridge the number of record high temperatures tied or exceeded was relatively low, typically well below 200 records set or tied daily (Table 1). As the ridge built in the western plains and intermountain west in mid to late June, the warm dry air produced nearly ideal conditions for fires. The Rio Grande National forest had several large fires to include a fire which became known as the West Fork fire. This fire made the National News (AP 2013, Huffington Post 2013) as it rapidly grew and damaged private property. The 500 hpa height anomalies peaked in the west in late June 2013 (Fig. 2) and a closed 6000m contour was observed near the four corners area at 1800 UTC 28 June 2013 (Fig. 2c). Beneath the ridge hot dry air provided ideal fire weather conditions. The western fires vaulted into the news when 19 members of an elite firefighting crew were killed battling a fire known as the Yarnell Hill fire in Arizona (UPI 2013) on 30 June Reports suggested triple digit temperatures and strong winds produced the tragic conditions which led to the fatalities. The ridge in the west weakened in early July 2013 and a strong ridge over the western Atlantic retrograded to provide hot humid weather to the Mid-Atlantic region and northeastern United States (Fig. 3). As this ridge retrograded it brought the hot and humid weather into the Great Lakes and Ohio Valley for the period of July 2013 (Fig. 4). As the ridge moved westward the 500 hpa heights at several Rawinsonde heights tied or set all-time 500 hpa height values as several sites achieved 6000 m 500 hpa heights (Table 2). Many sites, not listed, had 500 hpa heights in the 5970 to 5990 m range. In the east the warm humid weather brought locally heavy rainfall. Despite the high 500 hpa heights the heat wave did not break a large number of record high temperatures (Table 1). This paper will examine the large ridges in the early summer of 2013 from a standardized anomaly perspective (Grumm and Hart 2001). Standardize anomalies have proven useful in both forecasting and diagnosing high impact heat events, such as the Central European Heat wave of 2010 (Grumm 2011). Additionally, over the course of the past 14 years, standardized anomalies have proven useful in aiding forecasters in distinguishing high-end weather events. Surges of high precipitable water (PW) accompanied by strong low-level winds with large u- and v-wind anomalies (Stuart and Grumm 2006; Bodner et al 2011;Junker et al 2009;Junker et al
3 2008;Grumm 2011) have been used to diagnose and forecast extreme rainfall events. The same concepts have been applied to significant East Coast snow events (Stuart and Grumm 2007). Many of the aforementioned studies (Graham and Grumm 2011; Hart and Grumm 2001) were biased toward the larger anomalies being associated with deep troughs and cyclonic events. Due to the general lack of large anomalies with anticyclones, heat waves and major heat waves rarely show up in lists of extreme weather events when magnitude of the standardized anomaly is used to identify large events. This implies that the anomalies associated with high impact weather events are skewed and biased toward events with deep cyclones or strong pressure gradients. Heat waves often require a better knowledge of the probability distribution function rather than traditional standardized anomalies to characterize potential record events. In this the heat waves episode of late June and early July 2013 are examined. The larger scale pattern is presented from a standardized anomaly perspective. These data clearly show the successful forecast of the heat waves and large subtropical ridges. A re-analysis based (R- Climate) EFI approach is presented to show how similar to an M-Climate based EFI, R-Climate based EFI indicated that this was an extremely anomalous 500 hpa ridge, despite the modest 500 hpa and 700 hpa height and temperature standardized anomalies respectively. The R-Climate and M-Climate approach offer an opportunity to improve forecasting high impact synoptically forced events and lend themselves well to automate decision support systems applications. 2. Methods and Data The large scale pattern was constructed using the Climate Forecast System (CFFR) data forecasts which were compared to the standardized anomalies for key fields as described by Hart and Grumm (2001). All gridded model and forecast data was plotted using GrADS (Doty and Kinter 1995). Forecasts from the NCEP GEF were used to explore forecasts of the event. The National Climatic Data Center data climate sites were used to determine the number of record high maximums and record high low temperatures tied or exceeded each day. Similarly, the record low minimum and record high minimum data for June and July 2013 were examined. Previous Studies (Grumm et al 2013) show that during large cold outbreaks and heat waves 300 to 400 records tied or broken per day is a good indicator of a significant event. 3. Pattern of the heat wave i. western heat wave The composite pattern associated with the peak period of the western heat wave (Fig. 1) showed the persistent ridge with a closed 5940 m height contour associated with a broad region of +1 to +2s above normal 500 hpa heights (Fig. 1a). Beneath the ridge the 850 hpa temperatures were above normal through the period. The dry air was mainly to the south and east of the ridge (Fig.
4 2c) and moist air was present on the western flanks of the ridge. Weak high pressure was present at the surface. The daily high temperature records set in late June into early August (Fig. 5 & Table 1) indicated that this was the warmest period from late June through late July Over 100 high temperature records were set or tied during the period of 28 June through 2 July Most of these records were set in the western United States. No other period came close to setting as many records. Record events often have 300 to 400 records set or tied on a given day (Grumm et al 2013). The daily 500 hpa heights at 1800 UTC from 26 June through 2 July 2013 (Fig. 2) show the first period when a 5940 m contour appeared at 500 hpa (Fig. 2a) through most of its life cycle. A closed 6000 m contour was present over the Great Basin at 1800 UTC 28 June (Fig. 2c). It is interesting to note that these high heights represented areas of 1 to 2σ above normal height anomalies. The number of record highs set or tied peaked in the western United States on 29 June through 1 July 2013 (Table 1), accounting for the maximum occurring the afternoon before the record observation time. ii. eastern heat wave The eastern heat wave began in early July with the peak in the 500 hpa heights and anomalies spanning 3-7 July (Fig. 3). With the larger scale ridge displaced off the East Coast strong southerly flow on the western flanks of the ridge provide a plume of deep moisture from the eastern Gulf of Mexico into New England (Fig. 3c). The deep moisture plume produced heavy precipitation in general southwest to northeast bands within the plume from the Ohio Valley into New England (Fig. 6). The daily 500 hpa heights and anomalies at 1800 UTC 2-7 July (Fig. 7) show the large ridge off the East Coasts with a closed 5940 m contour throughout the period. The closed 5940m contour is an established feature associated with eastern United States heat waves though historically the close ridge is located over the eastern United States. The eastward position of the ridge axis and the plume of deep moisture likely limited daily maximum temperatures (Table 1 & Fig. 6) over the eastern United States as the eastern heat wave took hold. Additionally, the more easterly flow over the southeastern United States and the cut-off low (Figs. 2 & 4) which drifted from the East Coast to the western plains created are region below normal temperatures in its westward track. During the period of 1-7 July 30 to 73 daily low maximum temperature records were set in the southern United States. During the period of 30 June through 4 July to 188 daily record high minimum temperatures were set or tied in the western United States and the Mid-Atlantic region into New England (Fig. 7). 1 COOP data records are recorded at 1200 UTC so for example the highs on 27 June likely occurred in the afternoon of 26 June.
5 The mid-tropospheric ridge (Fig. 9a-b) reached its broad extent across the United States on 8-9 July 2013 when the 5940m contour encompassed most of the United States. Most of the northern tier of the United States cooled considerably as trough moved across the Great Lakes and New England on July 2013 (Fig. 9c-e). The ridge began to intensify over the northeastern United States (Fig. 8f) and the third and final act of the early summer heat wave began. iii. central heat wave The evolution of the 500 hpa heights and anomalies showed the ridge which developed over New England on 13 July (Fig. 9f) retrograding across the Mid-Atlantic and Ohio Valley from 14 to 18 July During this period several Rawinsonde sites from Albany, NY westward saw 500 hpa heights in soundings approach or reach 6000m (Table 2). The CFSR analyzed a 6000m contour at 1800 UTC 16 July 2013 (Fig. 10c). The as the ridge retrograded the high latitude vortex strengthened and by 19 July 2013 the 500 hpa heights over the United States returned to seasonal normal values, the heat wave ended about 2 days later. Despite the high heights over the Mid-West and consecutive days of temperatures in the 90s over most of the Midwest, few sites set or tied high temperatures during this period (Fig. 6). On most days less than 20 daily records were match or exceeded, as the heights lowered, 28 and 29 high temperature records were set during the afternoon of 24 and 25 July In addition to a period of warm weather over much of the Midwest, the impact of the retrograding ridge included a period of relatively wet weather over much of the central United States (Fig. 11). The wettest region extended from the eastern Gulf Coast into Ohio. The retrograding moisture plume produced locally heavy rain in New England. The relatively dry eastern plains and western Lakes region (Fig. 6) became relatively wet. Most of the region received 100 mm or more precipitation during over the 10 day period. 4. Forecasts i. Western ridge GEFS forecasts of the 500 hpa heights and 700 hpa temperatures (Figs. 12 & 13) show that the GEFS was able to predict the larger ridge over the western United States with at least 6 days of lead time. Due to model convergence the solutions of shorter forecast length show slightly higher anomalies. These data show suggest that displays of R-climate and forecast data have built-in confidence information. Strong signals appear at longer forecasts ranges when there is good agreement between members of the EFS; agreement on location; and a high threat of a high impact event between in many of the EFS members. ii. Eastern Ridge peak
6 The eastern heat wave forecasts focus on the arrival of the warm humid weather in the east with forecast valid at 1800 UTC 4 July 2013 (Fig. 14). These data show the strong ridge along and just off the East Coast and the deep trough over the southern plains. Both features were relatively well forecast. The 700 hpa forecasts (Fig. 15) show the general area of +1s above normal temperatures along the East Coast and the -1 to -3s anomalies with the trough over the southern Plains. Missing in the East with this event were above +2 to +3s above normal 850 and 700 hpa temperatures, features typically associated with record heat events. iii. Central ridge peak Forecasts of the ridge as it peaked over the Ohio Valley, and close to the time where many sites experienced 500 hpa heights in the 5970 to 6000 m range, is shown in Figure 16. These data show that the short-range GEFS had a small 6000 m contour in the 21-member mean from forecasts issued at 1200 UTC 16 July. Overall the 500 hpa ridge was well predicted though forecasts issued at 1200 UTC 10 July imply there was disagreement between members related to the location of the ridge and the intensity of the ridge. The forecasts from 1200 UTC 11 July onward showed general agreement with location and intensity and thus the standardized anomalies were relatively good relative to the CFSR. Despite the large area covered by the 5940m contour and the presence of the 6000 m contour, the 850 hpa (not shown) and 700 hpa temperature anomalies were not in the +2 to +3s range as often observed in significant heat waves (Fig. 17). 5. Conclusions A large subtropical ridge developed over the western United States in late June A second larger ridge developed over the western Atlantic in early July, this feature retrograded producing an enduring period of wet hot weather over the Mid-Atlantic and Northeastern United States before retrograding and producing similar weather in the central United States. The ridges produced 3 heat waves of 3 regions of the United States during the first days of the summer. The western ridge produced a heat wave from 26 June through about 2 July The high heights, high temperatures, and relatively dry air on south and east of the ridge produced nearly ideal conditions for fire weather. Several fires were new worthy due to their size such as the West Fork, CO fire and the associated loss of human life in the Yarnell, AZ fire. Despite the larger ridge and the 500 hpa heights exceeding 6000 m a relatively low amount of record temperatures were set during the western heat wave. Additionally, despite how uncommon 6000 m heights are at 500 hpa the 500 hpa height anomalies were nothing out of the ordinary. This suggests standardized anomalies are of limited value in characterizing larger ridges and features often associated with heat waves.
7 The eastern heat wave was associated with a strong ridge over the adjacent western Atlantic. A closed 5940 m contour was associated with the ridge. The plume of deep moisture along the western flanks of the ridge likely contributed to the dearth of high temperature records set during the heat wave and the larger area of relatively high rain observed over the eastern United States form late June into early July. The central heat wave was associated with the retrogression of the ridge over the northeastern United States around 13 July. As the ridge retrograded, several Rawinsonde sites record 500 hpa heights over 6000 m and the CFSR analyzed a close 6000 m contour over the Midwest. The 6000 m contour at 500 hpa is a rare event. Despite its rarity, the standardized anomalies associated with this feature were on the order of +2 to +3σ above normal. The skewed nature of the 500 hpa heights toward deep troughs makes diagnosing heat wave features problematic. The PDF is likely required to address the rarity of extreme heights during strong anticyclone events. Despite the extreme heights in the ridge and a pattern that implied a significant heat wave, why the heat wave in the eastern United States did not set a significant number of temperature records may be related to: the source air was warm and moist and soundings lacked a deep elevated mix layer typically associated with larger heat waves with air of more continental origins; height anomalies were large from 1000 hpa to 250 hpa and heights exceeded 5940 m to 6000 m at 500 hpa the high heights at lower-levels implied a westward shift in subtropical ridge over the western Atlantic; the air mass was warmer at midlevels relative to lower levels; the presence tropical air from the western Atlantic over the East Coast at the height of the event; and the lack of significant hpa thickness anomalies. The areas of heavy rainfall also imply a wet airmass which likely limited the ability to achieve many record high temperatures. Record high temperatures are difficult to achieve during wet periods. Forecast showed that the 3 phases of the heat wave were generally well predicted by the NCEP 21- member GEFS. These forecasts also implied that the R-climate data contains some useful information related to confidence in the forecasts. When the R-climate data provide signals at longer forecasts ranges then there is likely good agreement between members of the EFS; agreement on location; and good agreement about the threat of a high impact event. The missing piece may be that when there are no significant anomalies is the issue the lack of a significant weather event or large spread. This makes some knowledge of the PDF a crucial part of the forecast process. 6. Acknowledgements 7. References Associated Press, 2013: Wildfire roundup: West Fork Fire likely will burn for months officials say 25 June And similar stories 25 June to 2 July United Press International, 2013: New details released of Arizona fire that killed 19 firefighters. 16 July 2013.
8 Huffington Post 2013: West Fork Fire Continues to grow in southern Colorado and similar stores 27 June through 2 July Bodner, M. J., N. W. Junker, R. H. Grumm, and R. S. Schumacher, 2011: Comparison of atmospheric circulation patterns during the 2008 and 1993 historic Midwest floods. Natl. Wea. Dig., 35, Doty, B.E. and J.L. Kinter III, 1995: Geophysical Data Analysis and Visualization using GrADS. Visualization Techniques in Space and Atmospheric Sciences, eds. E.P. Szuszczewicz and J.H. Bredekamp, NASA, Washington, D.C., Grumm, RH, J Arnott, and J. Halblaub, 2013: The Epic North American Warm Episode of March 2012 accepted Journal of Operational Meteorology. Grumm, R.H. 2011: New England Record Maker rain event of March NWA, Electronic Journal of Operational Meteorology, EJ4. Graham, R A. and R. H. Grumm, 2010: Utilizing Normalized Anomalies to Assess Synoptic-Scale Weather Events in the Western United States. Wea. Forecasting, 25, Grumm, R.H. and R. Hart. 2001: Standardized Anomalies Applied to Significant Cold Season Weather Events: Preliminary Findings. Wea. and Fore., 16, Grumm, Richard H., 2011: The Central European and Russian Heat Event of July August Bull. Amer. Meteor. Soc., 92, Hart, R. E., and R. H. Grumm, 2001: Using normalized climatological anomalies to rank synoptic scale events objectively. Mon. Wea. Rev., 129, Junker, N.W, M.J.Brennan, F. Pereira,M.J.Bodner,and R.H. Grumm, 2009:Assessing the Potential for Rare Precipitation Events with Standardized Anomalies and Ensemble Guidance at the Hydrometeorological Prediction Center. Bulletin of the American Meteorological Society,4 Article: pp Junker, N. W., R. H. Grumm, R. Hart, L. F. Bosart, K. M. Bell, and F. J. Pereira, 2008: Use of standardized anomaly fields to anticipate extreme rainfall in the mountains of northern California. Wea. Forecasting,23, Knight, P., J. Ross, B. Root, G.S. Young, R.H. Grumm, 2005: Fingerprinting significant weather events. Proceedkngs of the Fourth Conference on Artificial Intelligence, San Diego, CA, January 9-13, Stuart, N. and R. Grumm 2009, "The Use of Ensemble and Anomaly Data to Anticipate Extreme Flood Events in the Northeastern United States",NWA Digest,33, Stuart, N. and R. Grumm 2009, "The Use of Ensemble and Anomaly Data to Anticipate Extreme Flood Events in the Northeastern United States", 33, Stuart,N.A and R.H. Grumm 2007: Using Wind Anomalies to Forecast East Coast Winter Storms.Wea. and Forecasting, 21,
9
 mean 500 hpa heights and anomalies, b)")
10 Figure 1. The CFSR composite mean for the period of 1800 UTC 26 June through 1800 UTC 3 July 2013 showing a) mean 500 hpa heights and anomalies, b) 850 hpa temperatures and anomalies, c) precipitable water and anomalies, and d) mean sea-level pressure and anomalies. Return to text.
11 Figure 2. CFSR showing the 500 hpa heights and 500 hpa height anomalies. at 1800 UTC from a) 26 June through f) 01 July Return to text.

12 Figure 3. As in Figure 1 except for the period of 1800 UTC 3 July 2013 through 1800 UTC 7 July Return to text..

13 Figure 4.. As in Figure 1 except for the period of 1800 UTC 13 July 2013 through 1800 UTC 18 July Return to text.
14 High Maximum Temperatures Column1 Column2 Column3 Column4 Column5 Date New Records Ties Sums # of Possible Records Locations 27-Jun AK; Southwest 28-Jun West 29-Jun TX; west 30-Jun West; TX 1-Jul west 2-Jul west 3-Jul west 4-Jul west 5-Jul CA, ME 6-Jul northeast 7-Jul southwest 8-Jul northeast and southwest 9-Jul central US 10-Jul central US 11-Jul west 12-Jul central US 13-Jul NE 14-Jul central US 15-Jul Jul northeast 17-Jul northeast, great lakes 18-Jul northeast, great lakes 19-Jul mid Atlantic 20-Jul northeast 21-Jul west 22-Jul west 23-Jul West 24-Jul southwest 25-Jul northwest Table 1. NCDC data showing by date the new records set, old records tied, and the total number of records on each day. The data also include the number of possible records along with a geographic region were all or most records were set. Return to text.
15 Figure 5. Number of record high temperatures tied (red), set (blue) and total records tied or set for the period of 27 June through 31 July Note high temperatures normally occur the afternoon before the record observation time. Return to text.

16 Figure 6. Total estimated rainfall from Stage-IV rainfall data focused over the eastern United States summed for the period of 0000 UTC 26 June through 0000 UTC 13 July Return to text.
17 Figure 7. As in Figure 2 except for the period of 1800 UTC 2-7 July Return to text.
18 Figure 8. As in Figure 6 except showing the number of record high minimum temperatures. Return to text.

19 Figure 9. As in Figure 2 except for 1800 UTC 8-13 July Return to text. NWS State College Case Examples
20 Figure 10. As in Figure 9 except for valid 1800 UTC July Return to text.

21 Figure 11. As in Figure 6 except for 0000 UTC July Return to text.
22
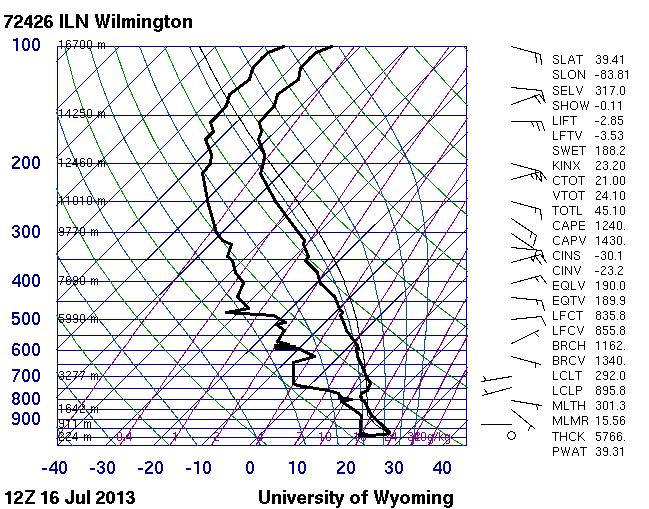
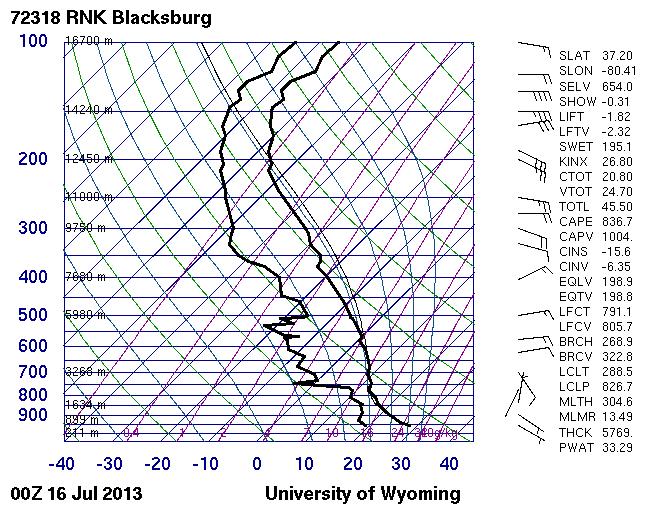
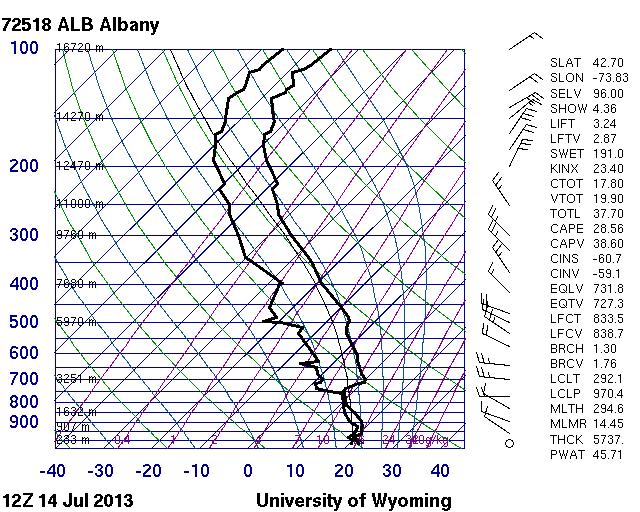
23 Station Date Time (UTC) 500 hpa height (m) Pittsburgh,PA 14-Jul Pittsburgh,PA 14-Jul Pittsburgh,PA 15-Jul Pittsburgh,PA 15-Jul Pittsburgh,PA 16-Jul Pittsburgh,PA 16-Jul Wilmington,OH 14-Jul Wilmington,OH 14-Jul Wilmington,OH 15-Jul Wilmington,OH 15-Jul Wilmington,OH 16-Jul Wilmington,OH 16-Jul Albany, NY 14-Jul Albany, NY 14-Jul Albany, NY 15-Jul Albany, NY 15-Jul 12 M Albany, NY 16-Jul Albany, NY 16-Jul White Lake,MI 14 Jul White Lake,MI 14 Jul White Lake,MI 15 Jul White Lake,MI 15 Jul White Lake,MI 16 Jul White Lake,MI 16 Jul Table 2. Select sites showing 500 hpa heights (m) for dates near when the values peaked. Listed data and sounding courtesy of the University of Wyoming Sounding site. Many other sites peaked over 5970 m and are not shown such as KOKX (5980m), KBUF (5990), KRNK (5990), and KILX (5990). Return to text.
24 Figure 12. GEFS forecasts of 500 hpa heights and height anomalies computed from the ensemble mean valid at 1800 UTC 28 June 2013 from GEFS forecasts initialized at 1200 UTC daily from a) 23 June 2013 through f) 28 June Return to text.
25 Figure 13. As in Figure 12 except for GEFS 700 hpa temperatures and temperature anomalies. Return to text.
26 Figure 14. As in Figure 12 except valid at 1800 UTC 4 July 2013 from forecasts produced from 1200 UTC a) 28 June through f) 4 July Return text.

27 Figure 15. As in Figure 14 except for 700 hpa temperatures. Return to text.
28 Figure 16. As in Figure 12 except valid at 1800 UTC 16 July 2013 from forecasts produced from 1200 UTC a) 10 July through f) 16 July Return text.
29 Figure 17. As in Figure 16 except for 700 hpa temperatures. Return to text.
Alaskan heat episode of June 2013-Draft
 Alaskan heat episode of 16-19 June 2013-Draft Abstract: By Trevor Alcott National Weather Service Western Region, Salt Lake City UT And Richard H. Grumm National Weather Service State College, PA A strong
Pre-Christmas Warm-up December 2013-Draft
 Pre-Christmas Warm-up 21-23 December 2013-Draft By Richard H. Grumm National Weather Service State College, PA 1. Overview A large ridge over the west-central Atlantic (Fig.1) and trough moving into eastern
Impacts of the April 2013 Mean trough over central North America
 Impacts of the April 2013 Mean trough over central North America By Richard H. Grumm National Weather Service State College, PA Abstract: The mean 500 hpa flow over North America featured a trough over
The Big Chill of November 2013
 The Big Chill of November 2013 Value of anomalies for situational awareness By Richard H. Grumm National Weather Service State College, PA Trevor Alcott National Weather Service, Salt Lake City UT 1. Overview
2 July 2013 Flash Flood Event
 2 July 2013 Flash Flood Event By Richard H. Grumm and Charles Ross National Weather Service State College, PA 1. Overview A retrograding 500 hpa cyclone and anticyclone (Fig. 1) set up deep southerly flow
Early May Cut-off low and Mid-Atlantic rains
 Abstract: Early May Cut-off low and Mid-Atlantic rains By Richard H. Grumm National Weather Service State College, PA A deep 500 hpa cutoff developed in the southern Plains on 3 May 2013. It produced a
Memorial Day Weekend 2013: Snow and Cold
 Abstract: Memorial Day Weekend 2013: Snow and Cold By Richard H. Grumm National Weather Service State College, PA A slow moving 500 hpa low and associated unseasonably cold air in the lower troposphere
A summary of the heat episodes of June 2017
 A summary of the heat episodes of June 2017 By Richard H. Grumm and Elissa A. Smith National Weather Service State College, PA 1. Overview Over 1800 record high temperatures were set or tied during the
National Weather Service-Pennsylvania State University Weather Events
 National Weather Service-Pennsylvania State University Weather Events Abstract: Tropical Storm Debbie, standardized anomalies and heavy rainfall by Richard H. Grumm National Weather Service State College
Eastern United States Wild Weather April 2014-Draft
 1. Overview Eastern United States Wild Weather 27-30 April 2014-Draft Significant quantitative precipitation bust By Richard H. Grumm National Weather Service State College, PA and Joel Maruschak Over
Southern United States Heavy rain and flood event 6-8 April 2014
 Southern United States Heavy rain and flood event 6-8 April 2014 By Richard H. Grumm National Weather Service State College, PA 1. Overview Heavy rainfall (Fig. 1) affected the southern United States from
Tropical Storm Hermine: Heavy rainfall in western Gulf By Richard H. Grumm National Weather Service Office State College, PA 16803
 Tropical Storm Hermine: Heavy rainfall in western Gulf By Richard H. Grumm National Weather Service Office State College, PA 16803 1. INTRODUCTION Tropical storm Hermine, the eighth named tropical system
National Weather Service-Pennsylvania State University Weather Events
 National Weather Service-Pennsylvania State University Weather Events Abstract: West Coast Heavy Precipitation Event of January 2012 by Richard H. Grumm National Weather Service State College PA 16803
Southern Plains Heavy rain and Flooding
 Abstract: Southern Plains Heavy rain and Flooding By Richard H. Grumm National Weather Service State College, PA A severe weather event affected the southern Plains on 31 May 2013. The severe weather event
Multi-day severe event of May 2013
 Abstract: Multi-day severe event of 18-22 May 2013 By Richard H. Grumm and Charles Ross National Weather Service State College, PA A relatively slow moving Trough over the western United States and a ridge
Mid-West Heavy rains 18 April 2013
 Abstract: Mid-West Heavy rains 18 April 2013 By Richard H. Grumm and Charles Ross National Weather Service State College, PA The relatively wet conditions during the first 16 days of April 2013 set the
Winter Storm of 15 December 2005 By Richard H. Grumm National Weather Service Office State College, PA 16803
 Winter Storm of 15 December 2005 By Richard H. Grumm National Weather Service Office State College, PA 16803 1. INTRODUCTION A complex winter storm brought snow, sleet, and freezing rain to central Pennsylvania.
Convective Heavy rainfall event of 23 July 2013
 Convective Heavy rainfall event of 23 July 2013 By Richard H. Grumm and Charles Ross National Weather Service State College, PA Abstract: A record rain event affected southern Lebanon County on 23 July
National Weather Service-Pennsylvania State University Weather Events
 National Weather Service-Pennsylvania State University Weather Events New Zealand heavy rain and flood event-draft by Richard H. Grumm National Weather Service State College PA 16803 Abstract:. A record
Heavy rains and precipitable water anomalies August 2010 By Richard H. Grumm And Jason Krekeler National Weather Service State College, PA 16803
 Heavy rains and precipitable water anomalies 17-19 August 2010 By Richard H. Grumm And Jason Krekeler National Weather Service State College, PA 16803 1. INTRODUCTION Heavy rain fell over the Gulf States,
Heavy Rainfall Event of June 2013
 Heavy Rainfall Event of 10-11 June 2013 By Richard H. Grumm National Weather Service State College, PA 1. Overview A 500 hpa short-wave moved over the eastern United States (Fig. 1) brought a surge of
National Weather Service-Pennsylvania State University Weather Events
 National Weather Service-Pennsylvania State University Weather Events Eastern United States Winter Storm and Severe Event of 28-29 February 2012 by Richard H. Grumm National Weather Service State College
Eastern United States Winter Storm of 1-2 February 2015-DRAFT Northeast Ground Hog Storm
 Eastern United States Winter Storm of 1-2 February 2015-DRAFT Northeast Ground Hog Storm By Richard H. Grumm National Weather Service State College, PA 1. Overview A major Winter Storm brought precipitation
Mid-Atlantic Ice Storm 4 March 2015
 1. Overview Mid-Atlantic Ice Storm 4 March 2015 By Richard H. Grumm National Weather Service State College, PA A large 500 hpa ridge over the southern United States (Fig. 1a-e)) built into the Mid-Atlantic
Southern Heavy rain and floods of 8-10 March 2016 by Richard H. Grumm National Weather Service State College, PA 16803
 Southern Heavy rain and floods of 8-10 March 2016 by Richard H. Grumm National Weather Service State College, PA 16803 1. Introduction Heavy rains (Fig. 1) produced record flooding in northeastern Texas
Snow, freezing rain, and shallow arctic Air 8-10 February 2015: NCEP HRRR success story
 Snow, freezing rain, and shallow arctic Air 8-10 February 2015: NCEP HRRR success story By Richard H. Grumm National Weather Service State College, PA 1. Overview A short-wave (Fig. 1) moved over the strong
Deep Cyclone and rapid moving severe weather event of 5-6 June 2010 By Richard H. Grumm National Weather Service Office State College, PA 16803
 Deep Cyclone and rapid moving severe weather event of 5-6 June 2010 By Richard H. Grumm National Weather Service Office State College, PA 16803 1. INTRODUCTION A rapidly deepening surface cyclone raced
NWS-PSU Case Study Site 2010 Severe Weather Case
 NWS-PSU Case Study Site 2010 Severe Weather Case New Years Eve Severe Weather Event of 31 December 2010 by Richard H. Grumm National Weather Service State College PA 16083 Abstract: A surge of warm humid
Heat wave ending severe events of July 2010 By Richard H. Grumm National Weather Service Office State College, PA 16803
 Heat wave ending severe events of 23-25 July 2010 By Richard H. Grumm National Weather Service Office State College, PA 16803 1. INTRODUCTION A strong subtropical ridge (Fig. 1a) dominated the eastern
1. INTRODUCTION. March. Local time used in text to define dates. 1 Due to UTC time the went passed 0000 UTC 31
 New England Record Maker Rain Event of 29-30 March 2010 By Richard H. Grumm National Weather Service Contributions by Frank Nocera National Weather Service Office Taunton, MA 1. INTRODUCTION The second
National Weather Service-Pennsylvania State University Weather Events
 National Weather Service-Pennsylvania State University Weather Events Heavy rainfall of 23 November 2011 by Richard H. Grumm National Weather Service State College PA 16803 Abstract:. A fast moving mid-tropospheric
Northeastern United States Snowstorm of 9 February 2017
 Northeastern United States Snowstorm of 9 February 2017 By Richard H. Grumm and Charles Ross National Weather Service State College, PA 1. Overview A strong shortwave produced a stripe of precipitation
Warm Episode of December 2015:
 Warm Episode of 11-16 December 2015: Record Warmth over Mid-Atlantic Region By Richard H. Grumm National Weather Service State College, PA 1. Overview A strong 500 hpa ridge over the eastern United States
The Devastating Western European Winter Storm February 2010 By Richard H. Grumm National Weather Service
 The Devastating Western European Winter Storm 27-28 February 2010 By Richard H. Grumm National Weather Service 1. INTRODUCTION A strong late winter storm, called Xynthia 1, raced across Western Europe
Southern United States Winter Storm of 28 January 2014-v1. High Impact Snow on Edge of Forecast Precipitation Shield
 Southern United States Winter Storm of 28 January 2014-v1 High Impact Snow on Edge of Forecast Precipitation Shield by Richard H. Grumm National Weather Service State College, PA 16803 and 1. Introduction
The North American Heat Wave of July 2011-Draft
 The North American Heat Wave of July 2011-Draft By Richard H. Grumm And Jason Krekeler 328 Innovation Blvd Suite 330 National Weather Service Office State College, PA 16803 The meteorological conditions
National Weather Service-Pennsylvania State University Weather Events
 National Weather Service-Pennsylvania State University Weather Events Heavy Rain 7-8 December 2011 by Richard H. Grumm National Weather Service State College PA 16803 Abstract:. A mid-level short-wave
New Zealand Heavy Rainfall and Floods
 New Zealand Heavy Rainfall and Floods 1. Introduction Three days of heavy rainfall associated with a deep upper-level low (Fig. 1) brought flooding to portions of New Zealand (Fig. 2). The flooding was
National Weather Service-Pennsylvania State University Weather Events
 National Weather Service-Pennsylvania State University Weather Events The high latitude Eurasian Anticyclone of January-February 2012 by Richard H. Grumm National Weather Service State College PA 16803
The Deep South snowfall of February 2010 By Richard H. Grumm National Weather Service Office, State College, PA 16803
 The Deep South snowfall of 11-13 February 2010 By Richard H. Grumm National Weather Service Office, State College, PA 16803 1. INTRODUCTION A surface cyclone tracked across Mexico and the Gulf of Mexico
Indiana County Flash Flood of 22 June 2017
 Indiana County Flash Flood of 22 June 2017 By Richard H. Grumm National Weather Service State College, PA 1. Overview Slow moving thunderstorms brought 3 to 4 inches of rainfall to Indiana County, PA during
1. INTRODUCTION. For brevity times are referred to in the format of 20/1800 for 20 August UTC. 3. RESULTS
 Heavy rains and precipitable water anomalies 20-23 August 2010-Draft By Jason Krekeler And Richard Grumm National Weather Service State College, PA 16803 1. INTRODUCTION Heavy rain fell across the central
Hurricane Harvey the Name says it all. by Richard H. Grumm and Charles Ross National Weather Service office State College, PA
 Hurricane Harvey the Name says it all by Richard H. Grumm and Charles Ross National Weather Service office State College, PA 16803. 1. Overview Hurricane Harvey crossed the Texas coast (Fig. 1) as a category
This paper will document the pattern which produced the record rainfall of 30 September The goal is to show the pattern the
 The Historic Synoptic-Hybrid rainfall event 30 September 2010 By Richard Grumm And Michael Kozar National Weather Service State College, PA 16803 1. INTRODUCTION A slow moving north-south oriented frontal
The southern express: Winter storm of January 2010 By Richard H. Grumm National Weather Service
 The southern express: Winter storm of 28-30 January 2010 By Richard H. Grumm National Weather Service 1. INTRODUCTION A storm system of Pacific origin tracked across the southern United States from 27-31
Warm Episode over Indian Sub-continent March 2010 By Richard Grumm National Weather Service State College Contributions by Lance Bosart SUNY Albany
 Warm Episode over Indian Sub-continent March 2010 By Richard Grumm National Weather Service State College Contributions by Lance Bosart SUNY Albany 1. INTRODUCTION A massive subtropical ridge formed over
The high latitude blocking and impacts on Asia
 The high latitude blocking and impacts on Asia By Richard H. Grumm National Weather Service Office State College, PA 16803 1. INTRODUCTION An episode of high latitude blocking during the month of December
1995 and 1980 (exact dates would be useful). 1. INTRODUCTION
. 1. INTRODUCTION") Alaskan Autumn Storm of 22-24 November 2010 By Richard Grumm National Weather Service State College, PA 16803 and Rick Thoman and James A. Nelson National Weather Service Alaska Region 1. INTRODUCTION
Alaskan Autumn Storm of 22-24 November 2010 By Richard Grumm National Weather Service State College, PA 16803 and Rick Thoman and James A. Nelson National Weather Service Alaska Region 1. INTRODUCTION
1. INTRODUCTION. Hellström, SMHI. This includes all record highs and dates for Sweden. 2 Data provided by Jari Tuovinen, Helsinki, Finland.
 European Heat Event of July 2010 By Richard H. Grumm National Weather Service State College, PA 16803 Contributions by Jari Tuovinen Finnish Meteorological Institute 1. INTRODUCTION A significant heat
Winter Storm of February 2008 By Richard H. Grumm National Weather Service Office State College PA 16803
 1. INTRODUCTION Winter Storm of 11-13 February 2008 By Richard H. Grumm National Weather Service Office State College PA 16803 A potent winter storm brought snow, sleet, freezing rain, and rain to the
Thanksgiving Eve snow of November 2014
 1. Overview Thanksgiving Eve snow of 26-27 November 2014 By Richard H. Grumm National Weather Service State College, PA An early season east coast winter storm (ECWS: DeGaetano et al. 2002) brought snow
Hurricane Alex: Heavy rainfall and anomalous precipitable water By Richard H. Grumm National Weather Service Office State College, PA 16803
 Hurricane Alex: Heavy rainfall and anomalous precipitable water By Richard H. Grumm National Weather Service Office State College, PA 16803 1. INTRODUCTION Hurricane Alex ambled across the Gulf of Mexico
2. Methods and data. 1 NWS Reno, NV report circulated in the LA Times story maximum wind was observed at 0900 AM 8 January 2017.
 The California Extreme Precipitation Event of 8-10 January 2017 By Richard H. Grumm and Charles Ross National Weather Service State College, PA 16803 1. Introduction A strong Pacific jet and a surge of
Flooding and Severe weather of 27 June 2013
 Flooding and Severe weather of 27 June 2013 By Richard H. Grumm National Weather Service State College, PA 1. Overview Flooding and severe weather affected Pennsylvania on 27 June 2013 (Fig 1). The severe
National Weather Service-Pennsylvania State University Weather Events
 National Weather Service-Pennsylvania State University Weather Events Historic Ohio Valley January Severe weather and Tornado Event by Richard H. Grumm National Weather Service State College PA 16803 and
Record snow blankets the United Kingdom 5-6 January 2010
 1. INTRODUCTION Record snow blankets the United Kingdom 5-6 January 2010 By Richard H. Grumm National Weather Service Office State College, PA 16803 A rare winter storm brought heavy snow the United Kingdom
Monthly Long Range Weather Commentary Issued: APRIL 18, 2017 Steven A. Root, CCM, Chief Analytics Officer, Sr. VP,
 Monthly Long Range Weather Commentary Issued: APRIL 18, 2017 Steven A. Root, CCM, Chief Analytics Officer, Sr. VP, sroot@weatherbank.com MARCH 2017 Climate Highlights The Month in Review The average contiguous
5A.3 THE USE OF ENSEMBLE AND ANOMALY DATA TO ANTICIPATE EXTREME FLOOD EVENTS IN THE NORTHEASTERN U.S.
 5A.3 THE USE OF ENSEMBLE AND ANOMALY DATA TO ANTICIPATE EXTREME FLOOD EVENTS IN THE NORTHEASTERN U.S. Neil A. Stuart(1), Richard H. Grumm(2), John Cannon(3), and Walt Drag(4) (1)NOAA/National Weather Service,
Weather and Climate Summary and Forecast January 2018 Report
 Weather and Climate Summary and Forecast January 2018 Report Gregory V. Jones Linfield College January 5, 2018 Summary: A persistent ridge of high pressure over the west in December produced strong inversions
1. INTRODUCTION. The super storm of March 1993 produced severe weather and tornadoes as it s trailing cold front pushed through Florida (Kocin eta 1l
 1. INTRODUCTION Super Tuesday and awful Wednesday: the 5-6 February 2008 Severe Weather Outbreak By Richard H. Grumm National Weather Service State College, PA And Seth Binau National Weather Service,
Orographically enhanced heavy rainfall of 23 May 2010 By Richard H. Grumm National Weather Service Office State College, PA 16803
 Orographically enhanced heavy rainfall of 23 May 2010 By Richard H. Grumm National Weather Service Office State College, PA 16803 1. INTRODUCTION During the overnight hours and into the early morning of
Monthly Long Range Weather Commentary Issued: February 15, 2015 Steven A. Root, CCM, President/CEO
 Monthly Long Range Weather Commentary Issued: February 15, 2015 Steven A. Root, CCM, President/CEO sroot@weatherbank.com JANUARY 2015 Climate Highlights The Month in Review During January, the average
National Weather Service-Pennsylvania State University Weather Events
 National Weather Service-Pennsylvania State University Weather Events The February Thaw 17-19 February 2011 by Richard H. Grumm National Weather Service State College PA 16803 Abstract: After a cold January
Utilizing Ensemble-based Anomalies to Anticipate Significant Events A New Display Tool
 Utilizing Ensemble-based Anomalies to Anticipate Significant Events A New Display Tool Randy Graham 1, Rich Grumm 2, Nanette Hosenfeld 1, Trevor Alcott 3 1 NOAA/NWS Salt Lake City UT 2 NOAA/NWS State College
NCEP Short-Range Ensemble forecasts of an historic rainfall event: The June 2006 East Coast Floods 1. INTRODUCTION
 NCEP Short-Range Ensemble forecasts of an historic rainfall event: The 23-27 June 2006 East Coast Floods By Richard H. Grumm National Weather Service Office, State College PA 16803 And Norman W. Junker
New England Record Maker Rain Event of March 2010
 National Weather Association, Electronic Journal of Operational Meteorology, 2011-EJ4 New England Record Maker Rain Event of 29-30 March 2010 RICHARD H. GRUMM National Weather Service, State College, PA
The historic warm episode of February 2017
 The historic warm episode of February 2017 By Richard H. Grumm National Weather Service State College, PA 1. Overview A winter warm episode brought an extended period of record and near record warmth to
Mid-Atlantic Severe Weather Event of 23 June 2015
 Mid-Atlantic Severe Weather Event of 23 June 2015 By Richard H. Grumm National Weather Service State College, PA 1. Overview A widespread severe weather event occurred in the eastern United States on 23
Recent Trends in Northern and Southern Hemispheric Cold and Warm Pockets
 Recent Trends in Northern and Southern Hemispheric Cold and Warm Pockets Abstract: Richard Grumm National Weather Service Office, State College, Pennsylvania and Anne Balogh The Pennsylvania State University
Heavy Rainfall and Flooding of 23 July 2009 By Richard H. Grumm And Ron Holmes National Weather Service Office State College, PA 16803
 Heavy Rainfall and Flooding of 23 July 2009 By Richard H. Grumm And Ron Holmes National Weather Service Office State College, PA 16803 1. INTRODUCTION Heavy rains fall over Pennsylvania and eastern New
Monthly Long Range Weather Commentary Issued: APRIL 1, 2015 Steven A. Root, CCM, President/CEO
 Monthly Long Range Weather Commentary Issued: APRIL 1, 2015 Steven A. Root, CCM, President/CEO sroot@weatherbank.com FEBRUARY 2015 Climate Highlights The Month in Review The February contiguous U.S. temperature
The Spring Storm of April 2007 By Richard H. Grumm National Weather Service Office State College PA 16803
 The Spring Storm of 13-16 April 2007 By Richard H. Grumm National Weather Service Office State College PA 16803 1. INTRODUCTION A major spring storm struck the eastern United States from 13 through 16
09 December 2005 snow event by Richard H. Grumm National Weather Service Office State College, PA 16803
 09 December 2005 snow event by Richard H. Grumm National Weather Service Office State College, PA 16803 1. INTRODUCTION A winter storm produced heavy snow over a large portion of Pennsylvania on 8-9 December
Will Tropical Storm Sandy become the Storm of the 21 st Century?
 Will Tropical Storm Sandy become the Storm of the 21 st Century? By Richard H. Grumm National Weather Service State College, PA 16803 Contributions by Craig Evanego Abstract The interaction with tropical
Mid Atlantic Severe Event of 1 May 2017 Central Pennsylvania QLCS event By Richard H. Grumm National Weather Service, State College, PA 16803
 1. Overview Mid Atlantic Severe Event of 1 May 2017 Central Pennsylvania QLCS event By Richard H. Grumm National Weather Service, State College, PA 16803 A strong upper-level wave (Fig.1) moving into a
The high latitude blocking and low arctic oscillation values of December 2009
 The high latitude blocking and low arctic oscillation values of December 2009 By Richard H. Grumm National Weather Service Office State College, PA 16803 1. INTRODUCTION An episode of high latitude blocking
Eastern United States Anafrontal Snow 4-5 March 2015-Draft
 Eastern United States Anafrontal Snow 4-5 March 2015-Draft By Richard H. Grumm National Weather Service State College, PA 1. Overview A 500 hpa ridge over the western Atlantic (Fig. 1) and an approaching
Devastating Tornadoes of 22 May 2011-Draft by Richard H. Grumm National Weather Service State College, PA
 Abstract: Devastating Tornadoes of 22 May 2011-Draft by Richard H. Grumm National Weather Service State College, PA A series of tornadoes struck the central United States on Sunday 22 May 2011. Tornadoes
National Wildland Significant Fire Potential Outlook
 National Wildland Significant Fire Potential Outlook National Interagency Fire Center Predictive Services Issued: September, 2007 Wildland Fire Outlook September through December 2007 Significant fire
Weather and Climate Summary and Forecast August 2018 Report
 Weather and Climate Summary and Forecast August 2018 Report Gregory V. Jones Linfield College August 5, 2018 Summary: July 2018 will likely go down as one of the top five warmest July s on record for many
Mid Atlantic Heavy rainfall event 1. Overview 2. Methods and Data 3. Pattern
 1. Overview Mid Atlantic Heavy rainfall event With an inertial gravity wave? By Richard H. Grumm National Weather Service, State College, PA 16803 Contributions from the Albany MAP An unseasonably strong
Patterns of Heavy rainfall in the Mid-Atlantic Region 1. INTRODUCTION
 5A.2 Patterns of Heavy rainfall in the Mid-Atlantic Region by Richard H. Grumm * And Ron Holmes National Weather Service Office State College, PA 16802 1. INTRODUCTION The patterns associated with heavy
Weather and Climate Summary and Forecast March 2019 Report
 Weather and Climate Summary and Forecast March 2019 Report Gregory V. Jones Linfield College March 2, 2019 Summary: Dramatic flip from a mild winter to a top five coldest February on record in many locations
The Devastating Mid-Mississippi Valley Floods of 1-2 May 2010 By Richard H. Grumm National Weather Service
 The Devastating Mid-Mississippi Valley Floods of 1-2 May 2010 By Richard H. Grumm National Weather Service 1. INTRODUCTION A devastating heavy rainfall event affected the Mid-Mississippi Valley (MMV) from
National Wildland Significant Fire Potential Outlook
 National Wildland Significant Fire Potential Outlook National Interagency Fire Center Predictive Services Issued: April 1, 2008 Next Issue: May 1, 2008 Wildland Fire Outlook April 2008 through July 2008
The Arctic Outbreak of 4-8 January 2014
 The Arctic Outbreak of 4-8 January 2014 by Richard H. Grumm National Weather Service State College, PA 16803 1. INTRODUCTION An artic outbreak affected much of eastern North American to include the eastern
Anticipating record events using patterns and pattern forecast: Mid-Mississippi Valley floods of April 2011
 Anticipating record events using patterns and pattern forecast: Mid-Mississippi Valley floods of April 2011 Richard H. Grumm National Weather Service State College, PA Abstract: A persistent pattern produced
The Historic Storm of October 2010 By Richard H. Grumm National Weather Service
 The Historic Storm of 24-26 October 2010 By Richard H. Grumm National Weather Service 1. INTRODUCTION An historic storm impacted much of the United States from 24-26 October 2010. Though the cyclone was
Historic Eastern United States Winter Storm of January 2016: Record snow along the megalopolitan corridor 1. Introduction
 Historic Eastern United States Winter Storm of 22-24 January 2016: Record snow along the megalopolitan corridor by Richard H. Grumm National Weather Service State College, PA 16803 1. Introduction An historic
National Weather Service-Pennsylvania State University Weather Events
 National Weather Service-Pennsylvania State University Weather Events The southern Express: High Impact Spring Storm of 14-17 April 2011 by Richard H. Grumm National Weather Service State College PA 16803
SEPTEMBER 2013 REVIEW
 Monthly Long Range Weather Commentary Issued: October 21, 2013 Steven A. Root, CCM, President/CEO sroot@weatherbank.com SEPTEMBER 2013 REVIEW Climate Highlights The Month in Review The average temperature
Cold frontal Rainband and Mid-Atlantic Severe Weather Event 28 September 2006 by Richard H. Grumm And Ron Holmes
 Cold frontal Rainband and Mid-Atlantic Severe Weather Event 28 September 2006 by Richard H. Grumm And Ron Holmes 1. INTRODUCTION A strong cold front moved across central Pennsylvania and the Mid-Atlantic
The enduring Louisiana rain and flooding of August 2016 by Richard H. Grumm National Weather Service State College, PA 16803
 1. Introduction The enduring Louisiana rain and flooding of August 2016 by Richard H. Grumm National Weather Service State College, PA 16803 Historic flooding impacted Louisiana on 12-15 August 2016 (TWC
Low-end derecho of 19 August 2017
 Low-end derecho of 19 August 2017 By Richard H. Grumm and Charles Ross National Weather Service State College, PA 1. Overview A cluster of thunderstorms developed in eastern Ohio around 1800 UTC on 19
Weather and Climate Summary and Forecast Summer 2017
 Weather and Climate Summary and Forecast Summer 2017 Gregory V. Jones Southern Oregon University August 4, 2017 July largely held true to forecast, although it ended with the start of one of the most extreme
Eastern Derecho June 2013-Draft
 Abstract: Eastern Derecho 12-13 June 2013-Draft Richard H. Grumm National Weather Service Office State College, PA 16803 A strong mid-tropospheric short-wave coming over a sharp 500 hpa ridge produced
1. INTRODUCTION * Figure 1. National Weather Service Storm Prediction Center (SPC) storm reports for December 1, 2006.
 storm reports for December 1, 2006.") P1.14 FORECAST ISSUES RELATED TO THE UNPRECEDENTED SEVERE AND HIGH WIND EVENT OF DECEMBER 2006 by Greg A. DeVoir* and Richard H. Grumm National Weather Service Office State College, PA 16803 1. INTRODUCTION
P1.14 FORECAST ISSUES RELATED TO THE UNPRECEDENTED SEVERE AND HIGH WIND EVENT OF DECEMBER 2006 by Greg A. DeVoir* and Richard H. Grumm National Weather Service Office State College, PA 16803 1. INTRODUCTION
Ensemble Forecasts of the Blizzard of January 2005 By Richard H. Grumm National Weather Service State College Pennsylvania
 Ensemble Forecasts of the Blizzard of 22-23 January 2005 By Richard H. Grumm National Weather Service State College Pennsylvania 1. Introduction A fast moving upper-level disturbance produced a wide area
Weather and Climate Summary and Forecast Fall/Winter 2016
 Weather and Climate Summary and Forecast Fall/Winter 2016 Gregory V. Jones Southern Oregon University November 5, 2016 After a year where we were seemingly off by a month in terms of temperatures (March
A Synoptic Climatology of Heavy Precipitation Events in California
 A Synoptic Climatology of Heavy Precipitation Events in California Alan Haynes Hydrometeorological Analysis and Support (HAS) Forecaster National Weather Service California-Nevada River Forecast Center