Flood Management Improvement Support Center (FMISC) Water Resources Department Government of Bihar
|
|
|
- Melinda McLaughlin
- 5 years ago
- Views:
Transcription


1 fmis Bihar Flood Management Improvement Support Center (FMISC) Water Resources Department Government of BiharB
2 1.0 Purpose And Overview of Annual Report This Report of 2010 Flood, is the fourth report published at FMIS Cell. This report is different from earlier report in terms of geographical coverage. This report now encompasses all the twenty one districts of North Bihar. In terms of contents this is the same as earlier one. This year will be remembered for a long time for its dichotomy as all the Districts of the state were reeling under drought condition in one hand while there were some Districts facing serious flood problems at some locations. The stupendous flood fighting work undertaken under the command of Principal Secretary, Engineer-in-Chief (North) and senior field engineers is a lesson to be learnt. Even the Chief Secretary, Development Commissioner, District Magistrate remained at the threatened site day and night and led the flood fighting operation. The results were astonishing which kept the flood damages to its minimum. Whether it is Bhitaha, Batardeh, Koerpatti Ismailpur-Bind Toli or Pipra-Piprasi, the team s effort was the same and thus resulting in containing the flood damages. As far as this report is concerned it will serve as a source of information and a reference document for FMISC Technical Committee and Advisory Committee, our key stakeholders, such as Disaster Management Department., Agriculture Department and Water Resources Department and even for technical institutes like National Institute of Technology, Patna. The key objective of this exercise is an attempt to make this report coherent and standardized so much so for the reader to get the most comprehensive picture of the flood issues, benefits and stakes. It aims to fulfill two primary roles: as summary of the flood in year 2010, the hydrologic analyses and a collection of important data on the flood regime primarily through inundation maps. These data will, in time, accumulate to provide primary regional resources for flood research and the collection of historical reference material. The main text of the Report is laid out in such a way that there is a logical progression from the creation of awareness of the nature and history of FMISC, which is now not a rigid one but encompasses entire North Bihar primarily based on demand and situation towards the specific evaluation of events in At times FMISC has gone a step forward in producing Maps beyond FMISC focus area on special request of our Stakeholders with the help of modern technology of GIS and Remote Sensing. Another interesting study has been carried out with observed Rainfall and water Level at various points if rivers in Bihar on the same time scale. Isohyets maps with rainfall stations and drainage layer are sure to give a better visualization of the situation. 2.0 Flood hazard in FMIS ACTIVITY AREA FMIS focus area is the most flood prone area in the State consisting of Kosi, Bagmati, Burhi Gandak, Gandak, Ghaghra, Mahananda rivers. A number of minor rivers also falls in North Bihar. Furthermore this area is the saucer shaped area between the embanked river of Gandak and River Kosi. 2.1 The Physical Setting of Bihar Bihar lies between latitude ' 26" N ' 15" N and longitude ' 52" E ' 40" E. The total geographical area of Bihar is about 94 thousand sq. km (94,000 km). The 1
. The geographical coverage is as shown in the figure below and the colored area is FMIS focus area. Geographical Coverage of Bihar Map 2.")
3 FMIS focus area for phase I lies between latitude ' N to ' N and longitude E to E. and the geographical area is about fifty two thousand three hundred and thirteen sq. km. (52313 sq. km.). The geographical coverage is as shown in the figure below and the colored area is FMIS focus area. Geographical Coverage of Bihar Map 2.1 Geographical Coverage of Bihar (Focus Area - All Districts of North Bihar) 2.2 FMIS ACTIVITY AREA The area is bounded by Himalayan foot hills and terai region of Nepal in the north, Mahananda on the east, river Ganges on the south and River Gandak on the west. The area comprises of rich alluvial plains of Indo-Gangetic plain. It comprises the tract of alluvial plains north of Ganga, falling between the Ganga and Indo-Nepal border having general slope from north-west to south-east and is drained by the rivers, Burhi Gandak, Gandak, Mahananda and Kosi falls into the Ganga and Bagmati- Adhwara, Kamla-Balan etc. which also drain into the Ganga through the Kosi. The total geographical area of North Bihar approximately sq. km. comprising of Districts namely Muzaffarpur, East champaran, Sitamarhi, Seohar, Saharsa, Supaul, Darbhanga, Madhubani, Khagaria, Samastipur, Begusarai, Araria, Madhepura, Purnea, Katihar, Kishanganj, Saran, Gopalganj, West Champaran, Vaisali and Siwan 2
4 The geographical coverage in South Bihar is approximately sq. km. comprising districts namely Rohtas, Buxar, Kaimur, Bhojpur, Arwal, Patna, Jahanabad, Aurangabad, Gaya, Nalanda, Sheikhpura, Nawada, Lakhisarai, Munger, Jamui, Bhagalpur and Banka. Some major rivers lying within this region are Sone, Punpun, Kiul etc. Besides, there falls many small rivers in this region. The soil of Focus area is sandy alluvial, rich in lime and often contains high proportion of clay. There are pockets where soils are calcareous with high proportion of calcium carbonate. The soils are among the most fertile in India and can support a variety of crops with appropriate land and water management. 2.3 Climate and Rainfall Bihar has monsoon type tropical climate with high temperature and medium to high rainfall. The temperatures are lowest during December-January with an average minimum of 8 0 C to 10 0 C and maximum of 24 0 C to 25 0 C. The temperatures in the hottest months of April to June are minima 23 0 C to 25 0 C and maxima 35 0 C to 38 0 C. The mean annual rainfall for the State is about 1270 mm varying from 1170 to 1580 mm in Focus area. Most of the rainfall (80% to 90%) is received from mid-june to mid- October. The late September-October rains (locally known as Hathia ), though only 50 to 100 mm in quantity, are very crucial to agriculture in the region and their timing and distribution make all the difference between plenty and scarcity. 2.4 River System of Bihar North Bihar Important Rivers namely Ghaghra, Gandak, Burhi Gandak, Kosi and Mahananda etc. fall into river Ganga, the master drain flowing from west to east, whereas Bagmati- Adhwara, Kamla-Balan etc. drain into the Ganga through the Kosi. The Ghaghra, Gandak and Burhi Gandak rivers of North Bihar are now more or less stabilized. It is believed that river Gandak has travelled from near Burhi Gandak on the east to its present course on the west in course of last several hundred years. In this process of shifting, it has created numerous chaurs (saucer like depressions) and mauns (deep horse- shoe shaped water bodies formed due to avulsions/cut-offs) in the Basin. The other North Bihar rivers such as the Bagmati, Adhwara group of river, Kamla-Balan and Kosi are still very unstable due to steep slopes in their upper reaches and high silt charges and are always exerting tremendous pressure on the embankments within which they are presently contained at enormous cost and efforts. The Kosi river also shifted from near Purnea on the east to its present course on the west prior to breach this year. Again, this river has moved towards east from its course after the Kusaha breach. In its lateral travel of about 120 km. in course of about two centuries, the Kosi has created a number of swamps and marshy lands in the Basin, apart from depositing coarse silt and sand in almost entire area. The major rivers of North Bihar have Himalayan origin and considerable portion of their catchments lie in the glacial region. They are, therefore, snow-fed and perennial in flow. 3
5 These rivers have catchments in the Himalayan region in Nepal. Some of them have catchments even in Tibet. They receive very copious rainfall during monsoon when discharges of these rivers are 50 to 90 times larger than fair weather flows. This causes frequent flooding of a large portion of North Bihar. Despite existence of flood embankments on most of them, about per cent of the geographical area of North Bihar is considered to be prone to floods South Bihar This tract of land is drained mainly by Rivers which are rainfed, having their origins either in the Vindhyachal hills or in the hills of Chhotanagpur and Rajmahal. These rivers are either dry or carry scanty discharges in non-monsoon months. Karmanasa, Sone, Punpun, Kiul, Badua, Chandan etc. are the important rivers of this region which fall ultimately into river Ganga. A peculiar phenomenon in this region is the formation of Tal. The southern bank of the Ganga is naturally formed as a levee obstructing the drainage of the land on the south of it, which extends up to the foot of Chhotanagpur hills. The natural slope of this land is from south to north, from foot hills of the Chhotanagpur hills to Ganga. There are several rivers in this tract which drain the rain water of the tract and accumulate them behind the high bank of Ganga. This has resulted in formation of tals viz. Mokama Tal, the area just on the south of the high Ganga bank, which comprises a group of Fatuha Tal, Bakhtiyarpur Tal, Barh Tal, More Tal, Mokama Tal, Barahiya Tal and Singhaul Tal. These tals also receive backwater of the Ganga when it is in high spate. Therefore, the tals get submerged in water during monsoon season and are thus deprived from kharif cultivation in most of the area. Even after the monsoon season, entire area does not get drained into the Ganga quickly. However bumper rabi & hot weather crops are grown in the Tal area that gets freed from water in time. 4

6 Map 2.2 River Basin Map of Bihar 5
7 2.5 Socio-Economic Context Bihar is one of the most populous state of India, but economically one of the most backward. Along with a very high proportion of population below the poverty line, the different social and economic indicators below amply reflect the precarious position of Bihar among the Indian States Human development index indicator India Bihar Per Capita income (in Rupees) Literacy Rate 65.38% 47.5% Infant Mortality Rate (SRS 2006) Gross enrolment ratio (6-14 yrs, %) Source: Director of Statistics, GOB, Census report 2001 As indicated above Bihar has a very dismal performance among the states of India- its per capita income (net GDP at factor cost at current prices) stands at a mere Rs as against Rs for India as a whole. The state has the lowest literacy rate among the major states of India-47.5 percent as against the national average of percent. The Child mortality rate is 60 for both Bihar and India. The gross enrolment ratio stands 47 for Bihar against 65 for India Agriculture Bihar has a large alluvial river valley area. Against the backdrop of such generous natural resource in irrigation sector the overall percentage of net area irrigated in Bihar is about 38%, irrigation is largely seasonal and protective. India Bihar Percentage income from agriculture # # Potential created in million hectare (mha) (Major and Medium irrigation:>2000ha) # 2.88* (11 th Plan document 9.1.1) Ultimate irrigation potential, (mha) (Major and Medium irrigation:>2000 ha) # 5.36* # Annual Plan , GOB *Annual plan report of WRD, Bihar
8 The acute poverty and backwardness can be traced to the backwardness of both in agricultural and industrial sectors. The reasons for the extreme backwardness of agriculture are both institutional and technological. Where as structural and institutional factors have been operating as a powerful barrier to the agrarian transformation, the technological factors such as poor development of infrastructure like irrigation and power, non-availability of modern inputs, low value of credit and poor extension services, etc. have also contributed much to the dismal performance of the state s agricultural sector Demography India Bihar % Population in rural area Density of population (per sq km) % Population below poverty line Source: Annual Plan , GOB, Census report 2001 The major explanation of the state s backwardness and poverty, however, has to be traced to the rural sector. With about 89.6 percent of the population in rural areas (as against 72.2 percent for India as a whole), it is the most rural state in the country, next only to Assam. About percent of the state population is below poverty line as against about percent for India as a whole. One of the obvious reasons for the economic backwardness and poverty of Bihar is its high density of population 880 persons per sq. km to 324 per sq km for whole of India. (2001). In the wake of wide spread poverty, a substantial number of poor people go outside the state in search of livelihood. The State s backwardness is probably more related to its socio-economic-political structures. Floods in large parts of the plains of Bihar, especially in north Bihar, are recurring features and cause havoc destroying crops and the quality of land, and threatening the conditions of life and livestock due to large-scale displacement. These factors add to woos of Bihar. Flood in North Bihar is a perennial problem. Every year, almost 22 districts get flooded, causing huge loss of property, lives, farmlands and infrastructure. A disaster management system equipped with data, technology and resources can meet ravages of cyclic natural disasters. Water logging in substantial parts of the command area of north Bihar is another chronic problem with adds up to the socio economic backwardness of Bihar 2.6 Flood Typology Conventionally the typology of flood management classes is based on flood type, source area, warning time, flood duration and recession, and impact on agriculture. FMISC have identified 4 classes of floods which can be classified as 7
9 Class I: Class II: Class III: Class IV: Flash floods floods from Nepal rainfall, lead time is short (8 hours) in Kamla Balan, recession is fast, River floods lead time 24 hours, recession is 1 week or more, Drainage congestion in river confluence- lead time > 24 hours, lasting full raining season, no Kharif season agriculture Permanent water logging - shrinkage in area only in Feb, local rainfall, micro-relief aspects. Another classification which has been identified by FMIS resulted into four classes of Floods, which are following: Not affected Low Flood Medium Flood High Flood <10% area inundated. 11%-30% area inundated. 31%- 60% area inundated. > 60% area inundated 2.7 Occurrence of Floods in River Systems A study has been made to see the flood stages in various river systems during floods in FMISC focus area. It was found that early flood takes place during the month of May-June in River Bagmati, Kosi and river Kamla. Thereafter flood generally comes in River Burhi Gandak in the month of mid July. During these months River Ganga generally remains low but by September River Ganga, the master drain also rises making the flood problem more acute Floods in Last Ten Years in the FMIS Focus Area Floods have caused devastation and acute human sufferings frequently since the dawn of civilization and man has had to live with floods since time immemorial. The impact of flood was perhaps not felt to the same extent in the past as is felt now. This was due to the fact that there were smaller living population and pressures of industrial activities and other development works in the flood plains was far less compared to the present day activities. The flood problem was accentuated due to ever increasing encroachments on the flood plains by the growing population to meet its requirements of food and fiber. The destruction of forests for reclaiming areas for occupation and for obtaining fuel for domestic requirements had also caused changes in river regime. All these have resulted in an anomalous situation where, in spite of protection measures carried out so far in the State with a substantial investment on flood management works flood damages have gone on increasing instead of decreasing. A brief summary of flood based on the Water Resources Department Annual Flood Report in chronological order during ( ) is given as follows: Bagmati left embankment at chain 273 near village Madhkaul was cut by villagers. Chain 311 near village Madar was breached on 6/8/2000. Again in the last week of September and first week of October at km 11,12,20,35.5 and48 were cut by the villager. Incident of embankment cut have been reported earlier also. This was done to bring silt to raise land by the 8
10 villagers. Kamla-Balan and Bhuthi-Balan catchments received heavy rainfall during first and last week of July resulting in unexpected rise of water. Slope of Left embankment of Kamla- Balan embankment between km in a length of 200 m was damaged. Spur at 2.80 km of Eastern Kosi Afflux Bund was punctured in the night of 4/8/2000 in a length of 20 m and the nose was washed away due to heavy pressure of river. A new nose and Shank was constructed in a length of 563 m and spur was made safe. The spur at km 14.5 was also damaged in half of its length in the night of 29/9/2000, expert from head quarter camped at the site and brought under control. Sikarhata Majhari Bund of western Kosi embankment between Km 6-7 was damaged in the night of 13/8/2000 but saved by doing flood fighting work. Heavy pressure on Spur at km of Eastern Kosi embankment was overcome by undertaking flood fighting work Left bank of river Burhi Gandak at Rampurwa Pulwar, Pakridayal, Enarwa Gaht Mainpurwa and right embankment at Bihkhiya, Chakarniya, Bairiya, Koral, and Balochak was experiencing pressure but was saved by timely flood fighting. Burhi Gandak left embankment at km at village more the bed wall which was earlier constructed damaged due to heavy local rainfall and pressure over embankment. Burhi Gandak at right embankment at km at village Phulwaria anti social element cut the embankment on The Right embankment of Bagmati River at Kothia and Surgahi and at left embankment at Kansar embankments were experiencing heavy pressure throughout the entire flood season but were saved by timely flood fighting. No breach in this reach occurred. Western Kosi embankment at Ghoghardiha, Jamalpur embankment at km and at Sikhta Manjhari there were pressure over embankment which was safely overcome by timely flood fighting. Western Kosi embankment at 2.25 km the D-part of spur nose was damaged. Bhuthi-Balan right embankment breached due to overtopping at Km, km, 21.4 km 22 km, and 60.7 km in first week of October Kamla Balan left embankment at km (Bugras) was cut by villagers in a length of 30 m which increased to 50 m. Overtopping reported in Kamla Balan left embankment at km 38 at Bhadhuar on , at 39 km near Bhadhuar sluice, at 50.5 km near Pipra ghat, 51 km at junction point of rail cum road bridge and embankment and 74.8 km in Asma village on Kamla Balan right embankment at km 37 near village Banaur and km 64 at village Thengha were cut by villagers, piping and by anti social elements in a length of 30 m which increased to 300 m. Bagmati right afflux bank embankment at ch near village Dharampur was cut by the villagers on Bagmati left embankment near ch. 145 of Sirsia ring bund at 20 to 30 ch and 29 to 32.5 ch the embankment was breached due to overtopping. Bagmati left embankment between ch. 145 to 149 was cut by villagers on Kiroi left embankment at 7 km at village Masartharia and 5.25 km near Maasma and Kiroi right embankment at 12 km near Belwara Milki village and at 3 km near Bagwasa village it breached due to overtopping on Western Kosi embankment at 29 to 30 km below Kasba Bharda was cut by villages at 2 places Maximum discharge of Cusec passed through river Kosi where as discharge in excess of Cusec passed four times which resulted in continuous pressure on spurs/embankments. This resulted into damage of spurs in western Kosi embankment at 25.57, and km. On 1/8/2003 due to high discharge through the river right embankment of Bagmati river at Surgahi site at chain breached in 50 ft. which increased to ft. On 1/8/2003 antisocial elements cut Kamla Balan right embankment at km in a length of 50 ft. Status of flood in other rivers except Ganga, Gandak remain normal. In river Ganga the HFL at Bhagalpur surpassed the 1978 record of and was level and at Patna at Ghandhighat the HFL level of 1994 (50.27) was observed as in 2003 due to this heavy flooding in Ganga resulted in damage to the road network in Samastipur district. In river 9
11 Gandak the maximum discharge 6,69,750 cusecs passed through Valmikinagar barrage on flood in the state of Bihar was unprecedented in much respect which proved to be very grave and damaging. Catchments area of North Bihar rivers received heavy rainfall in the first week of July itself which not only broke last three years flood record but also surpassed the 1987 flood year which was the maximum flood producing year. Flood level at Dubbadhar site on river Bagmati surpassed all time high flood level by about 1.18 m. similarly Burhi Gandak river on and Kamla Balan river on touched all time high flood level. This it self speaks about the fury of flood in year Many places in the embankment of North Bihar were breached resulting in flood inundation in a vast area of North Bihar area. Unprecedented flood in river Bagmati, Burhi-Gandak, Kamla and Bhuthi-Balan and Adhwara groups of river breached the embankments at many places and there was loss of life and property in a large scale. In river Kosi situation by and large remained normal and a maximum discharge of cusecs passed on The flood situation during 2005 was normal in comparison to the devastating flood of Where there was 63 numbers of breaches during 2004 flood, where as only 8 breaches occurred during the year resulting in flood inundation in Madhubani and Katihar districts only. Left and right embankment of Kamla was breached at seven places during this year. Bhuthi Balan left embankment at km and was cut by the antisocial elements and due to flash flood embankment was damaged at few places The flood situation during 2006 was normal. Where there was 52 numbers of breaches during 2004 flood, this year only 1 breach occurred. Left embankment of Kamla was breached near village Asma at km by antisocial elements but fortunately there was no loss of life or property. Flood situation in other places remained normal by and large floods will be remembered for high degree of rainfall which was even more than year 2004 flood. Districts of Champaran, Gopalganj, Siwan, Madhubani, Darbhanga, Muzaffarpur, Samastipur, bore the fury of flood to a large extent. But fortunately compared to 2004 floods, there were fewer numbers of breaches (32 nos. in Bihar) in 2007 as compared to 63 in year Unprecedented flood in river Bagmati, Burhi-Gandak, Kamala and Bhuthi- Balan and Adhwara groups of river breached the embankments at many places and there was loss of life and property. In river Kosi situation by and large remained normal There was an unprecedented flood due to a breach near 12.9 km of Eastern Kosi Afflux Embankment near Kushha village in Nepal on 18th August 2008 which very soon took the shape of a catastrophe leading to the miseries to lakhs of people in Sunsari and Saptari districts of Nepal, and Supaul, Madhepura, Araria, Saharsa, Katihar and Purnia districts of Bihar. River Kosi entirely changed its course from earlier one. This was again tamed to its earlier course by WRD after a tremendous effort keeping in line with the advice of Kosi Breach Closure Advisory Committee (KBCAT) The floods in this year remained normal except few breaches such as Tilaktajpur on right embankment of river Bagmati under Runnisaidpur block of Sitamarhi District, Gobindpur site of Labha Choukia Paharpur embankment of Mahananda river and Sallehpur Tandeshpur site of Gandak river. The loss to life and property was brought to minimum by undertaking rescue and relief measures. 10
12 2.8 Flood Characteristics of Focus Area FMISC focus area comprised of eleven districts only of North Bihar in the first phase namely Muzaffarpur, East Champaran, Sitamarhi, Sheohar, Saharsa, Supaul, Darbhanga, Madhubani, Khagaria, Samastipur and Begusarai. A study has been made with the help of data obtained from DMD, Patna to see the flood events that took place in the development blocks of these districts in terms of inundation during 1987 to 2010 (24 years). A summary of the findings is given below:- Sl. No. Name of Districts Number of Blocks affected out of last 25 Years > = 16 Years Years 6 10 Years 1 5 Years 1. Muzaffarpur East Champaran Sitamarhi including Seohar Madhubani Darbhanga Supaul Samastipur Saharsa Begusarai Khagaria Total Source: (Disaster Management Department, Bihar ) The table indicates that there are as many as 29 blocks of FMISC focus area are most chronically flood affected and 38 blocks of FMISC focus area is chronically flood affected in terms of flood inundation. Now in the second phase, the focus area of FMISC has been extended to all 24 districts of North Bihar to cover a wider area. 11
13 2.9 Loss Of Public Property In Last 10 Years Loss of Public Property Year District Blocks Village (in Lac) Human Number of Affected Animal Area (in Lac ha.) Agric Non Agric Total Crop Damaged (Rs Lac) Total House Damaged Value ( in Rs. Lac) Public Property Damaged (in Rs. Lac) Cropped Human Deaths Animal ,637 1, , , , , , , ,29,773 75, ,03, , , ,262 2, , , , ,014 52, , , , ,074 17, , , , ,091 20, , , , ,813 5, , Source: (Disaster Management Department, Bihar website: Overview The Government of Bihar has identified improvement of flood control as a priority area for World Bank engagement in the State. The World Bank Government of Bihar Partnership Matrix (2006) prioritizes the improvement of the institutional capacity for delivering better flood management and drainage services, as a key action for accelerating agriculture productivity in North Bihar. The Flood Management Information System (FMIS), identified for entry-level and short-term bank engagement in Bihar, is designed to generate and disseminate timely and customized information to move the sector agencies from disaster response to improved disaster preparedness and to effectively support flood control and management in the flood prone areas of the State of Bihar. Improved flood management that will protect the poorest farmers and tribal groups located in the low value lands in the flood plains, is also in line with the Bank/DFID partnership policy of extending Bank s support to state reforms that could lead to lasting poverty reduction. 12
14 The development of FMIS is planned in four stages: Flood hazard characterization & emergency response; improved flood preparedness and community participation; Flood hazard mitigation; and Integrated flood management. The technical improvements in flood forecasting, inundation modeling and warning, and embankment management are also coupled with expanded institutional and community linkages and expanding geographic coverage (from the most flood-prone 11 districts in north Bihar in the first stage to the whole flood prone area in the third stage). The fourth stage aims to develop integrated flood/drainage/irrigation management through upgrading FMIS into a Water Resources Information System, implementing operational community based flood management, and operationalizing regional flood knowledge base and management plans. The first module has been implemented and operational during 2007 flood season, with focus on flood hazard characterization and operational flood management information products, supplemented by improved flood forecast, a flood website for public dissemination and access, updated flood control manuals, plans for upgrading hydrologic measurements and telemetry, and training. Providing and disseminating information tools has moved sector agencies capacity from disaster response to improved disaster preparedness and to effectively support flood control and management in the flood prone areas of the State of Bihar. The FMIS in the first stage had covered the focus area from Burhi Gandak river in the west & Kosi river in the east in North Bihar that is most flood prone in the State. The subsequent stages of FMIS development would cover substantially enhanced functions and products, supported by improved hydrologic observations and telemetry, more reliable and longer term rainfall forecasts, enhanced flood forecast and inundation prediction with better models, airborne Synthetic Aperture Radar (ASAR) surveys for real-time inundation information during floods, close-contour surveys of the flood plain, mapping floodplain geomorphology including micro-relief to understand and improve drainage, improved communication links and information flow, risk and vulnerability analysis, institutional and community outreach mechanisms, and real-time flood data dissemination. The fully upgraded FMIS would support preparation of master plan for flood control and drainage, irrigation improvement, and overall water sector development in Bihar State. 3.1 FMIS Phase I Objectives FMIS Phase-I objectives were: To move from disaster response to improved disaster preparedness, to improve the lead time of the forecasts, develop a focal point in an institutional (e.g. a multi-disciplinary Flood Management Information System Cell) framework and information (e.g. a web-portal for Bihar Flood Management) setting, as well as improved information flow (e.g. bulletins, improved use of /internet/cell phones) and sector preparedness (by updating flood manuals). Along with a substantive effort of planning the development and rehabilitation of the flood and drainage control infrastructure, in the short term, there is a compelling need for adopting new technological approaches to improve the decision process before, during and after the flood events and the use and allocation of available resources. In the short-term FMIS would help strengthen existing institutional capacity and arrangements for flood management in the state and make extensive use of modern technology (e.g. satellite remote sensing, Geographic Information System [GIS], Internet, forecast models, 13
15 etc.). Relevant outcomes of the technical assistance are the strengthening of flood knowledge base and analysis, the dissemination and outreach of operational flood management information and the improvement of flood preparedness. 3.2 Activity Completion Report for Phase I The project components included: i) Development of FMIS ii) Improved flood forecasting iii) Bihar Flood Information Website iv) Updated flood control manual v) Training vi) Plan for upgrading hydrologic measurements and telemetry. The Activity Completion Report received from the World Bank mentions that FMIS has been set up. FMIS website has been developed and hosted. The website ( is operational providing public access to flood data. FMIS officers have been trained. The FMIS has addressed information needs for early warning and emergency response of three key Departments: Water Resources, Disaster Management Department and Agriculture Department. The Central and State Agencies linkages (linkage between WRD, GOB, and NRSA/ IMD / SOI/ CWC and GFCC) have been strengthened. In a nut shell, almost all the project activities have been successfully completed and the project outputs and outcomes have been substantially realized with the disbursement to the tune of about 93 percent of the total project cost. The Bank has expressed its pleasure over the Word s commitment for sustaining the FMIS by supporting continued operation with substantial augmentation of systems and staff. 3.3 Activities of FMISC in 2010 Like previous years, this year, too, FMIS Cell, Patna with all its resources and as per its mandate was ready and prepared for the flood season The satellite data for North Bihar, which were received in FMISC, Patna from NRSC, Hyderabad, were further processed, value added and disseminated almost same day or next day to the user/stakeholder departments like WRD, DMD, GFCC, Agriculture Department, NRSC, CWC etc Monitoring of Kosi breach closure site Consequent upon breach in Eastern Kosi Embankment at Kusaha in Nepal, the state witnessed one of the biggest water-borne disaster of recent history. With incessant efforts of our engineers, coupled with technological support provided by FMIS cell, the magnitude of disaster was tried to be kept at the minimum. The breach was successfully closed but the wound was still to be closely watched and cared for. All through rainy season FMIS cell monitored the site with the help of available satellite images, and kept informed flood monitoring circle. District-Wise Damage Statistics For 2010 Flood 14
16 District-wise flood damage statistics as obtained from DMD for 2010 flood for FMIS area is given below:- Lives lost (Nos) Human Sl. No. District Blocks No. of affected village Cropp ed Area (Lakh hect.) Estd. Crop damage (Rs. Lac) No. of house damaged fully /partially Estimate d Value of house damage In (Rs. Lac) Public Properties damage (Rs. Lac) Flood Others Animal 1. Muzaffarpur Sitamarhi Saharsa Boat - acciden ts 4. E.Champaran Supaul Boat - acciden ts 6. Darbhanga Boat - acciden ts 7. Madhubani Samastipur Sheohar Khagaria 11. Begusarai Total (KF-1594, KP-65, PF--,PP--,Huts- 5594) Source : Disaster Management Department (Boat Accide nt) (Memo No. 2711/DM, dated of OSD, DMD, Bihar, Patna & form IX dated of DMD) FMIS Cell gears up for any emergency situation during flood Similar to previous years, FMISC was ready to face any emergency situation during flood. This year too; FMIS Cell geared up with the limited personnel and resources at its disposal and started collecting information, maps and satellite images from all possible sources; indigenous or global. The Cell started working in two shifts, from 7 a.m. to 2.00 p.m. and from 2 p.m. to 9 p.m. daily including holidays. There was continuous liaison with CM Secretariat, Water Resources Department and Disaster Management Department and value added maps were provided as required in shortest possible time Breach related flood information On 7 th of September 2010, excessive pressure was reported on spur at Km of Batardeh site of Saran Embankment near village Simariya of Barauli block under Gopalganj district. After that FMISC started to prepare value added maps like probable inundation maps 15
17 and maps showing river behavior to help Water Resource Deptt. and district administration in fighting the pressure. Field engineers applied every effort to protect the site by executing round the clock flood fighting works at war footing, but they could not save the Saran embkt. from erosion. Principal Secretary, WRD, Engineer-in-chief (north) WRD, Chairman, Flood Fighting Force and senior officers of District Administration/ Police Administration camped at the site. Value added maps from FMISC helped them to fix the alignment of back shifting. But fast meandering of river current and increase of water level resulting from heavy rainfall in the catchments of the Gandak river caused excess pressure resulting in damage of Saran embkt. in a length of 200 m and consequently newly constructed ring bundh and spreading of water in the country side of the embankment on 16 th Sept A map showing probable inundation areas was forwarded immediately to DMD and CM Secretariat for necessary action. This time DMD was well prepared in advance to receive floods based on already supplied probable inundation maps provided by FMISC. The prediction was found to be closely matching with real situation later witnessed. This was possible due to capacity building and knowledge enhancement in the cell during last flood seasons Information disseminated by FMISC Information provided to WRD 1. FMISC by assessing Global Satellite data sources and real time data on rainfall forecasts continuously tracked the fast changing flood situation and requested NRSC for very frequent satellite coverage. 2. Although the area of operation of FMIS cell is limited to 11 districts of N. Bihar, we are gearing up for whole of north Bihar in 2 nd phase. So at the behest, we tracked the pressure building and erosion of spurs no. 3,4,5,6,7,8 & 9 situated at left bank of the river Ganga (Between villages Ismailpur and Bindtoli of Gopalpur block) in the downstream of Vikramshila bridge under Bhagalpur district. Pressure points on right bank of Gandak river as spur situated in between mile of P-D ring bund near Koerpatti, on Singahi-koerpatti ring bundh and Koerpatti cut-end and Bhitaha retired line on left bank of river Gandak were also tracked. Value added maps were given to WRD and field engineers to assess the river behavior and probable inundation which helped them to apply flood fighting measures accordingly. 3. Breach in Eastern Kosi Embankment at Kusaha in Nepal in 2008 kept our special attention towards Kosi. Throughout the flood season we monitored Kosi and tracked the pressure on spurs at km, km,10.00 Km,14.80 km, km., and at 5.30 Km. of Eastern Kosi embankment. Value added maps were supplied to WRD and field engineers to be in better position to assess any damage and execute flood fighting works accordingly. 4. We prepared maps showing changing behavior of major rivers of North Bihar like the Gandak, the Kosi, the Kamla, the Bagmati, the Burhi Gandak and some stretches of the Ganga. This value addition to our GIS databank came handy in deciding Embankment maintenance works. All schemes submitted by field officers to TAC were scrutinized with the help of these maps. 16
18 5. All schemes, referred to GFCC for clearance, were aided by FMIS inputs in the form of latest satellite pictures. This helped a lot in judicious decision making at State and Centre level committees Information provided to DMD and CM Secretariat As discussed earlier, probable inundation maps before any expected breach were immediately prepared based on past records and landscapes and disseminated to DMD and CM Secretariat to help them prepared to reduce the after effects of flood. Later on, the actual inundation maps based on satellite imageries were provided to DMD and other users and stakeholder departments to help them take necessary rescue and rehabilitation actions Contribution of FMISC to Technical Advisory Committee (TAC), WRD and GFCC in taking decisions for proposed Anti-Erosion Works for Year 2010 & TAC meetings virtually took place at FMISC this year. Our specialists sat with the committee and showed maps showing changing behavior of major rivers of North Bihar like Gandak, Kosi, Kamla, Bagmati, Burhi Gandak and some stretches of Ganga. This value addition to our GIS databank came handy in deciding Embankment maintenance and Anti-erosion works. All the schemes submitted by field officers to TAC were scrutinized with the help of these maps. Nearly all large schemes, referred to GFCC for clearance, were aided by FMIS inputs in the form of latest satellite pictures overlaid with river positions of past 3 to 6 years. This helped a lot in judicious decision making at State and Centre level committees. GFCC officers, before visiting Gandak and Kosi, interacted with FMISC specialists to get first hand report on changed behavior of the rivers after flood Capacity Building A training program on the topic Tools and Techniques for Flood Forecasting and Modeling (first of a series) was held during December 2010 at FMISC. The training was organized by FMISC in collaboration with World Bank. The training was customized in context of flood modeling in Bagmati and Adhwara basin. The resource person was Dr shafikul Islam from Tufts University, Boston. He discussed about HEC-HMS and use of TRMM data in absence of real time rainfall data. Most of the officers of FMISC participated in this training. On last day of the training, Mr. Islam gave the trainee officers a follow up activity to be reported back on 24 th Dec. The trainee FMISC officers were divided into three groups, took the follow up activity, completed it on time and sent back to Mr.Islam for further action. Mr. Islam appreciated back for this level of participants, enthusiasm and commitment of FMISC trainee officers. The second and third such training of the series is likely to be held in April and June 2011 at FMISC. In an another National level training workshop on the topic Application of GIS in Water Sector organized by National Water Academy, CWC, Pune, Dr. Saroj Kumar Verma, Assistant Director, FMISC participated e bulletin 17
19 e-bulletins were being issued and posted on FMIS website regularly during flood season. e-bulletin for the month of July 2010 is annexed (Appendix I). 4.0 FMIS website URL : The FMISC website is an information dissemination interface of the FMISC. The presentation of the information is in text & graphical maps. We have analysed the whole scenario and tried our level best to develop a system which is purely graphical. The main motto of our project is to provide the user with a platform where they can get flood information related to any particular area. Apart from a brief discussion about the technology used & the activities carried out by the FMISC, the site also provides detailed maps related to the flood inundation status, breach points on the embankments, inundation levels etc, of the area covering flood affected districts of the northern part of the state of Bihar. FMIS website includes: Daily hydro-meteorological status of North Bihar, having DL (Danger level) WL (Water level) and RF (Rainfall) during the flood season ie 15 th of june to 15 th of October. Daily flood bulletin are issued every day during the flood season. These bulletin contains summarized information about the observed rainfall, water level and basin wise maximum forecasted rainfall for 3 days obtained from IMD. Inundation map for WRD and DMD, these maps show aerial extent of flood water spread. The inundation extent is derived from RADARSAT Layers/Imagery provided by NRSC in processed 1 bit image format. Monthly E-Bulletin is published every month during flood season. This is an in house production and gives a brief account of activities of FMISC. End Season Flood Report is also published at the end of flood season. District level rainfall forecast of 5 days for Bihar and Jharkhand as obtained from IMD are included on daily basis during flood season. Important links, Photo Gallery, Weather widget are also included in the website. 18

20 Some essential features of our websites are outlined below. Construction Our website is built using the latest technologies and is highly optimised for speed so that viewers don't sit around waiting for pages to load, or even worse move on to another website. Navigation Clear, simple methods of website navigation for our audience are a primary aim. We have implemented a variety of navigation systems including pull-down and pop-up menus. We often undertake trials and constantly modify our website to enhance the browsing experience. Future action Over the years the website has silently but surely established itself has a media which introduces the users within and without, to the activities which are being carried out in the FMISC. With the number of stake holders rising every day FMISC is trying its best to meet the myriad demands of Thematic maps and Imageries. Under these circumstances the website will have an important role in catering to increasing demands of customized maps and other information products. It is therefore mandatory to have a website that will allow the users to generate maps and other information product as per their needs. The salient features of the future website will be Interactive Map Empowering information. Visualizing the geography. Processing raw data into visual information. Graphic based system (more comprehensive) 19
21 Imparting easy navigation feature Hierarchical storing of data Spatial data analysis Represent geographic information via a Visual Media Faster and more extensive access to geographic information Ability to aggregate data for specific sub areas Better targeting and coordination of services Display a map with multiple map layers. Symbolize the map layers. Display locations stored in a database. Generate images, set the Image Format property to the desired image format. Creates map images from spatial information stored in digital format Ability to handle both vector and raster data Bulk SMS Services PUSH SMS Services: Capable of sending thousands of SMSs in minutes. Web based user accounts, with storage capacity of over 1 million numbers and 5,000 Groups and address book. Scheduled Messaging (automated). PULL SMS Services: Using short-codes like and 56767, Specially get feedback/information on website directly from field persons. Free Auto-Responder SMS goes to field persons. Real Time Data Aim to develop a flexible computing environment for capturing real-time data services to high performance Geographic Information System (GIS) application. Interactive Embankment Information through Tool Tips Dynamic Daily Flood Bulletin 20


22 Proposed layout of our future website: 21

23 Interface for dynamic map composition: 22
24 Floods Hydrologic analysis Area of interest (AoI) of Flood Management Improvement Support Center, Bihar receives flood water from vast areas of Nepal through four main streams viz Burhi Gandak, Bagmati, Kamla and Kosi. The FMIS Center received daily rainfall / river water level data of some stations falling in these basins whose details are as follows. Sl. Name of Location Maintained Type of data Mode of data No. measuring Basin/River (Nepal/ station Bihar) by acquisition Simara Burhi Gandak Nepal GON Daily Rainfall Web site2 2 Kathmandu Bagmati Nepal GON Daily Rainfall Web site2 3 Nagarkot Bagmati Nepal GON Daily Rainfall Web site2 4 Garuda Bagmati Nepal GON Daily Rainfall Telephone3 5 Janakpur Kamla Nepal GON Daily Rainfall Web site2 6 Sindhuli Kamla Nepal GON Daily Rainfall Telephone3 7 Okhaldunga Kosi Nepal GON Daily Rainfall Web site2 8 Taplejang Kosi Nepal GON Daily Rainfall Web site2 9 Dhankutta Kosi Nepal GoN Daily Rainfall Web site2 10 Biratnagar Kosi Nepal GoN Daily Rainfall Web site2 11 Dharan Kosi Nepal GoN Daily Rainfall Web site2 12 Lalbegiaghat Burhi Gandak Bihar CWC, GoI DRF & RS Sikandarpur Burhi Gandak Bihar CWC, GoI DRF & RS Samastipur Burhi Gandak Bihar CWC, GoI DRF & RS Rosera Burhi Gandak Bihar CWC, GoI DRF & RS Khagaria Burhi Gandak Bihar CWC, GoI DRF & RS Sonakhan Bagmati Bihar WRD, GoB River Stage Flood News5 18 Dubbadhar Bagmati Bihar WRD, GoB River Stage Flood News5 19 Kansar Bagmati Bihar WRD, GoB River Stage Flood News5 20 Benibad Bagmati Bihar CWC, GoI DRF & RS Hayaghat Bagmati Bihar CWC, GoI DRF & RS Kamtaul Bagmati/Khiroi Bihar CWC, GoI DRF & RS Sonbarsa Bagmati/Khiroi Bihar CWC, GoI DRF & RS1 Flood News5 24 Saulighat Bagmati/ Bihar CWC, GoI DRF & RS1 Flood News5 Darbhanga Bagmati 25 Ekmighat Bagmati/ Bihar CWC, GoI River Stage 4 Darbhanga Bagmati 26 Jainagar Kamla Bihar WRD, GoB River Stage Flood News5 27 Jhanjharpur Kamla Bihar WRD, GoB River Stage Flood News5 railpul (u/s) 28 Jhanjharpur Kamla Bihar CWC, GoI DRF & RS1 4 railpul (d/s) 29 Basua Kosi Bihar CWC, GoI DRF & RS Baltara Kosi Bihar CWC, GoI DRF & RS Kursela Kosi Bihar CWC, GoI DRF & RS Birpur Kosi Bihar CWC, GoI DRF & RS1 Flood News5 1 Daily Rainfall and River stage, from CWC, 4 from CWC, 5 Daily Flood News of Water Resources Dept. GOB 23

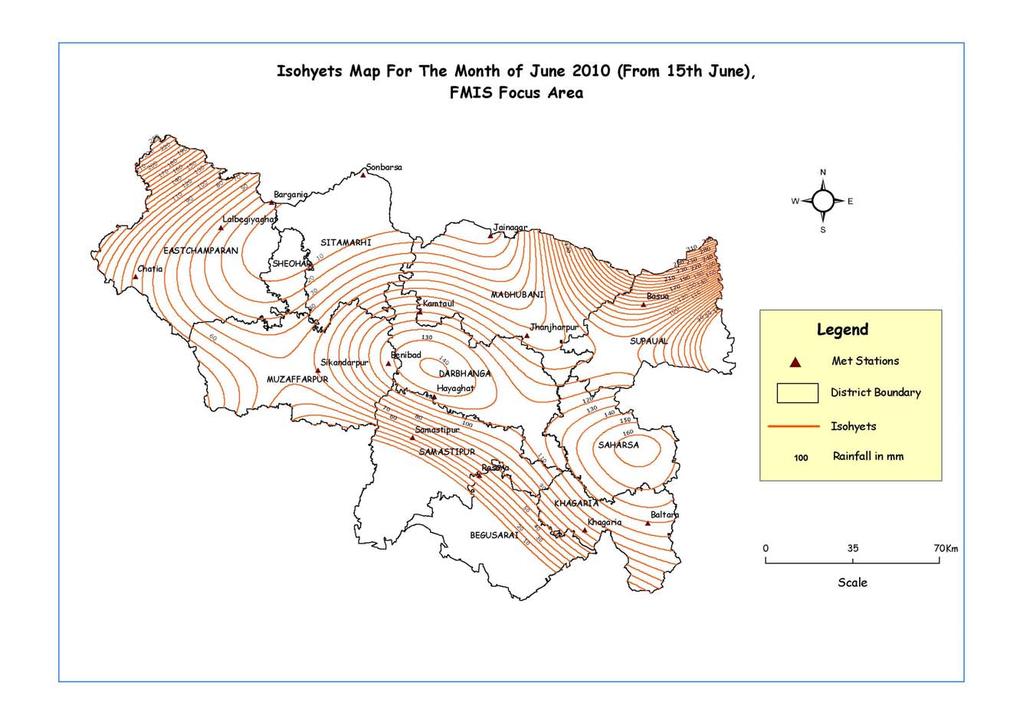
25 Location of the above stations are depicted in the map below. Map 5.1 River-Gauge and Rain-Gauge Stations 5.1 Rainfall This year, the rainfall in entire Bihar was very scanty. This situation was so grave that Government of Bihar initially declared 28 districts of Bihar as draught-hit, which later on turned to all 38 districts of Bihar. A good shower of rainfall was recorded on 18 th June this year with 65.4 mm at Benibad, 54.3 mm at Hayaghat and 55 mm at Kamtaul in Bagmati-Adhwara basin, but an appreciable rainfall was recorded in almost all basins on 12 th July with 73.2 mm at Rosera, 95.6 mm at Sikandarpur, mm at Benibad, 68 mm at Baltara and mm at Hayaghat. The following Table compiles monthly / monsoon rainfall as well as number of rainy days observed at different stations falling in the concerned basins. This compilation is based on the daily rainfall data received from local Division of Central Water Commission and the Nepal website If we look at the Table below, we observe that monthly rainfall in Nepal at various stations in different basins have been much more than those in North Bihar stations. All the rain gauge stations in Bihar except Kursela have received rainfall on less than 50% days of the monsoon period. Of course, many stations in Nepal received more than 50% of rainfall days of the total monsoon period. Kathmandu had the maximum 88 days of rainfall of the total of 122 days of rainfall (from 15 th June to 15 th October). The next was Dharan having 83 days of rainfall. If we compare this monsoon rainfall with the Normal Monsoon Rainfall, it reveals that the monsoon has been much below normal this year almost on all stations. Monsoon, this year in Bihar, has been less than normal by percent till 26th October as reported by IMD. The actual rainfall in Bihar till 26th October was reported to be mm against the normal rainfall of mm. The delayed and insufficient rainfall delayed the sowing of Kharif crops, which as a natural result had its telling upon the production. 24
26 A word of precaution note here is that there have been a few days on which data was not available. Those gaps have not been filled up. So, similar information from the parent source may be a little different. Below are the contours drawn with the rainfall figures available with us. The June rainfall is taken from 15 th of the month and the October rainfall is only upto 15 th of the month. River Basins Rain Gauge stations Monthly Monsoon Rainfall (mm) observed in the river basins of AoI-Flood 2010 June (from 15 June) Monthly Rainfall Monsoon 2010 July August September October (up to 15 Oct) Normal Monsoon Rainfall Jhanjharpur Okhaldunga Taplejang Dhankutta Biratnagar Dharan Basua Baltara Kursela Notes: 1. Rain-gauge stations written in italics are located in Nepal. 2. Monthly / monsoon rainfall have been calculated using daily rainfall obtained from CWC and Nepal web site 3. Source of Normal Monsoon Rainfall for Nepal is the Nepal web site Total No. of Rainy days Simra Lalbegiaghat Sikandarpur Samastipur Rosera Khagaria Kathmandu Nagarkot Benibad Hayaghat Kamtaul Sonbarsa NA NA NA NA NA NA Saulighat NA NA NA NA NA NA Jainagar NA NA NA NA NA NA Burhi Gandak Bagmati Kamla Kosi 25
27 26
28 27
29 28
30 29
31 30
32 5.2 River Stages Daily water-levels measured (at 6:00 AM) at different gauge stations on four major rivers of the AOI have been chronologically plotted. They are discussed below Burhi Gandak Lalbegiaghat, Sikandarpur, Samastipur, Rosera and Khagaria are five gauge-stations located in sequence from up-stream to down-stream on the river Burhi Gandak. Water level remained constant in the month of June at all stations. The first peak stage at Lalbegiaghat was on 2 nd July which reached Sikandarpur on 4 th July, Samastipur on 6 th July, Rosera on 7 th July and Khagaria on 10 th July. Similarly the second peak came on 14 th July at Lalbegiaghat which reached Khagaria on 20 th July. Water level then receded sharply up to 19 th July at Lalbegiaghat to 22 nd July at Rosera. Then up to 14 th August there was gradual recession in the stage level of the river. After that water level started continuously rising and reached the maximum peak of this year on 1 st September at Lalbegiaghat and on 6 th September at Khagaria. Water level remained below the danger level throughout this year except at Khagaria where it crossed the danger level on 30 th August and remained above danger level up to 10 th September. Thereafter, water level receded continuously till 15 th October. Chronological plot of water levels at the upper-most station Lalbegiaghat shows sharp peaks and valleys which signifies the quick response of catchments at this location. Parallel pattern up to Rosera may be due to insignificant contribution of intermediate tributaries and intermediate rainfall. 70 Water-Level at different Gauge Sites of the River Burhi Gandak -Year HFL-67.09M, DL-63.20M ) (m l e v le r te a W HFL-54.29M, DL-52.53M HFL-49.38M, DL M HFL-46.35M, DL M 30 HFL-39.22M, DL M Lalbegiaghat Sikandarpur Samastipur Rosera Khagaria 20 Dates 31
33 5.2.2 Bagmati Sonakhan, Dubbadhar, Chandauli/Kansar, Benibad and Hayaghat are five gauge stations located in sequence from upstream to downstream on the river Bagmati. Chronological plot of water levels at the upper stations shows relatively less rise and fall at Sonakhan in comparison with that at Dubbadhar and Chandauli. Water levels at Dubbadhar and Kansar show the same trend of flow. The first water level peak reached on 3 rd July at Benibad and then receded till 11 th July. Suddenly water level crossed the danger level on 13 th July at Benibad and reached peak of 49.22m on 15 th July and remained above danger level till 28 th July. Again on 21 st August, the water level crossed the danger level and continued till 29 th September at Benibad. Moreover, similar trend was there at Hayaghat. But water level remained below the danger level throughout the season at Hayaghat. Water levels at Dubbadhar and Kansar seem to have good correlation. The graph shows sharp peak at 12 th July and 21 st August at Dubbadhar and Kansar. However, the levels recorded on 21 st August on these two stations seem to be erroneous as these show an unusual rise. Water Level at different Gauge Sites of River Bagmati - Year HFL-70.77M, DL-68.80M Water Level (m) HFL-63.75M, DL-61.28M HFL-60.86M, DL-59.06M HFL-50.01M, DL-48.68M HFL-48.96M, DL-45.72M Sonakhan Dubbadhar Kansar Benibad Hayaghat Dates Kamla Jainagar (weir site), Jhanjharpur railpul (maintained by WRD), and Jhanjharpur (downstream maintained by CWC) are three gauge stations located in sequence from upstream to downstream on the river Kamla. The maximum stage level of this river in the month of June, July, August, September and October are m, m, m, m and 66.6 m respectively at Jainagar. Water level remained below the danger level (69.35 m) throughout this season. However, water level crossed the danger level seven times at Jhanjharpur this season. The highest peak in this year was 51.9 m on 24 th August at Jhanjharpur and this time water level remained above the danger level from 23 rd August to 29 th August. Water level pattern at u/s and d/s of Jhanjharpur railpul is quite parallel. The water level characteristic at Jainagar and Jhanjharpur is different. 32
34 Water Level at different Gauge Sites of River Kamla - Year HFL-70.65M, DL-69.35M Water Level (m) HFL-54.34M, DL-50.00M HFL53.01M, DL-50.00M Jainagar Jhanjharpur (WRD) Jhanjharpur (CWC) 15-Jun 22-Jun 29-Jun 06-Jul 13-Jul 20-Jul 27-Jul 03-Aug 10-Aug 17-Aug Dates 24-Aug 31-Aug 07-Sep 14-Sep 21-Sep 28-Sep 05-Oct 12-Oct Kosi Basua, Baltara, and Kursela are three gauge-stations located in sequence from upstream to downstream on the river Kosi. Chronological plot of water levels at these stations shows that this year trend of Baltara plot is more or less similar in comparison with that at Basua. There was a continuous rise of water level till 25 th July at all these sites. The water level remained above the danger level from 30 th June to 25 th September at Basua. The first peak at Baltara came on 23 rd July and second time it crossed the danger level on 20 th August and continued till 30 th September having maximum peak of m on 28 th August. There was a sudden rise in water level on 26 th July at Kursela. The water level at Kursela crossed the danger level on 27 th August and reached a peak of m on 3 rd September and continued above danger level till 1 st October. Water Level at different Gauge Sites of River Kosi - Year HFL-49.17M, DL-47.75M 45 Water Level (m) HFL-36.40M, DL-33.85M HFL-32.10M, DL-30.00M 20 Basua Baltara Kursela 15 Dates 33
35 5.3 Effect of rainfall in the Nepal region on the river-stages in Bihar River gauge stations in AOI close to the Indo-Nepal border are Lalbegiaghat on Burhi Gandak, Sonakhan on Bagmati, Jainagar on Kamla and Basua on Kosi. Daily river water levels measured at these stations vis-a-vis daily average rainfall of the respective basin above these locations have been plotted on the same charts. Rain-gauge stations considered for averaging are as follows: Name of basin Part under consideration Rain-gauge stations considered for averaging Burhi Gandak Up to Lalbegiaghat Simara, Lalbegiaghat Bagmati Up to Sonakhan Simara, Kathmandu, Nagarkot, Garuda Kamla Up to Jainagar Janakpur*, Sindhuli*, Okhaldunga Kosi Up to Basua Okhaldunga, Taplejang, Dhankutta, Biratnagar, Dharan, Basua *This year rainfall data for Janakpur and Sindhuli in Kamla basin could not be available either from CWC or Nepal website. Hence, the average rainfall for Kamla basin has been taken as the rainfall at Okhaldunga only. Since the rainfall stations are less in number, the correlation between average rainfall and water level of different rivers may not be truly matching because of temporal and spatial variability. Number of rain-gauge stations is too less to account for the aerial variability of rainfall. Therefore, in stead of using rigorous methods, simple arithmetic mean has been used for averaging the rainfall. Basin wise rainfall pattern and corresponding water level are discussed in the following paragraphs Burhi Gandak The first significant average rainfall was 42.2 mm and 77.4 mm on 22 nd and 30 th June respectively over the catchment area of Lalbegiaghat. The plot of water level in the month of June shows no significant effect of rainfall. 34
36 Av. Rainfall in Burhi Gandak Basin and Water Level at Lalbegiaghat - June Average Rainfall (mm) Av. Rainfall Water Level Water Level (m) June The effect of 30 th June rainfall (77.4 mm) can be visualized by water level graph between 29 th June to 2 nd July, where an increase of 1.89 m has been observed. Due to insignificant rainfall till 11 th July, the water level receded up to 11 th July. A rainfall storm came between 10 th and 12 th July having maximum average rainfall of mm on 12 th July which resulted sudden increase in water level (60.46 m) on 13 th July at Lalbegiaghat. Then continuous fall in water level till 19 th July indicates no contribution of rainfall during this period. Again water level continuously rose up to 26 th July, however, rainfall data for this period is not available. After that water level receded continuously in this month. 35
37 Av. Rainfall in Burhi Gandak Basin and Water Level at Lalbegiaghat - July Average Rainfall (mm) Av. Rainfall Water Level Water level (m) July The August stage rainfall graph indicates no effective rainfall till 13 th August. Another rainfall storm came between 12 th and 21 st August having maximum rainfall 25.7 mm on 18 th August which resulted continuous rise in water level and a sudden rise on 20 th August. On 23 rd and 24 th August, the average rainfall was maximum of the month resulting rise in water level and the water level reached the value of mm on 31 st August. This was the maximum for the month. Av. Rainfall in Burhi Gandak Basin and Water level at Lalbegiaghat - Aug Av. Rainfall Water Level Average Rainfall (mm) Water Level (m) August
38 Water level continuously decreased till 16 th September due to scanty rainfall in upper catchment. There was a continuous rainfall between 16 th September and 22 nd September resulting in rise of water level till 24 th September. In the last week of September water level continuously came down and reached minimum level of m of this month. The maximum average rainfall in the upper catchment was 29.4 mm on 24 th September. Av. Rainfall in Burhi Gandak Basin and Water Level at Lalbegiaghat - Sept Average Rainfall (mm) Av. Rainfall Water Level Water Level (m) September Water level slowly receded till 15 th October i.e. in the end of the season. There was no significant rainfall in October. Only 41.2 mm average rainfall occurred on 11 th October, but this did not have an impact on the water level. 37
39 Av. Rainfall in Burhi Gandak Basin and Water Level at Lalbegiaghat - Oct Average Rainfall (mm) Av. Rainfall Water Level Water Level (m) October Bagmati The effective average rainfall of mm occurred on 22 nd June, which raised the water level from m on 22 nd June to 67.9 m on 23 rd June. Again, there was 1.05 m rise in water level between 27 th and 29 th June, however, the average rainfall during this period was very small. It might be the effect of mm rainfall on 27 th June at Nagarkot. The average rainfall in the upper catchment was mm on 30 th June. As this was due to heavy rainfall at Simra ( mm), this rainfall had no effect on water level at Sonakhan. Av. Rainfall in Bagmati Basin and Water Level at Sonakhan - June Average Rainfall (mm) Av. Rainfall Water Level Water Level (m) June
40 In the beginning of July, water level continuously decreased due to less magnitude of rainfall till 6 th July. There was a rise of 1.10 m in water level on 7 th July due to effective rainfall of 23 mm and 35 mm at Kathmandu and Nagarkot respectively. Another rainfall storm came during 8 th to 14 th July, which raised the water level 1.70 m between 10 th and 12 th July. During 16 th to 22 nd July, there was continuous rainfall of varying magnitude resulting in the rise and fall in river water level. Then till 29 th July, water level of the river continuously receded. The rainfall data from 23 rd July to 29 th July is not available. But the receding trend of the river shows that there was not appreciable rain in this period. There was maximum average rainfall of mm on 30 th July which raised the water level by 0.55 m on 30 th July at Sonakhan. Av. Rainfall in Bagmati Basin and Water Level at Sonakhan - July Average Rainfall (mm) Av. Rainfall Water Level Water Level (m) July The isolated rainfall having average rainfall value of mm on 5 th August had no significant effect on water level. Rainfall hyetograph shows that there was continuous rainfall in the upper catchment in Nepal from 7 th August to 31 st August. Accordingly water level rose and fell during this period and ultimately the maximum level of 69.8 m (above the DL) reached on 25 th August. The maximum average rainfall of mm was there on 24 th August. Then after, there was continuous fall in water level. 39
41 Av. Rainfall in Bagmati Basin and Water Level at Sonakhan - August Av. Rainfall Water Level 70 Average Rainfall (mm) Water Level (m) August September graph shows that the effective average rainfall took place on 2 nd, 7 th, 12 th, 13 th and 22 nd of this month. The rise in water level was accordingly on following dates. An isolated rainfall having average value of mm occurred on 07 th September. But water level graph shows no significant rise on following date. This might be because of rainfall in early periods of the day. We can see a 40 cm rise of water level between September. After 22 nd September, there was steady recession in the river water level till the end of the month. Av. Rainfall in Bagmati Basin and Water Level at Sonakhan - September Average Rainfall (mm) Av. Rainfall Water Level Water Level (m) September The water level graph of October shows that there was almost constant level of water till the end of the flood season and attained a level of m on 15 th October. There was only one 40
42 isolated rainfall of mm on 11 th October. Av. Rainfall in Bagmati Basin and Water Level at Sonakhan - October Average Rainfall (mm) Av. Rainfall Water Level Water Level (m) October Kamla As it has been mentioned earlier that this year rainfall data for Janakpur and Sindhuli or any other station in Kamla basin could not be available either from CWC or Nepal website. Hence, the average rainfall for Kamla basin could not be truly assessed. The analysis for the entire flood season was carried out but due to unavailability of average rainfall, the water level graph was not truly matching with the rainfall hyetograph Kosi Similar analyses were done for Basua station in the Kosi basin also. The results of these analyses month wise during this flood season are described below : Water level at Basua continuously raised from 15 th June to 30 th June. On 15 th June, water level was m which reached m on 30 th June. There were rain on all days from 15 th to 30 th June in the upper catchment, but the effective average rainfall were only on mm, mm, mm, mm and mm on 17 th, 19 th, 20 th, 22 nd and 30 th June respectively. The rising trend of the river continued till 13 th July due to continuous rainfall here and there in the upper catchment of Basua. Then water level receded till 16 th July due to lesser magnitude of rainfall. Again, water level continuously rose and attained peak of m on 22 nd July which was the maximum level during June and July. Also there was maximum average rainfall of mm on 21 st July. After that water level receded till 26 th July and maintained constant level till 30 th July. In the last of the month, there were mm average rainfall on 30 th July followed by mm and mm on 31 st July and 1 st August respectively which resulted rise in water level up to m on 1 st August. 41
43 In the month of August, water level remained almost constant up to 13 th August due to insignificant rainfall. On 14 th August, there was an average rainfall of mm followed by continuous effective rainfall till 24 th August which raised the water level continuously and a peak of m attained on 25 th August, which was more than the previous HFL. Now the new HFL at Basua has become m. Then water level receded till 28 th August. Again, an average rainfall of mm on 27 th August raised the water level on 29 th August. In the beginning of September, water level was steady till 4 th September. During this month, there were no effective rainfall in the upper catchment except mm on 7 th, mm on 21 st and mm on 27 th September. Therefore, water level at Basua remained more or less constant till 24 th September and continuously receded then after till the end of the season. There was no effective rainfall during the month of October, which resulted continuous fall in water level till the end of the flood season Conclusions 1. Water level rises and recedes as the magnitude of rainfall in basins rise or fall, of course, with a certain lead time, still, water level doesn t seem to have a very systematic relationship with average rainfall. The possible reason may be the inadequate number of rain gauge stations used to compute average rainfall, The available rain gauge stations are too less in number to capture the spatial variability of rainfall. Secondly, arithmetic mean doesn t hold well in hilly terrain. Isohyetal method with adequate number of rain gauge stations may improve the result. 2. Rainfall - water-level relation is also bound to be affected by the control structures present upstream of the gauge sites on the rivers. 3. At Lalbegiaghat, Sonakhan, Jainagar and Basua lead time appears to be one day to two days. We can have more precise lead time if we use hourly or two-hourly data series in the analysis. 42
44 5.4 Rainfall Forecast Under a memorandum of understanding signed between FMISC, Bihar and IMD, New Delhi, the IMD has been providing rainfall forecast for an area between latitude N to N and longitude E to E. This area entirely covers the focus area of FMIS, catchments area of all rivers lying in Nepal and some adjoining area in Bihar as well as Nepal. The forecasts were done using the Weather Research and Forecasting (WRF) Model. It is a next-generation mesoscale numerical weather prediction system designed to serve both operational forecasting and atmospheric research needs. WRF model rainfall forecast, from IMD, Delhi is for 9 X 9 km resolution, i.e. total 1386 numbers of grids covering the area. The forecast is made available every day for the next three consecutive days separately i.e. for day1, day2 and day3. Maximum value of forecasts for each river basins of the focus area of FMIS were extracted and provided in the Daily Flood Information Bulletin issued from the FMISC. These forecasts were used to acquire the availability of satellite images with NRSA, Hyderabad on the days likely to have critical rainfall. A study was undertaken within FMIS to compare the 3 day WRF model forecast with the actual observed rainfall for Gandak, Burhi Gandak, Bagmati, Kosi and Mahanada basin. The forecast station that was chosen from 1386 grid stations are the one which lay within 4.5 km radius of the observation station both in Nepal and India (Bihar region). This was done by applying nearest neighborhood analysis in GIS environment. Thus eleven forecast stations were determined among the available data set of IMD. To better understand the relation between forecasted rainfall and observed rainfall, two different set of forecasted values were taken, one which lay within 4.5 km radius and another taking average of the stations lying nearby the observed station. To illustrate the forecasted station taken for study is being depicted in Map and Table illustrates the station name, basin name, region and position of the observation site and WRF model stations. 43

45 Map Basinwise IMD rainfall forecast station and observation station in Nepal and India (Bihar) 44
46 Table 5.4.1: Names of the stations taken for the comparison with WRF model forecast S N Name of Basin Region Name of Station Position WRF model Station Name Position 1 Gandak Nepal Pokhara 84.00E 28.2N F E 28.16N India (Bihar) Chatia 84.66E 26.48N F E 26.48N 2. Burhi- Gandak Nepal Simra 84.98E 27.17N India Samastipur 85.74E (Bihar) 25.86N F E 27.14N F E 25.83N 3. Bagmati Nepal Kathmandu 85.37E 27.7N F E 27.69N India (Bihar) Benibad 85.58E 26.08N F E 26.11N 4. Kosi Nepal Taplejung 87.67E 27.35N Nepal Okhaldunga 86.5E 27.32N F E 27.32N F E 27.32N India (Bihar) Basua 86.60E 26.12N F E 26.11N 5. Mahananda Nepal Biratnagar 87.27E 26.48N F E 26.48N India (Bihar) Dhengraghat 87.78E 25.86N F E 25.83N The forecasted rainfall in Gandak Basin at Pokhara (Nepal) is more than observed and there is no match in trend. Chatia in India (Bihar) shows that if there is rise in forecasted value it gives an indication of an event and that rainfall occurs, but the lower rainfall and no rainfall donot have indicative forecast rainfall and there is no match in value. On 16 th September actual rainfall is 122 mm, and 2-day forecast on 13 th Sep. is 1.3 mm, 1-day forecast on 14 th sep. is 8.26 mm and the 0-day forecast on 15 th sep is only 7.7 mm. (these are forecasted rainfall for 16 th September). This gives misleading idea. 45
47 In Burhi Gandak Basin, at Simra(Nepal) there is no match in observed rainfall and the forecasted rainfall. The observed rainfall is much more than the forecasted rainfall. At Samastipur(Bihar) there is no match in trend and even the values gave no indication for the event. In Bagmati Basin the WRF model rainfall forecast in Kathmandu(Nepal) shows a better match in month of August and September. In June, July and October there was no match in trend and even the value of the forecasted rainfall did not corresponds with the observed rainfall. Observed Rainfall against 3-day IMD Rainfall Forecast at Kathmandu (Bagmati Basin) observed 0 day forecast 1 day forecast 2 day forecast 80 rainfall in mm day/month/year Observed Rainfall against 3 day Rainfall Forecast at Benibad (Bagmati Basin) observed 0-day forecast 1-day forecast 2-day forecast 80 rainfall in mm day/month/year 46
48 The peaks in WRF model s forecasted rainfall in Benibad (Bihar), in August and middle of September 10 gave an indication of occurrence of the event but the observed value is more than the forecasted value. Other wise in other days of this monsoon season there was no indication from the forecasted rainfall to assess the actual occurrence of the event. Except for one event on 12 th July 10 the forecasted was not alarming and the actual rainfall measured 110 mm on the other hand on 23 rd July the 0-day forecasted rainfall was 104 mm and no rain occurred. Sample graph for Bagmati Basin is included in this report. In Kosi Basin Taplegunj & Okhaldunga (Nepal) there is not match in forecasted rainfall to observed rainfall therefore no inference could be drawn. For in Basua (Bihar) the model gave some indication of match in month of July but in other months of monsoon 10 there is no match. WRF model could not forecast the zero rain and low rain. In Mahananda Basin at Biratnagar (Nepal) the trend of forecasted rainfall in August & last week of September 10 gave an indication of occurrence of the event through the value is not matching. Other events of monsoon 2010 are not matching with the WRF model rainfall forecast. At Dhengraghat (Bihar) the trend of the WRF model rainfall forecasted data gave an indication of the occurrence of the event in month of June and July. Map illustrates the IMD forecasted station taken to get the average forecasted 0-day, 1- day and 2-day rainfall forecast. A sample graph from bagmati basin is given below to have a view of the wrf model forecast when averaged and compared with the observed rainfall at Kathmandu in Nepal and Benibad in Bihar. Observed Rainfall against 3-day IMD Rainfall Forecast at Kathmandu (Bagmati Basin) observed 0-day forecast 1-day forecast 2-day forecast 80 rainfall in mm day/month/year 47
49 Observed Rainfall against 3-day IMD Rainfall Forecast at Benibad (Bagmati Basin) Observed 0-day forecast 1-day forecast 2-day forecast 80 rainfall in mm day/month/year Conclusion One can conclude from the preceding paragraphs that the WRF model rainfall forecast needs some improvement to catch the trend. In general the forecasted values and the observed values are not in agreement and varying widely. The average forecast gave better graphical match. At times the trends are matching but absolute values are not matching at all. This aspect has to be looked upon by the model team. The not available data also affect the peaks. Another point is that the study is done for point rainfall, aerial observed rainfall pattern may give a better result. 5.5 Satellite based analysis of Flood Impact This year there was no major flood event, hence no major inundation or breach are reported. One event in Gandak Basin at Baterdeh was the sole event during 2010 monsoon kept the cell constantly at its toe. FMIS customized the inundation layers provided by NRSA under National Disaster Management Programme (NDMSP) RADARSAT images covering the AOI are obtained during the flood season to view the flood impact. These images were procured and primarily processed under national disaster management support program (DMSP) by NRSC, Hyderabad, and then given to the Flood Management Improvement Support Center, Patna where value addition was done and disseminated to the user departments: Water Resources, Disaster Management, and Agriculture Departments. The maps depict the extent of flood inundation. The statistics 48
50 elaborates the number of blocks / villages under inundation, population, and area affected etc. Details of the satellite data acquired are as mentioned in the following table. SL. No Date of Satellite data Acquired Date of satellite data received / product Dissemination Type of Satellite/ Sensor Trigger / Incidence 1 17 Jul Jul 10 Radarsat 2 Flood Inundation in North Bihar 2 24 Jul Jul 10 Radarsat 2 Flood Inundation in North Bihar 3 26 Aug Aug 10 Radarsat 2 Flood Inundation in North Bihar 4 27 Aug Aug 10 Radarsat 2 Flood Inundation in North Bihar 5 29 Aug Aug 10 Radarsat 1 Flood Inundation in North Bihar 6 31 Aug Sep 10 Radarsat 2 Flood Inundation in North Bihar 7 5 Sep 10 6 Sep 10 Radarsat 1 Flood Inundation in North Bihar 8 8 Sep 10 9 Sep 10 Radarsat 1 Flood Inundation in North Bihar 9 12 Sep Sep 10 Radarsat 2 Flood Inundation in North Bihar Sep Sep 10 Radarsat 2 Flood Inundation in North Bihar Sep Sep 10 Radarsat 2 Flood Inundation in North Bihar Sep Sep 10 Radarsat 2 Flood Inundation in North Bihar Sep Sep 10 Radarsat 1 Flood Inundation in North Bihar 49
51 5.5.1 Value Added Inundation Maps Based on our past experience of last three flood seasons we have tried to make our maps more useful to a greater number of users with varied interest and responsibilities. The maps are customized showing the administrative boundaries, important settlements, location of gauge sites; both for water level and rainfall along with trend of water level; relief camps as well as location of sites where roads have been overtopped by flood waters. Also for more value addition we have enriched our Geo database from various sources. The Information products are found to be very useful in planning movement of officials and material for flood affected areas. The same information is posted over our website as soon as the product is ready. The customized products prepared in flood season 2010 for different stakeholders such as water recourses department, disaster management department, bihar rajya pul nirman nigam and agriculture department are as follow: Flood Inundation maps Area Specific Maps During Flood river status maps based on MODIS data Post Flood river status maps based on MODIS data River specific maps for kosi & Gandak based on MODIS data River configuration maps based on RISAT-2 data for kosi & Gandak rivers Probable inundation maps Breach Maps 50

 2 Inundation map customized for WRD part of north Bihar showing rivers,")
52 Map Inundation map customized for DMD part of north Bihar showing block boundaries (based on Radarsat-1 satellite image dated 29 th Aug 10.) Map Inundation map customized for WRD part of north Bihar showing rivers, embankment and hydrological status (based on Radarsat 1 satellite image dated 29 th Aug 10.) 51

53 Map Area specific Inundation map customized up to village level details of the Administrative units along with rivers, embankment, NH, SH, other roads, Rail line & its stations and hydrological status of this particular flood trigger in part of north Bihar dated on 29 th Aug. 10 based on Radarsat 1 inundation layer. Other customized products: 52

54 Based on Moderate Resolution Imaging Spectroradiometer (MODIS) satellite data: We are regularly monitoring the river status with the help of MODIS satellite data of during flood and post flood also. This data is basically used for the over view of the big area, its showing the river system of the north Bihar rivers. Map Map showing overview of North Bihar Rivers during flood Season 2010 based on MODIS 9 th August


55 Map Kosi as on 26 th Aug 10 Map Gandak as on 26 th Aug 10 54

56 Map Map showing overview of North Bihar Rivers post flood Season 2010 based on MODIS 29 th October

57 Map Map showing Status of River Gandak based on RISAT images acquired prior to breach at Baterdeh. 56

58 Map Map showing Status of River Kosi based on LISS 3 image acquired on 3 rd Nov

59 Map Map showing Probable as well as actual inundation due to Breach at Baterdeh. 58

60 Map Map showing inundation due to Breach/ overtopping of jamindari bund of Lakhandei river. Green dots are the points where overtopping was reported Maximum Inundation Extent Map 59
61 Maximum Extent of Inundation map is derived from RADARSAT data from 17th July to 24th September. 12 numbers of scenes of the focus area were taken to prepare the layers of inundation maps. These layers were used to generate the maximum extent of inundation during the flood season The map shows the area is flooded at least once in the given period (17th July to 24th September). The maps were prepared for Water Resources Department and Disaster Management Department. Department of Agriculture can use these map for assessing water logged area and hence plan cropping pattern. Statistics of Inundated Geographic Area of Part of Bihar state on till 24 th September 2010: District Level Statistic of Maximum Inundated Area During Flood Season 2010, Part of North Bihar State Sl. No. District Name Geographical Area (Hecht.) Maximum Inundation (Hecht.) Maximum Inundation Percentage 1 Saharsa Darbhanga Khagaria Muzaffarpur Eastchamparan Samastipur Madhubani Sitamarhi Supaul Begusarai Sheohar

62 Map Maximum inundation map of flood season Flood Intensity Map The maps are prepared using the Radarsat scenes as referred in above paragraph. This has been prepared for district level and block level at the end of monsoon season Map Block level Flood Intensity Map of Flood Season
 was submitted for consideration of the World Bank through Department of Economic Affairs (DEA) for Bank s priority assistance for extended focus area covering whole of")

63 6.0 Bihar FMIS Phase II As FMIS Phase I came to an end on , a fresh Grant proposal for Bihar FMIS Phase-2 worth US $ 3.03 million (client executed) was submitted for consideration of the World Bank through Department of Economic Affairs (DEA) for Bank s priority assistance for extended focus area covering whole of North Bihar, with the objective of improved flood forecasting and early spatial warning. After extensive consultation and frequent discussions with the stakeholders and field visits to the project area by the World Bank team in Feb 2009 the original proposal of FMIS Phase II submitted by GoB, was restructured and updated by the World Bank, based on fresh as well as actual needs (especially after post Kosi flood 2008) and capacity of the implementing agency. Accordingly the project cost was updated by the Bank to nearly US $ 5.98 million (client + WB executed). In the meantime the DEA, MOF, GOI down scaled the project to US $ 1.5 million to accommodate other proposals within the overall DFID fund availability. Therefore the project was re- restructured within available 1.5 million U S $ cost and the agreement between the WB and DEA, MOF, GOI for the project was signed on Funding / Financing of the FMIS Ph II Project The total cost of the development of the project is estimated as Rs lac out of which Rs (nearly US$ 1.5 million, taking 1 US $ = INR 45) would come from Technical Assistance (TA) from the World Bank, as per Letter of Agreement signed between DEA, GOI and the World Bank and rest Rs. 150 lac would come from state contribution to the project. The State contribution includes Rs lac already disbursed from to to sustain the functioning of the FMISC and Rs lac has been kept to obtain various satellite data from NRSC and for other miscellaneous expenditure. 62
64 The TA amount would be received as hundred percent Grant from DFID-World Bank. If additional resources (beyond this current 1.5 m US $ TA) be available, many of these components can easily be scaled upward. Moreover, additional Bank-executed resources may be sought to support and guide the GoB in overall project implementation. DFID (World Bank) Grant State contribution -- Rs lac -- Rs lac Total -- Rs lac Project Components The TA will have the following components: Component A: Institutional Strengthening for Flood Management This Component will include support for the institutional strengthening essential to achieve and sustain the aims of the project. This will include support for a multi-sectoral focal point Center on flood information and analysis (transitioning from the current FMIS Cell), the Water Resources Department (WRD), as well as in linking with partner agencies (in particular, the Disaster Management Department). Support will be provided for strengthening Flood Management Improvement Support Centre and setting up emergency flood control rooms, including office and equipment up gradation,, improved connectivity, video conferencing facility, as well as training and other capacity building (including up gradation of manuals) and moving to a comprehensive strategy for modernizing policy, institutional, and technical aspects of flood management in Bihar. In addition, Bank-financed activities will support a Panel of Experts to help improve quality of the entire project, as well as special studies and international training. The two proposed focus areas are: A1. Capacity Building and training This includes support for improving flood management through: Flood Management Improvement Support Center strengthening through recruitment of specialist staff, office upgrading, equipment including connectivity upgrading, and incremental operational expenses, building on the current FMIS Cell, as a focal point to provide state-of-the-art flood information and analytical services to floodrelated departments. Strengthening the Water Resources Department s Flood Monitoring Cell and Hydrology Directorate, through recruitment of specialist staff, office upgrading, equipment including connectivity upgrading, and incremental operational expenses, to improve their current activities and interface with the Flood Management Improvement Support Center. In addition, WRD offices will be strengthened, including higher-level offices in flood-affected areas, and field offices in the targeted area (e.g. Sitamarhi, Sheohar, Runnisaidpur Divisions, SE Sitamarhi, CE Muzzafarpur) through office and equipment upgrading including connectivity, critical specialist staff and incremental office expenses. A2 Flood management strategy and planning An Integrated Flood Management Plan will be developed for the Bagmati Basin by considering flood issues with other interlinked water resources management issues. In addition, this activity would support special studies to upgrade flood management manuals and outline larger-scale institutional strengthening for the Water Resources Department. 63
65 Component B: Development of Flood Management Information Systems This Component will include support for the development of a modern flood management information system for Bihar, with an initial demonstration in selected areas of the Bagmati/Adwara Group basin. This will include support for improving the spatial knowledge base for flood management, developing and using models for forecasting flood flow and inundation, and the establishment of a much-needed embankment asset management system. Support will be provided for associated consultancies, surveys, satellite imagery and other data procurement, and related operating expenses. The proposed focus areas are: B1 Improve Knowledge Base for Flood Management This activity will support activities to strengthen the knowledge base to improve flood management. This includes support for critical topographic and other surveys (e.g. crosssections/longitudinal sections of embankments and river) in the focus areas of the Bagmati Basin and Adwara Group. In addition, support will be provided to immediately upgrade the inadequate and very outdated monitoring network for precipitation, flood flows, and sediment. New institutional arrangements will be piloted under which the network stations will be owned and operated by the concerned Chief Engineer s field offices, while the data compilation, archival and processing in the Hydrological Information System will be centrally performed by the Hydrology Directorate. This would require issue of necessary office order assigning the site operation and measurement responsibility to Chief Engineer office in Bagmati-Adhwara basin, and strengthening the Hydrology Directorate at Patna with additional WRD staff that will be provided requisite training through Short Term Consultants recruited under this project. The activity will also provide support for the development of a satellite imagery based spatial database covering floodprone North Bihar. B2 Improve Modeling/Analysis for Flood Warning This activity supports flood forecasting and flood inundation modeling in the Bagmati/Adwara Group basin, (enhancing the stage level warnings based on gage-to-gage correlation today). Both traditional and innovative modeling approaches will be attempted. In addition the component will support studies on river course migration and analysis of flood hazard/risk/vulnerability. B3 Establish an Embankment Asset Management System The embankment system in North Bihar is extensive, but suffers from extensive problems of poor construction and negligible maintenance, exacerbated by the lack of any systematic inspection programs and techniques and data to assess current embankment status or prioritize embankment investments. This activity will support the development of a systematic Embankment Asset Management System (EAMS) for Bagmati-Adhwara basin supported by detailed modern surveys of the embankment status in the Bagmati - Adhwara basin that is partially embanked and where substantial investments for new embankments are planned. Community participation for embankment surveillance, and to update embankment safety information in the EAMS will be piloted Component C: Community-Based Flood Risk Management in Targeted Areas This Component will include support for the planning and implementation of community-based flood management in selected areas of the Bagmati-Adwara basin. This will include support for consultancies, communication systems, and associated operating expenses. The proposed focus areas are: C1. Planning Community Outreach for Flood Management 64
66 This activity will support the planning for community outreach for effective flood management, focused on the situation on the ground in the targeted areas of the Bagmati- Adwara Basin. Technical assistance will be provided to develop strategies to improve community awareness, preparedness, and response, including institutional arrangements and tools for improved early warning communication and dissemination and for community reporting of flood problems. C2. Enhancing Community Participation for Flood Management This activity will support the implementation of efforts to improve community participation for selected flood-prone areas of the Bagmati-Adwara Basin. This will include support for technical assistance, communication tools, and community participation to demonstrate the last mile connectivity and involving the WRD, Disaster Management Department, District administration, and other institutions. Synergies with the existing Bank-financed Bihar Livelihoods Project are also being explored. Budget Table Client Executed Component Sub-Component Total (INR) A. Institutional Strengthening for Flood Management A1. Capacity Building and training 24,300,000 A2 Flood management strategy and planning 4,000,000 Total 28,300,000 B1 Improve Knowledge Base for Flood Management 21,000,000 B. Development of Flood Management Information Systems B2 Improve Modeling/Analysis for Flood Warning 9,850,000 B3 Establish an Embankment Asset Management System 5,100,000 Total 35,950,000 C. Community- Based Flood Risk Management C1. Planning Community Outreach for Flood Management C2. Enhancing Community Participation for Flood Management in Targeted Areas 750,000 2,500,000 Total 3,250,000 Total Project Costs 67,500,000 This will be complemented by Bank Executed activities related to: Panel of Experts Supervision Support 65

67 66 Appendix 1
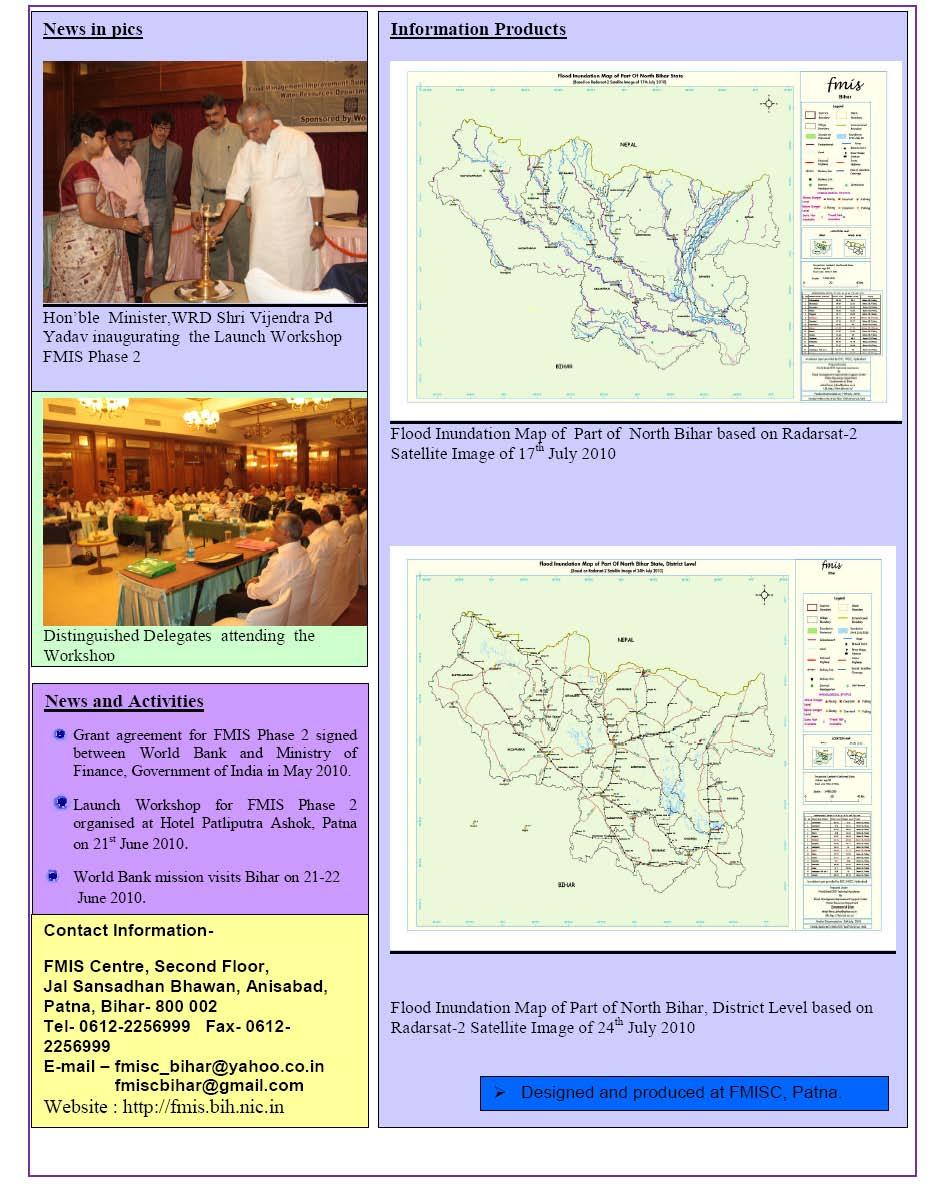
68 67


69
Flood Management Improvement Support Centre
 fmisc Bihar Flood Management Improvement Support Centre FLOOD REPORT 2011 Water Resources Department Government of Bihar Towards a Culture of Preparedness for Better Flood Management For official use only
Preface. I hope all the stakeholders will find this report very useful.
 Preface It is my pleasure to present Flood Report 2009 prepared by the Flood Management Information System Cell. This is the third annual report since its inception in the year 2007. Flood Management Information
fmisc Bihar Flood Management Improvement Support Centre Flood Report 2012 Towards a Culture of Preparedness for Better Flood Management
 fmisc Bihar Flood Management Improvement Support Centre Towards a Culture of Preparedness for Better Flood Management Flood Report 2012 Water Resources Department Government of Bihar For official use only
ACKNOWLEDGEMENT. (Ajit Kumar Samaiyar) Joint Director FMISC, Patna
 Joint Director FMISC, Patna") ACKNOWLEDGEMENT Once again, like previous years the end of the season Flood Report, 2013 is ready for publication and I feel gratified to acknowledge the untiring and meticulous effort put forth by FMISC
ACKNOWLEDGEMENT Once again, like previous years the end of the season Flood Report, 2013 is ready for publication and I feel gratified to acknowledge the untiring and meticulous effort put forth by FMISC
DISTRICTWISE ACHIEVEMENT OF CMHM
 DISTRICTWISE ACHIEVEMENT OF CMHM - 2016-17 Districtwise and Achievement under CMHM Fin. Year 2016-17 (Phy. in Hect./Nos., Fin. in Lakh Rs.) Sl. Districts Name Phy Fund Available in 2016-17 Achievement
भ रत सरक र GOVERNMENT OF INDIA. Precipitation/TS Forecast For Districts of BIHAR भ रत म सम वज ञ न वभ ग
 भ रत सरक र GOVERNMENT OF INDIA भ रत म सम वज ञ न वभ ग म सम वज ञ न क दर, अ नस ब द, पटन बह र, पन क ड- 800002 INDIA METEOROLOGICAL DEPARTMENT METEOROLOGICAL CENTRE, ANISHABAD, PATNA, BIHAR PIN CODE800002 द
Fish Pond. Old Secretariate. Shaheed Smarak
 Fish Pond Old Secretariate Shaheed Smarak HOW SATELLITE SCANS EARTH. Rajbhawan area viewed by IKONOS 1 meter sensor Very high resolution (40 cm) Orbi-Image data Higher the resolution better the geometric
Climate Change in Bihar, India:A Case Study
 Climate Change in Bihar, India:A Case Study L. B. Roy 1, M. Bhushan 2, R. Kumar 2 1,2 Civil Engineering Department, National Institute of Technology Patna Patna-800005, Bihar, India 1 lbroy@nitp.ac.in
By Lillian Ntshwarisang Department of Meteorological Services Phone:
 By Lillian Ntshwarisang Department of Meteorological Services Phone: +267 3612200 Email: lntshwarisang@gov.bw/ lntshwarisang@gmail.com Introduction Mandate of DMS Function of the Department Services to
Use of Climate information in Disaster Risk Management in Zimbabwe
 Use of Climate information in Disaster Risk Management in Zimbabwe WMO Regional Technical Meeting & User/CONOPS Workshop, 28 th October 2015 Lameck Betera Department of Civil Protection Institutional Arrangements
Chapter 2 Drought Hazard in Bihar
 Chapter 2 Drought Hazard in Bihar 2.1 Introduction Drought occurs when a region faces a deficiency in its water supply either surface or underground for an extended period of months or years, due to consistent
Outline. Remote Sensing, GIS and DEM Applications for Flood Monitoring. Introduction. Satellites and their Sensors used for Flood Mapping
 Outline Remote Sensing, GIS and DEM Applications for Flood Monitoring Prof. D. Nagesh Kumar Chairman, Centre for Earth Sciences Professor, Dept. of Civil Engg. Indian Institute of Science Bangalore 560
GEOSPATIAL TECHNOLOGY IN HUMANITARIMAPPING A CASE STUDY OF KOSI RIVER FLOODS: 2008, INDIA
 GEOSPATIAL TECHNOLOGY IN HUMANITARIMAPPING A CASE STUDY OF KOSI RIVER FLOODS: 2008, INDIA APARAJITA GAHTAK ACTED, India B5/18, Safderjung Enclave, New Delhi 110029 Delhi.gis@acted.org Abstract: About the
Part 1: Weather Forecast Severe Weather Warnings (Source: IMD, Date: 1 st September, 2008)
") Sphere India Unified Response Strategy Situation report (India Floods 2008) 01 st September 2008 Part 1: Weather Forecast Severe Weather Warnings (Source: IMD, Date: 1 st September, 2008) HEAVY RAINFALL
Sphere India Unified Response Strategy Situation report (India Floods 2008) 01 st September 2008 Part 1: Weather Forecast Severe Weather Warnings (Source: IMD, Date: 1 st September, 2008) HEAVY RAINFALL
Republic of Mozambique
 Republic of Mozambique Second Expert's Symposium on Multi-Hazard Early Warning Systems with focus on the Role of National Meteorological and Hydrological Services 5-7 May 2009, Toulouse France 1. Background
July, International SWAT Conference & Workshops
 July, 212 212 International SWAT Conference & Workshops Hydrological Modelling of Kosi and Gandak Basins using SWAT Model S. Dutta, Pritam Biswas, Sangita Devi, Suresh A Karth and Bimlesh kumar, Ganga
Schematic Natural Hazard Zonation of Bihar using Geoinformatics
 Working paper Schematic Natural Hazard Zonation of Bihar using Geoinformatics Tuhin Ghosh Anirban Mukhopadhyay June 2013 Schematic Natural Hazard Zonation of Bihar Using Geoinformatics By Dr. Tuhin Ghosh
Environmental Challenge due to Climate Change in Bihar, Developing State of India
 Abstract Environmental Challenge due to Climate Change in Bihar, Developing State of India Dr Chandra Shekhar Singh (1), Dr Kumari Anima (2), Prof. Bimal Kumar (3), Er Gautam (4), Er Ankita Kumari (5)
Hydrological forecasting and decision making in Australia
 Hydrological forecasting and decision making in Australia Justin Robinson, Jeff Perkins and Bruce Quig Bureau of Meteorology, Australia The Bureau's Hydrological Forecasting Services Seasonal Forecasts
VILLAGE INFORMATION SYSTEM (V.I.S) FOR WATERSHED MANAGEMENT IN THE NORTH AHMADNAGAR DISTRICT, MAHARASHTRA
 FOR WATERSHED MANAGEMENT IN THE NORTH AHMADNAGAR DISTRICT, MAHARASHTRA") VILLAGE INFORMATION SYSTEM (V.I.S) FOR WATERSHED MANAGEMENT IN THE NORTH AHMADNAGAR DISTRICT, MAHARASHTRA Abstract: The drought prone zone in the Western Maharashtra is not in position to achieve the agricultural
VILLAGE INFORMATION SYSTEM (V.I.S) FOR WATERSHED MANAGEMENT IN THE NORTH AHMADNAGAR DISTRICT, MAHARASHTRA Abstract: The drought prone zone in the Western Maharashtra is not in position to achieve the agricultural
Progress Report. Flood Hazard Mapping in Thailand
 Progress Report Flood Hazard Mapping in Thailand Prepared By: Mr. PAITOON NAKTAE Chief of Safety Standard sub-beuro Disaster Prevention beuro Department of Disaster Prevention and Mitigation THAILAND E-mail:
EARLY WARNING IN SOUTHERN AFRICA:
 EARLY WARNING IN SOUTHERN AFRICA: Enhancing the Meteorological Early Warning System Eugene Poolman South African Weather Service OUTLINE OF PRESENTATION Impact of Climate Change Meteorological Early Warning
PRE MONSOON TROPICAL CYCLONE ALERT (LAILA)
") PRE MONSOON TROPICAL CYCLONE ALERT (LAILA) (Updated as on 19 th May, 2010, 10.00 AM) A pre-monsoon Tropical Cyclone alert has been issued for all the coastal districts of Orissa by the Special Relief Commissioner
PRE MONSOON TROPICAL CYCLONE ALERT (LAILA) (Updated as on 19 th May, 2010, 10.00 AM) A pre-monsoon Tropical Cyclone alert has been issued for all the coastal districts of Orissa by the Special Relief Commissioner
Proposal Report On Flood Hazards Mapping Project In Xebangfai River
 Proposal Report On Flood Hazards Mapping Project In Xebangfai River Prepared By Mr. Boualaythong KOUMPHONH Climate Division Department of Meteorology and Hydrology Water Resources and Environment Administration
Grant 0299-NEP: Water Resources Project Preparatory Facility
 Document Produced under Grant Project Number: 45206 May 2016 Grant 0299-NEP: Water Resources Project Preparatory Facility Final Report Volume 3 East Rapti (1 of 9) Prepared by Pvt. Ltd. For Ministry of
Country Report Nepal Geospatial Data Sharing Initiatives of Survey Department Supporting Disaster Management
 Third JPTM Step 2 for Sentinel Asia 6-8 July, 2010 Manila, The Philippines Country Report Nepal Geospatial Data Sharing Initiatives of Survey Department Supporting Disaster Management Durgendra M Kayastha
United States Multi-Hazard Early Warning System
 United States Multi-Hazard Early Warning System Saving Lives Through Partnership Lynn Maximuk National Weather Service Director, Central Region Kansas City, Missouri America s s Weather Enterprise: Protecting
THE 3D SIMULATION INFORMATION SYSTEM FOR ASSESSING THE FLOODING LOST IN KEELUNG RIVER BASIN
 THE 3D SIMULATION INFORMATION SYSTEM FOR ASSESSING THE FLOODING LOST IN KEELUNG RIVER BASIN Kuo-Chung Wen *, Tsung-Hsing Huang ** * Associate Professor, Chinese Culture University, Taipei **Master, Chinese
Georeferencing and Satellite Image Support: Lessons learned, Challenges and Opportunities
 Georeferencing and Satellite Image Support: Lessons learned, Challenges and Opportunities Shirish Ravan shirish.ravan@unoosa.org UN-SPIDER United Nations Office for Outer Space Affairs (UNOOSA) UN-SPIDER
National Public Weather and Warning Services in the Swaziland Meteorological Service Dennis S.Mkhonta /
 National Public Weather and Warning Services in the Swaziland Meteorological Service Dennis S.Mkhonta dennis.mkhonta@gmail.com / dennis@swazimet.gov.sz Introduction Swaziland s geographical position exposes
Flood hazard mapping in Urban Council limit, Vavuniya District, Sri Lanka- A GIS approach
 International Research Journal of Environment Sciences E-ISSN 2319 1414 Flood hazard mapping in Urban Council limit, Vavuniya District, Sri Lanka- A GIS approach Abstract M.S.R. Akther* and G. Tharani
Paper presented in the Annual Meeting of Association of American Geographers, Las Vegas, USA, March 2009 ABSTRACT
 Paper presented in the Annual Meeting of Association of American Geographers, Las Vegas, USA, March 2009 ABSTRACT CHANGING GEOMORPHOLOGY OF THE KOSI RIVER SYSTEM IN THE INDIAN SUBCONTINENT Nupur Bose,
Report on Disaster statistics of Nepal
 Report on Disaster statistics of Nepal Submitted by Altaf Rehman Submitted to Dr. Naveed Ahmed University of engineering and technology Peshawar Assignment 1 Section A Registration id 14PWCIV456 Page 1
DROUGHT ASSESSMENT USING SATELLITE DERIVED METEOROLOGICAL PARAMETERS AND NDVI IN POTOHAR REGION
 DROUGHT ASSESSMENT USING SATELLITE DERIVED METEOROLOGICAL PARAMETERS AND NDVI IN POTOHAR REGION Researcher: Saad-ul-Haque Supervisor: Dr. Badar Ghauri Department of RS & GISc Institute of Space Technology
GENERAL. CHAPTER 1 BACKGROUND AND PURPOSE OF THE GUIDELINES Background of the Guidelines Purpose of the Guidelines...
 GENERAL CHAPTER 1 BACKGROUND AND PURPOSE OF THE GUIDELINES... 1 1.1 Background of the Guidelines... 1 1.2 Purpose of the Guidelines... 3 CHAPTER 2 APPLICATION OF THE GUIDELINES... 3 2.1 Potential Users
South Asia Flash Flood Guidance System Operational Workshop (Step-4)
") South Asia Flash Flood Guidance System Operational Workshop (Step-4) (5 th to 7 th June 2018) Operational Flash Flood Forecasting and Early Warnings Capabilities in Bhutan (Sonam Tashi) Weather Forecaster
South Asia Flash Flood Guidance System Operational Workshop (Step-4) (5 th to 7 th June 2018) Operational Flash Flood Forecasting and Early Warnings Capabilities in Bhutan (Sonam Tashi) Weather Forecaster
Complete Weather Intelligence for Public Safety from DTN
 Complete Weather Intelligence for Public Safety from DTN September 2017 White Paper www.dtn.com / 1.800.610.0777 From flooding to tornados to severe winter storms, the threats to public safety from weather-related
CLIMATE CHANGE ADAPTATION BY MEANS OF PUBLIC PRIVATE PARTNERSHIP TO ESTABLISH EARLY WARNING SYSTEM
 CLIMATE CHANGE ADAPTATION BY MEANS OF PUBLIC PRIVATE PARTNERSHIP TO ESTABLISH EARLY WARNING SYSTEM By: Dr Mamadou Lamine BAH, National Director Direction Nationale de la Meteorologie (DNM), Guinea President,
FLOOD HAZARD AND RISK ASSESSMENT IN MID- EASTERN PART OF DHAKA, BANGLADESH
 FLOOD HAZARD AND RISK ASSESSMENT IN MID- EASTERN PART OF DHAKA, BANGLADESH Muhammad MASOOD MEE07180 Supervisor: Prof. Kuniyoshi TAKEUCHI ABSTRACT An inundation simulation has been done for the mid-eastern
Summary and Conclusions
 241 Chapter 10 Summary and Conclusions Kerala is situated in the southern tip of India between 8 15 N and 12 50 N latitude and 74 50 E and 77 30 E longitude. It is popularly known as Gods own country.
Overview of Early Warning Systems and the role of National Meteorological and Hydrological Services
 Overview of Early Warning Systems and the role of National Meteorological and Hydrological Services South Africa Second Experts Symposium on Multi-Hazard Early Warning Systems With focus on the Role of
NEPAL: FCPF READINESS GRANT FCPFR - FOREST CARBON PARTNERSHIP FACILITY
 Assignment: TF094724 NEPAL: FCPF READINESS GRANT FCPFR - FOREST CARBON PARTNERSHIP FACILITY Task Team Leader: 00000240969 Approving Manager: 00000082671 - Abdelaziz Lagnaoui - Kseniya Lvovsky Summary Information
Economic and Social Council
 United Nations Economic and Social Council Distr.: General 2 July 2012 E/C.20/2012/10/Add.1 Original: English Committee of Experts on Global Geospatial Information Management Second session New York, 13-15
Flash flood disaster in Bayangol district, Ulaanbaatar
 Flash flood disaster in Bayangol district, Ulaanbaatar Advanced Training Workshop on Reservoir Sedimentation Management 10-16 October 2007. IRTCES, Beijing China Janchivdorj.L, Institute of Geoecology,MAS
Report. Developing a course component on disaster management
 Report Developing a course component on disaster management By Chira Prangkio Tawee Chaipimonplin Department of Geography, Faculty of Social Sciences, Chiang Mai University Thailand Presented at Indian
DROUGHT RISK EVALUATION USING REMOTE SENSING AND GIS : A CASE STUDY IN LOP BURI PROVINCE
 DROUGHT RISK EVALUATION USING REMOTE SENSING AND GIS : A CASE STUDY IN LOP BURI PROVINCE K. Prathumchai, Kiyoshi Honda, Kaew Nualchawee Asian Centre for Research on Remote Sensing STAR Program, Asian Institute
Impact of Cyclone Nargis
 Lessons Learnt from Nargis Recovery for the Next Disaster International Recovery Forum (2011) 12, JAN 2011, Kobe, Japan Home for over 100 national races. Profile of Myanmar The 2 nd largest country in
Disaster Management and Spatial Data An Experience of Sri Lanka for Joint project team meeting 2012
 Disaster Management and Spatial Data An Experience of Sri Lanka for Joint project team meeting 2012 1 by Padma Kumara Withana Provincial Surveyor General Uva Province 2 Out line ü Introduction ü Natural
GEOGRAPHIC INFORMATION SYSTEMS Session 8
 GEOGRAPHIC INFORMATION SYSTEMS Session 8 Introduction Geography underpins all activities associated with a census Census geography is essential to plan and manage fieldwork as well as to report results
Role of Hydro-Met Services in Disaster Risk Management
 Role of Hydro-Met Services in Disaster Risk Management Tshewang Rigzin (Mr) National Centre for Hydrology and Meteorology, Bhutan 30 th November 2017 Outline Vision and Mission Functions related to Disaster
3/3/2013. The hydro cycle water returns from the sea. All "toilet to tap." Introduction to Environmental Geology, 5e
 Introduction to Environmental Geology, 5e Running Water: summary in haiku form Edward A. Keller Chapter 9 Rivers and Flooding Lecture Presentation prepared by X. Mara Chen, Salisbury University The hydro
Geospatial application in Kiribati
 Geospatial application in Kiribati ICC-21 ST RESAP (9 TH TO 13 TH OCTOBER, 2017) BANGKOK, THAILAND Outline Kiribati Profile Natural disasters in Kiribati Achievements Challenges/Issues Ways forward 1 Kiribati
Recent development of the National Hydro-Meteorological Service (NHMS) of Viet Nam for disaster risk reduction
 of Viet Nam for disaster risk reduction") Ministry of Natural Resources and Environment National Hydro-Meteorological Service Recent development of the National Hydro-Meteorological Service (NHMS) of Viet Nam for disaster risk reduction Tran Van
Ministry of Natural Resources and Environment National Hydro-Meteorological Service Recent development of the National Hydro-Meteorological Service (NHMS) of Viet Nam for disaster risk reduction Tran Van
Effect of rainfall and temperature on rice yield in Puri district of Odisha in India
 2018; 7(4): 899-903 ISSN (E): 2277-7695 ISSN (P): 2349-8242 NAAS Rating: 5.03 TPI 2018; 7(4): 899-903 2018 TPI www.thepharmajournal.com Received: 05-02-2018 Accepted: 08-03-2018 A Baliarsingh A Nanda AKB
GEOMATICS. Shaping our world. A company of
 GEOMATICS Shaping our world A company of OUR EXPERTISE Geomatics Geomatics plays a mayor role in hydropower, land and water resources, urban development, transport & mobility, renewable energy, and infrastructure
Use of Geospatial data for disaster managements
 Use of Geospatial data for disaster managements Source: http://alertsystemsgroup.com Instructor : Professor Dr. Yuji Murayama Teaching Assistant : Manjula Ranagalage What is GIS? A powerful set of tools
New approaches to warning: the role of radar
 New approaches to warning: the role of radar John Handmer Centre for Risk and Community Safety, RMIT University Today The risk we want to reduce, and how much impact can we have on the risk of disasters?
The National Integrated Drought Information System (NIDIS) Moving the Nation from Reactive to Proactive Drought Risk Management
 Moving the Nation from Reactive to Proactive Drought Risk Management") The National Integrated Drought Information System (NIDIS) Moving the Nation from Reactive to Proactive Drought Risk Management CSG-West Annual Meeting Agriculture & Water Committee Snowbird, UT September
The National Integrated Drought Information System (NIDIS) Moving the Nation from Reactive to Proactive Drought Risk Management CSG-West Annual Meeting Agriculture & Water Committee Snowbird, UT September
Doug Kluck NOAA Kansas City, MO National Center for Environmental Information (NCEI) National Integrated Drought Information System (NIDIS)
 National Integrated Drought Information System (NIDIS)") National Integrated Drought Information System (NIDIS) for the Missouri River Basin Drought Early Warning Information System (DEWS) & Runoff Trends in the Missouri Basin & Latest Flood Outlook Doug Kluck
National Integrated Drought Information System (NIDIS) for the Missouri River Basin Drought Early Warning Information System (DEWS) & Runoff Trends in the Missouri Basin & Latest Flood Outlook Doug Kluck
Central Water Commission Ministry of WR,RD & GR. Operational Flood Forecasting
 Central Water Commission Ministry of WR,RD & GR 1 Operational Flood Forecasting Flood Forecasting by CWC 2 The work of flood forecasting and warning in India is entrusted with the Central Water Commission
Early Warning > Early Action: The Next Frontier. Dr. Arame Tall Climate Services- Global Coordinator, Champion
 Early Warning > Early Action: The Next Frontier Dr. Arame Tall Climate Services- Global Coordinator, Champion a.tall@cgiar.org 2 3/21/11 The Challenge: Bridging The Gap Seasonal Precipitation Forecast
Mapping Coastal Change Using LiDAR and Multispectral Imagery
 Mapping Coastal Change Using LiDAR and Multispectral Imagery Contributor: Patrick Collins, Technical Solutions Engineer Presented by TABLE OF CONTENTS Introduction... 1 Coastal Change... 1 Mapping Coastal
Regional Flash Flood Guidance and Early Warning System
 WMO Training for Trainers Workshop on Integrated approach to flash flood and flood risk management 24-28 October 2010 Kathmandu, Nepal Regional Flash Flood Guidance and Early Warning System Dr. W. E. Grabs
Ms. Latoya Regis. Meteorologist Hydrometeorological Service, Guyana
 Ms. Latoya Regis Meteorologist Hydrometeorological Service, Guyana Background Ninety percent (90%) of Guyana s population resides along the (Atlantic) Coast, which is below mean sea level and accounts
Hydrologic Modelling of the Upper Malaprabha Catchment using ArcView SWAT
 Hydrologic Modelling of the Upper Malaprabha Catchment using ArcView SWAT Technical briefs are short summaries of the models used in the project aimed at nontechnical readers. The aim of the PES India
Country Presentation-Nepal
 Country Presentation-Nepal Mt.Everest, Shiva Pd. Nepal, DHM South Asia Drought Monitor Workshop Dhaka Bangladesh 2 th April 215 Overview Brief Climatology Climate activities- DHM PPCR (Pilot Program for
UNITED NATIONS E/CONF.96/CRP. 5
 UNITED NATIONS E/CONF.96/CRP. 5 ECONOMIC AND SOCIAL COUNCIL Eighth United Nations Regional Cartographic Conference for the Americas New York, 27 June -1 July 2005 Item 5 of the provisional agenda* COUNTRY
Status & Challengers of Cook Islands GEO DRM. Cook Islands GEO S/GIS History
 Status & Challengers of Cook Islands GEO DRM By Patrick A. ARIOKA Planning & Advisory Officer EMERGENCY MANAGEMENT COOK ISLANDS Cook Islands GEO S/GIS History 1990 NZODA/MFAT trained by Landcare Research
Report for Area Drainage Studies for 1320 MW (2x660 MW) THERMAL POWER PROJECT AT MIRZAPUR, U.P.
 THERMAL POWER PROJECT AT MIRZAPUR, U.P.") Report for Area Drainage Studies for 1320 MW (2x660 MW) THERMAL POWER PROJECT AT MIRZAPUR, U.P. 1. Introduction M/s Welspun Energy Uttar Pradesh Ltd. (WEUPL) is putting up 1320 MW (2 x 660 MW) coal fired
Report for Area Drainage Studies for 1320 MW (2x660 MW) THERMAL POWER PROJECT AT MIRZAPUR, U.P. 1. Introduction M/s Welspun Energy Uttar Pradesh Ltd. (WEUPL) is putting up 1320 MW (2 x 660 MW) coal fired
4 th Joint Project Team Meeting for Sentinel Asia 2011
 A Revisit on the Structural Flood Mitigation Measure with the Application of Remote Sensing and GIS in Gin River Basin, Sri Lanka 4 th Joint Project Team Meeting for Sentinel Asia 2011 Geoinformatics Center
STATUS OF HAZARD MAPS VULNERABILITY ASSESSMENTS AND DIGITAL MAPS
 JapanInternational Cooperation Agency STATUS OF HAZARD MAPS VULNERABILITY ASSESSMENTS AND DIGITAL MAPS ANGUILLA REPORT THE CARIBBEAN DISASTER EMERGENCY RESPONSE AGENCY () Table of Contents Page Preface
IGAD CLIMATE PREDICTION AND APPLICATIONS CENTRE (ICPAC) UPDATE OF THE ICPAC CLIMATE WATCH REF: ICPAC/CW/NO. 24, AUGUST 2011
 UPDATE OF THE ICPAC CLIMATE WATCH REF: ICPAC/CW/NO. 24, AUGUST 2011") IGAD CLIMATE PREDICTION AND APPLICATIONS CENTRE (ICPAC) UPDATE OF THE ICPAC CLIMATE WATCH REF: ICPAC/CW/NO. 24, AUGUST 2011 SUMMARY Drought conditions have persisted over some parts of the Arid and semi-arid
IGAD CLIMATE PREDICTION AND APPLICATIONS CENTRE (ICPAC) UPDATE OF THE ICPAC CLIMATE WATCH REF: ICPAC/CW/NO. 24, AUGUST 2011 SUMMARY Drought conditions have persisted over some parts of the Arid and semi-arid
Joint Meeting of RA II WIGOS Project and RA V TT-SU on 11 October 2018 BMKG Headquarter Jakarta, Indonesia. Mrs. Sinthaly CHANTHANA
 Joint Meeting of RA II WIGOS Project and RA V TT-SU on 11 October 2018 BMKG Headquarter Jakarta, Indonesia Mrs. Sinthaly CHANTHANA Lao PDR Background Department of Meteorology and Hydrology ( DMH ) in
Disaster RISK Management : Bhutanese Scenario
 Disaster RISK Management : Bhutanese Scenario Expert Group Meeting (EGM) on Geo-referenced Information Systems for Disaster Risk Management (Geo-DRM) and sustaining the Community of Practice (COP), Bangkok,
- facilitate the preparation of landslide inventory and landslide hazard zonation maps for the city, - development of precipitation thresholds,
 Date of Submission 29.03.2012 IPL Project Proposal Form 2012 (MAXIMUM: 3 PAGES IN LENGTH) 1. Project Title: (2 lines maximum)-introducing Community-based Early Warning System for Landslide Hazard Management
A Presentation By: Dr. G. M. Dar Centre for Disaster Management & Env. Studies, J&K IMPA, Srinagar
 A Presentation By: Dr. G. M. Dar Centre for Disaster Management & Env. Studies, J&K IMPA, Srinagar Introduction Disaster: Sudden or great misfortune. A catastrophe, a calamitous event. Hazards are a natural
Flood Map. National Dataset User Guide
 Flood Map National Dataset User Guide Version 1.1.5 20 th April 2006 Copyright Environment Agency 1 Contents 1.0 Record of amendment... 3 2.0 Introduction... 4 2.1 Description of the Flood Map datasets...4
INCA-CE achievements and status
 INCA-CE achievements and status Franziska Strauss Yong Wang Alexander Kann Benedikt Bica Ingo Meirold-Mautner INCA Central Europe Integrated nowcasting for the Central European area This project is implemented
Brazil Paper for the. Second Preparatory Meeting of the Proposed United Nations Committee of Experts on Global Geographic Information Management
 Brazil Paper for the Second Preparatory Meeting of the Proposed United Nations Committee of Experts on Global Geographic Information Management on Data Integration Introduction The quick development of
Geospatial framework for monitoring SDGs/Sendai targets By Shimonti Paul Sr. Assistant Editor Geospatial Media & Communications
 Geospatial framework for monitoring SDGs/Sendai targets By Shimonti Paul Sr. Assistant Editor Geospatial Media & Communications Outline 1. Introduction to Geospatial Media and Communications 2. Geospatial
Roles of NGII in successful disaster management
 The Second UN-GGIM-AP Plenary Meeting Roles of NGII in successful disaster management Republic of Korea Teheran Iran 28 October 2013 Sanghoon Lee, Ph.D. NGII Outline Type of Disasters Occur in Korea Practical
Pacific Catastrophe Risk Assessment And Financing Initiative
 Pacific Catastrophe Risk Assessment And Financing Initiative PALAU September is expected to incur, on average,.7 million USD per year in losses due to earthquakes and tropical cyclones. In the next 5 years,
Pacific Catastrophe Risk Assessment And Financing Initiative
 Pacific Catastrophe Risk Assessment And Financing Initiative VANUATU September 211 Country Risk Profile: VANUATU is expected to incur, on average, 48 million USD per year in losses due to earthquakes and
FLOOD HAZARD MAPPING OF DHAKA-NARAYANGANJ-DEMRA (DND) PROJECT USING GEO-INFORMATICS TOOLS
 PROJECT USING GEO-INFORMATICS TOOLS") FLOOD HAZARD MAPPING OF DHAKA-NARAYANGANJ-DEMRA (DND) PROJECT USING GEO-INFORMATICS TOOLS Md. Aminul Islam MEE07178 Supervisor: Prof. Kuniyoshi TAKEUCHI ABSTRACT Dhaka-Narayanganj-Demra (DND) Project is
FLOOD HAZARD MAPPING OF DHAKA-NARAYANGANJ-DEMRA (DND) PROJECT USING GEO-INFORMATICS TOOLS Md. Aminul Islam MEE07178 Supervisor: Prof. Kuniyoshi TAKEUCHI ABSTRACT Dhaka-Narayanganj-Demra (DND) Project is
FLOODPLAIN MAPPING OF RIVER KRISHNANA USING HEC-RAS MODEL AT TWO STREACHES NAMELY KUDACHI AND UGAR VILLAGES OF BELAGAVI DISTRICT, KARNATAKA
 FLOODPLAIN MAPPING OF RIVER KRISHNANA USING HEC-RAS MODEL AT TWO STREACHES NAMELY KUDACHI AND UGAR VILLAGES OF BELAGAVI DISTRICT, KARNATAKA Sandhyarekha 1, A. V. Shivapur 2 1M.tech Student, Dept. of and
Major Hurricane Matthew Briefing Situation Overview
 Major Hurricane Matthew Briefing Situation Overview THIS IS NOW A WORST CASE STORM SURGE SCENARIO Catastrophic Damage is Anticipated for Coastal Areas. Major Hurricane Matthew is still expected to move
COUNTRY PRESENTATION ON MR JAYNAL ABEDIN JOINT SECRETARY ( WORKS & DEVELOPMENT ) MINISTRY OF DEFENCE
 MINISTRY OF DEFENCE") COUNTRY PRESENTATION ON By MR JAYNAL ABEDIN JOINT SECRETARY ( WORKS & DEVELOPMENT ) MINISTRY OF DEFENCE Bangladesh Geographical Location of Bangladesh Bangladesh Country at a Glance Physical Features 1,230
COUNTRY PRESENTATION ON By MR JAYNAL ABEDIN JOINT SECRETARY ( WORKS & DEVELOPMENT ) MINISTRY OF DEFENCE Bangladesh Geographical Location of Bangladesh Bangladesh Country at a Glance Physical Features 1,230
Probability models for weekly rainfall at Thrissur
 Journal of Tropical Agriculture 53 (1) : 56-6, 015 56 Probability models for weekly rainfall at Thrissur C. Laly John * and B. Ajithkumar *Department of Agricultural Statistics, College of Horticulture,
Weather Climate Science to Service Partnership South Africa
 PROJECTS UNDERWAY Title of the Weather Climate Science to Service Partnership South Africa Together, building on an existing strong partnership, South African Weather Service and the Met Office will build
South Asian Climate Outlook Forum (SASCOF-6)
") Sixth Session of South Asian Climate Outlook Forum (SASCOF-6) Dhaka, Bangladesh, 19-22 April 2015 Consensus Statement Summary Below normal rainfall is most likely during the 2015 southwest monsoon season
Sixth Session of South Asian Climate Outlook Forum (SASCOF-6) Dhaka, Bangladesh, 19-22 April 2015 Consensus Statement Summary Below normal rainfall is most likely during the 2015 southwest monsoon season
Geography Class XI Fundamentals of Physical Geography Section A Total Periods : 140 Total Marks : 70. Periods Topic Subject Matter Geographical Skills
 Geography Class XI Fundamentals of Physical Geography Section A Total Periods : 140 Total Marks : 70 Sr. No. 01 Periods Topic Subject Matter Geographical Skills Nature and Scope Definition, nature, i)
Government GIS and its Application for Decision Support
 Government GIS and its Application for Decision Support Zhang Qingpu (Chinese Academy of Surveying and Mapping, Email: zhangqp@casm.ac.cn) Abstract: Application of GIS in government agencies is called
Analysis of catastrophic floods affecting Croatia in May 2014 Meteorological and Hydrological Service Zagreb, Croatia
 Analysis of catastrophic floods affecting Croatia in May 2014 Meteorological and Hydrological Service Zagreb, Croatia http://meteo.hr Branka Ivančan-Picek e-mail: picek@cirus.dhz.hr Overview The most affected
Africa RiskView MONTHLY BULLETIN JANUARY Highlights: Rainfall
 The Africa RiskView Bulletin is a monthly publication by the African Risk Capacity (ARC). ARC is a Specialised Agency of the African Union designed to improve the capacity of AU Member States to manage
Flood Hazard Vulnerability Mapping Using Remote Sensing and GIS: A Case Study of Surat Dhruvesh KM 1*, Praful MU 2 and Aditya MV 1 1
 Flood Hazard Vulnerability Mapping Using Remote Sensing and GIS: A Case Study of Surat Dhruvesh KM 1*, Praful MU 2 and Aditya MV 1 1 CU Shah University, Wadhwan, India 2 ISTAR-CVM, Vallabh Vidyanagar,
Summary of the 2017 Spring Flood
 Ottawa River Regulation Planning Board Commission de planification de la régularisation de la rivière des Outaouais The main cause of the exceptional 2017 spring flooding can be described easily in just
JCOMM-CHy Coastal Inundation Forecasting Demonstration Project (CIFDP)
") WMO World Meteorological Organization Working together in weather, climate and water JCOMM-CHy Coastal Inundation Forecasting Demonstration Project (CIFDP) Coastal Flooding & Vulnerable Populations Coastal
WMO World Meteorological Organization Working together in weather, climate and water JCOMM-CHy Coastal Inundation Forecasting Demonstration Project (CIFDP) Coastal Flooding & Vulnerable Populations Coastal
Measures Also Significant Factors of Flood Disaster Reduction
 Non-Structual Measures Also Significant Factors of Flood Disaster Reduction Babiaková Gabriela, Leškov ková Danica Slovak Hydrometeorological Institute, Bratislava Hydrological Forecasts and Warning Department
Flood Forecasting in Bangladesh
 Flood Forecasting in Bangladesh Types of Flood ing Flood ing can be divided into two categories: Flood ing in the rivers caused by upstream rise of river stage as well as rainfall in the basin. Overland
Coastal Inundation Forecasting Demonstration Project CIFDP. Flood Forecasting Initiative-Advisory Group (FFI-AG 3), Geneva, 5-7 Dec, 2017
, Geneva, 5-7 Dec, 2017") Coastal Inundation Forecasting Demonstration Project CIFDP Flood Forecasting Initiative-Advisory Group (FFI-AG 3), Geneva, 5-7 Dec, 2017 Coastal Flooding & Vulnerable Populations Coastal populations are
Coastal Inundation Forecasting Demonstration Project CIFDP Flood Forecasting Initiative-Advisory Group (FFI-AG 3), Geneva, 5-7 Dec, 2017 Coastal Flooding & Vulnerable Populations Coastal populations are