Seasonal Forecast Updated: 6/28/17
|
|
|
- Dinah Webb
- 5 years ago
- Views:
Transcription
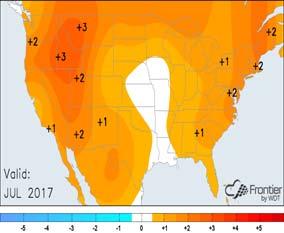
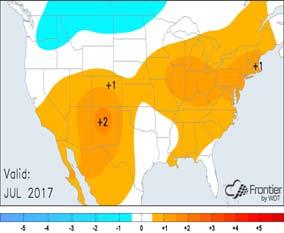
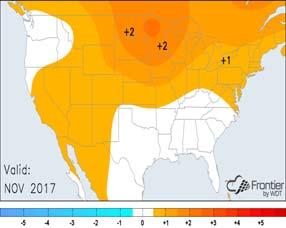
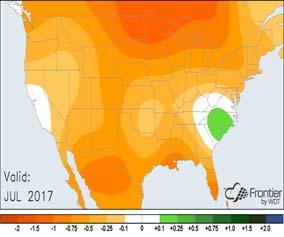
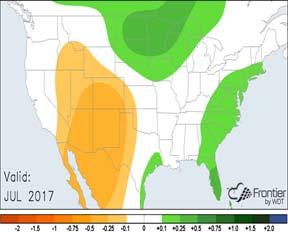
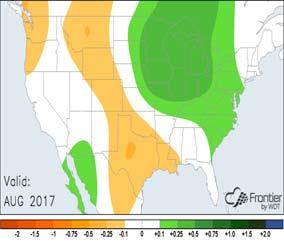
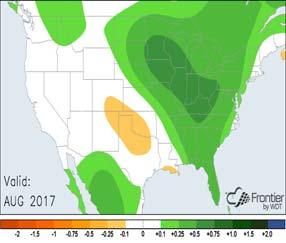
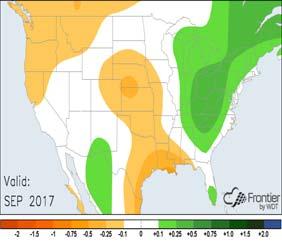
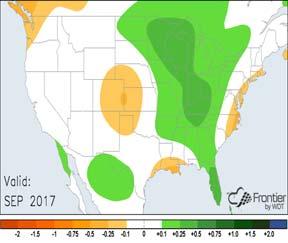
1 July Temperature ( F) and Precipitation (in) Anomaly Outlook August Temperature ( F) and Precipitation (in) Anomaly Outlook Fall Temperature ( F) and Precipitation (in/month) Anomaly Outlook Forecast Headlines July is forecast to average warmer and drier than normal across most of the country, with the strongest warm anomalies across the West as well as the Northeast. Most of the country is forecast to average above normal during August as well, and the central US has been trended drier with any El Niño influence continuing to fade. The entire June-August period looks to end up nearly identical to the last forecast in terms of population weighted CDDs since the second half of June is ending up a little cooler than previously forecast and July and August are slightly warmer named storms, 5-7 hurricanes, and 2-3 major hurricanes are expected for the entire hurricane season this year. 1
2 Monthly and Seasonal CDD Tables Seasonal Forecast Observed and Forecast U.S. Population Weighted CDDs and Percent of 30 Year Avg Month Obs/Forecast Previous Fcst* Fcst Change Last Year 5YR Avg Normal Mar (185.5%) 37 (185.5%) 0 (0%) 33 (162.5%) 27 (135%) 20 Apr (155.1%) 79 (155.1%) 0 (0%) 57 (111.4%) 59 (115.7%) 51 May (103.9%) 138 (103.9%) 0 (0%) 133 (100.2%) 154 (115.8%) 133 Jun (109.7%) 313 (116.3%) -18 (-6.6%) 320 (118.8%) 299 (111.2%) 269 Jul (106.7%) 394 (103.5%) 12 (3.2%) 443 (116.2%) 409 (107.3%) 381 Aug (105.3%) 369 (103.5%) 6 (1.7%) 419 (117.8%) 375 (105.3%) 356 Sep (104.6%) 213 (102.7%) 4 (1.9%) 270 (130.2%) 245 (118.4%) 207 Oct (97.3%) 74 (95.5%) 1 (1.8%) 111 (144.2%) 93 (120.8%) 77 Nov (75.7%) 16 (77.1%) 0 (-1.4%) 33 (154.8%) 24 (114.3%) 21 Mar May (124.7%) 254 (124.7%) 0 (0%) 223 (109.1%) 243 (119.1%) 204 Jun Aug (107.1%) 1076 (107%) 1 (0.1%) 1182 (117.6%) 1083 (107.8%) 1005 Sep Nov (100.8%) 302 (99.1%) 5 (1.7%) 413 (135.4%) 362 (118.7%) 305 May Sep (106.3%) 1426 (106%) 5 (0.3%) 1585 (117.7%) 1482 (110.1%) 1346 *Previous forecast is from last seasonal update report. Values are updated daily on the Frontier Weather website. Observed and Forecast U.S. %AC X %NG Generation Weighted CDDs and Percent of 30 Year Avg Month Obs/Forecast Previous Fcst* Fcst Change Last Year 5YR Avg Normal Mar (168.3%) 66 (168.3%) 0 (0%) 61 (157.3%) 50 (128.2%) 39 Apr (146.5%) 120 (146.5%) 0 (0%) 94 (114.4%) 100 (122%) 82 May (106.6%) 197 (106.6%) 0 (0%) 182 (98.1%) 203 (109.7%) 185 Jun (108%) 358 (112.6%) -15 (-4.6%) 369 (116%) 349 (109.7%) 318 Jul (106.6%) 437 (103.6%) 13 (3%) 486 (115.2%) 447 (105.9%) 422 Aug (105.8%) 425 (104.5%) 5 (1.3%) 455 (111.8%) 428 (105.2%) 407 Sep (105.9%) 280 (104.2%) 5 (1.7%) 330 (122.5%) 309 (114.9%) 269 Oct (103%) 128 (101.2%) 2 (1.8%) 168 (133.1%) 149 (118.3%) 126 Nov (82%) 37 (82.6%) 0 (-0.6%) 59 (132%) 48 (106.7%) 45 Mar May (124.8%) 383 (124.8%) 0 (0%) 337 (109.7%) 356 (116%) 307 Jun Aug (106.7%) 1220 (106.4%) 3 (0.3%) 1310 (114.2%) 1224 (106.7%) 1147 Sep Nov (102.9%) 445 (101.4%) 7 (1.5%) 557 (126.8%) 506 (115.3%) 439 May Sep (106.5%) 1698 (106.1%) 8 (0.5%) 1821 (113.8%) 1736 (108.4%) 1601 *Previous forecast is from last seasonal update report. Values are updated daily on the Frontier Weather website. The %AC x %NG generation weighted CDDs weight the CDD totals for each state by a combination of the percent of the households that have air conditioning and the percent of electricity that is produced from power plants fueled by natural gas. 2


3 June 2017 Anomaly Projections and 2017 Cooling Season-to-Date June 2017 Temperature Anomaly Projections June 2017 Precipitation Anomaly Projections Pop Weighted CDDs Rank Year CDDs Median Expected CDDs in 15 Days Rank Year CDDs Median


4 ENSO Update Seasonal Forecast Warmer than normal water has expanded some across the central tropical Pacific during the last couple weeks, and the Niño 3.4 region anomalies have moved back above the +0.5 C El Niño threshold. Sub-surface water temperatures have also warmed a bit, so conditions look to remain solidly in the warm neutral to borderline weak El Niño range for the balance of the summer season. However, while the central Pacific has trended warmer, the eastern Pacific continues to remain closer to normal and conditions don t currently look to support much warming in that region. The eastern Pacific water temperatures can have a larger impact on US weather in the summer, and so the cooler conditions there relative to a couple months ago still favors a warmer and drier central US for the balance of the summer than forecast back in March and April. Warmer water in that region tends to promote more tropical convection, including hurricanes, which in turn help to send periodic bursts of moisture up into the Southwest and out across the Plains at higher levels of the atmosphere. That in turn helps to increase rainfall in those areas and suppress temperatures a bit. Since the eastern Pacific is now cooler, that looks to be less of a factor going forward. As a result, the forecast for the balance of the summer continues to trend warmer and drier across the middle of the country. The maps below show the current global SST anomalies on the left, and those from a couple weeks ago on the right. A map from roughly the same period last year is also included below for reference. Note that, in general, there is less warmth in the Pacific than this time last year as the residual warmth from the strong El Niño continues to dissipate. Current SST Anomalies (Left), from two weeks ago (Right) and from last year (bottom) 4


5 The following plots show time series of temperature anomalies for four regions of the equatorial Pacific. Niño 4 is in the western equatorial Pacific, and Niño 1+2 is located off the coast of South America. The Niño 3.4 region of the central equatorial Pacific is the region most commonly used to classify the strength of ENSO events. A plot of sub-surface water temperature anomalies is also shown and while there are pockets of warmer than normal water below the surface, no strong and widespread warm anomalies are present like you would normally see prior to a significant El Niño event. The latest composite of climate models is shown on the bottom right, and the general model consensus keeps the Niño 3.4 region in the warm neutral range, just below the El Niño cutoff of +0.5 C right on through the upcoming winter. Note that some model solutions still show weak El Niño development though, so the recent trend towards slightly warmer water in the central Pacific will need to be monitored in case it persists and/or strengthens during the next few months. El Niño Region SST Trends (NCEP/CPC) and CFS Model Composite (bottom right) 5


6 Summer Ag Weather Impacts Seasonal Forecast Soil moisture conditions have a significant impact on temperature anomaly patterns during the middle of summer. Unlike in winter when cold airmasses spread southward into the US out of northern Canada when favorable blocking patterns develop, hot weather in the summer develops over the US itself. Upper level ridges often build across the Southwest early in summer, and then periodically expand northeastward across the country, spreading surges of hot weather eastward. How much heat is seen across the Plains and Midwest often depends on how wet or dry the soil conditions are as dry soil will heat up much faster than will saturated ground. When the ground is wet, much of the incoming solar radiation is used up evaporating water instead of warming the ground, which in turn keeps the air cooler. When the soil is dry, most of the incoming solar energy can go directly to warming the ground, which can then radiate heat into the air. That process may be overwhelmed by cooler Canadian air masses moving in, but during times when ridges expand across the central US dry soil conditions can help temperatures heat up rapidly. Strong upper level ridges often develop across the south-central US during midsummer as conditions trend drier and the southwestern US ridge weakens with the onset of the seasonal monsoon there. The expansion and contraction of that upper level ridge often modulates temperatures across much of the central and eastern US during July and the first half of August. The East Coast can see their hottest and muggiest weather when the Bermuda High expands westward, which builds a hot upper level ridge across the region and helps increase moisture transport out of the Gulf of Mexico. After a very wet spring season, conditions have turned markedly drier across the central US. The map on the left below shows the rainfall anomalies over the last month or so, and the Plains region has trended much drier. There hasn t yet been a significant temperature impact because conditions were so wet across much of the region this spring. The latest 15-day precipitation anomaly forecast from the GFS model shows that much of the country may end up drier than normal during the first half of July, with only modest positive rainfall anomalies across portions of the Midwest. So, in general the trend towards drier weather may continue, which in turn could favor a hotter second half of July and first half of August, possibly more so than currently forecast. Rainfall Anomalies Last 30 Days Rainfall Anomalies Next 15 Days The crop moisture index map on the next page shows that most of the Plains and Midwest still have average soil moisture, but that will change quickly with any persistence of drier weather since most of the soil moisture surplus from this spring has now been used up. Also, note that 6
7 while the Southeast had been drier than normal much of this year, TS Cindy quickly erased that moisture deficit and has now resulted in a surplus of soil moisture across the region. That may in turn help to keep humidity levels higher across the region in July and feed more of the typical afternoon showers and storms that are often seen across that region during mid-summer. Summer Population Weighted CDD Outlook On page 2 of this report, the CDD forecast tables show that we expect population weighted CDD totals to end up in the 6-7% above normal range for both the June-August and May-September periods. This is quite a bit below the 17-18% above normal totals seen last year and below the five-year average as well. However, as mentioned earlier, there is some risk that temperatures could end up a little hotter later in July and early in August because of the cooling eastern Pacific and generally drier central US pattern. The plot on the next page shows some population weighted CDD projections based on prior years data. Each line represents the balance of summer observed CDDs from each of the last 30 years appended onto the season-to-date total. Some ENSO composites are also shown along with last year s values. Note that the composite of El Niño years shows that CDD anomaly totals often trend lower late in summer, while those from La Nina years often trend higher. The current forecast (black line) is still lower than the 10- year average curve, but there is risk for further increases in the CDD outlook. In any event, odds are increasing that the summer season will end up with moderately positive CDD anomalies, and the risk for the summer to end up with at or below normal in terms of population weighted CDDs continues to decrease. 7
 Current + 15 Day Fcst + Moderate-Strong El Nino Current + 15 Day Fcst + Weak-Moderate El Nino Current")
8 Cumulative CDD Anomaly May - Sept 2017 US Population Weighted CDD Anomaly Plume (vs 30 Year Avg) Current + 15 Day Fcst + Moderate-Strong El Nino Current + 15 Day Fcst + Weak-Moderate El Nino Current + 15 Day Fcst + Moderate-Strong La Nina Current + 15 Day Fcst + Weak-Moderate La Nina Current + 15 Day Fcst + Last Year Current + 15 Day Fcst + 10 Year Average Current + 15 Day Fcst + Forecast May 56% of years warmer than Normal, 44% of years cooler than Normal when projecting end of season total using using observations to date plus weather from past years 8-May 15-May 22-May 29-May 5-Jun 12-Jun 19-Jun 26-Jun 3-Jul 10-Jul 17-Jul 24-Jul 31-Jul 7-Aug 14-Aug 21-Aug 28-Aug 4-Sep 11-Sep 18-Sep 25-Sep Pacific Northwest Hydro Update Streamflow forecasts have trended a bit lower across the Pacific Northwest since earlier this month. We are now past the normal peak in streamflows across the Northwest and flows should be falling of steadily during the remainder of the season. Even so, flow rates should remain above normal given the above normal snow packs still in place at high elevations. April September Forecast Water Supply (Percent of Normal) Frontier Last Last 5 Year 10 Year Dam Location Forecast Forecast Year Average Average Mica Dam (BC) 108% 113% 98% 108% 102% Grand Coulee 118% 121% 91% 105% 103% The Dalles 127% 129% 88% 99% 102% Lower Granite 143% 143% 83% 84% 97% January July Forecast Water Supply (Percent of Normal) Frontier Last Last 5 Year 10 Year Dam Location Forecast Forecast Year Average Average Mica Dam (BC) 118% 125% 102% 111% 104% Grand Coulee 128% 130% 98% 108% 104% The Dalles 137% 139% 97% 102% 102% Lower Granite 153% 154% 88% 87% 95% 8


9 2017 Hurricane Season Update Seasonal Forecast Two named storms developed in the Atlantic basin since the last update, Bret and Cindy. Both were weak and short-live and didn t add much to the seasonal ACE index total but have increased our storm count to three, which is solidly above normal for this time of year. With ENSO conditions looking to be more in the warm-neutral range, instead of fully into the El Niño range, and the eastern Pacific is cooler, odds favor at least near normal storm totals this year, and likely slightly above normal. However, the Atlantic has cooled slightly in the last couple of weeks as well, and the overall pattern isn t as favorable for storms as in some recent years, so we still expect storm totals to be lower than last year. With three storms in the books, we have increased the bottom end of our seasonal forecast total to 12 from 11, though we have kept the top end of the forecast range at 15. This could end up being a year with far more named storms than hurricanes and it wouldn t be surprising to see the number of named storms near the top end of the forecast range but the number of hurricanes near the lower end named storms (was 11-15) 5-7 hurricanes (was 5-7) 2-3 major hurricanes (was 2-3) 2017 Atlantic Storm Names Arlene Harvey Ophelia Bret Irma Philippe Cindy Jose Rina Don Katia Sean Emily Lee Tammy Franklin Maria Vince Gert Nate Whitney The plots below show the trends in storm numbers over time, as well as the frequency of storms by day of the year. Note that tropical activity, particularly hurricane frequency, doesn t really ramp up until August. 9

10 US Hurricane Landfall Return Periods by County ENSO Phase* Named Storms Hurricanes Major Hurricanes Number Years Last Year (Weak La Niña) All Years Since All Years Since Moderate-Strong El Niño All El Niño since All El Niño since Neutral ENSO since Neutral ENSO since All La Niña since All La Niña since Moderate-Strong La Niña *Per CPC ONI methodology -All averages have been rounded to increase table readability. -Hurricane seasons have never (since 1950) seen more storms than normal with moderate to strong El Niño conditions. -Hurricane seasons have never (since 1995) seen less storms than normal with La Nina conditions in place 10
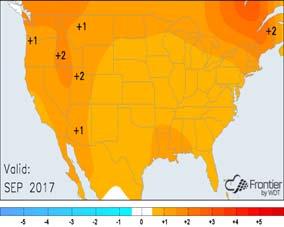
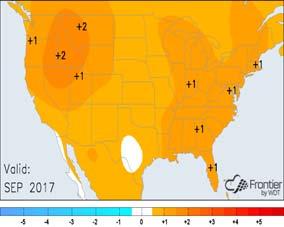
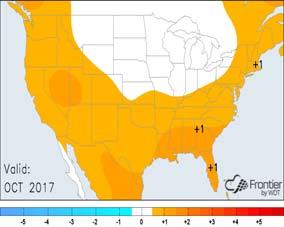
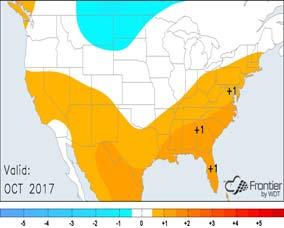
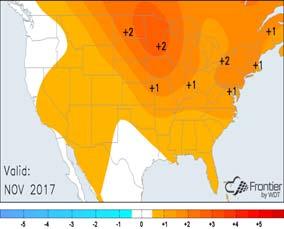
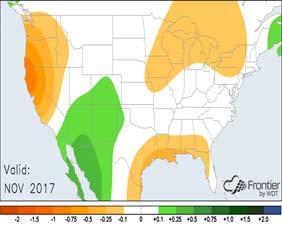
11 Forecast Summary Our latest forecast maps are shown on the following pages. The June-August summer season looks to end up hotter than forecast in our last update across the West, but not quite as hot across the Midwest. The warmest anomalies for the balance of the summer season are expected to persist across the western US and along the East Coast, while the central US ends up more variable and averages a little closer to normal. No significant changes were made to the hurricane season outlook from the last update. Totals may end up a little higher than the long-term averages seen since 1950, but are likely to average at or below the averages. Our outlook for the September-November fall season was trended a little warmer this update, again based on the increasing odds for a more persistent ENSO neutral regime and expected drier conditions across the central US. Portions of the central US were trended a bit cooler this update in the December-February winter outlook, but most of the country is still forecast to average at or above normal. However, it is still too early to have much confidence in the winter outlook. There has been a tendency for more persistent weather patterns during the winter season in recent decades, which has resulted in recent winters either averaging much colder than normal or at record or near record warm levels. With the entire Pacific basin generally cooler than the last couple of years with the residual El Niño warmth fading, a third straight record or near record warm winter is unlikely, but it is still highly uncertain whether temperatures will end up warmer than normal or if a return to the colder eastern US winters of a few years ago is in the offing. The next full seasonal update report is scheduled for Wednesday, July 12th,
 and")


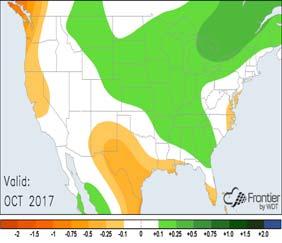
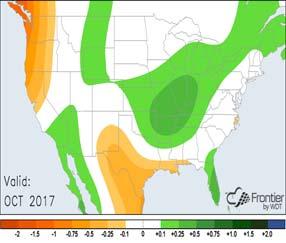
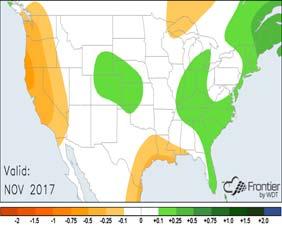
12 Latest Summer 2017 Temperature ( F) and Precipitation (in) Anomaly Projection Previous Summer 2017 Temperature and Precipitation Projection Forecast is the average monthly anomaly, not three-month total anomaly Early Fall 2017 Temperature ( F) and Precipitation (in) Anomaly Outlook Previous Fall 2017 Temperature and Precipitation Outlook 12


13 Early Winter Temperature ( F) and Precipitation (in) Anomaly Outlook Previous Winter Temperature and Precipitation Outlook 13
14 Monthly Temperature Anomaly Forecasts Seasonal Forecast Current Forecast Previous Forecast Last Year Five Year Average 14
15 Monthly Precipitation Anomaly Forecasts Seasonal Forecast Current Forecast Previous Forecast Last Year Five Year Average 15
16 Long Range Natural Gas Storage Projections Seasonal Forecast The following plots show historical NG storage data for the last year, as well as an 8-month forecast. The top portion of the graph shows forecast storage levels, and the bottom portion the year on five-year surplus, along with the year on year surplus. The orange line represents the projected storage levels using the weekly five-year average storage numbers. Note that the forecast assumes no price response to production and demand levels, with forecast degree days being the only variable changing going forward. As such, large variations in storage levels from the mean may not actually develop, but may serve as an indicator that production, price and/or demand changes are likely. 16


 and Precipitation (in) Anomaly")
 and Precipitation")
17 Europe Outlook July is now forecast to average close to normal across much of Europe, with central areas possibly a little below normal. A large swath of northern Europe may end up wetter than normal in July while southern areas are drier. August may trend warmer and drier central areas while the upcoming fall season looks to average at or above normal across most of the region in terms of temperatures along with near normal precipitation. Europe July Temperature ( F) and Precipitation (in) Anomaly Outlook Europe August Temperature ( F) and Precipitation (in) Anomaly Outlook Europe Fall Temperature (F) and Precipitation Anomaly Outlooks (in/month) Precipitation forecast shows average anomalies per month, not total anomaly. 17
 and Precipitation (in)")


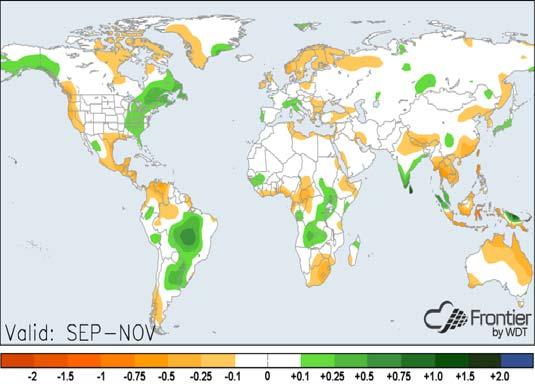
18 Global July Temperature ( F) and Precipitation (in) Anomaly Outlook Global August Temperature ( F) and Precipitation (in) Anomaly Outlook Global Fall Temperature (F) and Precipitation Anomaly Projection (in/month) 18
19 References CSU hurricane season forecast: ENSO model composite from IRI: Climate models from IRI: JAMSTEC model: UKMET model: CFS Climate model: Stratospheric Optical Depth: Rutgers Snow Lab: MEI index: Arctic temperature graphs from DMI: Sea ice maps and graphs from NSIDC: NCDC USHCN Data: CPC ENSO Data: Map plotting tools: PDO Index: AER AO blog: Stratospheric analysis plots: WDT, Inc. All rights reserved. Any unauthorized reproduction, distribution or disclosure is prohibited and may result in account termination and/or prosecution. Information contained in this report is intended solely for use by the recipient and may not be further distributed without written approval from WDT, Inc. Users of this report agree to the following: THE REPORT is provided by WDT, INC AS IS, and AS AVAILABLE WITHOUT WARRANTY OF ANY KIND TO USER OR ANY THIRD PARTY, INCLUDING, BUT NOT LIMITED TO, ANY EXPRESS OR IMPLIED WARRANTIES OF MERCHANTABILITY OF THE REPORT; ACCURACY OF INFORMATIONAL CONTENT; NON-INFRINGEMENT; QUIET ENJOYMENT; AND TITLE. WDT, INC. SHALL NOT BE LIABLE FOR ANY LOSS, INJURY, CLAIM, LIABILITY OR DAMAGE OF ANY KIND RESULTING IN ANY WAY FROM THE USE OF THIS INFORMATION. THE USER FURTHER AGREES THAT WDT, INC. SHALL NOT BE LIABLE TO USER OR ANY THIRD PARTY FOR ANY LOSS OF PROFITS, LOSS OF USE, INTERRUPTION OF BUSINESS, OR ANY DIRECT, INDIRECT, SPECIAL, EXEMPLARY, INCIDENTAL OR CONSEQUENTIAL DAMAGES OF ANY KIND WHETHER UNDER THIS AGREEMENT OR OTHERWISE, EVEN IF WDT, INC. WAS ADVISED OF THE POSSIBILITY OF SUCH DAMAGES OR WAS GROSSLY NEGLIGENT. In any event, WDT, INC. shall never be liable for any amount in excess of the fees paid by the USER to WDT, INC. hereby. Additionally, WDT, INC. makes no warranty that the information provided in this report will be free from errors or omissions, or defects, human or mechanical. 19
MORNING WEATHER SUMMARY
 MORNING WEATHER SUMMARY Weather Headlines Hot weather will prevail across the West into next week while another shot of cooler air moves into the eastern US. The 6-10 day period was trended slightly warmer
MIDDAY WEATHER SUMMARY
 MIDDAY WEATHER SUMMARY Weather Headlines TS Cindy will move inland tonight or early tomorrow morning near the Texas/Louisiana border. The latest GFS model run is cooler late in the 6-10 and early in the
SUNDAY WEATHER SUMMARY
 SUNDAY WEATHER SUMMARY Weather Headlines Unseasonably mild weather will prevail in most of the central and eastern U.S. for the first part of this week. After a brief intrusion of seasonably cold weather
Here s what a weak El Nino usually brings to the nation with temperatures:
 Time again for my annual Winter Weather Outlook. Here's just a small part of the items I considered this year and how I think they will play out with our winter of 2018-2019. El Nino / La Nina: When looking
Summer 2018 Southern Company Temperature/Precipitation Forecast
 Scott A. Yuknis High impact weather forecasts, climate assessment and prediction. 14 Boatwright s Loop Plymouth, MA 02360 Phone/Fax 508.927.4610 Cell: 508.813.3499 ClimateImpact@comcast.net Climate Impact
Weather and Climate Summary and Forecast February 2018 Report
 Weather and Climate Summary and Forecast February 2018 Report Gregory V. Jones Linfield College February 5, 2018 Summary: For the majority of the month of January the persistent ridge of high pressure
MDA WEATHER SERVICES AG WEATHER OUTLOOK. Kyle Tapley-Senior Agricultural Meteorologist May 22, 2014 Chicago, IL
 MDA WEATHER SERVICES AG WEATHER OUTLOOK Kyle Tapley-Senior Agricultural Meteorologist May 22, 2014 Chicago, IL GLOBAL GRAIN NORTH AMERICA 2014 Agenda Spring Recap North America Forecast El Niño Discussion
Winter Forecast. Allan Huffman RaleighWx
 Winter 2015-16 Forecast Allan Huffman RaleighWx Disclaimer Seasonal forecasting is difficult and you are always learning. I attempt to look at all factors I understand and have seen correlate in the past
Winter. Here s what a weak La Nina usually brings to the nation with tempseraures:
 2017-2018 Winter Time again for my annual Winter Weather Outlook. Here's just a small part of the items I considered this year and how I think they will play out with our winter of 2017-2018. El Nino /
ARUBA CLIMATOLOGICAL SUMMARY 2017 PRECIPITATION
 ARUBA CLIMATOLOGICAL SUMMARY 2017 PRECIPITATION The total amount of rainfall recorded at Reina Beatrix International Airport for the year 2017 was 391.0 mm. This is 17.1 % below normal ( Figure 1 ). During
Weather and Climate Summary and Forecast Winter
 Weather and Climate Summary and Forecast Winter 2016-17 Gregory V. Jones Southern Oregon University February 7, 2017 What a difference from last year at this time. Temperatures in January and February
Weather and Climate Summary and Forecast January 2018 Report
 Weather and Climate Summary and Forecast January 2018 Report Gregory V. Jones Linfield College January 5, 2018 Summary: A persistent ridge of high pressure over the west in December produced strong inversions
Weather and Climate Summary and Forecast March 2018 Report
 Weather and Climate Summary and Forecast March 2018 Report Gregory V. Jones Linfield College March 7, 2018 Summary: The ridge pattern that brought drier and warmer conditions from December through most
Seasonal Climate Outlook for South Asia (June to September) Issued in May 2014
 Issued in May 2014") Ministry of Earth Sciences Earth System Science Organization India Meteorological Department WMO Regional Climate Centre (Demonstration Phase) Pune, India Seasonal Climate Outlook for South Asia (June
Ministry of Earth Sciences Earth System Science Organization India Meteorological Department WMO Regional Climate Centre (Demonstration Phase) Pune, India Seasonal Climate Outlook for South Asia (June
UPDATE OF REGIONAL WEATHER AND SMOKE HAZE (December 2017)
") UPDATE OF REGIONAL WEATHER AND SMOKE HAZE (December 2017) 1. Review of Regional Weather Conditions for November 2017 1.1 In November 2017, Southeast Asia experienced inter-monsoon conditions in the first
UPDATE OF REGIONAL WEATHER AND SMOKE HAZE (December 2017) 1. Review of Regional Weather Conditions for November 2017 1.1 In November 2017, Southeast Asia experienced inter-monsoon conditions in the first
Highlight: Support for a dry climate increasing.
 Scott A. Yuknis High impact weather forecasts, climate assessment and prediction. 14 Boatwright s Loop Plymouth, MA 02360 Phone/Fax 508.927.4610 Cell: 508.813.3499 ClimateImpact@comcast.net Climate Impact
Weather and Climate Summary and Forecast August 2018 Report
 Weather and Climate Summary and Forecast August 2018 Report Gregory V. Jones Linfield College August 5, 2018 Summary: July 2018 will likely go down as one of the top five warmest July s on record for many
Weather and Climate Summary and Forecast Summer 2017
 Weather and Climate Summary and Forecast Summer 2017 Gregory V. Jones Southern Oregon University August 4, 2017 July largely held true to forecast, although it ended with the start of one of the most extreme
Weather and Climate Summary and Forecast December 2017 Report
 Weather and Climate Summary and Forecast December 2017 Report Gregory V. Jones Linfield College December 5, 2017 Summary: November was relatively cool and wet from central California throughout most of
ENSO: Recent Evolution, Current Status and Predictions. Update prepared by: Climate Prediction Center / NCEP 30 October 2017
 ENSO: Recent Evolution, Current Status and Predictions Update prepared by: Climate Prediction Center / NCEP 30 October 2017 Outline Summary Recent Evolution and Current Conditions Oceanic Niño Index (ONI)
2013 Summer Weather Outlook. Temperatures, Precipitation, Drought, Hurricanes and why we care
 2013 Summer Weather Outlook Temperatures, Precipitation, Drought, Hurricanes and why we care Role of the ERCOT Meteorologist Forecasts Develop temperature input for hourly load forecasts (next day, days
ENSO Cycle: Recent Evolution, Current Status and Predictions. Update prepared by Climate Prediction Center / NCEP 5 August 2013
 ENSO Cycle: Recent Evolution, Current Status and Predictions Update prepared by Climate Prediction Center / NCEP 5 August 2013 Outline Overview Recent Evolution and Current Conditions Oceanic Niño Index
Weather and Climate Summary and Forecast October 2018 Report
 Weather and Climate Summary and Forecast October 2018 Report Gregory V. Jones Linfield College October 4, 2018 Summary: Much of Washington, Oregon, coastal California and the Bay Area and delta region
Weather and Climate Summary and Forecast January 2019 Report
 Weather and Climate Summary and Forecast January 2019 Report Gregory V. Jones Linfield College January 4, 2019 Summary: December was mild and dry over much of the west, while the east was much warmer than
ENSO Cycle: Recent Evolution, Current Status and Predictions. Update prepared by Climate Prediction Center / NCEP 23 April 2012
 ENSO Cycle: Recent Evolution, Current Status and Predictions Update prepared by Climate Prediction Center / NCEP 23 April 2012 Outline Overview Recent Evolution and Current Conditions Oceanic Niño Index
ENSO Cycle: Recent Evolution, Current Status and Predictions. Update prepared by Climate Prediction Center / NCEP 25 February 2013
 ENSO Cycle: Recent Evolution, Current Status and Predictions Update prepared by Climate Prediction Center / NCEP 25 February 2013 Outline Overview Recent Evolution and Current Conditions Oceanic Niño Index
ENSO Cycle: Recent Evolution, Current Status and Predictions. Update prepared by Climate Prediction Center / NCEP 11 November 2013
 ENSO Cycle: Recent Evolution, Current Status and Predictions Update prepared by Climate Prediction Center / NCEP 11 November 2013 Outline Overview Recent Evolution and Current Conditions Oceanic Niño Index
ENSO UPDATE By Joseph D Aleo, CCM
 ENSO UPDATE By Joseph D Aleo, CCM El Nino is still hanging on but likely not for very long. Warmer than normal water can still be seen along the equator in the tropical Pacific. It is even warmer in the
ENSO: Recent Evolution, Current Status and Predictions. Update prepared by: Climate Prediction Center / NCEP 9 November 2015
 ENSO: Recent Evolution, Current Status and Predictions Update prepared by: Climate Prediction Center / NCEP 9 November 2015 Outline Summary Recent Evolution and Current Conditions Oceanic Niño Index (ONI)
An ENSO-Neutral Winter
 An ENSO-Neutral Winter This issue of the Blue Water Outlook newsletter is devoted towards my thoughts on the long range outlook for winter. You will see that I take a comprehensive approach to this outlook
Oregon Water Conditions Report April 17, 2017
 Oregon Water Conditions Report April 17, 2017 Mountain snowpack continues to maintain significant levels for mid-april. By late March, statewide snowpack had declined to 118 percent of normal after starting
National Wildland Significant Fire Potential Outlook
 National Wildland Significant Fire Potential Outlook National Interagency Fire Center Predictive Services Issued: September, 2007 Wildland Fire Outlook September through December 2007 Significant fire
Weather and Climate Summary and Forecast April 2018 Report
 Weather and Climate Summary and Forecast April 2018 Report Gregory V. Jones Linfield College April 4, 2018 Summary: A near Miracle March played out bringing cooler and wetter conditions to the majority
Pacific Decadal Oscillation ( PDO ):
:") Time again for my annual Winter Weather Outlook. Here's just a small part of the items I considered this year and how I think they will play out with our winter of 2015-2016. El Nino / La Nina: When looking
Time again for my annual Winter Weather Outlook. Here's just a small part of the items I considered this year and how I think they will play out with our winter of 2015-2016. El Nino / La Nina: When looking
Seasonal Climate Forecast August October 2013 Verification (Issued: November 17, 2013)
") Seasonal Climate Forecast August October 2013 Verification (Issued: November 17, 2013) Note: This product is published by the Oregon Department of Agriculture (ODA), in cooperation with the Oregon Department
Seasonal Climate Forecast August October 2013 Verification (Issued: November 17, 2013) Note: This product is published by the Oregon Department of Agriculture (ODA), in cooperation with the Oregon Department
ENSO Cycle: Recent Evolution, Current Status and Predictions. Update prepared by Climate Prediction Center / NCEP 24 September 2012
 ENSO Cycle: Recent Evolution, Current Status and Predictions Update prepared by Climate Prediction Center / NCEP 24 September 2012 Outline Overview Recent Evolution and Current Conditions Oceanic Niño
Weather and Climate Summary and Forecast Fall/Winter 2016
 Weather and Climate Summary and Forecast Fall/Winter 2016 Gregory V. Jones Southern Oregon University November 5, 2016 After a year where we were seemingly off by a month in terms of temperatures (March
Weather and Climate Summary and Forecast Winter
 Weather and Climate Summary and Forecast Winter 2016-17 Gregory V. Jones Southern Oregon University December 5, 2016 Well after an October that felt more like November, we just finished a November that
Monthly Long Range Weather Commentary Issued: July 18, 2014 Steven A. Root, CCM, President/CEO
 Monthly Long Range Weather Commentary Issued: July 18, 2014 Steven A. Root, CCM, President/CEO sroot@weatherbank.com JUNE 2014 REVIEW Climate Highlights The Month in Review The average temperature for
Winter Forecast. Allan Huffman RaleighWx
 Winter 2014-15 Forecast Allan Huffman RaleighWx Winter 2014-15 Combination of weak/moderate El Nino/+PDO/-QBO and well above average snow cover and snow cover increase this Fall in Siberia point to a winter
Climate Variability and El Niño
 Climate Variability and El Niño David F. Zierden Florida State Climatologist Center for Ocean Atmospheric Prediction Studies The Florida State University UF IFAS Extenstion IST January 17, 2017 The El
South & South East Asian Region:
 Issued: 15 th December 2017 Valid Period: January June 2018 South & South East Asian Region: Indonesia Tobacco Regions 1 A] Current conditions: 1] El Niño-Southern Oscillation (ENSO) ENSO Alert System
Impacts of Climate on the Corn Belt
 Impacts of Climate on the Corn Belt Great Lakes Crop Summit 2015 2015 Evelyn Browning Garriss Conclusions Climate change is not linear. It ebbs and flows. Recent polar volcano eruptions created a cool
How Patterns Far Away Can Influence Our Weather. Mark Shafer University of Oklahoma Norman, OK
 Teleconnections How Patterns Far Away Can Influence Our Weather Mark Shafer University of Oklahoma Norman, OK Teleconnections Connectedness of large-scale weather patterns across the world If you poke
ENSO Cycle: Recent Evolution, Current Status and Predictions. Update prepared by Climate Prediction Center / NCEP 15 July 2013
 ENSO Cycle: Recent Evolution, Current Status and Predictions Update prepared by Climate Prediction Center / NCEP 15 July 2013 Outline Overview Recent Evolution and Current Conditions Oceanic Niño Index
Weather and Climate Summary and Forecast Summer 2016
 Weather and Climate Summary and Forecast Summer 2016 Gregory V. Jones Southern Oregon University June 6, 2016 May 2016 continued the warm trend for portions of the west, while providing some relief for
WeatherManager Weekly
 Issue 288 July 14, 2016 WeatherManager Weekly Industries We Serve Agriculture Energy/Utilities Construction Transportation Retail Our Weather Protection Products Standard Temperature Products Lowest Daily
Weather and Climate Summary and Forecast Summer into Harvest 2016
 Weather and Climate Summary and Forecast Summer into Harvest 2016 Gregory V. Jones Southern Oregon University September 3, 2016 With school and football season starting a hint of fall is right on time
Weather and Climate Summary and Forecast November 2017 Report
 Weather and Climate Summary and Forecast November 2017 Report Gregory V. Jones Linfield College November 7, 2017 Summary: October was relatively cool and wet north, while warm and very dry south. Dry conditions
Weather and Climate Summary and Forecast March 2019 Report
 Weather and Climate Summary and Forecast March 2019 Report Gregory V. Jones Linfield College March 2, 2019 Summary: Dramatic flip from a mild winter to a top five coldest February on record in many locations
Weather and Climate Summary and Forecast October 2017 Report
 Weather and Climate Summary and Forecast October 2017 Report Gregory V. Jones Linfield College October 4, 2017 Summary: Typical variability in September temperatures with the onset of fall conditions evident
Weather and Climate Summary and Forecast Summer 2016
 Weather and Climate Summary and Forecast Summer 2016 Gregory V. Jones Southern Oregon University August 5, 2016 The month of July saw the continued flip, flop of the western US temperatures. It was warm
Fire Season Prediction for Canada, Kerry Anderson Canadian Forest Service
 Fire Season Prediction for Canada, 2014 Kerry Anderson Canadian Forest Service 1 Introduction The Canadian Forest Service is now presenting monthly and seasonal forecast maps through the Canadian Wildland
Climate Impacts to Southwest Water Sector. Dr. Dave DuBois New Mexico State Climatologist
 Climate Impacts to Southwest Water Sector Dr. Dave DuBois New Mexico State Climatologist Presented at EPA Extreme Events and Climate Adaptation Planning Workshop June 3, 2015 Water Year Precip. % of Average
Climate Outlook through 2100 South Florida Ecological Services Office Vero Beach, FL September 9, 2014
 Climate Outlook through 2100 South Florida Ecological Services Office Vero Beach, FL September 9, 2014 Short Term Drought Map: Short-term (
NatGasWeather.com Daily Report
 NatGasWeather.com Daily Report Issue Time: 5:15 pm EST Sunday, February 28 th, 2016 for Monday, Feb 29 th 7-Day Weather Summary (February 28 th March 5 th ): High pressure will dominate much of the US
Seasonal Outlook through September 2007
 Seasonal Outlook through September 2007 Klaus Wolter (15may) University of Colorado, CIRES & NOAA-ESRL Climate Analysis Branch klaus.wolter@noaa.gov http://www.cdc.noaa.gov/people/klaus.wolter/swcasts/
South & South East Asian Region:
 Issued: 10 th November 2017 Valid Period: December 2017 May 2018 South & South East Asian Region: Indonesia Tobacco Regions 1 A] Current conditions: 1] El Niño-Southern Oscillation (ENSO) ENSO Alert System
UPDATE OF REGIONAL WEATHER AND SMOKE HAZE (February 2018)
") UPDATE OF REGIONAL WEATHER AND SMOKE HAZE (February 2018) 1. Review of Regional Weather Conditions for January 2018 1.1 The prevailing Northeast monsoon conditions over Southeast Asia strengthened in January
UPDATE OF REGIONAL WEATHER AND SMOKE HAZE (February 2018) 1. Review of Regional Weather Conditions for January 2018 1.1 The prevailing Northeast monsoon conditions over Southeast Asia strengthened in January
NOAA 2015 Updated Atlantic Hurricane Season Outlook
 NOAA 2015 Updated Atlantic Hurricane Season Outlook Dr. Gerry Bell Lead Seasonal Forecaster Climate Prediction Center/ NOAA/ NWS Collaboration With National Hurricane Center/ NOAA/ NWS Hurricane Research
ENSO Cycle: Recent Evolution, Current Status and Predictions. Update prepared by Climate Prediction Center / NCEP July 26, 2004
 ENSO Cycle: Recent Evolution, Current Status and Predictions Update prepared by Climate Prediction Center / NCEP July 26, 2004 Outline Overview Recent Evolution and Current Conditions Oceanic NiZo Index
2013 ATLANTIC HURRICANE SEASON OUTLOOK. June RMS Cat Response
 2013 ATLANTIC HURRICANE SEASON OUTLOOK June 2013 - RMS Cat Response Season Outlook At the start of the 2013 Atlantic hurricane season, which officially runs from June 1 to November 30, seasonal forecasts
SEPTEMBER 2013 REVIEW
 Monthly Long Range Weather Commentary Issued: October 21, 2013 Steven A. Root, CCM, President/CEO sroot@weatherbank.com SEPTEMBER 2013 REVIEW Climate Highlights The Month in Review The average temperature
NatGasWeather.com Daily Report
 NatGasWeather.com Daily Report Issue Time: 5:15 am EDT Wednesday, March 22 nd, 2017 1-7 Day Weather Summary (Mar 22-28 th ): A cold blast will sweep across the Great Lakes and eastern US today and Thursday
New Zealand Climate Update No 223, January 2018 Current climate December 2017
 New Zealand Climate Update No 223, January 2018 Current climate December 2017 December 2017 was characterised by higher than normal sea level pressure over New Zealand and the surrounding seas. This pressure
Montana Drought & Climate
 Montana Drought & Climate MARCH 219 MONITORING AND FORECASTING FOR AGRICULTURE PRODUCERS A SERVICE OF THE MONTANA CLIMATE OFFICE IN THIS ISSUE IN BRIEF PAGE 2 REFERENCE In a Word PAGE 3 REVIEW Winter 219:
Percentage of normal rainfall for April 2018 Departure from average air temperature for April 2018
 New Zealand Climate Update No 227, May 2018 Current climate April 2018 Overall, April 2018 was characterised by lower pressure than normal over and to the southeast of New Zealand. Unlike the first three
The U. S. Winter Outlook
 The 2017-2018 U. S. Winter Outlook Michael Halpert Deputy Director Climate Prediction Center Mike.Halpert@noaa.gov http://www.cpc.ncep.noaa.gov Outline About the Seasonal Outlook Review of 2016-17 U. S.
JEFF JOHNSON S Winter Weather Outlook
 JEFF JOHNSON S 2017-2018 Winter Weather Outlook TABLE OF CONTENTS ABOUT THE AUTHOR Components of the seasonal outlook... 2 ENSO state/ocean temperatures... 3 Sub-seasonal outlooks... 4 Forecast models...
Seasonal Outlook through September 2007
 Seasonal Outlook through September 2007 Klaus Wolter (18apr07) University of Colorado, CIRES & NOAA-ESRL Climate Analysis Branch klaus.wolter@noaa.gov http://www.cdc.noaa.gov/people/klaus.wolter/swcasts/
2011 Year in Review TORNADOES
 2011 Year in Review The year 2011 had weather events that will be remembered for a long time. Two significant tornado outbreaks in April, widespread damage and power outages from Hurricane Irene in August
California 120 Day Precipitation Outlook Issued Tom Dunklee Global Climate Center
 California 120 Day Precipitation Outlook Issued 11-01-2008 Tom Dunklee Global Climate Center This is my second updated outlook for precipitation patterns and amounts for the next 4 s of the current rainy
2015 Summer Forecast
 2015 Summer Forecast Inside This Forecast Summer 2014 Recap 2 Implications of El Niño and the PDO on the Upcoming Summer Summary of Global Indices & Oscillations Analog Year: The Midwest a battleground
Weekly Weather Briefing. NWS Albuquerque. Tuesday Soaker. NWS Albuquerque August 25, Weekly Weather Briefing
 Weekly Weather Briefing Weekly Weather Briefing Tuesday Soaker August 25, 2014 August 2014 vs. 2013 Precipitation Percent of Average August 1-24, 2014 August 2013 Weekly Weather Briefing ABQ **Preliminary**
PRMS WHITE PAPER 2014 NORTH ATLANTIC HURRICANE SEASON OUTLOOK. June RMS Event Response
 PRMS WHITE PAPER 2014 NORTH ATLANTIC HURRICANE SEASON OUTLOOK June 2014 - RMS Event Response 2014 SEASON OUTLOOK The 2013 North Atlantic hurricane season saw the fewest hurricanes in the Atlantic Basin
An upper to mid level circulation (Low) in the NW Caribbean is
 in the NW Caribbean is") WEEKLY WEATHER OUTLOOK BELIZE, CENTRAL AMERICA PERIOD: Monday-Monday, Oct. 1 October 8, 2012 DATE ISSUED: Monday, Oct 1, 2012 6:00 am RFrutos EcoSolutions & Services SYNOPSIS: An upper to mid level circulation
WEEKLY WEATHER OUTLOOK BELIZE, CENTRAL AMERICA PERIOD: Monday-Monday, Oct. 1 October 8, 2012 DATE ISSUED: Monday, Oct 1, 2012 6:00 am RFrutos EcoSolutions & Services SYNOPSIS: An upper to mid level circulation
Winter Forecast. Allan Huffman RaleighWx
 Winter 2017-18 Forecast Allan Huffman RaleighWx Disclaimer Seasonal forecasting is difficult and you are always learning. I attempt to look at all factors I understand and have seen correlate in the past
KUALA LUMPUR MONSOON ACTIVITY CENT
 T KUALA LUMPUR MONSOON ACTIVITY CENT 2 ALAYSIAN METEOROLOGICAL http://www.met.gov.my DEPARTMENT MINISTRY OF SCIENCE. TECHNOLOGY AND INNOVATIO Introduction Atmospheric and oceanic conditions over the tropical
Monthly Long Range Weather Commentary Issued: APRIL 18, 2017 Steven A. Root, CCM, Chief Analytics Officer, Sr. VP,
 Monthly Long Range Weather Commentary Issued: APRIL 18, 2017 Steven A. Root, CCM, Chief Analytics Officer, Sr. VP, sroot@weatherbank.com MARCH 2017 Climate Highlights The Month in Review The average contiguous
New Zealand Climate Update No 226, April 2018 Current climate March 2018
 New Zealand Climate Update No 226, April 2018 Current climate March 2018 March 2018 was characterised by significantly higher pressure than normal to the east of New Zealand. This pressure pattern, in
North Pacific Climate Overview N. Bond (UW/JISAO), J. Overland (NOAA/PMEL) Contact: Last updated: August 2009
, J. Overland (NOAA/PMEL) Contact: Last updated: August 2009") North Pacific Climate Overview N. Bond (UW/JISAO), J. Overland (NOAA/PMEL) Contact: Nicholas.Bond@noaa.gov Last updated: August 2009 Summary. The North Pacific atmosphere-ocean system from fall 2008 through
North Pacific Climate Overview N. Bond (UW/JISAO), J. Overland (NOAA/PMEL) Contact: Nicholas.Bond@noaa.gov Last updated: August 2009 Summary. The North Pacific atmosphere-ocean system from fall 2008 through
North Pacific Climate Overview N. Bond (UW/JISAO), J. Overland (NOAA/PMEL) Contact: Last updated: September 2008
, J. Overland (NOAA/PMEL) Contact: Last updated: September 2008") North Pacific Climate Overview N. Bond (UW/JISAO), J. Overland (NOAA/PMEL) Contact: Nicholas.Bond@noaa.gov Last updated: September 2008 Summary. The North Pacific atmosphere-ocean system from fall 2007
North Pacific Climate Overview N. Bond (UW/JISAO), J. Overland (NOAA/PMEL) Contact: Nicholas.Bond@noaa.gov Last updated: September 2008 Summary. The North Pacific atmosphere-ocean system from fall 2007
UPDATE OF REGIONAL WEATHER AND SMOKE HAZE (May 2017)
") UPDATE OF REGIONAL WEATHER AND SMOKE HAZE (May 2017) 1. Review of Regional Weather Conditions in April 2017 1.1 Inter monsoon conditions, characterised by afternoon showers and winds that are generally
UPDATE OF REGIONAL WEATHER AND SMOKE HAZE (May 2017) 1. Review of Regional Weather Conditions in April 2017 1.1 Inter monsoon conditions, characterised by afternoon showers and winds that are generally
Special blog on winter 2016/2017 retrospective can be found here -
 March 4, 2019 Special blog on winter 2016/2017 retrospective can be found here - http://www.aer.com/winter2017 Special blog on winter 2015/2016 retrospective can be found here - http://www.aer.com/winter2016
By: J Malherbe, R Kuschke
 2015-10-27 By: J Malherbe, R Kuschke Contents Summary...2 Overview of expected conditions over South Africa during the next few days...3 Significant weather events (27 October 2 November)...3 Conditions
 Page 1 of 5 Home research global climate enso effects Research Effects of El Niño on world weather Precipitation Temperature Tropical Cyclones El Niño affects the weather in large parts of the world. The
Minnesota s Climatic Conditions, Outlook, and Impacts on Agriculture. Today. 1. The weather and climate of 2017 to date
 Minnesota s Climatic Conditions, Outlook, and Impacts on Agriculture Kenny Blumenfeld, State Climatology Office Crop Insurance Conference, Sep 13, 2017 Today 1. The weather and climate of 2017 to date
Monthly Long Range Weather Commentary Issued: February 15, 2015 Steven A. Root, CCM, President/CEO
 Monthly Long Range Weather Commentary Issued: February 15, 2015 Steven A. Root, CCM, President/CEO sroot@weatherbank.com JANUARY 2015 Climate Highlights The Month in Review During January, the average
Midwest/Great Plains Climate-Drought Outlook September 20, 2018
 Midwest/Great Plains Climate-Drought Outlook September 20, 2018 Brian Fuchs National Drought Mitigation Center University of Nebraska-Lincoln School of Natural Resources September 20, 2018 General Information
Percentage of normal rainfall for August 2017 Departure from average air temperature for August 2017
 New Zealand Climate Update No 219, August 2017 Current climate August 2017 Overall, mean sea level pressure was lower than normal over and to the west of New Zealand during August while higher than normal
Monthly Long Range Weather Commentary Issued: APRIL 25, 2016 Steven A. Root, CCM, Chief Analytics Officer, Sr. VP, sales
 Monthly Long Range Weather Commentary Issued: APRIL 25, 2016 Steven A. Root, CCM, Chief Analytics Officer, Sr. VP, sales sroot@weatherbank.com MARCH 2016 Climate Highlights The Month in Review The March
2015: A YEAR IN REVIEW F.S. ANSLOW
 2015: A YEAR IN REVIEW F.S. ANSLOW 1 INTRODUCTION Recently, three of the major centres for global climate monitoring determined with high confidence that 2015 was the warmest year on record, globally.
ALASKA REGION CLIMATE OUTLOOK BRIEFING. June 22, 2018 Rick Thoman National Weather Service Alaska Region
 ALASKA REGION CLIMATE OUTLOOK BRIEFING June 22, 2018 Rick Thoman National Weather Service Alaska Region Today s Outline Feature of the month: Ocean Warmth Headed into Summer Climate Forecast Basics Climate
U.S. Outlook For October and Winter Thursday, September 19, 2013
 About This report coincides with today s release of the monthly temperature and precipitation outlooks for the U.S. from the Climate Prediction Center (CPC). U.S. CPC October and Winter Outlook The CPC
Presentation Overview. Southwestern Climate: Past, present and future. Global Energy Balance. What is climate?
 Southwestern Climate: Past, present and future Mike Crimmins Climate Science Extension Specialist Dept. of Soil, Water, & Env. Science & Arizona Cooperative Extension The University of Arizona Presentation
The U. S. Winter Outlook
 The 2018-2019 U. S. Winter Outlook Michael Halpert Deputy Director Climate Prediction Center Mike.Halpert@noaa.gov http://www.cpc.ncep.noaa.gov Outline About the Seasonal Outlook Review of 2017-18 U. S.
Weather and Climate Risks and Effects on Agriculture
 Weather and Climate Risks and Effects on Agriculture Dr. Eric Snodgrass Official Journal of the Fluid Fertilizer Foundation Vol. 26, No. 2, Issue #100 DOWNLOAD Summary: So, what do we need to watch for?
January 25, Summary
 January 25, 2013 Summary Precipitation since the December 17, 2012, Drought Update has been slightly below average in parts of central and northern Illinois and above average in southern Illinois. Soil
The Pennsylvania Observer
 The Pennsylvania Observer January 5, 2016 December 2015 - Pennsylvania Weather Recap By: Arthur Person December is the first of the three coldest months of the year. Sometimes it can be naughty, and sometimes
Seasonal Climate Watch April to August 2018
 Seasonal Climate Watch April to August 2018 Date issued: Mar 23, 2018 1. Overview The El Niño-Southern Oscillation (ENSO) is expected to weaken from a moderate La Niña phase to a neutral phase through