Duo. Mintaka. Dual-Sensor Precision Barograph. User s Guide
|
|
|
- Marybeth Long
- 5 years ago
- Views:
Transcription


1 Mintaka Dual-Sensor Precision Barograph User s Guide Duo
2 Published by: Starpath Publications, 3050 NW 63rd Street, Seattle, WA starpathpublications.com Copyright 2015 Starpath Publications All rights reserved. No part of this book may be reproduced or transmitted in any form or by any means, electronic or mechanical, including photocopying, recording, or any information storage or retrieval system, without permission in writing from the publisher Manufactured in the United States of America. Please note that this User s Guide does not create any legally binding obligations for Starpath Corporation or Mintaka Instruments, LLC towards the customer or end user. All legally binding commitments and agreements are included exclusively in the appropriate supply contract or Conditions of Sale. v For User Guide updates, tech support and related information, see which includes a link to register your unit online. MINTAKA INSTRUMENTS


3 Quick Start Guide 3 Battery Pack Plug for optional connection to Gill Port for remote pressure sensing. POWER OPTIONS USB AC Adapter Mini USB Unique ID and S/N 9V-30V DC Computer + or to step selection or cursor, up-down or left-right SELECT highlighted option, or press and hold to change display between pressure value, pressure graph, or tendency display EXIT current display to main menu or to previous display or press and hold to adjust the contrast 120V AC to 12V DC power adapter or direct to DC source Included in the box: Barograph, 120V AC to 12V DC power adapter, User s Guide, and piece of removable fastener. Shortcut Display Options Once powered on, all functions and displays can be reached from the screen menus explained in this User s Guide, with full menu maps in Appendix A7 at the back of the book. These single-button shortcuts below are also available. Press and hold [SELECT] to toggle through these main screens.
4 4 Contents Quick Start Guide...3 Shortcut Display Options...3 INTRODUCTION...6 Product Description and Options...6 Quick Start Instructions...6 Terminology and Applications...6 How to Use this User s Guide...7 Instrument Power...8 Contrast Control...8 Mounting...8 Use of the Control Buttons...9 EXIT Button...9 [+] and [-] Buttons...10 SELECT Button MENU SHOW VALUES Show Values / Pressure...10 Pressure Trend Arrows Show Values / Clock Show Values / History...14 How Data are Accumulated and Displayed MENU SHOW GRAPH Show Graph / Graph Pressure...16 Shortcut Graph Display...17 Average Pressure Display...18 Samples of Barograph Traces Show Graph / Graph Tendency Show Graph / Tendency Code MENU LOG PRESSURE...21 Pressure Tendency Characteristic Codes Log Pressure / Log Now Log Pressure / View Entries Log Pressure / Clear Entries...23
5 5 4. MENU SET-UP Set-up / Units, Time Zone Set-up / Sea Level Pressure (SLP)...24 Set Sea Level Pressure by Elevation...25 Set Sea Level Pressure by Pressure Value...26 To Change from SLP back to Station Pressure Set-up / Station Pressure Adj Set-up / System...27 Set-up / System / Time...27 Set-up / System / Reset...28 Reset Pressure History...28 Reset to Factory Settings OPERATIONS Displays Following Power Interruption Connecting to the Duo from a Computer Maintenance Limited Warranty FCC and CE Compliance Specifications Summary Support Options and References...37 APPENDIX...38 A1. Measuring elevation changes with the Mintaka Duo...38 A2. Sea Level Pressure vs. Altimeter Pressure...39 A3. Pressure Tendency Characteristic Codes...40 A4. Where to Find Accurate Sea Level Pressure...41 A5. How to Find Accurate Elevation...41 On Land...41 On Water...41 A6. Calibration Procedures...42 Ship s Barometer Corrections...46 A7. Menu Map...48
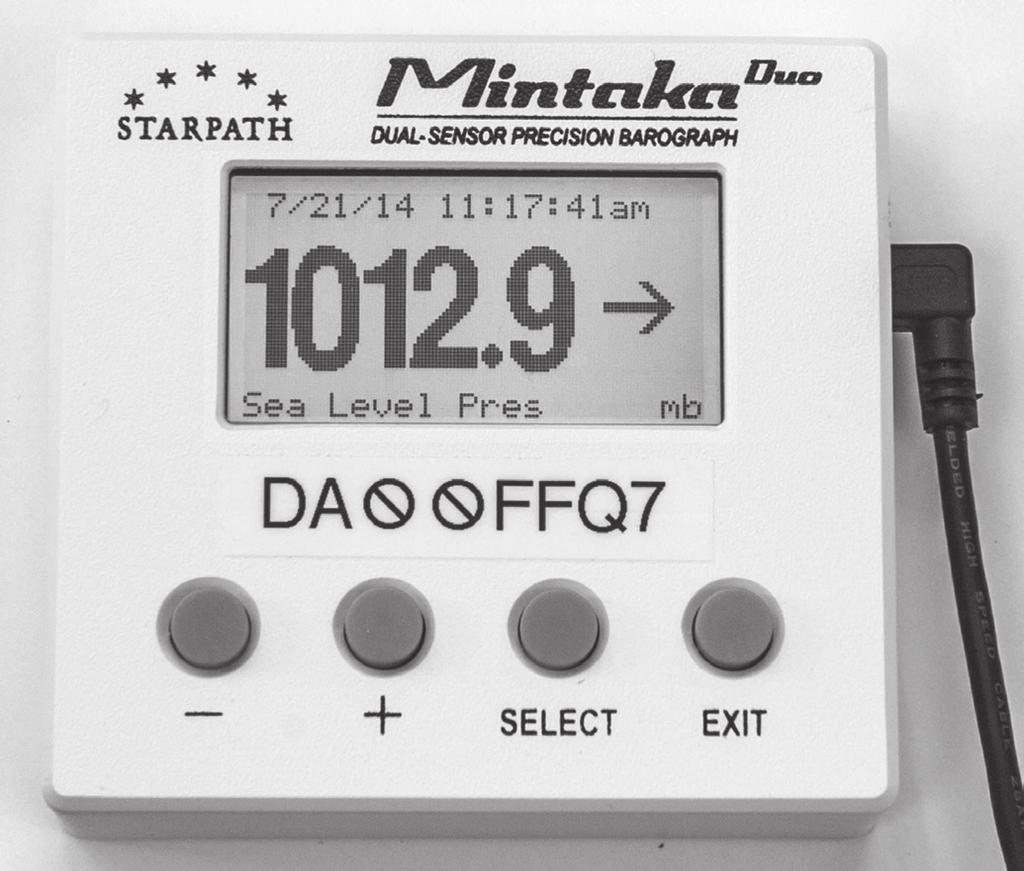
6 6 INTRODUCTION Product Description and Options The Starpath Mintaka Duo ( Duo ) is an electronic barograph that measures atmospheric pressure using two independent, high-precision sensors. The measured pressure can be presented digitally or as a graphic plot of historical values displayed over time ranges of the past 30 minutes on up to the past 120 days. Numerous convenient display options are included to meet special needs of marine navigation, engineering, medicine, and science. The standard package includes the Duo barograph, a 120V AC to 12V DC power adapter, and this User s Guide. An optional international power adapter is available. An optional 6-ft cable with a matching DC barrel plug connector is available for direct wiring to a DC power source. An optional version designed for remote sensing (or connection to a Gill Pressure port) is available. This option has a 3-mm plastic tube with quick release pressure connector extending from the left side. NIST traceable full pressure range calibrations valid for one year for individual instruments are available as an option. Quick Start Instructions Plug the power adapter into an appropriate (US or International) AC outlet, and connect to the barrel plug on the right side of the Duo. After powering on the instrument for the first time, you will see the screen below asking you to set the time zone. Use [+] or [-] keys to set it, [SELECT] to accept your choice, then a final [SELECT] to store the value. The pressure in mb will then be displayed. If the unit had been powered on earlier, this will not show; units and time zone are discussed in Sec. 4.1 Shortcut display options are shown on page 3. A full map of the menus is in Appendix A7. Specific instructions for each of the many features and options of the device are described in this User s Guide. Pressure trend arrows will not appear until the unit has been running for at least one hour. Terminology and Applications Although other terms are often used, only two values of atmospheric pressure matter for most applications, station pressure and sea level pressure. Station pressure is the value of the atmospheric pressure at the location and elevation of the instrument. It is the weight of the atmosphere (per unit area) from the instrument s elevation on up to the top of the atmosphere.
7 7 Sea level pressure, on the other hand, is a computed value of the pressure that is intended to represent what your instrument would read at this moment if it could (hypothetically) be lowered to sea level at your location. When inland at an elevation of 300 ft above sea level, it would be the pressure your instrument would read if you lowered it into a hole that was 300 ft deep. As you lower it down, there is more and more atmosphere above it, so the weight of the air above it and the corresponding pressure increases as it lowers. Sea level pressure is always higher than station pressure unless your barometer happened to be located below mean sea level, which is possible at ground level at a few locations, and often the case in mining applications. Depending on your application, you will want to display either sea level pressure or station pressure. Sea level pressure is commonly abbreviated SLP. Other terms and abbreviations are addressed in Appendix A2. If your main interest in atmospheric pressure is related to weather, then you will most likely want to display sea level pressure (SLP), regardless of the location or elevation of your Duo. Essentially all broadcast or published weather reports are given in terms of SLP, and all weather maps identify the isobars of constant pressure in terms of SLP. Furthermore, if you are reporting your weather observations to another agency or broadcast station, they will expect your reported pressure to be SLP. Thus if your application is weather related, you will want to use the Set-up option to adjust the instrument to show SLP. You can make this adjustment one of two ways, either from a known value of SLP at the time, or from a known elevation of the instrument. The step by step procedure is explained in this User s Guide. It does not matter if you are in a boat with the instrument at 6 ft above sea level or in Sante Fe, NM at 7,000 ft above sea level. The procedure is the same for adjusting the instrument to display SLP. Other applications of accurate atmospheric pressure do not care at all about SLP. They care only about the actual pressure right at the location of the instrument, which is the station pressure. If you are, for example, tuning an engine, or calibrating a medical instrument in a hospital, or setting controls on a sensitive air conditioner, or documenting life raft leak rates, or setting controls on a regional power station, it is the actual value of the pressure at the test site that matters. The weather causing it and changes introduced by instrument elevation above sea level do not matter. Station pressure applications require no special settings. If you have reason to change the internal calibration factor for the sensors, you can make an adjustment that will change the station pressure reading. All instruments that read barometric pressure, either mechanical (aneroid) devices or electronic devices in any price range, will eventually drift off of their initial calibration to some extent. For the most precise work, it is recommended by the World Meteorological Organization (WMO) and the National Weather Service (NWS) to check the calibration at least once a year. Accuracy, drift, and calibration options are discussed later in the User s Guide. How to Use this User s Guide It is recommended that you skim through the full User s Guide before using the instrument. Then for details on a specific function, find that function in the list of MENUs in the Table of Contents (page 4.). This will direct you to the pages that cover
8 the topic. An inserted cross-reference such as (Sec. 2.4) means the topic at hand is further discussed in Section 2.4. A full map of the menus is in Appendix A7. Instrument Power The Duo requires an external source of power. There are no internal batteries other than a long term (> 10 years) cell that maintains the precision clock timer. The instrument can be powered by any 9V to 30V DC source via the barrel plug connector on the right side. When the Duo is connected to a computer, the power is supplied by the computer through the USB cable. This 5V DC power source via USB connector is the same used by many cellphone chargers and other electronic devices. A standard USB to mini-b USB cable is required for this connection. Alternatively, you can plug the USB cable into any standard 5V USB power source for portable operation. Twelve or 24V DC operation can be achieved with a cigarette-lighter style USB adapter or an optional barrel plug power cable can be used to hardwire the device into a vessel or vehicle s DC power system. A portable USB power pack can be used for mobile applications. The average current used is about 63 ma at 5V. The average current used depends on how frequently the back lighting is being used. At 12V the average current is about 38 ma. See Sec. 5.6 for detailed specifications. To preserve the lifetime of the display screen, and to facilitate mobile applications, the screen light shuts off after 1 minute past the last button push. The light comes back on automatically with the touch of any button. There are numerous USB battery pack options available on the market with various storage capacities. These are very compact units that also serve as backup power for cell phones and other devices. A unit with 6,000 ma-hr capacity will run the Duo in a portable mode continuously for about 4 days. Disconnecting the power when not in use would extend this greatly. In a portable mode the Duo can be used for pressure measurements away from other power options. Portable operation can be used for accurate elevation measurements on land, as outlined in Appendix A1. Contrast Control If after changing power sources, or for any reason, you wish to adjust the display contrast this can be done by pressing and holding the [EXIT] button to access the Set Contrast screen, then use [+] or [-] to adjust, then use [EXIT] to highlight OK, and press [SELECT]. To exit without changing control, highlight Cancel, and press [SELECT]. You can also access Set Contrast from the main menu: [EXIT] / Set-up / System / Contrast. Mounting You can mount the Duo on the wall or bulkhead using either two screws or with a piece of Velcro or Dual Lock removable fastener tapes. Removable fasteners have been used for mounting similar devices on vessels at sea for many years. Dimensions are shown below to assist with screw mounting. 8

![In this User s Guide we use the notation [±] to mean either [+] or [-] as needed. EXIT Button The [EXIT] button exits from the present screen or menu option.](/docs-images/80/82091269/images/9-1.jpg "From a data screen, it exits to a menu screen, and from a menu screen it exits to a data screen. If you want to interact with the device, the [EXIT] button is the first button to push.")
9 9 40 mm 13 mm 6 mm 6 mm 4 mm Removable Fastener 92.5 mm 98.5 mm Wall or bulkhead mounting by screws or fastener tape. Use of the Control Buttons Duo functions are selected from the screen menus of options with the aid of four control Buttons: [ ], [+], [SELECT], and [EXIT]. In this User s Guide we use the notation [±] to mean either [+] or [-] as needed. EXIT Button The [EXIT] button exits from the present screen or menu option. From a data screen, it exits to a menu screen, and from a menu screen it exits to a data screen. If you want to interact with the device, the [EXIT] button is the first button to push. If you enter a menu and decide you do not want to change anything, press [EXIT] again to return to the data. On menu screens with multiple input options, you can also use [EXIT] to exit that option and go to the next without changing anything. These screens include
10 specific OK or Cancel options so you can double check all settings before accepting or exiting that menu. 10 [+] and [-] Buttons The [±] buttons are used to move a highlighted selection up and down a vertical menu, to raise or lower a numerical value, or to move a cursor to the right or left when viewing a graph. Use of the [+] and [-] Buttons Menu Numbers Cursor [+] Up Increase Right [ ] Down Decrease Left SELECT Button The [SELECT] button is used to accept choices displayed on a highlighted section of a menu page, either before or after you change them with the [±] buttons. Pressing the [SELECT] button then either activates the choice you have made or it moves you to the next choice that must be made on that menu screen. Menus with multiple options will then have a Cancel or OK option. Highlight your choice, and press [Select] to execute your selections. The [EXIT] button can be used to move from option to option without making any selection. 1.1 Show Values / Pressure 1. MENU SHOW VALUES.. Main Menu / Show Values / Pressure This leads to the default display, which shows the date, time, pressure, along with the pressure units and mode of the pressure display (station pressure or sea level pressure, SLP).
11 11 Show Values / Pressure (mb and inches) The pressure values can be displayed in several different units, which can be changed at any time without affecting the recorded pressure history. The default units are millibars, which are the same as hectopascals. See Sec. 4.1 on setting units. Arrows indicating recent pressure trends are also shown, starting after one full hour of operation. The time and date are displayed using and showing the time zone entered in the Set-up menu. U T C means universal coordinated time. The unit can also be set to display Sea Level Pressure (Sec. 4.2). Pressure Trend Arrows After one hour of operation, the arrows shown to the right of the pressure value is a graphic indicator of how the pressure is changing to provide a quick visual notice of significant changes. The definitions used to determine which arrows are displayed are consistent with those used by the World Meteorological Organization (WMO). The numerical value of the change over the past 3 hr is called the Pressure Tendency. After a full 3 hours of operation, the tendency values are stored with each recorded pressure. The numerical values can be plotted as a graph or shown in a digital list of the data in the Show Values / History option. The pressure trend arrows, however, indicate the rate of change on a more timely basis. After 1 hour of operation, the anticipated 3-hr change will be indicated by these arrows, and this value will then be updated every 15 seconds. Thus these arrows are a quick visual description of the rate of pressure change, which can be checked more specifically by referring to the graph display or the official pressure tendency display, which is calculated strictly on the difference between present pressure and the pressure 3 hours earlier. There are various factors that can cause the pressure to change with time, especially on a moving vessel, but a good rule of thumb is any pressure changing Fast can be a valuable sign of a pending change in the weather. Often by the time the change is Very Fast, the weather has already notably changed.
12 12 Table 1.1 Pressure Trend Arrows Symbol Description Stationary Anticipated 3-hr Pressure Change based on previous 1-hr history < 1 mb < 0.03 inhg Rising 1-2 mb inhg Rising Fast 2-3 mb inhg Rising Very Fast > 3 mb > 0.09 inhg Falling 1-2 mb inhg Falling Fast 2-3 mb inhg Falling Very Fast > 3 mb > 0.09 inhg Table 1.2 Weather Warnings TAKE NOTICE WARNING PRESENT OR IMMINENT CHANGE Broadly speaking, Falling (diagonal arrow) is a Take Notice signal; Falling Fast (one vertical arrow) is the important Alert or Early Warning signal; and Falling Very Fast (two vertical arrows) could well be already accompanied by bad weather, or if not, it should be considered an Imminent Warning of potentially severe weather.
13 13 A convenient mnemonic for pressure change as a weather warning is the guideline developed by Starpath School of Navigation, which is intended to mean that any pressure change of 4 or 5 mb over a 6-hr period is fair warning of a change. Less than that usually does not portend a significant change, and much more than that is often well past the warning stage. As further description of pressure changes used in numerical weather prediction, the NWS and WMO also define a Pressure Tendency Characteristic Code that describes the 3-hour pressure change (ie decreasing then steady is Code 6). These characteristics, usually read from a barograph trace, are submitted with all official observations. They are then shown in station model reports on weather maps. To assist observers with the often tedious task of evaluating this code, the Duo offers the unique function of computing these codes automatically, as explained in Sec Show Values / Clock Main Menu / Show Values / Clock The Duo includes a high precision clock that can be used for timekeeping as well as recording pressure histories. The time and date can be set if needed in the in the Set-up / System / Time menu (Sec. 4.4). The time zone is set in the Set-up / Units, Time Zone menu. The default time zone is 0, corresponding to Universal Time (GMT). The time of an event can be recorded in the Log Pressure / Log Now option explained in Sec This records the pressure and the time, but it could be used to document the time of any event, even if the pressure were not of interest at that time. This has numerous applications in marine navigation.. Show Values / Clock Since weather reports and maps are mostly presented in terms of UTC (GMT) the Duo displays the current value of UTC on the clock display, regardless of your primary time zone. This also makes the clock display a valuable addition to the nav station or wheelhouse of vessels at sea. The clock has its own long-term battery, so it will keep accurate time, even if the power to the barometer is removed.
14 Show Values / History Main Menu / Show Values / History Stored pressure data can be displayed graphically or in tabular format. Show Values / History presents a tabular list of times, pressures, and tendencies that shows all pressures stored.. Show Values / History in 6-hr steps (mb and inches) This is a sample of the pressures stored at 6-hr intervals. Use the [±] buttons to page through the list. The numbers on the right are the tendencies at these times. Use the [SELECT] to change the time steps in this display. Press [SELECT] to see the following window: Changing History step size Now use the [±] buttons to change the time step, then press [SELECT] to see the new list. The number of entries stored is also shown. This sample must have been running for just 510 hr (6 x 85), as the file can hold 750 data points. Two presses of the [-] key brings up the option to view the data in 48-min steps. In this case the 48- min file is full at 750 entries. Once full, new ones are added at the beginning as old ones are removed at the end. The Duo stores past pressures in 11 data files according to the time steps shown in Table 1.3.
15 Data File ID 15 Table 1.3 Barograph and History Display Options Time range in graph display Screen divisions in graph display 0 30 min 5 min 15 sec 1 3 hr 1 hr 90 sec 2 6 hr 1 hr 3 min 3 12 hr 2 hr 6 min 4 24 hr 6 hr 12 min 5 2 days 12 hr 24 min 6 4 days 24 hr 48 min 7 12 days 2 days 2 hr 8 30 days 5 days 6 hr 9 60 days 10 days 12 hr days 20 days 24 hr Time Step ( = update interval ) There are 750 values stored in each data file. They can all be viewed in tabular format from the History display. The data field is selected from the History display. There is an additional tabular history display in 1-hr steps. All stored data can be exported to a spreadsheet with a computer connection, as explained in Sec These data can also be viewed as a barograph trace over the same time intervals. The graphic display shows the past 120 points in each category. In the barograph mode, individual pressures can be read digitally using the cursor read out (Sec 2.1). How Data are Accumulated and Displayed The Duo reads the pressure once a second in each sensor and then averages 10 consecutive samples and displays that average value on the screen every second. Thus the pressure seen on the screen updating each second is the average of 20 pressure readings, one from each sensor, over the past 10 seconds. If for any reason it might be desired, either of the sensors can be shut off to read the results of just one of them. See Sec Every 15 seconds, the value displayed on the screen is stored in the 30-min file (see Table 1.3), and every 90 seconds the displayed value is stored in the 3-hr file. Likewise, every 3 min an entry is stored in the 6-hr file, and so on. Thus in reviewing the history you see the values measured at the precise times stored with each data point. That is, each point stored in a table is an average over just 10 seconds, not an average over the time step of the file. The data values at the synoptic times used in weather analysis are also automatically stored in a separate file for quick reference (Sec. 3). The numerical value of the pressure tendency is a WMO/NWS official parameter defined as the change in pressure over the past three hours.
16 16 Pressure tendency = Pressure now - Pressure exactly three hours earlier. A positive tendency means the pressure has increased over this period; a minus tendency means it has decreased. Consequently, tendency values are not presented until the instrument has been running for at least three hours. 2. MENU SHOW GRAPH 2.1 Show Graph / Graph Pressure Main Menu / Show Graph / Graph Pressure The first graph range seen will be the last one that was viewed. To change the full range displayed, use the [±] buttons to step through the options listed in Table Barograph trace for the past 24 hours. It updates every 12 min. Optional displays are listed in Table 1.3. Samples are shown at the end of this section. The top right shows the present pressure, which updates every second. The vertical scale of each barograph display is computed automatically to span the display and shown on the left. In this example, the top of the display is 1015 mb and the bottom is 1009 mb and each horizontal division is 1 mb. The size of the horizontal divisions changes to match the vertical scale. The present pressure was mb, shown at the top right. This display of present pressure will update once a second. The vertical index lines mark 6-hr intervals in this display; the two that are not labeled on the left are extensions of what is seen on the right, namely -18H and -24H. Each graph requires this projection to identify the last two lines, as seen in the sample screens at the end of this section. The Station label at the top is a reminder that you are viewing Station Pressure. If the instrument had been set to sea level pressure that label would read SLP as a reminder. The digital display of the pressure value shown at the time of the reading (1013.7) and the history plot are updated according to the time per pixel step in the display according to Table 1.3.
17 17 To read digital values from the graph, you can use a shortcut of pressing and holding either the [+] or [-] button. This will display a digital readout window on top of the graph along with a vertical cursor line (close-spaced dots). The [-] button starts the cursor on the right of the screen; the [+] button starts it on the left. Pressure reading at the cursor position. The readout shifts position as you move the cursor to keep the trace in view. The readout shown corresponds to the value at the cursor line. Once the cursor is showing the [±] buttons move the cursor in either direction. The single digit in the top right (1 at 1100 and 2 at 0212) is the Pressure Tendency Characteristic Code value, explained in Sec It varies between 1 and 8. Press the [EXIT] to close the readout display. Shortcut Graph Display When viewing the digital value of the pressure (Show Value / Pressure), you can press and hold [SELECT] to directly display the Graph screen. A second press and hold shows the tendency display screen, and a third press and hold brings you back to the digital pressure. An alternative way to set the graphic display scale as opposed to just Show Graph and using [±] buttons is to Show Graph and then press [SELECT] once (without holding). This opens a new options screen. Graph Options Menu from Select when viewing a graph. Use [±] to choose the desired range and press [SELECT]. The full range of the graph is shown in the top right of the display. This will change as you change the step to show the corresponding range. The next step asks to show the 24-hr average or not. For most applications you would choose No. The 24-hr average display is most important in the tropics where there is a large semi-diurnal variation in the pressure, discussed below. The last step is to choose to turn on the digital readout starting with cursor on the Left or Right or None. The default (None) leaves it off; you can always turn it on from the graph by holding down a [±] button.
18 18 A sample sequence of history displays is shown at the end of this section. Average Pressure Display A unique feature of the Duo is the ability to show a running 12-hour average of the pressure. This is of special value at low latitudes where the pressure typically oscillates on a fairly consistent pattern. This semi-diurnal variation is superimposed on all barograph traces in the tropics. Barograph trace of Hurricane Sandy, viewed from a vessel off the coast of Panama, using an early version of the Mintaka Duo. The semi-diurnal pattern is clearly visible on top of the main ambient pressure change. See expanded views below. Below is a sample of a diurnal pattern with the pressure average line overlaid on the graph. Dotted line is the 12-hr running average over 30 hr (left) and 5 days (right) As with normal display, the [±] button turns on the digital readout with active cursor control, but when in this mode you see both the pressure at the average value at the cursor along with the actual pressure at that time. Cursor readout with 12-hr average turned on. The value in parenthesis is the average value at the time of the cursor position.
19 19 Samples of Barograph Traces Past 30 minutes Past 3 hours Past 6 hours Past 12 hours Past 24 hours Past 2 days Past 4 days Sample sequence of history displays. Not shown are 12, 30, 60, and 120 days. The [±] buttons step forward or backward through the displays. 2.2 Show Graph / Graph Tendency Main Menu / Show Graph / Graph Tendency
20 Pressure tendency is internationally defined as the change in pressure over the past 3 hours. It is usually expressed in mb (hpa). It can be used to anticipate changes in the pressure, and in some cases change in the weather as discussed in Sec The graph shows how the tendency is changing with time. The history range and display options are the same as in the pressure graphs (Sec. 2.1). This graph shows how the change is changing, which can be a valuable aid to forecasting. A steady pressure drop (meaning a flat curve of tendency vs. time)can be a definite warning (Sec. 1.1), but a downward slope to this graph means the rate of pressure drop is increasing with time. A fast rising pressure can also portend strong wind in some weather patterns. 20 Pressure tendency graph and digital readout at the cursor. Note that if the elevation of the instrument changes, the recorded tendency will reflect how the pressure changed over the last 3 hours, but this will not reflect actual changes in atmospheric pressure. The instrument must remain at a constant elevation for at least 3 hours for this number to be a measure of atmospheric pressure changes. A glance at the pressure graph itself usually clarifies unusual influences on the indicated pressures and tendencies. 2.3 Show Graph / Tendency Code This is a unique function of the Duo designed to assist weather observers who must report not only the pressure tendency, but also the official Tendency Characteristic Code that describes the nature of the change, such as Decreasing, then Steady. Without this custom aid, the Code must be determined from the shape of the past 3-hr barograph trace using a sometimes complex set of criteria. This characteristic is valuable for all weather watchers, not just the professionals, as it adds more understanding to the numerical value of the pressure tendency itself, as well as extending the interpretation of reports shown on weather maps. Main Menu / Show Graph / Tendency Code
21 21 Example of the Pressure Tendency Characteristic Code display. On the left, we see that the tendency at the present time is +0.8 (pressure rose 0.8 mb over the last 3 hours), and the shape of the trace is Code 3, in this case meaning decreasing then increasing. On the right, the [-] button has been pressed to interrogate the trace at earlier times, in this case showing that at time 2236, a little over 30 min ago, the pressure was and the tendency was (not shown). The Code at that time was 1 (top right), reflecting a different shape to the 3-hr period preceding that time. There is a mathematical algorithm that defines the Code for any pressure pattern. A pressure change of just 0.1 mb at either end of the 3-hr period can yield a different Code, which illustrates the great value of this automatic function. On this Duo screen you see the 3-hour trace that defines the tendency and its characteristic code. The right side of the display shows the present pressure, the characteristic code symbol, the code value, and at the bottom is the value of the tendency itself (difference between present pressure and that of 3 hours earlier). The tendency and the code values are updated every 15 seconds as new data changes the 3-hour history. The codes are defined in Table 2.3. Each code has an associated WMO assigned graphic symbol. These symbols are shown on weather maps that report observations in a format that is called a station model. As seen Table 2.4, some symbols cover more than one description of the 3-hr trace. See Appendix A3 for related discussion. 3. MENU LOG PRESSURE Main Menu / Log Pressure The Log Pressure is another unique Duo function that is directed toward users who care to compare their observations with the official forecasts or for observers who must report pressures at the official times. For many pressure applications in navigation and general weather monitoring on shore, it is convenient to compare your measured pressure with official forecasts and weather maps. These official data are collected, analyzed, and then reported worldwide at the synoptic times of 00, 06, 12, and 18 UTC. To facilitate these comparisons, the Duo automatically records these pressures.
22 22 Table 2.3. WMO Pressure Tendency Characteristic Codes Pressure now higher than three hours ago Description Code Wx Map Symbol Increasing, then decreasing 0 Increasing, then steady 1 Increasing, then increasing more slowly 1 Increasing (steadily or unsteadily) 2 Increasing, then increasing more rapidly 3 Steady, then increasing 3 Decreasing, then increasing 3 Pressure the same as three hours ago Description Code Wx Map Symbol Increasing, then decreasing 0 Steady 4 Decreasing, then increasing 5 Pressure now lower than three hours ago Description Code Wx Map Symbol Decreasing, then increasing 5 Decreasing, then steady 6 Decreasing, then decreasing more slowly 6 Decreasing (steadily or unsteadily) 7 Decreasing, then decreasing more rapidly 8 Steady, then decreasing 8 Increasing, then decreasing 8
23 23 and stores them. These data are stored in UTC, so it does not matter what time zone (zone description) you have stored in the system so long as the time is set correctly to any time zone. It may also be convenient to record the pressure at specific times to document a reading corresponding to other logged events that use the pressure value, such as logbook entries on vessels at sea or at specific times of laboratory measurements on land. This can be accomplished with the Log Now feature discussed below. 3.1 Log Pressure / Log Now This selection records the present time and date, pressure and pressure tendency in the log. A manual entry is marked by an asterisk to distinguish it from the automatically stored values at the synoptic times. When logging a pressure manually, a window shows briefly acknowledging your entry, then the list of entries is presented. Manually entered pressures can be removed with the Clear Entries option (Sec. 3.3). Manually logged pressures are stored in UTC, even though you might be using a different time zone for the clock and barograph displays. You can also use this feature to record accurate time to the second of any event, even if the pressure itself is not the motivation for the entry. Need for such a record comes up often in marine navigation. It could also be valuable when using the Duo for accurate elevation measurements on land (Appendix A1). 3.2 Log Pressure / View Entries This option shows the list of logged pressures, both automatic and manual. The [±] buttons are used to page through the stored values a total of 750 points (187.5 days of synoptic times) plus up to 25 manually entered pressures. Log Pressure display showing 2 manually entered pressures along with 5 automatically recorded synoptic-time values. [±] pages through the data. 3.3 Log Pressure / Clear Entries To remove the manually added records from the Log, choose Clear Entries. A window appears then to ask for your confirmation, or you can cancel without removing these data from the Log. This Clearing removes the pressure records added manually, but leaves the synoptic time records. All pressures, however, are still stored in the Show Values / History file and in the Show Graph / Pressure plots. Up to 25 manually entered pressures are allowed.
24 24 4. MENU SET-UP Set-up options are ones that are not changed frequently. Settings you select here are not changed when you Reset Pressure History (Sec. 4.4), but they are returned to the default values when you select Reset To Factory Settings. 4.1 Set-up / Units, Time Zone Set-up / Units, Time Zone This menu is used to set units for pressure and elevation as well as changing the time zone and time display mode (12h or 24h system). The default values are mb (same as hpa), feet, and Time Zone 0, corresponding to UTC (same as GMT), shown using a 24h system. Main Set-up menu. Use the [±] buttons to change the options for the highlighted section, and then press [SELECT] to move on to the next option. When done, press [SELECT] when the OK is highlighted. (The internal clock time itself can be adjusted as needed in the Set-up / System / Time display.) The units options include: mb, inhg, mmhg, inh2o, cmh2o, kpa, hpa. 4.2 Set-up / Sea Level Pressure (SLP) There are two ways to set the Duo to display Sea Level Pressure (SLP). You can use a known value of the SLP at the present time and location of the instrument, or you can use the known elevation of the instrument at its present location. The choice is made using the [±] buttons when the SLP menu first appears, which will change
25 25 the mode in the highlighted area. Set SLP by elevation offset or by known SLP. Use [±] to toggle the choice, then [SELECT] to see the screens below where the data are entered. Set Sea Level Pressure by Elevation After selecting Set by Elevation Offset, the first digit on the left of the elevation input will be highlighted and ready to change. Use the [±] buttons to set this digit correctly, and then press Select. After all digits are entered correctly, highlight OK and press [SELECT]. You can move the highlight with [SELECT] or [EXIT]. Likewise to cancel the operation, highlight Cancel and press [SELECT]. For example, from the above screen, to enter 130 ft, you would press [SELECT] twice to get to the hundreds digit, then press the [+] key once, then [SELECT], then [+] key three times, then [SELECT], and again [SELECT] to enter the final 0, and one more [SELECT] to highlight OK and a final [SELECT] to record your elevation. The proper elevation to use would be the elevation of the ground at your location plus the additional height of the instrument above ground level. This additional height above the ground is called the Removal Correction. This will then correct the pressure to sea level, and store that elevation. Once this elevation has been entered, your display screens will be labeled SLP, which is a reminder that you are reading the equivalent sea level pressure. To return to Station Pressure, repeat the process and enter all zeros for the elevation offset. This correction can be entered when the instrument is at any location, but the displayed sea level pressure would only be correct when the instrument is located at the elevation entered and stored in the unit. The accuracy of the displayed SLP depends on the accuracy of the elevation offset that is entered. The pressure changes at a rate of 0.44 mb per 12 ft, so an error of 6 ft would cause a display error of about 0.2 mb. Accurate ground elevations can be found from a topographic map or from online services like Google Earth or other sources listed in Appendix A4.
26 26 The accuracy of the SLP relative to Weather Service reports can also depend somewhat on the actual elevation. At higher elevations, the most accurate conversion from Station Pressure to Sea Level Pressure depends on the outside air temperature as well as the elevation. This detail and standard corrections are addressed in Appendix A2. Set Sea Level Pressure by Pressure Value The alternative way to set the instrument to SLP is to set it directly to a known value of the SLP at your location at the time you choose to set it. The procedure for entering the digits is the same as described for entering an elevation earlier in this section. See Appendix A4 for a discussion of obtaining accurate sea level pressure for your location. Commercial weather broadcasts on radio or TV are a good starting point, but they may not be as dependable as more primary sources. After entering a SLP here, all other pressures reported in the instrument will be marked SLP as a reminder that you have entered this offset. To Change from SLP back to Station Pressure When you change the display from Station Pressure to SLP by entering the correct SLP, it is equivalent to entering the corresponding elevation for the instrument. Thus when you return to the Set SLP by Elevation menu you will see the equivalent elevation has been filled in. To return the instrument to reading Station Pressure, simply change that elevation offset back to all zeros. 4.3 Set-up / Station Pressure Adj. Station Pressure Adjust menu. Adjusting the station pressure readout is equivalent to calibrating the Duo relative to another pressure determination at the same time and elevation that is believed to be more accurate. This is a completely different process from adjusting the instrument to read SLP, which is not related to the inherent accuracy of the pressure reading, but just an offset of the values shown. The station pressure adjustment changes the base readout of the instrument and should only be made if you have reason to believe the internal sensors of the instrument have drifted off of their initial calibration. All barometers will drift to some extent over time, and such an adjustment is normal procedure for all instruments, aneroid and electronic. What varies among instruments is how often they might need calibration and how much offset is needed.
27 27 This adjustment should not be made unless you have convincing evidence that it is needed. Appendix A6 discusses the question of calibration and how to tell if it is needed. In normal operation, the Duo pressure should not drift more than 1 mb per year, and there is no reason to believe they will drift that much. Please read Appendix A6 on Calibrations before changing the Station Pressure adjustment. In the Station Pressure Adjust screen, the pressure at the time you showed the menu is displayed to the maximum precision of the instrument. This pressure is not updated by the sensors during the time this menu is in view. Use the [±] and [SELECT] to change the To Read value of the pressure to match the known SLP at your present time location. The new pressure will be displayed as you enter the correction. Input errors are not critical. Just correct any typo until it shows properly. Once this shows the pressure you wish to have, highlight OK and press [SELECT]. The offset you enter here will be removed if you Reset to factory settings (Sec. 4.4), so if you have chosen to enter one, it could be useful to record it before resetting to factory settings. This setting is not affected by Reset pressure history. 4.4 Set-up / System Set-up / System Menu. Set-up / System / Time Set-up / System / Time Menu. Use this screen to set the Duo to a precise clock time using the time zone selected in the Set-up/Units, Time Zone screen (Sec. 4.1). Step through the options using the [±] and [SELECT], then step to OK and press [SELECT]. The time display (12h or 24h) is selected in the Set-up / Units, Time Zone screen (Sec 4.1). The default time
28 zone is 0, corresponding to UTC. The time zone can later be changed to best meet your needs. 28 Caution Pressing OK on this screen will adjust the clock to the time that is shown. If the clock time was correct to begin with, choose Cancel to leave without changing the clock time. In other words, if the clock was right, and you just viewed this screen to see what it looks like, and then chose OK, you would lose clock accuracy, because the time shown is not changing as you watch it. If the clock time is correct and you just want to change the time zone, then that can be done in the Set-up / Units, Time Zone screen without affecting the accuracy of the clock time. All pressures are stored in terms of UTC, so changing the time zone will not affect the pressure records; it will just change the hour associated with each pressure that is displayed. However, the UTC used is based on the clock time and date that you set into the system with this option. If you change the time or date after collecting data for some period of time, the data history will start from the new time entered, which would cause the time information of earlier data to be inconsistent. On new set-ups, it would be best to reset the pressure history when resetting the time by any significant amount. This does not apply to changing time zones only. One procedure that might help achieve best accuracy when setting a new time is to set the time on this screen ahead 20 seconds or so, highlight the OK region, and then when the reference time reads 1 second before your set time, press [SELECT]. The Duo clock should maintain high accuracy over a long period of time and serve as a valuable time reference for other applications. Set-up / System / Reset There are two Reset options. Toggle between them with the [±] buttons. Two reset options. Reset Pressure History This removes all records of pressure history including the Log of synoptic pressures and those manually entered into that list and all tendency data. When you make this selection, you are presented with the option to confirm this choice or cancel. Reseting the pressure history will not change any of your set-up choices and will not
29 29 change the SLP Elevation Offset nor any Station Pressure Offset that might have been entered. Pressure change arrows will then not be active until 1 hour after this selection; pressure tendency will be available after 3 hours. Reset to Factory Settings This Reset option returns the Duo to all of the settings and configuration it had when it was shipped from the factory. All pressure history will be erased, along with all Set-up choices that might have been entered. The time zone is set back to 0, but the time and date running in the clock are not changed. Caution If you have entered in a Station Pressure offset it too will be erased with this choice. You can check this first (Sec. 4.3) and make note of this status. The only thing that is not changed in a Factory reset is the time and date presently stored in the device. A warning screen with a reminder of the above with the option to cancel is presented if this choice is selected. 5. OPERATIONS 5.1 Displays Following Power Interruption The Duo clock has its own long term battery so timekeeping is not interrupted when power is removed from the unit. Without power pressures are not being recorded but the clock is still running. Thus the several data files of pressure records need to be updated when power is applied. This takes just seconds, and will be indicated by a progress bar on the screen. The longer the power-out period, the more data files that will update. The files stored are listed in Table 1.3. There are 750 records in each file. Progress bar shown during file refresh after a time without power. The pressures stored and displayed in a graph after a power off period depend upon the period of time the power was off. If the power is off for less than 15 minutes, the pressure is recorded as constant, equal to its value at the time of power off. If the power if off for more than 15 minutes, the pressure is recorded and displayed as zero, meaning no data. Thus short interruptions of power will not notably disrupt the graphs, but longer periods will show a gap.
30 A graphic plot of pressures over a time range that includes a period without power more than 15 minutes will record the pressure as zero with a corresponding gap in the plot and tabular history of pressures, as shown below. 30 Duo displays after the power was off from 0900 to 1130 on 7/13. Tendency data shown in the far right requires 3 hours of data, so values shown will not be accurate until 3 hours of continuous operation. Note too that the elevation must remain constant during the 3-hr period for the tendency to be correct. Power interruptions of less than15 minutes show graph and tables at a constant pressure. The graph will be flat during that short period of time. 5.2 Connecting to the Duo from a Computer When your Duo is connected to a computer by a USB cable you can access it via a command line interface. This provides a way to manipulate the instrument and extract information from it. You can, for example: Display and download stored pressure data, all or in part. Reset the stored data or reset to factory defaults. Create and access Logged entries. Display information on the state of the Duo. Read and set various parameters (units, time, timezone, etc.). Display the event log. Preparing your Computer to Read the Mintaka Duo For latest information see When you connect the Duo to a computer via a USB cable a serial port is created on the computer. You must, however, install drivers on your computer so the Duo is properly recognized. The drivers and instruction on how to install them are available on this web page: Once the drivers are installed, a virtual com port will be created automatically when the Duo is plugged in. On Windows computers this port will be in the form of a COMn port, such as COM1, COM7, etc. On Mac computers this port will be in the form of a file in the file system such as: /dev/tty.usbserial-xxxxxxxx. The xxxxxxxx will be the serial number associated with

31 your Duo. 31 Once you have the drivers installed and your Duo plugged in you need a terminal application that you can use to type commands and receive responses. There are many free terminal applications available on the Internet; the examples below use the CoolTerm application available from: CoolTerm runs on Windows, Mac, and Linux computers. Setting Up the Terminal Application The following examples are for the Mac version of CoolTerm. The Windows version, and indeed other terminal applications are all similar. Using the Options menu you need to set up a few parameters. These include the port and the parameters for the port. Sample set up screen for a terminal application In the above example the port is shown as usbserial-da00ffqe. You need to also set the following: (1) Baud rate to (the default for the Duo),
32 (2) Data bits to 8, (3) Stop bits to 1 When you have accomplished this you can select the OK button and then press the Connect menu item. Now type the character i (for information) and a return. The Duo will respond with a screen of data about the barometer. Below is an example of the information command. 32 Duo DA00FFPY Command i Mintaka Duo Recording Barometer V 1.1 Rev I build 4037 serial number DA00FFPY, 2/15/15 15:04:48 UTC-5 Started 2/15/15 13:17:26 UTC-5, running for 1:47:22, total runtime 1:47:22, samples collected 196 Sample files Id Collection Interval Size Samples Last Entry UTC-5 0 0:00: /15/15 15:04:45 1 0:01: /15/15 15:04:30 2 0:03: /15/15 15:03:00 3 0:06: /15/15 15:00:00 4 0:12: /15/15 15:00:00 5 0:24: /15/15 15:00:00 6 0:48: /15/15 15:00:00 7 2:00: /15/15 15:00:00 8 6:00: :00: d 0:00: Used 2% of file storage Barometer State, Initialized hourunits 24, timezone UTC-5, pressureunits mb elevationunits Feet, barometercorrectiontype Elevation show running avg 0, elevation 0 (0.0), station pressure offset 0.00 verbose No, samples per second 1.0, contrast 75, supply voltage 4.94 Led Off running average 12 baudrate AutoSampling is not active Sensor Manager Calibrated pressure no elevation correction filter Averaging Sensor 0 temp 82.8 filtered pressure raw Sensor 1 temp 82.6 filtered pressure raw Sensor difference temp 0.2 pressure Recorded pressures are stored in a number of files (see also Table 1.3). As shown above, each file can hold a maximum of 750 entires. Each file contains entries at a different collection time interval. As indicated, file 0 contains pressure data samples at 15-sec intervals, whereas file 6 stores pressure data at 48-min intervals. File 8 at 6-hr intervals contains pressure data for midnight (00:00), 06:00, 12:00, 18:00 UTC, and so on. Most of the other information is self-explanatory. The end of the report presents information on the two independent pressure sensors. There are several commands explained below that allow you to access informa-
33 33 tion in the various files, manipulate time, and other information under the Barometer State heading in the Info (i) report. Individual Commands for Specific Information Command Syntax: Data enclosed in square brackets [... ] are optional. Data separated by vertical bars indicates the possible options that can be chosen. A word enclosed in angle brackets <xx> is a place holder for a value. The value is required unless included within square brackets [ ]. AS - auto sample Command format: AS <frequency in seconds> [{MDA XDR TURBOWIN }*] This command turns on an automated output via the USB connector in NMEA format sentences MDA and/or XDR to import pressure data into navigation software. Additionally a custom output format is available for the TurboWin program developed at KNMI, which is used by marine weather observers. The {}* notation means the options can appear in any combination. The default with no format specified gives MDA and XDR. Output data formats are: MDA: $WIMDA,<sea level pressure in inches of HG>,I,<sea level pressure in Bar>,B,,,,,,,,,,,,,,,,*<checksum> XDR: $WIXDR,P,<sea level pressure in Bar>,B,BARO,*<checksum> TURBOWIN: <station pressure in mb>,<sea level pressure in mb>,<3 hour pressure tendency>,<wmo tendency characteristic code>*<checksum> Sample commands and output: AS 4 $WIXDR,P, ,B,BARO,*5C $WIMDA,30.199,I, ,B,,,,,,,,,,,,,,,,*6D Repeated every 4 seconds. AS 10 MDA $WIMDA,30.199,I, ,B,,,,,,,,,,,,,,,,*6D Repeated every 10 seconds. AS 15 TURBOWIN (Before 3 hours of data collection.) , ,,*2C Repeated every 15 seconds. AS 30 TURBOWIN (After 3 hours of data collection.) , ,1.30,3*02 Repeated every 15 seconds , ,-0.80,8*29 (Sample showing negative tendency.) CF clear file contents Command format: cf <fileid> Clears the contents of the indicated file. The valid values for fileid (file id) can be seen by the i command. CL clear log entries Command format: cl
34 This command is used to clear any log entries. See Sec. 3 for a description of the log entries facility. See DL and LE commands for displaying and creating log entries. 34 D dump records Command format: d [ <fileid> [<count ] ] This command prints stored pressure information. The <fileid> is an integer identifying the file of data to print. Refer to the i command for file id s. If <fileid> is -1 (the default) then data from all files are printed. If <count> is included, the <count> most recent samples are printed for the specified file(s). If it is not included then all pressure samples are printed. The samples are printed from oldest to most recent. DEV dump event log Command format: dev This command prints out the event log. Significant events are logged, including when the Duo is started, when the time is set, any errors that may be encountered, when the barometer is reset to factory settings, among others. DL dump log entries Command format: dl This command prints out any logged entries interspersed with the pressure samples taken at the synoptic times (0:00, 6:00, 12:00, 18:00 UTC). See Sec. 3 for a description of the log entries facility. See the CL and LE commands for clearing and creating log entries. DM dump machine readable data Command format: dm <datatype> This command is used to print information from the Duo in the JSON format. This is a format that is easily parsed. This command is useful for programs that integrate with the Duo. Valid values for <datatype> are: h - print out the available datatypes available. el - print the event log in JSON format (see the DEV command). ma - print various machine attributes. fs - print out file status information. This is a machine readable version of the file information printed by the i command. Sample output of the dm ma command is: { Title : MintakaDuo, version : 1.0, CurrentTime : 7/15/14 10:29:19, Build : 3345, SerialNumber : DA00FFQG, Timezone : -7, Started : 7/15/14 16:49:16, RunningFor : 0:40:03 } DP dump pressure Command format: dp [mm/dd/yy hh:mm:ss] Print the pressure recorded at the specified date and time. If no date and time is provided the current pressure is printed. DPR dump raw pressure Command format: dpr
35 35 Prints the pressure and temperature directly from the pressure sensors. No correction of any kind is performed and no averaging of the readings are done. FL invoke the firmware loader Command format: fl Enters the firmware loader so a new version of firmware can be loaded into the Duo s flash memory. H print help Command format: h Prints out help information on available commands. I info Command format: I Prints information on the current state of the Duo including current date and time, how long the barometer has been running, the files stored, current units. LE log pressure entry Command format: le Add the current pressure into the logged pressure entries. See Sec. 3 for a description of the log entries facility. See the DL and CL commands for displaying and clearing log entries. RESET reset to factory defaults Command format: reset Reset the Duo to factory defaults, all recorded history is deleted. RESETH reset pressure history Command format: reseth Erase all recorded pressure samples. SA set/read the running average count Command format: sa [12 24] Print out (if no argument is provided) or set the number of entries used for calculating the running average displayed in the graphical displays. Either 12 or 24 hourly entries (on the hour) can be specified. The default is 12. SB set/read baud rate Command format: sb [ ] Set the baud rate used for serial communication via the USB port. The default is SC set/read LCD contrast Command format: sc [0-100] Set the contrast for the LCD display. If no arguments are provided the current contrast value is printed. SE set/read elevation offset Command format: se [ E P +/-xxxx.x ] Sets the elevation offset. As with the graphical user interface the elevation offset can be either set by a pressure value (if P is provided) or an elevation value (if E is
36 provided). If no arguments are provided the current offset is printed. The default is an elevation offset of 0. Example: se E 4500 sets the elevation offset to be 4500 feet. SN view serial number Command format: sn Print out the Duo s serial number. SO set/read the station pressure offset Command format: so [±xxxx.x] Sets the station pressure offset. If no arguments are provided the current station pressure offset is printed. The default is a station pressure offset of 0.0. SS set/read sensors Command format: ss [ ] Controls the Duo s two sensors. 0 disables a sensor and 1 enables it. If no arguments are provided then the current status is printed. The default is for both sensors to be enabled. Example: ss 0 1 turns off sensor 0 and turns on sensor 1 ST set/read time Command format: st [mm/dd/yy hh:mm:ss] Sets the current time (in the currently selected timezone). If no arguments are provided the current time is printed out. 36 SU set/read units Command format: su [{12 24} {mb hpa inhg mmhg inh2o cmh2o kpa} {feet inches}] Sets the units used by the Duo, with these arguments: Clock format. 12 or 24 for a 12h or 24h clock time (default is 24h) Pressure units. mb, hpa, inhg, mmhg, inh2o, cmh2o, kpa (default is mb) Elevation units. feet or meters (default is feet). If no arguments are provided, SU prints the current units in use. SZ set/read timezone Command format: sz [± (0-12)] Set the current timezone. Values from -12 to +12 are legal (default is 0 for UTC). If no arguments are provided the current timezone is printed. 5.3 Maintenance The Mintaka Duo barometer requires no regular maintenance. The case can be cleaned with a damp cloth and mild soap. Periodic calibration certification, if required, is available from Starpath Corporation, as well as other approved facilities. Calibration is discussed in section A6 of the Appendix.
37 Limited Warranty The Mintaka Duo is warranted to be free of defects in materials and construction for a period of 1 year from date of initial purchase. Liability is limited to repair or replacement of defective item. Product registration can be done at com/duo. 5.5 FCC and CE Compliance This product complies with pertinent FCC and European CE requirements. 5.6 Specifications Summary Dimensions: 3.8 x 3.6 x 1.3 ( 97 mm x 91 mm x 33 mm) Power: 9V to 30V DC (at 12.5V 60 ma light on; 37 ma light off) 5V via mini USB (106 ma light on; 65 ma light off) DC barrel connector: 5.5 mm OD; 2.1 mm ID; center pin positive Operating pressure range 500 to 1080 mb Operating elevation 18,000 ft (5,500 m) above sea level to 1,800 ft (550 m) below sea level. Accuracy <1 mb over full pressure range at -20C to +50C Long term drift <1.0 mb/year, at -20C to +50C 5.7 Support Options and References For latest news and tech support tips, see For local pressures see You can also send to helpdesk@ starpath.com or call A general reference on many topics of barometer usage is The Barometer Handbook An in-depth look at barometers and applications of barometric pressure, by
38 David Burch (Starpath Publications, 2008). 38 APPENDIX A1. Measuring elevation changes with the Mintaka Duo The high precision of the Duo sensors allow it to be used for accurate relative elevation measurements. Atmospheric pressure decreases with increasing elevation at a rate of about 0.44 mb per 12 ft. If you call 12 ft a floor height, you have the mnemonic Point four four per floor, which is valid up to about 1,500 ft. For example, if at one elevation the pressure read mb and then you moved to a higher location where the pressure read mb a pressure drop of 25.3 mb. So the elevation change was (25.3/0.44) x 12 ft = 690 ft. Relatively small elevation changes cause much larger pressure changes than typical weather patterns do. For this application you can run the Duo on a portable battery pack, so it can be moved from one location to another without power interruption. Alternatively, for some measurements you can simply unplug it at one elevation and move it to another elevation and plug it in again. You will not accumulate pressure data during the movement, but you still measure the pressure difference between the two locations, which is needed to determine the elevation change. For any relative elevation measurement, however, you must either assume the ambient atmospheric pressure over the region of your measurements has not changed, or you must correct the readings for it. Therefore to make a careful elevation measurement you will need an independent source of atmospheric pressure data over the region covered, or return to the reference or base location to check the pressure after measuring it at the test location. The Duo aids the elevation measurement if you do not have outside information on the ambient pressure, because it provides numerical values of the pressure tendency at all times. Thus if your base pressure was with a tendency of -0.6 and then at your test location 1 hour later the pressure was , the first step would be to correct the test pressure for the expected change of -0.6 mb/3h x 1h = -0.2 mb, so the test pressure should be corrected to Then figure the elevation change as ( ) mb x 12 ft/0.44mb = 256 ft. For more precise pressure readings, you can view the Set-up / Adjust Station Pressure page to read the present pressure precise to 0.01 mb, then Exit out of that page without changing any values. You can return to it several times in a row to see if the value is stable. For small elevation changes the extra precision could be helpful. For accurate SLP measurements, you need to know the instrument elevation above sea level. In some locations you can measure this directly with the Duo by taking it from the permanent location down to sea level (ie, you live near the coast!). In other cases, you find accurate ground elevation as explained in Appendix A5, and then add to this the elevation of the instrument above ground (called the removal). Using the methods described above, you can achieve an accurate measurement of the
39 39 removal for any building the instrument is in. A2. Sea Level Pressure vs. Altimeter Pressure There are several ways to define sea level pressure, which go beyond the even more complex concept of mean sea level itself. For now we assume the reference level is clear, but we look at the ways to describe the equivalent pressure at this level when observed at a higher elevation. The most common way is to base the pressure change with elevation on the International Standard Atmosphere (ISA). This offers a fixed relationship between pressure and elevation that applies to all locations and all atmospheres. The ISA elevation values can be obtained from a formula or from tables, readily available online. This is the method that is used by essentially all electronic barometers that offer a correction to SLP based on the instrument elevation, and it is also the one used by the Mintaka Duo. It is also the same procedure used in US airports to report altimeter settings to aircraft, which use the measured pressure to determine altitude so all aircraft are using the same reference. It is sometimes abbreviated as QNH, and in aviation applications, this value of sea level pressure is called the altimeter pressure or just altimeter. This same abbreviation system (called Q-codes, which originated in early radio and telegraph applications) uses the letters QFE to label station pressure. Thus the pressure reported by the Duo (and almost all electronic barometers) as SLP is the same as the altimeter reading one might see in aviation weather reports. It is also the same pressure that is usually referred to in print and broadcasts as the sea level pressure. Meteorologists, however, have long known that other factors besides elevation affect the choice for the best local equivalent atmospheric pressure at sea level when measured at a higher elevation on land. The abbreviation for this best estimate of the sea level pressure is QFF. The main factor that can cause a difference between QFF and QNH (ie between best SLP and altimeter SLP) is the average temperature of the outside air over the past 12 hours. Humidity has a very small effect, but there can also be small unique local geographic factors (called Plateau Correction) that vary from place to place. In short, there is no simple formula to convert station pressure (QFE) measured at elevation to its best equivalent sea level pressure (QFF). In practice, we apply the ISA elevation correction to QFE (station pressure) to get QNH (altimeter), which is usually a very good approximation to QFF (sea level pressure reported by NWS.) For elevations below 1,000 ft or so and for seasonal temperatures, the differences are small, but notable. Table A1 shows approximate air temperature corrections that can improve this conversion at various elevations and temperatures. Terminology Review QFE. Q code for Station pressure. The atmospheric pressure read from a barometer at its present elevation. When an aircraft altimeter is set to QFE (station pressure at the airport) it will read the height of the aircraft above ground when off the

40 40 ground, and it will read zero when on the air strip. QNH. Q code for Sea Level pressure figured at a particular location using only the elevation of the place to make the conversion using the International Standard Atmosphere. Also called Altimeter. When an aircraft altimeter is set to QNH it will read the altitude of the aircraft above mean sea level when off the ground, and it will read the elevation of the airport when on the air strip. QFF. Q code for sea level pressure taking into account all properties of the actual atmosphere present at the time, plus special correction factors (Plateau Correction) unique to some high locations. A3. Pressure Tendency Characteristic Codes Pressure Tendency Characteristic Codes (Sec. 2.3) are defined and discussed in the National Weather Service Observing Handbook No. 1, which is available online at the NWS Voluntary Observing Ship website ( These important data are assimilated into numerical weather prediction models and they are also used for pressure data quality control analysis. The symbols used for each code appear on surface analysis maps as shown below. The national version of this map is available wpc.ncep.noaa.gov/sfc/usdwmsfcbw.pdf. More detailed versions are available at the Weather Prediction Center and the Ocean Prediction Center. Three station reports showing pressure, tendency, and characteristic. The top right report is for mb, a net drop of 1.2 mb/3h (the tendency), with a characteristic code 6, which could be decreasing then steady or decreasing then decreasing more slowly. The significance is it has been going down, and it has not started up again. The codes are listed in Sec The report on the left is for mb, a net drop of 1.7 mb/3h and code 8, noting that regardless of what it did earlier, it is now going down, but since this is not a 6, it means there is no indication the descent has slowed. The bottom report is for mb, with a net drop of just 0.8 mb, with code 3, meaning it was decreasing and now it is increasing. The values of these codes often add a dynamic quality to an otherwise static snapshot of the weather pattern. The Mintaka Duo uses the computer algorithm recommended by the WMO to mathematically compute this code. It is updated every 15 seconds, because the precise value of the current pressure relative to that 3 hours ago affects the proper code
41 41 choice. A4. Where to Find Accurate Sea Level Pressure Unified Analysis weather maps from the Weather Prediction Center ( ncep.noaa.gov ) show isobars of accurate pressure updated every 3 hours. The isobar spacing is 4 mb, so reasonably good pressures can be obtained by interpolation. These maps also show station model reports for more specific values at selected locations. Near a lighthouse, airport or participating weather buoy, you can get hourly data from the National Data Buoy Center (NDBC, When making a SLP setting on the Duo it is best to use SLP values for times close to the time you are setting it. Broadcast or published values are usually for the most recent whole hour, but they could be 20 or 30 minutes late in updating. For example at 9:15 the most recent pressure could be for 8:00. Many stations online, such as those at the NDBC and other NWS outlets also report the pressure tendency, so a time correction could be applied. For example: Suppose it is 0900 when you want to set the barometer, and the nearest source of accurate SLP you have is mb valid at 0800 with a pressure tendency of 2.1 mb. First recall that pressure tendency is always the net change over the past 3 hours, so the tendency reported means 2.1mb/3h, or the pressure is dropping at a rate of 0.7 mb/hr. So at 0900 you would set the instrument to mb = An especially convenient and accurate source of local sea level pressure worldwide is available at starpath.com/barometers. This free service displays the 10 closest stations to your Lat-Lon that offer accurate pressure online, as well as providing a way to interpolate the data for time and location as well as a method to evaluate the consistency of the selected stations. It also provides a way to correct your station pressure for the outside air temperature. A5. How to Find Accurate Elevation On Land Google Earth or equivalent online world mapping programs offer an accurate and precise way to find a local elevation. Zoom in and read the elevation at the cursor. The service at starpath.com/barometers also accesses this same elevation data set to provide accurate ground level elevations for specific locations given as Lat-Lon. Remember all such tabulated elevation data are the ground level. The distance from ground to instrument height is called the removal, and that is crucial for an accurate SLP, and sometimes difficult to determine within a complex building. The removal, however, can be measured accurately with the Duo, as outlined in Appendix A1. On Water If you are installing the barometer on a vessel at sea and wish to read SLP as
42 accurately as possible, then you can assume that mean sea level is indeed the level of the water and the removal is the distance from water level to the barometer, which is the only correction needed. On larger vessels this could be over 100 ft and on smaller ones just 5 or 6 ft. If your vessel is in tidal waters, mean sea level will not likely coincide with the water level. Mean sea level is very nearly equal to the mean tide level, which is halfway between mean low water (MLW) and mean high water (MHW). The correction in this case would be the same removal (barometer to waterline) plus a MSL correction given by: 42 MSL correction = (Tide - MHW) + (MWH - MLW)/2. Examples: Removal = 5 ft, MLW=2 ft, MHW=10 ft. Then if tide = 13 ft, then MSL correction is (13-10) + (10-2)/2 = 7. Mean seal level is 7 ft below the surface, and full correction is (5 + 7) = 12 ft. If tide = 0, MSL correction = (0-10 ) + 4 = -6. Mean sea level is 6 ft above the surface, so the total correction is (5-6) = - 1ft. A6. Calibration Procedures The Duo should maintain its specified station pressure accuracy within the longterm drift specifications listed in Section 5.5. If your application requires a regular calibration certificate independent of those specifications, the instrument can be returned to Starpath in Seattle for NIST traceable re-certification. Contact starpath@ helpdesk.com or If you do not require a certified document, you can check and adjust the instrument yourself if there is any indication that it is needed. All barometers, both the highest quality aneroid mechanical devices or the best electronic devices will eventually drift to some extent in calibration. The WMO recommends that all barometers being used for official weather reports be checked and recalibrated as needed at least once a year. You can check your device with the several methods listed for obtaining accurate pressure readings in Section A4. These must in turn be corrected for elevation, as explained in Section A5. Then if you do detect that an offset to the station pressure is needed, the procedure for entering it is given in Section 4.3. It is recommended to make several comparisons at various pressures over some period of time before concluding an offset is needed. Even the official reference barometers cited in broadcasts can show some variation, and any uncertainty in instrument elevation causes a pressure of shift of 0.44 mb per 12 ft. Also extremes in outside air temperature can influence the comparison of QNH (station pressure corrected for elevation) with QFF (sea level pressure as reported by the weather service), discussed in Appendix A2. For the most accurate comparison, the observed station pressure should be cor-
43 43 rected for the outdoor air temperature. The data in Table A1 can be used to approximate this correction. For example, if your Duo barometer is located at an elevation of 200 m (656 ft) and the station pressure reads mb without any SLP corrections entered, and then you set it to read SLP by entering the 200 m elevation, the Duo will display a SLP of mb. This correction of mb accounts for the elevation of the instrument. (It is the same correction that any instrument that offers such an automatic correction would display, unless it is simultaneously recording and averaging the outside air temperature.) This will usually be a good approximation to the SLP, but it remains an approximation until the average outside air temperature is taken into account. As noted earlier, this form of SLP is called QNH. We can correct this QNH for air temperature using the values in Table A1. In this example of 200 m elevation if the average outside air temperature had been 30º C (86º F), then we should reduce the correction made by -1.3 mb. In other words the displayed SLP of mb should be corrected to read mb. This is then the pressure we would use to compare with official reports and weather maps. For best results, use the average of the air temperature at the time of observation and the value from 12 hours earlier, T = (T0 + T-12h)/2 In Table A1, the column headed T± is the air temperature where this correction changes from + to -. It is an indication of the air temperature that is used in the ISA for figuring QNH. The values in Table A1 are approximate corrections. There are other smaller factors that contribute to the QNH to QFF conversion. These corrections become increasingly more uncertain with increasing elevation above 1000 ft (300 m). The Table A1 corrections, however, will always improve your value of SLP for comparison with official reports. The temperature corrections should be applied to any barometer calibration that is done by comparing your observed station pressure with official reports of SLP. The
44 44 Table A1. Air Temperature Corrections to SLP -40 F -22 F -4 F 14 F 23 F 32 F Meters Feet -40 C -30 C -20 C -10 C -5 C 0 C
45 45 Table A1. Continued 41 F 50 F 59 F 68 F 86 F 104 F T± 5 C 10 C 15 C 20 C 30 C 40 C ºC ºF
46 free online barometer calibration service at starpath.com/barometers offers a way to take into account the air temperature factor. 46 Ship s Barometer Corrections Table A2 includes the barometer corrections needed to convert a station pressure reading at elevation to the equivalent sea level pressure, taking into account instrument elevation and outside air temperature. The data cover typical values found on ships at sea. Thus if the elevation is 110 ft and the outside air temperature is 86º F, the correction to get from station pressure to sea level pressure would be mb. In this case, of this 3.8 mb only 0.2 mb is due to the air temperature, which caused a lower than normal correction. However, if the air temperature had been a chilly -4º F, the correction at 110 ft would be 4.6 mb, of which 0.6 mb was due to the air temperature, and this caused a higher than normal correction.
47 47 Table A2. Barometer Corrections for Elevation and Temperature -4 F 14 F 32 F 50 F 68 F 86 F FT -20 C -10 C 0 C 10 C 20 C 30 C M
48 A7. Menu Map 48 MENU 1 Page 10 MENU 2 Page 16
49 49 MENU 3 Page 21 MENU 4 Page 24 Time Reset About
50 50 Notes
51 51 Notes


52 Mounting and transport options Duo mounted on a common desktop display easel. Duo connected to a power pack in a waterproof box. The pressure release allows the unit to work properly when sealed. Mintaka Instruments, LLC, 3050 NW 63rd St, Seattle, WA , helpdesk@starpath.com
O P E R A T I N G M A N U A L
 OPERATING MANUAL WeatherJack OPERATING MANUAL 1-800-645-1061 The baud rate is 2400 ( 8 bits, 1 stop bit, no parity. Flow control = none) To make sure the unit is on line, send an X. the machine will respond
We note that Philly Wings is the farthest off, but the others should give a good east-west and north-south measure of the pressure surface slope.
 After entering a randomly selected east coast location of lat = 39 49.00 N, 75 26.00 W we get the following screen after pressing Show Stations. It shows the 10 closest stations with online pressure data
NOVALYNX CORPORATION MODEL 110-WS-16BP BAROMETRIC PRESSURE SENSOR INSTRUCTION MANUAL
 NOVALYNX CORPORATION MODEL 110-WS-16BP BAROMETRIC PRESSURE SENSOR INSTRUCTION MANUAL REVISION DATE: OCT 2005 Receiving and Unpacking Carefully unpack all components and compare to the packing list. Notify
WeatherHawk Weather Station Protocol
 WeatherHawk Weather Station Protocol Purpose To log atmosphere data using a WeatherHawk TM weather station Overview A weather station is setup to measure and record atmospheric measurements at 15 minute
WS-9018U Wireless Weather Station. Instruction Manual
 WS-9018U Wireless Weather Station Instruction Manual Contents Page 1. Functions of the Weather Station....3 2. Safety notes...3 3. Product features....4 4. Getting started....4 5. Quick Set Up...5 6. Setting
Quick Start Guide New Mountain Visit our Website to Register Your Copy (weatherview32.com)
") Quick Start Guide New Mountain Visit our Website to Register Your Copy (weatherview32.com) Page 1 For the best results follow all of the instructions on the following pages to quickly access real-time
Quick Start Guide New Mountain Visit our Website to Register Your Copy (weatherview32.com) Page 1 For the best results follow all of the instructions on the following pages to quickly access real-time
Mini Environmental Quality Meter
 Mini Environmental Quality Meter 850027 Mini Environmental Quality Meter 850027 Copyright 2012 by Sper Scientific ALL RIGHTS RESERVED Printed in the USA The contents of this manual may not be reproduced
WeatherHub2 Quick Start Guide
 WeatherHub2 Quick Start Guide Table of Contents 1 Introduction... 1 2 Packing List... 1 3 Connections... 1 4 IP Addressing... 2 5 Browser Access... 3 6 System Info... 3 7 Weather Station Settings... 4
Assembly and Operation Manual. April 2016
 Assembly and Operation Manual April 2016 Table of Contents What is in the OurWeather Box? 3 Step by Step Assembly 13 Building the Weather Sensors 18 Testing the OurWeather Weather Station 28 Power Up OurWeather
2 ACCESSING VARIOUS MODES
 EN ONgo up 600 1 INTUITIVE GUIDE EN Press and hold for the settings menu Press once for the backlight D A Press once to access various modes C B How to read the diagrams Press C to go from screen 1 to
Ocean Optics Red Tide UV-VIS Spectrometer (Order Code: SPRT-UV-VIS)
") Ocean Optics Red Tide UV-VIS Spectrometer (Order Code: SPRT-UV-VIS) The UV-VIS spectrometer is a portable ultraviolet light and visible light spectrophotometer, combining a spectrometer and a light source/cuvette
Ocean Optics Red Tide UV-VIS Spectrometer (Order Code: SPRT-UV-VIS) The UV-VIS spectrometer is a portable ultraviolet light and visible light spectrophotometer, combining a spectrometer and a light source/cuvette
Minute Impulse Clock Controller I01DN
 99b-mi USER S MANUAL Minute Impulse Clock Controller Mon Jun 01, 2009 12:00:00 PM DST HOLD ENTER KEY TO BEGIN CANCEL HR I01DN 97 West Street Medfield, MA 02052 U.S.A. (508) 359-4396 Pg. 2 of 20 TABLE OF
ea980r Digital Anemometer User Manual
 ea980r Digital Anemometer User Manual 1. Overview Thank you for purchasing the ennologic ea980r anemometer, a high quality instrument which measures 8 parameters: Wind Speed (mph, m/s, ft/min, knots, km/h)
PDF / LA CROSSE TECHNOLOGY WEATHER STATION RESET EBOOK
 06 March, 2018 PDF / LA CROSSE TECHNOLOGY WEATHER STATION RESET EBOOK Document Filetype: PDF 218.89 KB 0 PDF / LA CROSSE TECHNOLOGY WEATHER STATION RESET EBOOK Click here for factory reset. Animated weather
ISSP User Guide CY3207ISSP. Revision C
 CY3207ISSP ISSP User Guide Revision C Cypress Semiconductor 198 Champion Court San Jose, CA 95134-1709 Phone (USA): 800.858.1810 Phone (Intnl): 408.943.2600 http://www.cypress.com Copyrights Copyrights
WT-3131A Radio-controlled Analog Clock With Weather Forecast. Instruction Manual
 WT-3131A Radio-controlled Analog Clock With Weather Forecast Instruction Manual TABLE OF CONTENTS Topic Page Inventory of Contents/Additional Equipment 2 About WWVB 2 Detailed Set-Up Guide Battery Installation
Hadrons Desktop U.S. Atomic Clock & Weather Station
 Hadrons Desktop U.S. Atomic Clock & Weather Station SN004 Instructions Read and save these instructions. Dear Sharper Image Customer, Thank you for your purchase of a Sharper Image product. We appreciate
Heat stress index. Dewpoint. pressure. altitude
 Kestrel 4200 Measures Volume air flow in cfm, L/s, m³/s, m³/m, m³/h Air velocity (current, average, and maximum) Heat stress index Windchill Relative humidity Dewpoint in F or C Humidity ratio Barometric
FIELD SPECTROMETER QUICK-START GUIDE FOR FIELD DATA COLLECTION (LAST UPDATED 23MAR2011)
") FIELD SPECTROMETER QUICK-START GUIDE FOR FIELD DATA COLLECTION (LAST UPDATED 23MAR2011) The ASD Inc FieldSpec Max spectrometer is a precision instrument designed for obtaining high spectral resolution
FIELD SPECTROMETER QUICK-START GUIDE FOR FIELD DATA COLLECTION (LAST UPDATED 23MAR2011) The ASD Inc FieldSpec Max spectrometer is a precision instrument designed for obtaining high spectral resolution
U.S. Atomic Clock & Weather Station. Instruction Manual
 U.S. Atomic Clock & Weather Station Instruction Manual Table of Contents What is Atomic Radio Control?... 2 Parts Diagram... 3 Batteries... 4 Setting the Atomic Time and Date... 4 Setting the Clock...
Fischer Instruments Chrome and Black Wood Base Weather Station with Barometer, Hygrometer, Thermometer and Quartz Clock User Manual
 Fischer Instruments 1535-06 Chrome and Black Wood Base Weather Station with Barometer, Hygrometer, Thermometer and Quartz Clock User Manual Table of Contents 1. Introduction... 2 2. Care and Cleaning...
WindNinja Tutorial 3: Point Initialization
 WindNinja Tutorial 3: Point Initialization 6/27/2018 Introduction Welcome to WindNinja Tutorial 3: Point Initialization. This tutorial will step you through the process of downloading weather station data
Operating Instructions for Digital Manometer. Model: MAN-SD
 Operating Instructions for Digital Manometer Model: MAN-SD 1. Contents 1. Contents...2 2. Note...3 3. Instrument Inspection...3 4. Regulation Use...4 5. Operating Principle...4 6. Mechanical Connection...5
06MAR THU 12: User Manual
 06MAR THU 12:38.28 88.2% 28.0C User Manual 1.0 General Guide Thank you for purchasing your new ADC. We recommend reading this manual, and practicing the operations before using your ADC in the field. The
WEATHERPAK MTR Training Guide
 WEATHERPAK MTR Coastal Environmental Systems, Inc. 820 First Avenue South Seattle, WA 98134 206.682.6048 800.488.8291 206.682.5658 Fax www.coastalenvironmental.com 11-15-2012 WEATHERPAK is the #1 Choice
A clock designed in close consultation with people living with Dementia.
 1. Product Name Day Clock 2. Product Code 55787 3. Colour As shown 4. Brief Description A clock designed in close consultation with people living with Dementia. 5. Contents 1 x Day Clock 6. Snoezelen Stimulations
Vantage PRO2 Quick. Reference Guide
 Vantage PRO2 Quick Reference Guide INTRO This Quick Reference Guide will provide you with abbreviated instructions for all functions of the Vantage Pro2 console. For more detailed instructions, see Vantage
Model: WT-3181PL Instruction Manual DC: Indoor/Outdoor Atomic Wall Clock. Get Started
 Model: WT-3181PL Instruction Manual DC: 041614 18 Indoor/Outdoor Atomic Wall Clock Round Battery Cover Get Started Step 1: Remove the round battery cover from the back of the clock. Step 2: Insert 1 fresh
Quick Reference Guide
 Vantage PRO Davis Instruments 3465 Diablo Ave, Hayward, CA 94545 U.S.A. Phone (510) 732 9229 Fax (510) 732 9188 www.davisnet.com E-mail: sales@davisnet.com support@davisnet.com Quick Reference Guide Part
ph Probe ReallyEasyData com
 ph Probe 9200001 Uses Whether you re monitoring ph for chemistry, physical science, life science, or earth science activity, this ph meter offers accurate readings in a convenient format. Use the RED ph
XR Analog Clock - Manual Setting Model Troubleshooting Guide
 Primex XR 72MHz Synchronized Time Solution XR Analog Clock - Manual Setting Model Troubleshooting Guide 2018 Primex. All Rights Reserved. The Primex logo is a registered trademark of Primex. All other
Centralized Forecasting Registration and Communication Requirements for Distribution Connected Variable Generators. IESO Training
 Centralized Forecasting Registration and Communication Requirements for Distribution Connected Variable Generators IESO Training May 2017 Centralized Forecasting - Registration and Communication Requirements
Creating Empirical Calibrations
 030.0023.01.0 Spreadsheet Manual Save Date: December 1, 2010 Table of Contents 1. Overview... 3 2. Enable S1 Calibration Macro... 4 3. Getting Ready... 4 4. Measuring the New Sample... 5 5. Adding New
Determination of the Rydberg constant, Moseley s law, and screening constant (Item No.: P )
") Determination of the Rydberg constant, Moseley s law, and screening constant (Item No.: P2541001) Curricular Relevance Area of Expertise: ILIAS Education Level: Physik Topic: Hochschule Subtopic: Moderne
Determination of the Rydberg constant, Moseley s law, and screening constant (Item No.: P2541001) Curricular Relevance Area of Expertise: ILIAS Education Level: Physik Topic: Hochschule Subtopic: Moderne
Fischer Banjo Weather Station with Thermometer, Hygrometer, Barometer User Manual
 Fischer 4673-22 Banjo Weather Station with Thermometer, Hygrometer, Barometer User Manual Table of Contents 1. Introduction... 2 2. Care and Cleaning... 2 3. Barometer Operation... 2 3.1 How the aneroid
For Military, Research, Tactical Portable Vehicle Mount Fixed Base
 For Military, Research, Military & Commercial Weather Applications Stations Tactical Portable Vehicle Mount Fixed Base WEATHERPAK Marine Weather Stations for Harsh Environments WEATHERPAK marine weather
Paramaters. Resolution 0.2 m (for measurements < 25 meas. / sec )
") Paramaters Method of altitude measurement: Measuring Range measurement of pressure changes 0-5500 m Resolution 0.2 m (for measurements < 25 meas. / sec ) Accuracy: Supply Voltage: Current consumption:
Paramaters Method of altitude measurement: Measuring Range measurement of pressure changes 0-5500 m Resolution 0.2 m (for measurements < 25 meas. / sec ) Accuracy: Supply Voltage: Current consumption:
WS-7047TWC Wireless 433 MHz Weather Station With Rainfall and Temperature. Instruction Manual
 WS-7047TWC Wireless 433 MHz Weather Station With Rainfall and Temperature Instruction Manual TABLE OF CONTENTS Topic Page Inventory of Contents 2 Additional Equipment 2 Quick Setup 3 Detailed Setup Guide
Ambient Weather WS-152B 6" Contemporary Barometer User Manual
 Ambient Weather WS-152B 6" Contemporary Barometer User Manual Table of Contents 2. Introduction... 2 3. Preparation... 2 4. Care and Cleaning... 2 5. Barometer Operation... 2 4.1 How the aneroid barometer
Congratulations on purchasing this WS1516IT Professional Weather Station.
 FAQ WS1516IT Congratulations on purchasing this WS1516IT Professional Weather Station. For your Weather Station to work properly, it must be started correctly, using good quality alkaline batteries, and
PTA-427 BAROMETRIC PRESSURE TRANSDUCER OPERATOR S MANUAL
 PTA-427 BAROMETRIC PRESSURE TRANSDUCER OPERATOR S MANUAL REVISION: 4/95 COPYRIGHT 1991, 1995 CAMPBELL SCIENTIFIC, INC. WARRANTY AND ASSISTANCE The PTA-427 Barometric Pressure Transducer is warranted by
Fischer Instruments Stainless Steel Barometer User Manual
 Fischer Instruments 15-01 Stainless Steel Barometer User Manual Table of Contents 1. Introduction... 2 2. Care and Cleaning... 2 3. Barometer Operation... 2 3.1 How the aneroid barometer works... 2 3.2
Acceleration/Velocity/Displacement VIBRATION METER
 Acceleration/Velocity/Displacement VIBRATION METER Model : VB-8220 Your purchase of this VIBRATION METER marks a step forward for you into the field of precision measurement. Although this METER is a complex
Fischer 1508BTH-45 5" Brass Barometer with Temperature & Humidity User Manual
 Fischer 1508BTH-45 5" Brass Barometer with Temperature & Humidity User Manual Table of Contents 1. Introduction... 2 2. Care and Cleaning... 2 3. Barometer Operation... 2 3.1 How the aneroid barometer
OASIS WIRELESS WEATHER STATION
 User Manual 3910-B Royal Avenue, Simi Valley, Ca 93063 805-527-4498 RMIS Part No. 500760 TABLE OF CONTENTS INTRODUCTION General Description 3 General Precautions 3 INSTALLATION Base Preparation 6 Tower
Appendix 4 Weather. Weather Providers
 Appendix 4 Weather Using weather data in your automation solution can have many benefits. Without weather data, your home automation happens regardless of environmental conditions. Some things you can
[EPUB] OREGON SCIENTIFIC WEATHER STATION REVIEWS EBOOK
![[EPUB] OREGON SCIENTIFIC WEATHER STATION REVIEWS EBOOK](/thumbs/82/85554903.jpg "[EPUB] OREGON SCIENTIFIC WEATHER STATION REVIEWS EBOOK") 15 June, 2018 [EPUB] OREGON SCIENTIFIC WEATHER STATION REVIEWS EBOOK Document Filetype: PDF 533.74 KB 0 [EPUB] OREGON SCIENTIFIC WEATHER STATION REVIEWS EBOOK Portable Multipurpose Anemometer CTHM A613
15 June, 2018 [EPUB] OREGON SCIENTIFIC WEATHER STATION REVIEWS EBOOK Document Filetype: PDF 533.74 KB 0 [EPUB] OREGON SCIENTIFIC WEATHER STATION REVIEWS EBOOK Portable Multipurpose Anemometer CTHM A613
Ambient Weather DHR70B-BRASS Handheld Fishing Barometer User Manual
 Ambient Weather DHR70B-BRASS Handheld Fishing Barometer User Manual Table of Contents 1. Introduction... 2 2. Preparation... 2 3. Care and Cleaning... 2 4. Aneroid Barometer... 2 4.1 How the aneroid barometer
Acceleration, Velocity, Separate probe VIBRATION METER Model : VB-8202
 Acceleration, Velocity, Separate probe VIBRATION METER Model : VB-8202 Your purchase of this VIBRATION METER marks a step forward for you into the field of precision measurement. Although this METER is
WS-7038U Wireless 433 MHz Miniature Rain Monitor. Instruction Manual
 WS-7038U Wireless 433 MHz Miniature Rain Monitor Instruction Manual TABLE OF CONTENTS Topic Page Inventory of Contents/ Additional Equipment 3 Quick Set-Up Guide 3 Detailed Set-Up Guide Battery Installation
The Kestrel Handheld Weather Tracker. 1) If the unit is configured to log data and it is turned off, will it continue to log temperature data?
 If the unit is configured to log data and it is turned off, will it continue to log temperature data?") The Kestrel Handheld Weather Tracker 1) If the unit is configured to log data and it is turned off, will it continue to log temperature data? Wind data? 2) If you turn on the unit and it doesn t take you
The Kestrel Handheld Weather Tracker 1) If the unit is configured to log data and it is turned off, will it continue to log temperature data? Wind data? 2) If you turn on the unit and it doesn t take you
MAGMA NOTE! 21+ USER MANUAL
 21+ MAGMA USER MANUAL NOTE! Please do not put this product away or leave it for extended periods of time with low charge because if the battery falls below 2% then it will no longer accept a charge. Thank
Chemistry MultiMeasure Sensor PS-2170
 ä 5 Instruction Manual 012-09523A Chemistry MultiMeasure Sensor PS-2170 ph/ise/orp PRESSURE CHEMISTRY TEMPERATURE SENSOR VOLTAGE 1 2 3 4 PS-2170 5 6 7 cc 8 10 15 20 25 30 35 40 45 50 55 60 Included Equipment
User Guide. Affirmatively Furthering Fair Housing Data and Mapping Tool. U.S. Department of Housing and Urban Development
 User Guide Affirmatively Furthering Fair Housing Data and Mapping Tool U.S. Department of Housing and Urban Development December, 2015 1 Table of Contents 1. Getting Started... 5 1.1 Software Version...
SuperCELL Data Programmer and ACTiSys IR Programmer User s Guide
 SuperCELL Data Programmer and ACTiSys IR Programmer User s Guide This page is intentionally left blank. SuperCELL Data Programmer and ACTiSys IR Programmer User s Guide The ACTiSys IR Programmer and SuperCELL
WS-7211U Wireless 433 MHz Weather Station. Instruction Manual
 WS-7211U Wireless 433 MHz Weather Station Instruction Manual TABLE OF CONTENTS Topic Page Quick Setup 3-5 Inventory of Contents 6-7 Detailed Setup Guide Battery Installation 7 Setting the Time 8 Features
Latest generation testo air velocity & IAQ probes with cable handle. Instruction manual
 Latest generation testo air velocity & IAQ probes with cable handle Instruction manual Contents Contents 1 About this document... 5 2 Safety and disposal... 5 3 System description... 6 4 Description of
ph electrode Instruction Manual For use with the RAH-210 & RPH-250
 ph electrode Instruction Manual For use with the RAH-210 & RPH-250 The information in this manual was current at the time of printing. The most current versions of all Hydro Instruments manuals can be
PiCUS Calliper Version 3
 Technology PiCUS Calliper Version 3 Digital calliper for precise geometry detection argus electronic GmbH Erich-Schlesinger-Straße 49d 18059 Rostock Germany Tel.: +49 (0) 381/49 68 14 40 www.argus-electronic.de
SkyScan EWS-PRO - Manual -
 INTRODUCTION SkyScan EWS-PRO - Manual - EWS-Pro gives you advance weather warning technology you can use at home, indoors or out, and take wherever you go, for any kind of outdoor activity. Your EWS-Pro
M E R C E R W I N WA L K T H R O U G H
 H E A L T H W E A L T H C A R E E R WA L K T H R O U G H C L I E N T S O L U T I O N S T E A M T A B L E O F C O N T E N T 1. Login to the Tool 2 2. Published reports... 7 3. Select Results Criteria...
QUICK SET UP MANUAL WEATHER CENTER
 QUICK SET UP MANUAL WEATHER CENTER Using 915MHz wireless transmission of weather data, this unique weather station can be powered using batteries for all your weather needs in the home or office. This
MASSACHUSETTS INSTITUTE OF TECHNOLOGY Physics Department. Experiment 03: Work and Energy
 MASSACHUSETTS INSTITUTE OF TECHNOLOGY Physics Department Physics 8.01 Fall Term 2010 Experiment 03: Work and Energy Purpose of the Experiment: In this experiment you allow a cart to roll down an inclined
Skin Damage Visualizer TiVi60 User Manual
 Skin Damage Visualizer TiVi60 User Manual PIONEERS IN TISSUE VIABILITY IMAGING User Manual 3.2 Version 3.2 October 2013 Dear Valued Customer! TiVi60 Skin Damage Visualizer Welcome to the WheelsBridge Skin
Structure Monitoring Technology. Features. Ordering Information. Trigger Tape. A2 Pulse Counter (Optional) Solar Radiation Sensor
 Solar Radiation Sensor") Rain detection sensor General Description Driving rain and its effective management are critical factors in determining the durability of building enclosures. An accurate measurement of driving rain can
Rain detection sensor General Description Driving rain and its effective management are critical factors in determining the durability of building enclosures. An accurate measurement of driving rain can
CONTENTS. Batteries. La Crosse Technology, Ltd Page 1
 515-1316 FAQS The links below will work in most PDF viewers and link to the topic area by clicking the link. We recommend Adobe Reader version 10 or greater available at: http://get.adobe.com/reader CONTENTS
Suunto X6 watch. Suunto X6 watch. James. - Very old articles - Copyright (c) Outdoors-Magazine.com under a Creative Commons
 Outdoors-Magazine.com under a Creative Commons") Outdoors-Magazine.com http://outdoors-magazine.com Suunto X6 watch. James - Very old articles - Publication: Friday 8 November 2002 Update: 17 October 2002 Description : A test of the Suunto x6 wrist computer.
Outdoors-Magazine.com http://outdoors-magazine.com Suunto X6 watch. James - Very old articles - Publication: Friday 8 November 2002 Update: 17 October 2002 Description : A test of the Suunto x6 wrist computer.
Wireless Weather Station. Instruction Manual
 Wireless Weather Station Instruction Manual Congratulations on purchasing this state-of-the-art Weather Station as an example of fine design and quality piece of engineering. The operation of this product
Electric Fields and Equipotentials
 OBJECTIVE Electric Fields and Equipotentials To study and describe the two-dimensional electric field. To map the location of the equipotential surfaces around charged electrodes. To study the relationship
Speedtech Deerhunter s EDGE TM Model HE-1. Speedtech ECO EDGE TM Model EE-1. User s Manual
 Speedtech Deerhunter s EDGE TM Model HE-1 Speedtech ECO EDGE TM Model EE-1 User s Manual Speedtech Deerhunter s EDGE TM Model: HE-1 Speedtech ECO EDGE TM Model: EE-1 INTRODUCTION User s Manual Congratulations
PoleMaster User Manual (Northern Hemisphere)
") PoleMaster User Manual (Northern Hemisphere) 1. Hardware Installation 1.1 Attach the PoleMaster camera unit to the quick install plate using the three bolts supplied. In the case of the AZ EQ5-GT and Mesu
PoleMaster User Manual (Northern Hemisphere) 1. Hardware Installation 1.1 Attach the PoleMaster camera unit to the quick install plate using the three bolts supplied. In the case of the AZ EQ5-GT and Mesu
AlphaLab Gaussmeter Model VGM -- Instructions
 AlphaLab Gaussmeter Model VGM -- Instructions Power: As shipped, a standard 9 volt battery is installed. Battery life is about 10 hours (25 ma drain; 6.5 volt dropout). Low battery appears when about one
Assembly Instructions for the 1-Wire Weather Station V2.0/V3.0
 Assembly Instructions for the 1-Wire Weather Station V2.0/V3.0 Tools and Supplies Required (not included): Phillips screwdriver 3/8" wrench Drill with 5/32" bit "U" type mounting bracket (i.e., part number
User & Installation Manual
 User & Installation Manual For Blake-Larsen Sun Recorder SR-UIM-100 by Jul Larsen Consulting IVS, Denmark. No part of this work covered by the copyright heron may be reproduced or used in any form or by
Quantum Series Product Catalog
 Measuring and Managing Healthy Living Quantum Series Product Catalog RJL Sciences is an FDA registered company RJL Sciences, Inc. 33939 Harper Avenue Clinton Township, MI 48035 USA Voice: 1-800-528-4513
National Event Tree. **Combo Package** Eliminator 2000 Super & National Event Tree. Item # 3152 $849
 Eliminator 2000 Super Item # 5200 $229.00 L.E.D. BULBS Eliminator Super 2000 *Reaction Time Practice Unit* N.H.R.A. Cross Talk Feature NHRA / IHRA Auto Start!! Bum p Do wn Selectable.000 or.500/.400 Perfect
6.Ebz!boe!8.Ebz!!! Gpsfdbtufst!!! G U I D E n catio Lo
 GUIDE Location Contents Ambient Devices TM, the Ambient logo, Ambient Information Network TM and Ambient 5-Day and 7-Day Forecasters TM are trademarks or registered trademarks of Ambient Devices, Inc.
Pendulum Swing. Student Investigation Part 1. Introduction. Equipment. Collecting the data
 Student Investigation Part 7 8 9 0 TI-Nspire Investigation Student 50 min Introduction The periodic motion of a pendulum provides enjoyment for a child sitting on a swing, in a clock it provides a means
Operating instructions for electronics
 Operating instructions for electronics Initial startup (m, C, 24h) Menu choice The functions of the Traveller can be checked when the battery is inserted: 1. Segment check Do all segments light up? 2.
Training Guide. Coastal Environmental Systems, Inc.
 WEATHERPAK TRx2 Coastal Environmental Systems, Inc. 820 First Avenue South Seattle, WA 98134 206.682.6048 800.488.8291 206.682.5658 Fax www.coastalenvironmental.com 11-16-2012 WEATHERPAK is the #1 Choice
RainMachine Mini- 8 Quick- Start Guide
 RainMachine Mini- 8 Quick- Start Guide Table of Contents Inside the Box... 3 Wiring Diagram... 4 Hardware Installation... 5 Initial Setup... 6 How it works... 13 Operation... 8 Program Properties... 10
WS-7213U Wireless 433 MHz Weather Station Instruction Manual TABLE OF CONTENTS. Figure 2. Figure 1
 WS-7213U Wireless 433 MHz Weather Station Instruction Manual TABLE OF CONTENTS Topic Page Inventory of Contents 3 Additional Equipment 4 Quick Setup 5-8 Detailed Setup Guide Battery Installation 9-11 Setting
Manual Seatrack Web Brofjorden
 December 2011 Manual Seatrack Web Brofjorden A user-friendly system for forecasts and backtracking of drift and spreading of oil, chemicals and substances in water 1. Introduction and Background... 3 1.1
Digital Multi-Day Max/ Min/Current Air and Soil Temperatures Protocol
 Digital Multi-Day Max/ Min/Current Air and Soil Temperatures Protocol Purpose To record daily measurements of maximum, minimum, and current air and soil temperatures at a common site Overview One temperature
La Crosse Technology. Heavy Weather Pro. Software User s Guide. (for 2800 series weather stations with USB connectivity) Revision: 1.
 Revision: 1.") La Crosse Technology Heavy Weather Pro Software User s Guide (for 2800 series weather stations with USB connectivity) Revision: 1.3 CONTENTS Contents... 2 Overview... 6 Getting Started... 7 Licensing...
La Crosse Technology Heavy Weather Pro Software User s Guide (for 2800 series weather stations with USB connectivity) Revision: 1.3 CONTENTS Contents... 2 Overview... 6 Getting Started... 7 Licensing...
OPERATING MANUAL. EIB-Kombisensor AS 315 N
 EIB-Kombisensor AS 315 N OPERATING MANUAL EIB-Kombisensor AS 315 N 1 Contents Page 3 1. Description 4 1.1 Automated Operations 1.1.1 Sun System 1.1.2 Half-Light System 5 1.1.3 Wind System 1.1.4 Rain System
Using Microsoft Excel
 Using Microsoft Excel Objective: Students will gain familiarity with using Excel to record data, display data properly, use built-in formulae to do calculations, and plot and fit data with linear functions.
Kestrel 4500 Pocket Weather Tracker
 Kestrel 4500 Pocket Weather Tracker For years our customers have been asking for wind direction along with wind speed. New for 2007, the Kestrel 4500 does just that with its built in digital compass. But
Engineering Specification
 Drawing No: 23 338 00001 Page 2 of 5 1. Purpose: To specify performance requirements for Pressure Sensitive Altimeters for use in B.I.C. manufactured ground support test equipment. 2. Scope: This PRODUCT
AWOS. Automated Weather Observing Systems COASTAL
 AWOS Automated Weather Observing Systems COASTAL Environmental Systems Monitor Monitor Your Your World World Coastal s Experience & Expertise Since 1981, Coastal Environmental Systems, Inc. (Coastal) has
PHY 123 Lab 9 Simple Harmonic Motion
 PHY 123 Lab 9 Simple Harmonic Motion (updated 11/17/16) The purpose of this lab is to study simple harmonic motion of a system consisting of a mass attached to a spring. You will establish the relationship
CityGML XFM Application Template Documentation. Bentley Map V8i (SELECTseries 2)
") CityGML XFM Application Template Documentation Bentley Map V8i (SELECTseries 2) Table of Contents Introduction to CityGML 1 CityGML XFM Application Template 2 Requirements 2 Finding Documentation 2 To
CityGML XFM Application Template Documentation Bentley Map V8i (SELECTseries 2) Table of Contents Introduction to CityGML 1 CityGML XFM Application Template 2 Requirements 2 Finding Documentation 2 To
2: SIMPLE HARMONIC MOTION
 2: SIMPLE HARMONIC MOTION Motion of a mass hanging from a spring If you hang a mass from a spring, stretch it slightly, and let go, the mass will go up and down over and over again. That is, you will get
FOCUS 30/FOCUS 35 Field Calibration with Survey Pro Field Software
 GeoInstruments Application Note June 25th, 2015 FOCUS 30/FOCUS 35 Field Calibration with Survey Pro Field Software Summary: This support note outlines the procedure which should be followed to calibrate
SC125MS. Data Sheet and Instruction Manual. ! Warning! Salem Controls Inc. Stepper Motor Driver. Last Updated 12/14/2004
 SC125MS Stepper Motor Driver Salem Controls Inc. Last Updated 12/14/2004! Warning! Stepper motors and drivers use high current and voltages capable of causing severe injury. Do not operate this product
TECDIS and TELchart ECS Weather Overlay Guide
 1 of 24 TECDIS and TELchart ECS provides a very advanced weather overlay feature, using top quality commercial maritime weather forecast data available as a subscription service from Jeppesen Marine. The
CONTENTS. La Crosse Technology, Ltd. Page 1
 WS-9133BK-IT- WS-9133T-IT FAQS The links below will work in most PDF viewers and link to the topic area by clicking the link. We recommend Adobe Reader version 10 or greater available at: http://get.adobe.com/reader
The Vaisala AUTOSONDE AS41 OPERATIONAL EFFICIENCY AND RELIABILITY TO A TOTALLY NEW LEVEL.
 The Vaisala AUTOSONDE AS41 OPERATIONAL EFFICIENCY AND RELIABILITY TO A TOTALLY NEW LEVEL. Weather Data Benefit For Society The four most important things about weather prediction are quality, reliability,
You Might Also Like. I look forward helping you focus your instruction while saving tons of time. Kesler Science Station Lab Activities 40%+ Savings!
 Thanks Connect Thank you for downloading my product. I truly appreciate your support and look forward to hearing your feedback. You can connect with me and find many free activities and strategies over