Kyrenia Ship Collection: Conservation Progress Report December 2016
|
|
|
- Gwen Stevens
- 6 years ago
- Views:
Transcription


1 The Kyrenia Ship Conservation Project Kyrenia Ship Collection: Conservation Progress Report December 2016 Photographs courtesy of Veronica Ford and Cassy Cutulle, 2016 Cassy Cutulle MA, MSc University College London Chief Objects Conservator Kyrenia Ship Conservation Project Veronica Ford MA, MSc University College London Assistant Objects Conservator Kyrenia Ship Conservation Project 1
2 Contents General Introduction November 2016: Conservation Tasks in Progress Preventive Conservation Tasks Environmental Monitoring at Conservation Laboratory Environmental Monitoring at Kyrenia Castle Remedial Conservation Tasks Restoration Activities December 2016: Projected Work Plan and Current Standing 2
3 General Introduction Throughout December, conservators Cassy and Veronica have continued to restore the ceramic objects stored in the Conservation Laboratory in Nicosia. In particular, their efforts have focused on restoring those ceramics that are categorized as medium-level conservation jobs. Additionally, in preparation for the larger-scale restoration tasks ahead, the conservators have researched and ordered supplies that will allow for better molding and casting of plaster, particularly for larger areas of loss. On December 12 th, the data from the two Tiny Tag environmental loggers in the Ship Gallery was extracted and analyzed. This information is particularly important as it shows the fluctuations in relative humidity and temperature at seven minute intervals over the span of two months, providing a detailed view of the types of changes occurring in the Ship Gallery. Environmental monitoring at the Conservation Laboratory has taken place as usual, however, this month s temperature and relative humidity graphs will cover a shorter time period due to the conservators starting their holiday leave, which will begin on December 15 th. December 2016: Conservation Tasks in Progress Preventive Conservation Tasks In December, Cassy and Veronica continued to log and monitor and the relative humidity and temperature at the Conservation Laboratory in Nicosia. Data from the monitors placed within the object cupboards was recorded, as well as data for the outdoor conditions, which was retrieved from Weather.com. The same recording schedule was utilized as previously: logging of relative humidity and temperature took place four times a week two recordings on Monday and Friday mornings and afternoons at approximately 9:00am and 2:00pm. The brevity of the recording period is due to the start of the conservators holiday leave, which begins on December 15 th. 3
4 4
 (Graphs courtesy of Cassy Cutulle 2016).")

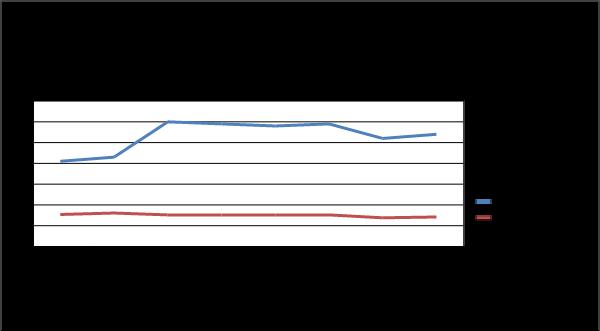
5 Figs. 1-3: Line graphs displaying the relative humidity and temperature within the two object cupboards housed in the Conservation Laboratory in Nicosia (top, middle) and the temperature and overall humidity recorded outdoors as per weather.com (bottom) (Graphs courtesy of Cassy Cutulle 2016). In the Outdoor graph above, a lower average temperature and wild daily overall humidity fluctuations are both indicative of the winter season. In addition to cooler weather and a rise in relative humidity during these times around the end of November and into early December, Nicosia received several days of rain, influencing the overall humidity in this graph, where a maximum of 70% can be seen. The lower overall humidity percentages seen are in correspondence with several peaks in temperature during the day, which provide a drier climate. The indoor relative humidity and temperature graphs for cupboards 1 and 2 above display a more buffered environment, however, the approximately 20% spike in relative humidity seen between November 28 th and December 2 nd as a result of the rain, is concerning. Since this is not a slow, gradual increase and occurred over a short amount of time, it could be considered particularly detrimental to certain types of objects such as metals. However, as previously mentioned, we have adequately prepared the objects for these fluctuations by packaging them in boxes with appropriate materials such as silica gel which was last refreshed on December 14 th which will help maintain a level relative humidity. Lastly, the indoor graphs display a stable, lower temperature with an average around 15 C, which is to be expected at this time of the year. 5

![4-5 Above] display the data recently extracted from the two Tiny Tag environmental loggers.](/docs-images/79/79647769/images/6-1.jpg "The loggers were placed at two different points in the Ship Gallery under the Hull to provide information on the types of fluctuations occurring and also affecting the Ship.")
6 Figs. 4-5: Line graphs displaying the relative humidity (green), temperature (blue) and dew point (black) for the two Tiny Tag environmental data loggers placed in the Ship Gallery. Shown above is the data recorded by the loggers, which recorded every seven minutes between October 12 th and December 12 th, 2016 The second set of graphs above [Figs. 4-5 Above] display the data recently extracted from the two Tiny Tag environmental loggers. The loggers were placed at two different points in the Ship Gallery under the Hull to provide information on the types of fluctuations occurring and also affecting the Ship. The loggers recorded data every seven minutes from October 12 th to December 12 th, This data is particularly important as it reflects what the Hull has been directly exposed to over this time period during the seasonal shift. As expected, the temperature denoted as the blue-colored line steadily decreases from October to December as winter-time approaches. The daily spikes and dips in the temperature can be attributed to both regular outdoor daytime/nighttime fluctuations and also the air conditioning in the space (if it is turned on in the daytime/off at night). The relative humidity for both monitors fluctuates wildly, but is also still inversely proportionate to the temperature (relative humidity rising as temperature drops). The air conditioning can also be influencing the relative humidity in this way. At any rate, the relative humidity fluctuations are concerning and could be potentially damaging for the wood of the Hull in the long-term. Plans to redevelop the Shipwreck Gallery should consider this important detail and hopefully aid the Hull in the future. On December 12 th, the conservators met with Owen Gander at Kyrenia Castle to discuss and explain the use of the Tiny Tag environmental monitors. At the same time, four additional Tiny Tag monitors 6


 and the location of one of the Tiny Tag devices near the")
7 were placed at Kyrenia Castle two in the Kyrenia Ship Storeroom and two in the Shipwreck Museum Gallery. The locations of the new Tiny Tag devices were chosen to allow the monitoring of areas that contain objects that are particularly vulnerable to environmental fluctuations. In the Kyrenia Ship Storeroom, one logger was placed in the vicinity of the detached pieces of Hull wood and one in a metal cabinet which will later rehouse some of the smaller metal objects. In the Shipwreck Museum Gallery, one logger was placed near the lead curse tablet inside the display case and another near the lead rigging rings and smaller copper alloy objects again within the display case. These loggers will also allow the conservators to determine how seasonal and daily variations in the environment will impact the objects. Figs. 6-7: The four new Tiny Tag monitors before being placed in the Kyrenia Ship Storeroom and Shipwreck Museum Gallery at Kyrenia castle (left) and the location of one of the Tiny Tag devices near the lead rigging rings in the Shipwreck Museum Gallery (right) (photographs courtesy of Cassy Cutulle, 2016). Fig. 8: Owen Gander and Cassy Cutulle placing one of the Tiny Tag data loggers in the display case containing the lead curse tablet in the Shipwreck Museum Gallery, Kyrenia Castle (photograph courtesy of Veronica Ford, 2016). 7


8 After downloading the first lot of data from the two loggers in the Ship Gallery, which logged from October 12 th to December 12th, all six monitors were reconfigured to take readings every 7 minutes, allowing the devices to record until reaching full capacity on March 1 st, In addition, all six Tiny Tag loggers were placed on a plinth and labels in Turkish and English were added to explain that the devices were monitoring the environment and should not be moved, touched or thrown away. The conservators plan to provide additional training for Owen in the New Year so that he may download the environmental data from the loggers in the long-term. Fig. 9: Owen Gander and Cassy Cutulle setting up a new Tiny Tag data logger (photograph courtesy of Veronica Ford, 2016) On the 6 th of December, Robin Piercy member of the Kyrenia Ship Project Team--visited the Conservation Laboratory in north Nicosia to observe some of the restoration activities being undertaken. This was a good opportunity for the conservators to demonstrate and explain the treatment process while also receiving some feedback about the progress so far. Additionally, the conservators enjoyed a meeting with Francis Talbot Vassiliadou on the 13 th of December, who was the initial conservator for the Kyrenia Ship Project during the Ship s excavation. The conservators were able to learn more about the types of materials she used in the late-1960s, early 1970s and the approaches undertaken. Figs : Veronica Ford (left) and Cassy Cutulle (right) showing their work to Robin Piercy (Kyrenia Ship Project Team) (photographs courtesy of Cassy Cutulle and Veronica Ford, 2016). Remedial Conservation Tasks 8

![As work continues forward, the restoration work has increased in complexity, as can be seen in Veronica s recently constructed detachable fill [Figs.10-11 below].](/docs-images/79/79647769/images/9-2.jpg "This object required a more complex approach than before, due to the size of the loss for restoration (around 40% of the object) and orientation of the area to be filled.")
9 Throughout December, the restoration of the ceramic objects has continued, with the conservators continuing work on objects that were started in November. Cassy is aiming to finish objects P27 and P96 by mid-december, while Veronica is working on P21, having recently completed P26 in mid-december. As work continues forward, the restoration work has increased in complexity, as can be seen in Veronica s recently constructed detachable fill [Figs below]. This object required a more complex approach than before, due to the size of the loss for restoration (around 40% of the object) and orientation of the area to be filled. It was discovered by Veronica that the best approach was to create two wax molds, pouring the plaster between the two. However, this necessitated the joining of multiple sheets of dental wax, which was found to be time consuming. Figs : P26 with the mold for the large fill in place (left) and P26 after treatment (right) (photographs courtesy of Veronica Ford, 2016). The restoration jobs that remain for the future are ones that are more complex, with larger areas of loss and also original sherds with no joining edges to the ceramic itself. In situations such as these, it will be difficult to produce molds from wax sheets. Due to this, the conservators have researched and ordered materials such as silicone rubber and plasticine, which will allow the conservators to produce molds for large areas of loss and also to incorporate loose, original sherds into the mold form. 9
10 January 2017: Projected Work Plan The conservators will be away on annual leave during the first part of January, with Veronica returning to Cyprus on January 10 th and Cassy returning on January 18 th. During this break, the conservators will take the opportunity to collect additional supplies, including plasticine and silicone rubber which will allow the more complex restoration activities to progress through to February. During the first part of the new year, the conservators will also finalize their treatment plans for the metal objects at the conservation lab in north Nicosia, along with making additional arrangements for the rehousing of the wooden objects at Kyrenia Castle. 10

.")
11 Fig.14: Flow chart displaying the activities to be undertaken by the conservators for this Project and the progress made thus far (Flow chart courtesy of Veronica Ford, 2016). 11
Temperature Changes OBJECTIVES PREPARATION SCHEDULE MATERIALS. The students. For each student. For each team of two. For the class
 activity 3 Temperature Changes OBJECTIVES Students observe changes in air temperature and discover the role of the Sun in heating Earth. The students measure and record outdoor air temperature at three
1.4j interpret simple shadow stick data to determine local noon and observer s longitude
 1.4j interpret simple shadow stick data to determine local noon and observer s longitude There are many opportunities for making observations of shadows cast with a vertical stick and the Sun. Observations
Determine the trend for time series data
 Extra Online Questions Determine the trend for time series data Covers AS 90641 (Statistics and Modelling 3.1) Scholarship Statistics and Modelling Chapter 1 Essent ial exam notes Time series 1. The value
A summary of the weather year based on data from the Zumwalt weather station
 ZUMWALT PRAIRIE WEATHER 2016 A summary of the weather year based on data from the Zumwalt weather station Figure 1. An unusual summer storm on July 10, 2016 brought the second-largest precipitation day
Central Ohio Air Quality End of Season Report. 111 Liberty Street, Suite 100 Columbus, OH Mid-Ohio Regional Planning Commission
 217 218 Central Ohio Air Quality End of Season Report 111 Liberty Street, Suite 1 9189-2834 1 Highest AQI Days 122 Nov. 217 Oct. 218 July 13 Columbus- Maple Canyon Dr. 11 July 14 London 11 May 25 New Albany
November 2018 Weather Summary West Central Research and Outreach Center Morris, MN
 November 2018 Weather Summary Lower than normal temperatures occurred for the second month. The mean temperature for November was 22.7 F, which is 7.2 F below the average of 29.9 F (1886-2017). This November
Fundamentals of Transmission Operations
 Fundamentals of Transmission Operations Load Forecasting and Weather PJM State & Member Training Dept. PJM 2014 9/10/2013 Objectives The student will be able to: Identify the relationship between load
Weather to Climate Investigation: Maximum Temperature
 Name: Date: Guiding Questions: Weather to Climate Investigation: Maximum Temperature What are the historical and current weather patterns or events for a location in the United States? What are the long-term
Making a Climograph: GLOBE Data Explorations
 Making a Climograph: A GLOBE Data Exploration Purpose Students learn how to construct and interpret climographs and understand how climate differs from weather. Overview Students calculate and graph maximum
Case Study Las Vegas, Nevada By: Susan Farkas Chika Nakazawa Simona Tamutyte Zhi-ya Wu AAE/AAL 330 Design with Climate
 Case Study Las Vegas, Nevada By: Susan Farkas Chika Nakazawa Simona Tamutyte Zhi-ya Wu AAE/AAL 330 Design with Climate Professor Alfredo Fernandez-Gonzalez School of Architecture University of Nevada,
TILT, DAYLIGHT AND SEASONS WORKSHEET
 TILT, DAYLIGHT AND SEASONS WORKSHEET Activity Description: Students will use a data table to make a graph for the length of day and average high temperature in Utah. They will then answer questions based
Extending Learning Beyond the Classroom
 Extending Learning Beyond the Classroom School is out, but learning continues! GRADE 1 Clayton County Public Schools Department of Curriculum, Instruction, & Assessment DR. EBONY T. LEE Director of Curriculum,
1' U. S. Forest Products Laboratory. Weathering and decay. U.S. Forest Serv. Forest Prod. Lab. Tech. Note 221 (rev,), 2 pp. 1956, (Processed.
, 2 pp. 1956, (Processed.") Number 171 Portland, Oregon August 1959 EFFECT OF WEATHERING ON ACCURACY OF FUEL-MOISTURE-INDICATOR STICKS IN THE PACIFIC NORTHWEST by William Go Morris How much does weathering affect accuracy of fuel-moistureindicator
Number 171 Portland, Oregon August 1959 EFFECT OF WEATHERING ON ACCURACY OF FUEL-MOISTURE-INDICATOR STICKS IN THE PACIFIC NORTHWEST by William Go Morris How much does weathering affect accuracy of fuel-moistureindicator
Boy Scout Badge Workshop ASTRONOMY
 Boy Scout Badge Workshop ASTRONOMY Welcome to the Schenectady Museum & Suits-Bueche Planetarium! During this workshop, you will explore the museum, see a show in the planetarium, and try out some other
PRELIMINARY DRAFT FOR DISCUSSION PURPOSES
 Memorandum To: David Thompson From: John Haapala CC: Dan McDonald Bob Montgomery Date: February 24, 2003 File #: 1003551 Re: Lake Wenatchee Historic Water Levels, Operation Model, and Flood Operation This
Graphing Sea Ice Extent in the Arctic and Antarctic
 Graphing Sea Ice Extent in the Arctic and Antarctic 1. Large amounts of ice form in some seasons in the oceans near the North Pole and the South Pole (the Arctic Ocean and the Southern Ocean). This ice,
Science and Technology sample unit: What Should I Wear? Booragul Public School
 Science and Technology sample unit: What Should I Wear? Early Stage 1 Term 3 Duration: 10 weeks Booragul Public School Unit context Students investigate ways daily and seasonal changes in our environment
Chapter 1 0+7= 1+6= 2+5= 3+4= 4+3= 5+2= 6+1= 7+0= How would you write five plus two equals seven?
 Chapter 1 0+7= 1+6= 2+5= 3+4= 4+3= 5+2= 6+1= 7+0= If 3 cats plus 4 cats is 7 cats, what does 4 olives plus 3 olives equal? olives How would you write five plus two equals seven? Chapter 2 Tom has 4 apples
4.4 MONTHLY WEATHER SUMMARY
 4.4 1 4.4 MONTHLY WEATHER SUMMARY OBJECTIVES The students Collect and summarize monthly weather data about local weather conditions including wind speed and direction, rainfall, temperature, humidity (optional),
Laboratory Exercise #7 - Introduction to Atmospheric Science: The Seasons and Daily Weather
 Laboratory Exercise #7 - Introduction to Atmospheric Science: The Seasons and Daily Weather page - Section A - Introduction: This lab consists of questions dealing with atmospheric science. We beginning
September 2018 Weather Summary West Central Research and Outreach Center Morris, MN
 September 2018 Weather Summary The mean temperature for September was 60.6 F, which is 1.5 F above the average of 59.1 F (1886-2017). The high temperature for the month was 94 F on September 16 th. The
Description of the Temperature Observation and Averaging Methods Used at the Blue Hill Meteorological Observatory
 Description of the Temperature Observation and Averaging Methods Used at the Blue Hill Meteorological Observatory Michael J. Iacono Blue Hill Meteorological Observatory November 2015 The Blue Hill Meteorological
Third Grade Math and Science DBQ Weather and Climate/Representing and Interpreting Charts and Data - Teacher s Guide
 Third Grade Math and Science DBQ Weather and Climate/Representing and Interpreting Charts and Data - Teacher s Guide A document based question (DBQ) is an authentic assessment where students interact with
ACTIVITY CLASSROOM. Observe the Moon's Phases. General Information
 CLASSROOM ACTIVITY Observe the Moon's Phases General Information Grade level: All cycles Students per group: Individual or group activities When: After the Planetarium visit Duration: One 50-minute period,
Champaign-Urbana 1999 Annual Weather Summary
 Champaign-Urbana 1999 Annual Weather Summary ILLINOIS STATE WATER SURVEY 2204 Griffith Dr. Champaign, IL 61820 wxobsrvr@sws.uiuc.edu Maria Peters, Weather Observer A major snowstorm kicked off the new
Label the lines below with S for the same meanings or D for different meanings.
 Time Expressions- Same or Dates, times, frequency expressions, past times and future times Without looking below, listen to your teacher and raise one of the cards that you ve been given depending on what
WEATHER ON WHEELS Elementary School Program
 WEATHER ON WHEELS Elementary School Program MAST ACADEMY OUTREACH On-Site Packet Miami-Dade County Public Schools Miami, Florida MAST ACADEMY OUTREACH WEATHER ON WHEELS ELEMENTARY ON-SITE HIGHLIGHTS PACKET
PRE-AP PHYSICS/PHYSICS IPACING CALENDAR Monday Tuesday Wednesday Thursday Friday CURRICULUM WRITING
 JULY 208 2 4 6 9 0 2 6 STEMSCOPES PD 8 9 20 2 --------------------------- ---------------------------- ----------------------------- 0 NEW TEACHER ORIENTATION WEEK NEW TEACHER ORIENTATION WEEK AUGUST 208
Pacific Decadal Oscillation ( PDO ):
:") Time again for my annual Winter Weather Outlook. Here's just a small part of the items I considered this year and how I think they will play out with our winter of 2015-2016. El Nino / La Nina: When looking
Time again for my annual Winter Weather Outlook. Here's just a small part of the items I considered this year and how I think they will play out with our winter of 2015-2016. El Nino / La Nina: When looking
Analysis of meteorological measurements made over three rainy seasons in Sinazongwe District, Zambia.
 Analysis of meteorological measurements made over three rainy seasons in Sinazongwe District, Zambia. 1 Hiromitsu Kanno, 2 Hiroyuki Shimono, 3 Takeshi Sakurai, and 4 Taro Yamauchi 1 National Agricultural
Flood Risk Assessment
 Flood Risk Assessment February 14, 2008 Larry Schick Army Corps of Engineers Seattle District Meteorologist General Assessment As promised, La Nina caused an active winter with above to much above normal
Aalborg Universitet. CLIMA proceedings of the 12th REHVA World Congress Heiselberg, Per Kvols. Publication date: 2016
 Aalborg Universitet CLIMA 2016 - proceedings of the 12th REHVA World Congress Heiselberg, Per Kvols Publication date: 2016 Document Version Final published version Link to publication from Aalborg University
Twelve Moons Curriculum Overview
 Twelve Moons Twelve Moons Curriculum Overview 1. Instructions The curriculum is arranged by book section, in order. Feel free to teach in any order you wish. The curriculum adheres to three objectives
2011 Year in Review TORNADOES
 2011 Year in Review The year 2011 had weather events that will be remembered for a long time. Two significant tornado outbreaks in April, widespread damage and power outages from Hurricane Irene in August
Fall 2017 Student Calendar. August 2017 S M T W T F S
 September 2017 August 2017 3 4 5 6 7 8 9 10 11 12 13 14 15 16 17 18 19 20 22 23 24 25 26 27 28 29 30 31 September 2017 October 2017 3 4 5 6 7 8 9 10 11 12 13 14 15 16 17 18 19 20 21 22 23 24 25 26 27 28
Measuring Keepers S E S S I O N 1. 5 A
 S E S S I O N 1. 5 A Measuring Keepers Math Focus Points Naming, notating, and telling time to the hour on a digital and an analog clock Understanding the meaning of at least in the context of linear measurement
Improving Understanding of Drought Impacts through Citizen Science
 Improving Understanding of Drought Impacts through Citizen Science Amanda Brennan, Janae Davis, Kirstin Dow, Kirsten Lackstrom, Sumi Selvaraj North Carolina Water Resources Research Institute Annual Meeting
ASTRONOMY Merit Badge Requirements
 ASTRONOMY Merit Badge Requirements 1) Do the following: A) Sketch the face of the moon, indicating on it the locations of at least five seas and five craters. B) Within a single week, sketch the position
MATHS WORKSHEETS SECOND TERM
 NAME: GRADE: MATHS WORKSHEETS SECOND TERM GRADE 4 SYLLABUS INSTAMATHS WKSHEET Tables (multiplying) 18; 20; 23; 25; Tables (patterning) 30 Tables (dividing) 19; 21; 24; Long multiplication by 1 digit 31;
Lab Activity: Climate Variables
 Name: Date: Period: Water and Climate The Physical Setting: Earth Science Lab Activity: Climate Variables INTRODUCTION:! The state of the atmosphere continually changes over time in response to the uneven
Worksheet: The Climate in Numbers and Graphs
 Worksheet: The Climate in Numbers and Graphs Purpose of this activity You will determine the climatic conditions of a city using a graphical tool called a climate chart. It represents the long-term climatic
Laboratory Exercise #7 - Introduction to Atmospheric Science: The Seasons
 Laboratory Exercise #7 - Introduction to Atmospheric Science: The Seasons page - 1 Section A - Introduction: This lab consists of both computer-based and noncomputer-based questions dealing with atmospheric
Colorado State University, Fort Collins, CO Weather Station Monthly Summary Report
 Colorado State University, Fort Collins, CO Weather Station Monthly Summary Report Month: December Year: 2017 Temperature: Mean T max was 47.2 F which is 4.4 above the 1981-2010 normal for the month. This
LAB 3: THE SUN AND CLIMATE NAME: LAB PARTNER(S):
:") GEOG 101L PHYSICAL GEOGRAPHY LAB SAN DIEGO CITY COLLEGE SELKIN 1 LAB 3: THE SUN AND CLIMATE NAME: LAB PARTNER(S): The main objective of today s lab is for you to be able to visualize the sun s position
GEOG 101L PHYSICAL GEOGRAPHY LAB SAN DIEGO CITY COLLEGE SELKIN 1 LAB 3: THE SUN AND CLIMATE NAME: LAB PARTNER(S): The main objective of today s lab is for you to be able to visualize the sun s position
Which graph best shows the relationship between intensity of insolation and position on the Earth's surface? A) B) C) D)
 B) C) D)") 1. The hottest climates on Earth are located near the Equator because this region A) is usually closest to the Sun B) reflects the greatest amount of insolation C) receives the most hours of daylight D)
1. The hottest climates on Earth are located near the Equator because this region A) is usually closest to the Sun B) reflects the greatest amount of insolation C) receives the most hours of daylight D)
MOTIONS OF THE EARTH. Figure 3.1 : Inclination of the Earth s axis and the orbital plane. Figure 3.2 : Day and Night on the Earth due to rotation
 3 Let s Do Take a ball to represent the earth and a lighted candle to represent the sun. Mark a point on the ball to represent a town X. Place the ball in such a way that the town X is in darkness. Now
Colorado State University, Fort Collins, CO Weather Station Monthly Summary Report
 Colorado State University, Fort Collins, CO Weather Station Monthly Summary Report Month: December Year: 2016 Temperature: Mean T max was 39.7 F which is 3.1 below the 1981-2010 normal for the month. This
The Earth Orbits the Sun Student Question Sheet (Advanced)
") The Earth Orbits the Sun Student Question Sheet (Advanced) Author: Sarah Roberts - Faulkes Telescope Project Introduction This worksheet contains questions and activities which will test your knowledge
The Earth Orbits the Sun Student Question Sheet (Advanced) Author: Sarah Roberts - Faulkes Telescope Project Introduction This worksheet contains questions and activities which will test your knowledge
Data Analysis and Mechanical System Performance. Denver Art Museum August 15-16, 2012
 Data Analysis and Mechanical System Performance Denver Art Museum August 15-16, 2012 Data Analysis Reading graphs Overlay of indoor and outdoor dew point graphs What you can learn about your mechanical
Grade 6 Standard 2 Unit Test Astronomy
 Grade 6 Standard 2 Unit Test Astronomy Multiple Choice 1. Why does the air temperature rise in the summer? A. We are closer to the sun. B. The air becomes thicker and more dense. C. The sun s rays are
Average Weather For Coeur d'alene, Idaho, USA
 Average Weather For Coeur d'alene, Idaho, USA Information courtesy of weatherspark.com Location This report describes the typical weather at the Coeur d'alene Air Terminal (Coeur d'alene, Idaho, United
1-ESS1 Earth s Place in the Universe 1-ESS1-2 Make observations at different times of year to relate the amount of daylight to the time of year.
 LESSON: Sunlight GRADE: 1 OBJECTIVES: 1-ESS1 Earth s Place in the Universe 1-ESS1-2 Make observations at different times of year to relate the amount of daylight to the time of year. MATERIALS & RESOURCES:
MAST ACADEMY OUTREACH. WOW (Weather on Wheels)
") MAST ACADEMY OUTREACH MIDDLE SCHOOL PROGRAM Adventures Aboard WOW (Weather on Wheels) On-Site Highlights Packet MAST Academy Maritime and Science Technology High School Miami-Dade County Public Schools
MAST ACADEMY OUTREACH MIDDLE SCHOOL PROGRAM Adventures Aboard WOW (Weather on Wheels) On-Site Highlights Packet MAST Academy Maritime and Science Technology High School Miami-Dade County Public Schools
QUANTIFICATION OF THE NATURAL VARIATION IN TRAFFIC FLOW ON SELECTED NATIONAL ROADS IN SOUTH AFRICA
 QUANTIFICATION OF THE NATURAL VARIATION IN TRAFFIC FLOW ON SELECTED NATIONAL ROADS IN SOUTH AFRICA F DE JONGH and M BRUWER* AECOM, Waterside Place, Tygerwaterfront, Carl Cronje Drive, Cape Town, South
LETTER TO FAMILY. Science News. Cut here and paste onto school letterhead before making copies. Dear Family,
 LETTER TO FAMILY Cut here and paste onto school letterhead before making copies. Dear Family, Science News We are about to begin a study of objects in the sky the Sun, Moon, and planets. We ll start with
2012 Growing Season. Niagara Report. Wayne Heinen
 2012 Growing Season Niagara Report Wayne Heinen Overview The 2012 growing season was a phenomenal one for grapes. Vines entered bud break in good shape following a mild winter. The spring of 2012 was similar
Winter. Here s what a weak La Nina usually brings to the nation with tempseraures:
 2017-2018 Winter Time again for my annual Winter Weather Outlook. Here's just a small part of the items I considered this year and how I think they will play out with our winter of 2017-2018. El Nino /
Project 2. Introduction: 10/23/2016. Josh Rodriguez and Becca Behrens
 Project 2 Josh Rodriguez and Becca Behrens Introduction: Section I of the site Dry, hot Arizona climate Linen supply and cleaning facility Occupied 4am-10pm with two shifts of employees PHOENIX, ARIZONA
MAST ACADEMY OUTREACH. WOW (Weather on Wheels)
") MAST ACADEMY OUTREACH ELEMENTARY PROGRAM Adventures Aboard WOW (Weather on Wheels) Teacher Instructions / Answer Keys MAST Academy Maritime and Science Technology High School Miami-Dade County Public Schools
MAST ACADEMY OUTREACH ELEMENTARY PROGRAM Adventures Aboard WOW (Weather on Wheels) Teacher Instructions / Answer Keys MAST Academy Maritime and Science Technology High School Miami-Dade County Public Schools
Moon Phases Weatherguide Calendar Lesson Created By: Melanie Anderson, Leah Nelson, Lisa Kalina, ISD #719, 5/2007
 Grade: 2 Subjects: Science Moon Phases Weatherguide Calendar Lesson Created By: Melanie Anderson, Leah Nelson, Lisa Kalina, ISD #719, 5/2007 Standards Subject Standard Benchmark Science Raise questions
Her birthday is May 4 th. He is not from Korea. You are not in Level 4.
 August is the eighth month of the year. Her birthday is May 4 th. He is not from Korea. You are not in Level 4. She is from India. What s her name? April is the fourth month of the year. They are not from
Key #
 4-3.8. 1. Which of the following instruments is used to directly observe objects in the sky? 4-3.1. 2. Earth is a rocky planet that resides close to the Sun. Recognize the list of planets below that has
Global Geoparks focus on developing their regions as Sustainable Tourism Destinations.
 The Burren & Cliffs of Moher region has achieved UNESCOsupported Global Geopark Status in recognition of the region s significant geological, ecological and cultural value, as well as its sustainable tourism
By the time you read this article, Easter lilies will have been planted, Easter Lilies: Easter Lilies: A Challenge You Can Master
 new crop varieties cultivation Easter Lilies: Easter Lilies: A Challenge You Can Master When it comes to controlling flowering and height of your Easter lily crop, precision is key. Temperature manipulation,
FINAL REPORT Phase One
 FINAL REPORT Phase One FS Agreement Number: 03-JV-11222046-077 Cooperator Agreement Number: 2477 Evaluation of a New Dead Fuel Moisture Model in a Near-Real-Time Data Assimilation and Forecast Environment
Define umbra and penumbra. Then label the umbra and the penumbra on the diagram below. Umbra: Penumbra: Light source
 Lesson 3 Eclipses and Tides LA.8.2.2.3, SC.8.E.5.9, SC.8.N.1.1 Skim or scan the heading, boldfaced words, and pictures in the lesson. Identify or predict three facts you will learn from the lesson. Discuss
Champaign-Urbana 2001 Annual Weather Summary
 Champaign-Urbana 2001 Annual Weather Summary ILLINOIS STATE WATER SURVEY 2204 Griffith Dr. Champaign, IL 61820 wxobsrvr@sws.uiuc.edu Maria Peters, Weather Observer January: After a cold and snowy December,
MAST ACADEMY OUTREACH. WOW (Weather on Wheels)
") MAST ACADEMY OUTREACH ELEMENTARY SCHOOL PROGRAM Adventures Aboard WOW (Weather on Wheels) On-Site Packet MAST Academy Maritime and Science Technology High School Miami-Dade County Public Schools Miami,
MAST ACADEMY OUTREACH ELEMENTARY SCHOOL PROGRAM Adventures Aboard WOW (Weather on Wheels) On-Site Packet MAST Academy Maritime and Science Technology High School Miami-Dade County Public Schools Miami,
CropCast Corn and Soybean Report Kenny Miller Friday, March 17, 2017
 Accumulated Rainfall (inches) Accumulated GDDs Temperature ( F)/Wind Speed (mph) Precipitation (inches) CropCast Corn and Soybean Report Kenny Miller Friday, March 17, 2017 Peoria, IL Regional Forecast
What Patterns Can Be Observed in a Year?
 LESSON 3 What Patterns Can Be Observed in a Year? From this vantage point, you can see the moon, sun, stars, and Earth. From Earth s surface, there are patterns to how the sun, moon, and stars appear in
Tools of the Trade Using Weather Tools Grade 1-5
 Tools of the Trade Using Weather Tools Grade 1-5 OVERVIEW: Weather is a condition of the atmosphere and meteorologists are scientists who use instruments to gather data in order to study and then forecast
WEATHER AND CLIMATE SCIENCE
 WEATHER AND CLIMATE SCIENCE 4-H-1023 LEVEL 1 Reference in this publication to any specific commercial product, process, or service, or the use of any trade, firm, or corporation name is for general informational
one two three four five six seven eight nine ten eleven twelve thirteen fourteen fifteen zero oneteen twoteen fiveteen tenteen
 Stacking races game Numbers, ordinal numbers, dates, days of the week, months, times Instructions for teachers Cut up one pack of cards. Divide the class into teams of two to four students and give them
5.2 (HUMIDITY) WEATHER EARTH SCIENCE
 WEATHER EARTH SCIENCE") EARTH SCIENCE 5.2 (HUMIDITY) WEATHER Text: The water vapor content of the air is called humidity. The amount of water vapor air can hold depends on its temperature. Warm air can hold far more moisture
EARTH SCIENCE 5.2 (HUMIDITY) WEATHER Text: The water vapor content of the air is called humidity. The amount of water vapor air can hold depends on its temperature. Warm air can hold far more moisture
BESPOKEWeather Services Friday Morning Update: SLIGHTLY BEARISH
 Forecasts overnight cooled dramatically, with European cooling the medium-range the most. A cool shot from the Midwest into the Ohio River Valley and East from the 15 th through the 18 th looks to pull
WHEN IS IT EVER GOING TO RAIN? Table of Average Annual Rainfall and Rainfall For Selected Arizona Cities
 WHEN IS IT EVER GOING TO RAIN? Table of Average Annual Rainfall and 2001-2002 Rainfall For Selected Arizona Cities Phoenix Tucson Flagstaff Avg. 2001-2002 Avg. 2001-2002 Avg. 2001-2002 October 0.7 0.0
Sensory Map. of the North Carolina Museum of Natural Sciences
 Sensory Map of the North Carolina Museum of Natural Sciences Introduction Welcome to the North Carolina Museum of Natural Sciences. You can use this sensory map to identify sensory-friendly spaces within
Earth & Space Science, Interpreting Data DURATION Preparation: 5 minutes Activity: 40 minutes (total over one day)
") Objectives In this activity students will: 1. Observe how the position of the sun in the sky changes during the course of the day 2. Discover the cardinal directions by tracking the motion of the sun Materials
Objectives In this activity students will: 1. Observe how the position of the sun in the sky changes during the course of the day 2. Discover the cardinal directions by tracking the motion of the sun Materials
INTRODUCTION TO FORECASTING (PART 2) AMAT 167
 AMAT 167") INTRODUCTION TO FORECASTING (PART 2) AMAT 167 Techniques for Trend EXAMPLE OF TRENDS In our discussion, we will focus on linear trend but here are examples of nonlinear trends: EXAMPLE OF TRENDS If you
INTRODUCTION TO FORECASTING (PART 2) AMAT 167 Techniques for Trend EXAMPLE OF TRENDS In our discussion, we will focus on linear trend but here are examples of nonlinear trends: EXAMPLE OF TRENDS If you
Here s what a weak El Nino usually brings to the nation with temperatures:
 Time again for my annual Winter Weather Outlook. Here's just a small part of the items I considered this year and how I think they will play out with our winter of 2018-2019. El Nino / La Nina: When looking
Saving for the New Year
 To start the new year, I have decided to start a savings account so that I can buy myself a little something special on New Year s Day next year. I have decided to put one dime in a jar on the 1st day
AN ANALYSIS OF THE TORNADO COOL SEASON
 AN ANALYSIS OF THE 27-28 TORNADO COOL SEASON Madison Burnett National Weather Center Research Experience for Undergraduates Norman, OK University of Missouri Columbia, MO Greg Carbin Storm Prediction Center
Algebra 1 Fall Semester Final Review Name
 It is very important that you review for the Algebra Final. Here are a few pieces of information you want to know. Your Final is worth 20% of your overall grade The final covers concepts from the entire
Occupant Behavior Related to Space Cooling in a High Rise Residential Building Located in a Tropical Region N.F. Mat Hanip 1, S.A. Zaki 1,*, A. Hagish
 Occupant Behavior Related to Space Cooling in a High Rise Residential Building Located in a Tropical Region N.F. Mat Hanip 1, S.A. Zaki 1,*, A. Hagishima 2, J. Tanimoto 2, and M.S.M. Ali 1 1 Malaysia-Japan
FRAPPÉ/DISCOVER-AQ (July/August 2014) in perspective of multi-year ozone analysis
 in perspective of multi-year ozone analysis") FRAPPÉ/DISCOVER-AQ (July/August 2014) in perspective of multi-year ozone analysis Project Report #2: Monitoring network assessment for the City of Fort Collins Prepared by: Lisa Kaser kaser@ucar.edu ph:
FRAPPÉ/DISCOVER-AQ (July/August 2014) in perspective of multi-year ozone analysis Project Report #2: Monitoring network assessment for the City of Fort Collins Prepared by: Lisa Kaser kaser@ucar.edu ph:
Adapting to Climate Change in Black River First Nation
 Adapting to Climate Change in Black River First Nation Dr. Brian G. Kotak, General Manager -Manitoba Model Forest Jack Johnson, Special Projects Black River First Nation Climate Change & Health Adaptation
C) the seasonal changes in constellations viewed in the night sky D) The duration of insolation will increase and the temperature will increase.
 the seasonal changes in constellations viewed in the night sky D) The duration of insolation will increase and the temperature will increase.") 1. Which event is a direct result of Earth's revolution? A) the apparent deflection of winds B) the changing of the Moon phases C) the seasonal changes in constellations viewed in the night sky D) the
1. Which event is a direct result of Earth's revolution? A) the apparent deflection of winds B) the changing of the Moon phases C) the seasonal changes in constellations viewed in the night sky D) the
Group Research Projects
 GEOB 401 - Group Research Projects Descriptions 1/5 Group Research Projects The objective of the group research project (20% of course grade) is to expose you to the process of designing, planning, analyzing,
PHYSICAL PROPERTIES TAHOE.UCDAVIS.EDU 8
 PHYSICAL PROPERTIES 8 Lake surface level Daily since 1900 Lake surface level varies throughout the year. Lake level rises due to high stream inflow, groundwater inflow, and precipitation directly onto
Measurement and Data Core Guide Grade 1
 Measure lengths indirectly and by iterating length units (Standards 1 2). Standard 1.MD.1 Order three objects by length; compare the lengths of two objects indirectly by using a third object. Understand
AMBIENT WELL-BEING PARAMETERS IN THE INDOOR SPACES OF OFFICE BUILDINGS. CASE STUDY
 PRESENT ENVIRONMENT AND SUSTAINABLE DEVELOPMENT, VOL. 6, no. 1, 2012 AMBIENT WELL-BEING PARAMETERS IN THE INDOOR SPACES OF OFFICE BUILDINGS. CASE STUDY Nicoleta Ionac 1, Adrian-Cătălin Mihoc 2, Paula Tăbleţ
Weather Stations. Evaluation copy. 9. Post live weather data on the school s web site for students, faculty and community.
 Weather Stations Computer P6 Collecting and analyzing weather data can be an important part of your Earth Science curriculum. It might even be an ongoing part of your entire course. A variety of activities
Astronomy Merit Badge Workbook
 Merit Badge Workbook This workbook can help you but you still need to read the merit badge pamphlet. This Workbook can help you organize your thoughts as you prepare to meet with your merit badge counselor.
Decision Mathematics D1 Advanced/Advanced Subsidiary. Wednesday 23 January 2013 Morning Time: 1 hour 30 minutes
 Paper Reference(s) 6689/01 Edexcel GCE Decision Mathematics D1 Advanced/Advanced Subsidiary Wednesday 23 January 2013 Morning Time: 1 hour 30 minutes Materials required for examination Nil Items included
Students will work in small groups to collect detailed data about a variety of living things in the study area.
 TEACHER BOOKLET Sampling along a transect Name BIOLOGY Students will work in small groups to collect detailed data about a variety of living things in the study area. Students will need: 10 metre long
Admin. 8/29/17. If you re at North Pole, you ll NEVER see stars that are below your horizon. Key Concepts: Lecture 4
 Admin. 8/29/17 1. Class website http://www.astro.ufl.edu/~jt/teaching/ast1002/ 2. Optional Discussion sections (start Aug. 30th) (see me at end of lecture if you can t make one of these times)! Tuesday
Energy in the Earth's Systems - How do external and internal sources of energy affect the Earth's systems? KINDERGARTEN
 Teacher Trail Guides We have created a set of Trail Guides for use by you and your students. The first section consists of the trail guides with teacher notes; the second section s Trail Guides omit the
Patterns on Earth 4.8C
 Have you ever made shadow puppets? If you put your hand between a flashlight and a wall, you will make a shadow. You might have made a rabbit shape or some other animal shape with your hands. Your hand
2010 Growing Season. Prince Edward County Report
 2010 Growing Season Prince Edward County Report WIN Staff November 10, 2010 Overview It is always remarkable how each growing season is unique as a result of yearly variations in weather. Changes occur
Instructions Answers Calculators must not
 Instructions Answers This means write down your answer or show your working and your answer. Calculators You must not use a calculator in this test. 2 Milk Shakes 1. A shop kept a tally chart to show what