The anomalies (i.e. z-scores) of the variables rainfall, maximum temperature and minimum
|
|
|
- Conrad Lyons
- 6 years ago
- Views:
Transcription
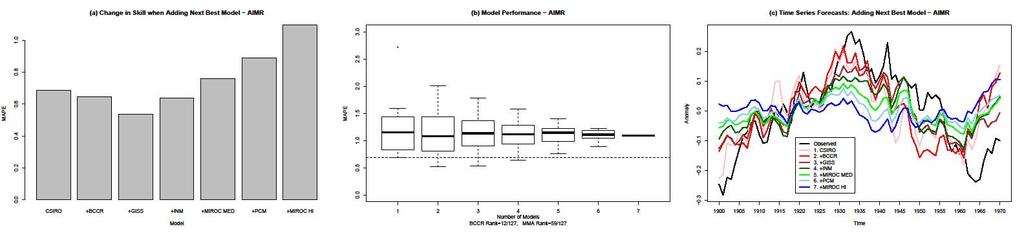
1 Supplemental Information (SI) README 1. Methodological details 1.1 Overview The anomalies (i.e. z-scores) of the variables rainfall, maximum temperature and minimum temperature are computed by subtracting their respective means and then dividing by their respective standard deviations, both computed from a baseline period ( ). A 30-year moving average is then applied to each time series to reveal low-frequency temporal behavior and to suppress high-frequency components. The distinct climatic patterns observed from the moving average plots are periodic patterns in rainfall and minimum temperature and an increasing trend in maximum temperature. The moving average time series plots for rainfall (observed and GCM simulated) are de-trended to focus on the periodic pattern of All India Monsoon Rainfall (AIMR). Individual observed and modeled time series are displayed for the entire country and for several subdivisions of India in Figure S Metrics To compare the performances of individual GCMs with equally-weighted MMAs, the combinations of single to sets of 2, GCMs are evaluated for a total of 127 combinations. Median Absolute Percentage Error (MAPE), which has been used in evaluating forecasts (e.g., Armstrong and Collopy 1992), is chosen as the metric for model skill in Figure 1. Because it is not affected by gross outlying errors, this is used rather than the more conventional Mean Absolute Percentage Error. Figure S3 shows the same box plots as in Figure 1(c) and 1(f) but using Mean Squared Error (MSE) and Mean Absolute Deviation (MAD). Note that for AIMR,
2 MSE is sensitive to outlying errors, and consequentially here BCCR is no longer ranked 1 st but 4 th overall. However, all three model combinations that outperform BCCR also contain BCCR in this case, and the other models in the combinations seem to dampen the effect of the outlying errors, thus creating lower MSE values. Table S1 and S2 summarize information derived from the data displayed in Figure 1 and S3: the proportional improvement in metrics using the single best GCM versus the seven-model MMA, as well as the best model combination, are displayed for AIMR using all three performance metrics (Table S1); in addition, the ranking of the MMA is displayed in the context of all individual GCMs (Table S2), for AIMR and TMAX using all three performance metrics. 2.2 Computation of periodicity To compute the periodicities of rainfall and minimum temperature, the sine curves with the following general equation are fitted to the time series: X Detrended = πt A + C sin + Φ (1) N where X Detrended is a de-trended anomaly series. A, C, N and φ are the parameters of the regression equation, which are computed through least square optimization using the search algorithm Probabilistic Global Search Laussane (PGSL) (Raphael and Smith 2003). A is the intercept term and does not have any role in evaluating the performance of GCM in simulating periodicity; this term is a consequence of the sinusoidal fit. C may be considered the amplitude of the wave (periodic time series). A low C value indicates a flat curve with almost no periodicity. N denotes the duration of half of a cycle of the periodic signal. The symbol φ
3 indicates the phase of the signal. Given two signals having the same N values, a difference in φ denotes a difference in phase. However, when N values differ between two signals, the φ value by itself would not be an indication of phase difference between the signals. Probabilistic Global Search Lausanne (PGSL) is a search algorithm for solving linear/non-linear optimization problems. Tests on benchmark problems having multi-parameter non-linear objective functions revealed that PGSL performs better than genetic algorithms and advanced algorithms for simulated annealing (Raphael and Smith 2003). It assumes that better sets of points are more likely to be found in the neighborhood of good sets of points, and therefore it intensifies its search in the region containing good solutions. PGSL first generates sets of values for the decision variables, uniformly in their range, and computes the objective function values. Then, it ranks these sets and assigns a modified distribution (the better the solution, the higher the probability density in the region containing that solution) for decision variables to perform the same procedure. Based on the positions of peaks in the density function, after a number of iterations, PGSL reduces the domain of decision variables. It continues until it converges, through four cycles: the sampling cycle, the probability updating cycle, the focusing cycle, and the sub-domain cycle. Details of the algorithm are described elsewhere (Raphael and Smith 2003). The least squares optimization problem of interest here has a nonlinear objective function; hence, PGSL is used.
4 3. Notes on Monsoon Periodicity The onset and withdrawal of the Indian summer monsoon rainfall are governed by the difference of tropospheric temperature (DTT), vertically integrated between 200 hpa and 600 hpa between a north box (30 0 E E, 10 0 N 35 0 N) and a south box (30 0 E E, 15 0 S 10 0 N) (Goswami et al 2006). When DTT (also known as the meridional gradient of tropospheric temperature) crosses negative to positive, the onset of monsoon occurs. Similarly, the withdrawal of monsoon is determined by the crossing of DTT from positive to negative. The area under positive DDT is strongly correlated with AIMR. AMO is responsible for negative (positive) tropospheric temperature anomaly in Eurasia, resulting weakening (strengthening) of the DTT, and thus influences the AIMR. The periodicity of AMO is approximately years (Schlesinger and Ramankutty 1994; Delworth and Mann 2000; Ottera et al 2010), which is similar to the periodicity of Eurasia temperature and AIMR (computed as a 67-year periodicity). There is empirical evidence (Delworth and Mann 2000) that TMIN over all of India in the three months (March-April-May) prior to the onset of the AIMR (June-July-August-September) is a predictor of the monsoon rainfall. This relationship is likely to have an analogous explanation as the relationship of the Indian monsoon rainfall with Eurasian temperature (discussed above) with possibly similar underlying drivers. 4. Sensitivity of Results to Initial Conditions Model performance results may be sensitive to choice of initial conditions (ICs) to varying degrees (Shukla and Fennessy 1994; Wu et al 2005). For four of the seven GCMs used in this study, multiple ICs are publicly available. Figure S4 displays AIMR calculated from each
5 available initial condition run of each of these four GCMs. In many cases, varying the initial condition choice appears to have a significant effect on the resultant AIMR time series. One notable exception is for PCM, where three out of four IC runs appear quite similar. In addition, AOM appears relatively robust to IC choice. Figure S5(a-b) is analogous to Figure 1(b-c), where for the four GCMs, arbitrary IC runs (CSIRO run 2, AOM run 2, MIROC-MED run 3, and PCM run 4) are substituted in for the runs used to generate results in Figure 1. Results suggest that phase and variability may be sensitive to ICs, affecting performance of models relative to the metric MAPE. In Figure S5, BCCR is ranked 12 th with respect to all 127 combinations and is no longer the best individual GCM relative to MAPE; rather, CSIRO is ranked as the best individual GCM. The 7-model GCM, however, is still suboptimal as in Figure 1, which may be related to the fact that MIROC-HI (the same IC as in the manuscript) does not perform very well. Unfortunately, only one IC run is available for BCCR, the GCM which appeared to perform well for AIMR in the manuscript, and thus we cannot readily test whether this particular model is affected by ICs. 5. AIMR and TMAX Data For those who wish to reproduce results seen in the main text, the files AIMR.csv and TMAX.csv are available as supplementary files. They contain the 30-year moving average anomalies calculated from one run of each of the 7 global climate models (the runs used in the main text) as well as the observations. In each file, column headers 30MAA_X stands for 30- year moving average anomalies of dataset X (where X is the observed data or data from a GCM). Values indicate years where data is not available.
6 SI README References Armstrong, J. S., & Collopy, F. 1992, Int J Forecasting, 8, Raphael, B., & Smith, I. F. C. 2003, J App Math Comp, 146(2-3), Shukla, J., & Fennessy, M. 1994, in Proceedings of the International Conference on Monsoon Variability and Prediction Tech. Rep. WCRP-84: , World Climate Research Programme Wu, W., Lynch, A. H., & Rivers, A. 2005, J Clim, 18,
7 Supplementary Figure Captions Figure S1 Trends and periodicity in temperature and monsoon rainfall for all-india and meteorologically homogeneous regions within India. The 30-year moving average plots for observed TMAX, AIMR and TMIN in the first column suggest the primary patterns of interest: an increasing trend in TMAX and a dominant low-frequency periodicity in AIMR and TMIN, with the latter having similar periodicity to the former. From left to right, then top to bottom, the observed all-india TMAX trend (a) is not necessarily reflected in the observations of TMAX over regions considered homogeneous in terms of temperature (b), but this heterogeneity is not reflected in best individual GCM (INM) simulations, as seen in (c), which shows the best individual GCM over each region. The observed AIMR 67-year periodicity (d) can be roughly seen across all regions considered homogeneous in terms of rainfall (e) other than for Peninsular and Northeast India, and in the corresponding best individual GCM (BCCR) simulations (f). The corresponding periodicity and behavior is seen in TMIN as well (g-i) although the regional patterns appear even more homogeneous. Figure S2 Best-fit sinusoidal corresponding to each of the seven GCM simulations of de-trended 30-year moving of AIMR shows the degree to which the models capture observed periodicity The best-fit sinusoidal curves are plotted to get a preliminary idea for how well the lowfrequency periodicity, which appear the dominant in the observed AIMR, is captured by the various individual GCMs. The periodicity is roughly captured by three of the seven GCMs: BCCR, PCM and MIROC-HI. Two of these three GCMs, specifically, PCM and MIROC-HI, are
8 in opposite phase with the observed AIMR. The multi-model average of all seven GCM does not show any substantial periodicity. Table S3 displays parameters associated with these sinusoidal fits. Figure S3 Evaluation of GCM combinations based on Mean Squared Errors (MSE) and Mean Absolute Deviation (MAD). The box-plots are similar to those in Figure 1b and 1e, with the exception that the performance metrics are MSE (a-b) and MAD (c-d) for AIMR (left column) and TMAX. The best individual GCM (defined by best performance relative to each metric) consistently outperforms the 7-GCM MMA for AIMR. Figure S4 Time series plots of all available initial condition (IC) runs from 4 of 7 GCMs. In each case, the black series represents IC run 1 as labeled in the PCMDI CMIP3 archive (the runs used in the manuscript), red to IC run 2, (and, when applicable) green to IC run 3, and blue to IC run 4. Significant within-model differences in periodic variability and phase can be seen in most cases. Figure S5 In panels (a-c), results analogous to Figure 1 (a-c) are displayed, but for four models (CSIRO, AOM, MIROC MED, and PCM). The former best (with respect to MAPE) individual GCM BCCR (Figure 1) is now ranked number 12 and the 7-GCM MMA ranks 59. The best individual GCM is CSIRO, a result of choosing a different initial condition (IC) run than that which was used in the manuscript.

9 Supplementary Figures Figure S1
10 Figure S2
11 Figure S3
12 Figure S4
13 Figure S5
14 Supplementary Table Legends Table S1: Percent improvement of single-best model over 7-GCM MMA in terms of MSE, MAD, and MAPE for AIMR periodicity The percent improvement from considering just BCCR (as determined by each skill metric) compared to the 7-GCM MMA is shown in the 1 st column. The best combination, out of all 127 combinations, corresponding to each AIMR for each skill metric is shown. Table S2: Ranking of individual GCMs and MMA Individual GCMs and the 7-model equally-weighted MMA are ranked according to MSE, MAPE, and MAD error metrics for both AIMR and TMAX patterns. If an individual GCMs were to be randomly selected (out of the 7 here), there is a 3/7 (43%) chance or 4/7 (57%) chance of selecting a model that performs better than the MMA for AIMR, depending on metric. There is a 1/7 (14%) or 0/7 (0%) chance that the chosen model performs better than MMA for TMAX, depending on metric. Table S3: Parameters of sinusoidal fit for observed, each of the seven GCM and the MMA The parameters for the overall sinusoidal fit are tabulated, corresponding to Figure S2.
15 Table S1 AIMR (De-trended MAA) (Best Model BCCR) MSE 49.1%.5*BCCR +.5*GISS MAD 35.8% BCCR MAPE 46.9% BCCR
16 Table S2 a. AIMR Rank MAPE MSE MAD (BCCR) 0.02 (BCCR) 0.11 (BCCR) (INM) (INM) (INM) (GISS) (GISS) 0.14 (GISS) (MMA) (MMA) 0.16 (CSIRO) (CSIRO) 0.04 (CSIRO) 0.17 (MMA) (MIROCMED) 0.05 (MIROCMED) 0.18 (MIROCMED) (PCM) 0.07 (PCM) 0.22 (PCM) (MIROC-HI) 0.11 (MIROC-HI) 0.29 (MIROC-HI) b. TMAX Rank MAPE MSE MAD (INM) (MMA) 0.09 (MMA) (MMA) (PCM) 0.11 (INM) (PCM) (INM) 0.12 (PCM) (MIROC-HI) (MIROCMED) 0.13 (MIROCMED) (MIROCMED) 0.04 (MIROCHI) 0.16 (MIROCHI) (CSIRO) 0.08 (CSIRO) 0.22 (CSIRO) (BCCR) 0.10 (BCCR) 0.29 (GISS) (GISS) 0.11 (GISS) 0.30 (BCCR)
17 Table S3 Rainfall A C N φ MSE Peaks Troughs Observed , , 1900,1967 BCCR , ,1905,1954 MIROC- HiRes No peak 1940 MIROC No visible periodicity MedRes INM-CM No visible periodicity NCAR- PCM , CSIRO No visible periodicity MK3 GISS No visible periodicity AOM MMA No visible periodicity
Using observations to constrain climate project over the Amazon - Preliminary results and thoughts
 Using observations to constrain climate project over the Amazon - Preliminary results and thoughts Rong Fu & Wenhong Li Georgia Tech. & UT Austin CCSM Climate Variability Working Group Session June 19,
Long Range Forecasts of 2015 SW and NE Monsoons and its Verification D. S. Pai Climate Division, IMD, Pune
 Long Range Forecasts of 2015 SW and NE Monsoons and its Verification D. S. Pai Climate Division, IMD, Pune Other Contributors: Soma Sen Roy, O. P. Sreejith, Kailas, Madhuri, Pallavi, Mahendra and Jasmine
Rainfall is the most important climate element affecting the livelihood and wellbeing of the
 Ensemble-Based Empirical Prediction of Ethiopian Monthly-to-Seasonal Monsoon Rainfall Rainfall is the most important climate element affecting the livelihood and wellbeing of the majority of Ethiopians.
Evidence for Weakening of Indian Summer Monsoon and SA CORDEX Results from RegCM
 Evidence for Weakening of Indian Summer Monsoon and SA CORDEX Results from RegCM S K Dash Centre for Atmospheric Sciences Indian Institute of Technology Delhi Based on a paper entitled Projected Seasonal
Tracking Climate Models
 Tracking Climate Models Claire Monteleoni,GavinA.Schmidt,ShaileshSaroha 3 and Eva Asplund 3,4 Center for Computational Learning Systems, Columbia University, New York, NY, USA Center for Climate Systems
SUPPLEMENTARY INFORMATION
 Effect of remote sea surface temperature change on tropical cyclone potential intensity Gabriel A. Vecchi Geophysical Fluid Dynamics Laboratory NOAA Brian J. Soden Rosenstiel School for Marine and Atmospheric
Supplementary Figure 1 Current and future distribution of temperate drylands. (a b-f b-f
 Supplementary Figure 1 Current and future distribution of temperate drylands. (a) Five temperate dryland regions with their current extent for 1980-2010 (green): (b) South America; (c) North America; (d)
NARCliM Technical Note 1. Choosing GCMs. Issued: March 2012 Amended: 29th October Jason P. Evans 1 and Fei Ji 2
 NARCliM Technical Note 1 Issued: March 2012 Amended: 29th October 2012 Choosing GCMs Jason P. Evans 1 and Fei Ji 2 1 Climate Change Research Centre, University of New South Wales, Sydney, Australia 2 New
EL NIÑO MODOKI IMPACTS ON AUSTRALIAN RAINFALL
 EL NIÑO MODOKI IMPACTS ON AUSTRALIAN RAINFALL Andréa S. Taschetto*, Alexander Sen Gupta, Caroline C. Ummenhofer and Matthew H. England Climate Change Research Centre (CCRC), University of New South Wales,
Supplementary Information for:
 Supplementary Information for: Linkage between global sea surface temperature and hydroclimatology of a major river basin of India before and after 1980 P. Sonali, Ravi S. Nanjundiah, & D. Nagesh Kumar
SUPPLEMENTARY INFORMATION
 SUPPLEMENTARY INFORMATION DOI: 10.1038/NGEO1189 Different magnitudes of projected subsurface ocean warming around Greenland and Antarctica Jianjun Yin 1*, Jonathan T. Overpeck 1, Stephen M. Griffies 2,
SUPPLEMENTARY FIGURES. Figure S1) Monthly mean detrended N 2 O residuals from NOAA/CCGG and NOAA/CATS networks at Barrow, Alaska.
 Monthly mean detrended N 2 O residuals from NOAA/CCGG and NOAA/CATS networks at Barrow, Alaska.") SUPPLEMENTARY FIGURES Figure S1) Monthly mean detrended N 2 O residuals from NOAA/CCGG and NOAA/CATS networks at Barrow, Alaska. 1 Figure S2) Monthly mean detrended N 2 O residuals from CSIRO and NOAA/CCGG
SUPPLEMENTARY FIGURES Figure S1) Monthly mean detrended N 2 O residuals from NOAA/CCGG and NOAA/CATS networks at Barrow, Alaska. 1 Figure S2) Monthly mean detrended N 2 O residuals from CSIRO and NOAA/CCGG
Seasonal forecasting of climate anomalies for agriculture in Italy: the TEMPIO Project
 Seasonal forecasting of climate anomalies for agriculture in Italy: the TEMPIO Project M. Baldi(*), S. Esposito(**), E. Di Giuseppe (**), M. Pasqui(*), G. Maracchi(*) and D. Vento (**) * CNR IBIMET **
Contribution of Monthly and Regional Rainfall to the Strength of Indian Summer Monsoon
 VOLUME 144 M O N T H L Y W E A T H E R R E V I E W SEPTEMBER 2016 Contribution of Monthly and Regional Rainfall to the Strength of Indian Summer Monsoon YANGXING ZHENG AND M. M. ALI Center for Ocean Atmospheric
NOTES AND CORRESPONDENCE. On the Seasonality of the Hadley Cell
 1522 JOURNAL OF THE ATMOSPHERIC SCIENCES VOLUME 60 NOTES AND CORRESPONDENCE On the Seasonality of the Hadley Cell IOANA M. DIMA AND JOHN M. WALLACE Department of Atmospheric Sciences, University of Washington,
Supplementary Figure 1 Observed change in wind and vertical motion. Anomalies are regime differences between periods and obtained
 Supplementary Figure 1 Observed change in wind and vertical motion. Anomalies are regime differences between periods 1999 2013 and 1979 1998 obtained from ERA-interim. Vectors are horizontal wind at 850
Long Range Forecast Update for 2014 Southwest Monsoon Rainfall
 Earth System Science Organization (ESSO) Ministry of Earth Sciences (MoES) India Meteorological Department PRESS RELEASE New Delhi, 9 June 2014 Long Update for 2014 Southwest Monsoon Rainfall HIGHLIGHTS
SUPPLEMENTARY INFORMATION
 doi:10.1038/nature11576 1. Trend patterns of SST and near-surface air temperature Bucket SST and NMAT have a similar trend pattern particularly in the equatorial Indo- Pacific (Fig. S1), featuring a reduced
Current status and prospects of Extended range prediction of Indian summer monsoon using CFS model
 Current status and prospects of Extended range prediction of Indian summer monsoon using CFS model Dr. A. K. Sahai Indian Institute of Tropical Meteorology, Pune 411 008, INDIA E-mail: sahai@tropmet.res.in
Downscaling in Time. Andrew W. Robertson, IRI. Advanced Training Institute on Climate Variability and Food Security, 12 July 2002
 Downscaling in Time Andrew W. Robertson, IRI Advanced Training Institute on Climate Variability and Food Security, 12 July 2002 Preliminaries Crop yields are driven by daily weather variations! Current
Seasonal Climate Watch January to May 2016
 Seasonal Climate Watch January to May 2016 Date: Dec 17, 2015 1. Advisory Most models are showing the continuation of a strong El-Niño episode towards the latesummer season with the expectation to start
Verification of the Seasonal Forecast for the 2005/06 Winter
 Verification of the Seasonal Forecast for the 2005/06 Winter Shingo Yamada Tokyo Climate Center Japan Meteorological Agency 2006/11/02 7 th Joint Meeting on EAWM Contents 1. Verification of the Seasonal
Comparison of Short-Term and Long-Term Radiative Feedbacks and Variability in Twentieth-Century Global Climate Model Simulations
 15 DECEMBER 2013 D A L T O N A N D S H E L L 10051 Comparison of Short-Term and Long-Term Radiative Feedbacks and Variability in Twentieth-Century Global Climate Model Simulations MEGHAN M. DALTON Oregon
Supplementary Figures
 Supplementary Figures Supplementary Figure 1: The partial correlation coefficient of NDVI GS and GT for the first 15 years (1982-1996) and the last 15 years (1997-211) with five different definition of
Experiments with Statistical Downscaling of Precipitation for South Florida Region: Issues & Observations
 Experiments with Statistical Downscaling of Precipitation for South Florida Region: Issues & Observations Ramesh S. V. Teegavarapu Aneesh Goly Hydrosystems Research Laboratory (HRL) Department of Civil,
Low-level wind, moisture, and precipitation relationships near the South Pacific Convergence Zone in CMIP3/CMIP5 models
 Low-level wind, moisture, and precipitation relationships near the South Pacific Convergence Zone in CMIP3/CMIP5 models Matthew J. Niznik and Benjamin R. Lintner Rutgers University 25 April 2012 niznik@envsci.rutgers.edu
SUPPLEMENTARY INFORMATION
 Intensification of Northern Hemisphere Subtropical Highs in a Warming Climate Wenhong Li, Laifang Li, Mingfang Ting, and Yimin Liu 1. Data and Methods The data used in this study consists of the atmospheric
Climate Forecast Applications Network (CFAN)
") Forecast of 2018 Atlantic Hurricane Activity April 5, 2018 Summary CFAN s inaugural April seasonal forecast for Atlantic tropical cyclone activity is based on systematic interactions among ENSO, stratospheric
Forecast of 2018 Atlantic Hurricane Activity April 5, 2018 Summary CFAN s inaugural April seasonal forecast for Atlantic tropical cyclone activity is based on systematic interactions among ENSO, stratospheric
Seasonal Climate Outlook for South Asia (June to September) Issued in May 2014
 Issued in May 2014") Ministry of Earth Sciences Earth System Science Organization India Meteorological Department WMO Regional Climate Centre (Demonstration Phase) Pune, India Seasonal Climate Outlook for South Asia (June
Ministry of Earth Sciences Earth System Science Organization India Meteorological Department WMO Regional Climate Centre (Demonstration Phase) Pune, India Seasonal Climate Outlook for South Asia (June
ENSO and April SAT in MSA. This link is critical for our regression analysis where ENSO and
 Supplementary Discussion The Link between El Niño and MSA April SATs: Our study finds a robust relationship between ENSO and April SAT in MSA. This link is critical for our regression analysis where ENSO
SUPPLEMENTARY INFORMATION
 In the format provided by the authors and unedited. SUPPLEMENTARY INFORMATION DOI: 10.1038/NGEO2988 Hemispheric climate shifts driven by anthropogenic aerosol-cloud interactions Eui-Seok Chung and Brian
Impact of overestimated ENSO variability in the relationship between ENSO and East Asian summer rainfall
 JOURNAL OF GEOPHYSICAL RESEARCH: ATMOSPHERES, VOL. 118, 6200 6211, doi:10.1002/jgrd.50482, 2013 Impact of overestimated ENSO variability in the relationship between ENSO and East Asian summer rainfall
Seasonal Climate Watch June to October 2018
 Seasonal Climate Watch June to October 2018 Date issued: May 28, 2018 1. Overview The El Niño-Southern Oscillation (ENSO) has now moved into the neutral phase and is expected to rise towards an El Niño
Status of monsoon prediction. Dr Andy Turner. Part II
 WCRP-JNU Training School on Monsoon Variability in Changing Climate Status of monsoon prediction Dr Andy Turner Part II Outline: part II Decadal time scales & the global monsoon Linking interannual and
Contents of this file
 Geophysical Research Letters Supporting Information for Future changes in tropical cyclone activity in high-resolution large-ensemble simulations Kohei Yoshida 1, Masato Sugi 1, Ryo Mizuta 1, Hiroyuki
Evaluating a Genesis Potential Index with Community Climate System Model Version 3 (CCSM3) By: Kieran Bhatia
 By: Kieran Bhatia") Evaluating a Genesis Potential Index with Community Climate System Model Version 3 (CCSM3) By: Kieran Bhatia I. Introduction To assess the impact of large-scale environmental conditions on tropical cyclone
Evaluating a Genesis Potential Index with Community Climate System Model Version 3 (CCSM3) By: Kieran Bhatia I. Introduction To assess the impact of large-scale environmental conditions on tropical cyclone
A revival of Indian summer monsoon rainfall since 2002
 In the format provided by the authors and unedited. SUPPLEMENTARY INFORMATION DOI: 10.1038/NCLIMATE3348 A revival of Indian summer monsoon rainfall since 2002 Qinjian Jin and Chien Wang* Center for Global
Robust Arctic sea-ice influence on the frequent Eurasian cold winters in past decades
 SUPPLEMENTARY INFORMATION DOI: 10.1038/NGEO2277 Robust Arctic sea-ice influence on the frequent Eurasian cold winters in past decades Masato Mori 1*, Masahiro Watanabe 1, Hideo Shiogama 2, Jun Inoue 3,
Seasonal Climate Watch April to August 2018
 Seasonal Climate Watch April to August 2018 Date issued: Mar 23, 2018 1. Overview The El Niño-Southern Oscillation (ENSO) is expected to weaken from a moderate La Niña phase to a neutral phase through
1 Ministry of Earth Sciences, Lodi Road, New Delhi India Meteorological Department, Lodi Road, New Delhi
 Trends in Extreme Temperature Events over India during 1969-12 A. K. JASWAL, AJIT TYAGI 1 and S. C. BHAN 2 India Meteorological Department, Shivajinagar, Pune - 4105 1 Ministry of Earth Sciences, Lodi
Global Warming, the AMO, and North Atlantic Tropical Cyclones
 Global Warming, the AMO, and North Atlantic Tropical Cyclones revised for Eos 5/17/06 BY M.E. MANN AND K.A. EMANUEL Increases in key measures of Atlantic hurricane activity over recent decades are believed
Chapter 2 Variability and Long-Term Changes in Surface Air Temperatures Over the Indian Subcontinent
 Chapter 2 Variability and Long-Term Changes in Surface Air Temperatures Over the Indian Subcontinent A.K. Srivastava, D.R. Kothawale and M.N. Rajeevan 1 Introduction Surface air temperature is one of the
SUPPLEMENTARY INFORMATION
 doi:10.1038/nature12310 We present here two additional Tables (Table SI-1, 2) and eight further Figures (Figures SI-1 to SI-8) to provide extra background information to the main figures of the paper.
Applying the ergodic assumption to ensembles of non-stationary simulations by using the CMIP3 multi-model dataset
 Applying the ergodic assumption to ensembles of non-stationary simulations by using the CMIP3 multi-model dataset Martin Leduc, René Laprise, Ramón de Eĺıa and Leo Separovic ESCER Centre - UQAM May 30,
Land Surface: Snow Emanuel Dutra
 Land Surface: Snow Emanuel Dutra emanuel.dutra@ecmwf.int Slide 1 Parameterizations training course 2015, Land-surface: Snow ECMWF Outline Snow in the climate system, an overview: Observations; Modeling;
El Niño 2015 Conference
 El Niño 2015 Conference Case Study: El Nino of 2015 and the Indian summer monsoon Sulochana Gadgil (on the basis of inputs from IMD) IRI, 17 November 2015 All-India rainfall: The mean monthly rainfall
Human influence on terrestrial precipitation trends revealed by dynamical
 1 2 3 Supplemental Information for Human influence on terrestrial precipitation trends revealed by dynamical adjustment 4 Ruixia Guo 1,2, Clara Deser 1,*, Laurent Terray 3 and Flavio Lehner 1 5 6 7 1 Climate
TRACKING CLIMATE MODELS
 TRACKING CLIMATE MODELS CLAIRE MONTELEONI, GAVIN A. SCHMIDT, SHAILESH SAROHA 3, AND EVA ASPLUND 3,4 Abstract. Climate models are complex mathematical models designed by meteorologists, geophysicists, and
The Abnormal Indian Summer Monsoon of 2002: JRA25 Reanalysis
 The Abnormal Indian Summer Monsoon of 2002: JRA25 Reanalysis D. Rajan 1,2, T. Koike 2, J. Matsumoto 2 1 NCMRWF, Ministry of Earth Sciences, India 2 CEOP Lab, University of Tokyo, Japan Correspondence:
A logistic regression approach for monthly rainfall forecasts in meteorological subdivisions of India based on DEMETER retrospective forecasts
 INTERNATIONAL JOURNAL OF CLIMATOLOGY Int. J. Climatol. 30: 1577 1588 (2010) Published online 29 September 2009 in Wiley InterScience (www.interscience.wiley.com) DOI: 10.1002/joc.2019 A logistic regression
Vertical wind shear in relation to frequency of Monsoon Depressions and Tropical Cyclones of Indian Seas
 Vertical wind shear in relation to frequency of Monsoon Depressions and Tropical Cyclones of Indian Seas Prince K. Xavier and P.V. Joseph Department of Atmospheric Sciences Cochin University of Science
the 2 past three decades
 SUPPLEMENTARY INFORMATION DOI: 10.1038/NCLIMATE2840 Atlantic-induced 1 pan-tropical climate change over the 2 past three decades 3 4 5 6 7 8 9 10 POP simulation forced by the Atlantic-induced atmospheric
Detection of external influence on Northern Hemispheric snow cover
 Detection of external influence on Northern Hemispheric snow cover Tianshu Ma 1, Xuebin Zhang 1,2 Helene Massam 1, Francis Zwiers 3 Georges Monette 1, David Robinson 4 1 Dept. of Mathematics and Statistics,
Future Projections of the Large Scale Meteorology Associated with California Heat Waves in CMIP5 Models
 1 2 3 4 5 6 7 Supporting Information for Future Projections of the Large Scale Meteorology Associated with California Heat Waves in CMIP5 Models Erool Palipane 1 and Richard Grotjahn 1* 1 Department of
SUPPLEMENTARY INFORMATION
 SUPPLEMENTARY INFORMATION DOI: 1.138/NCLIMATE1327 Lack of uniform trends but increasing spatial variability in observed Indian rainfall extremes SI Guide Supplementary Information Title of the file: Supplementary
Climate Downscaling 201
 Climate Downscaling 201 (with applications to Florida Precipitation) Michael E. Mann Departments of Meteorology & Geosciences; Earth & Environmental Systems Institute Penn State University USGS-FAU Precipitation
Annular mode time scales in the Intergovernmental Panel on Climate Change Fourth Assessment Report models
 Click Here for Full Article GEOPHYSICAL RESEARCH LETTERS, VOL. 35, L22707, doi:10.1029/2008gl035712, 2008 Annular mode time scales in the Intergovernmental Panel on Climate Change Fourth Assessment Report
Impact of the Atlantic Multidecadal Oscillation on the Asian summer monsoon
 GEOPHYSICAL RESEARCH LETTERS, VOL. 33, L24701, doi:10.1029/2006gl027655, 2006 Impact of the Atlantic Multidecadal Oscillation on the Asian summer monsoon Riyu Lu, 1,2 Buwen Dong, 3 and Hui Ding 2,4 Received
The South Eastern Australian Climate Initiative
 The South Eastern Australian Climate Initiative Phase 2 of the South Eastern Australian Climate Initiative (SEACI) is a three-year (2009 2012), $9 million research program investigating the causes and
Chapter 4 Inter-Annual and Long-Term Variability
 Chapter 4 Inter-Annual and Long-Term Variability 4.1 General Rainfa\\ is the most imllortant weather element for India, a trollica\ country. Agriculture, hydro-electric power, industry and the economy
Will a warmer world change Queensland s rainfall?
 Will a warmer world change Queensland s rainfall? Nicholas P. Klingaman National Centre for Atmospheric Science-Climate Walker Institute for Climate System Research University of Reading The Walker-QCCCE
NOTES AND CORRESPONDENCE. Improving Week-2 Forecasts with Multimodel Reforecast Ensembles
 AUGUST 2006 N O T E S A N D C O R R E S P O N D E N C E 2279 NOTES AND CORRESPONDENCE Improving Week-2 Forecasts with Multimodel Reforecast Ensembles JEFFREY S. WHITAKER AND XUE WEI NOAA CIRES Climate
The 2010/11 drought in the Horn of Africa: Monitoring and forecasts using ECMWF products
 The 2010/11 drought in the Horn of Africa: Monitoring and forecasts using ECMWF products Emanuel Dutra Fredrik Wetterhall Florian Pappenberger Souhail Boussetta Gianpaolo Balsamo Linus Magnusson Slide
Kalimantan realistically (Figs. 8.23a-d). Also, the wind speeds of the westerly
. Also, the wind speeds of the westerly") suppressed rainfall rate (maximum vertical velocity) around 17 LST (Figs. 8.21a-b). These results are in agreement with previous studies (e. g., Emanuel and Raymond 1994). The diurnal variation of maximum
suppressed rainfall rate (maximum vertical velocity) around 17 LST (Figs. 8.21a-b). These results are in agreement with previous studies (e. g., Emanuel and Raymond 1994). The diurnal variation of maximum
2.6 Operational Climate Prediction in RCC Pune: Good Practices on Downscaling Global Products. D. S. Pai Head, Climate Prediction Group
 SECOND WMO WORKSHOP ON OPERATIONAL CLIMATE PREDICTION 30 May - 1 June 2018, Barcelona, Spain 2.6 Operational Climate Prediction in RCC Pune: Good Practices on Downscaling Global Products D. S. Pai Head,
Predicting South Asian Monsoon through Spring Predictability Barrier
 Predicting South Asian Monsoon through Spring Predictability Barrier Suryachandra A. Rao Associate Mission Director, Monsoon Mission Project Director, High Performance Computing Indian Institute of Tropical
PUMA toolbox. OCCRI.net Oregon State University. Philip Mote. Philip Mote
 PUMA toolbox Philip Mote OCCRI.net Oregon State University Philip Mote CMIP3 CMIP5 NARCCAP regcpdn WRF delta BCSD CA BCCA MACA etc. observations reanalysis PRISM eractive chemical or biochemical components.
Future pattern of Asian drought under global warming scenario
 Future pattern of Asian drought under global warming scenario Kim D.W., Byun H.R., Lee S.M. in López-Francos A. (ed.). Drought management: scientific and technological innovations Zaragoza : CIHEAM Options
The Influence of Solar Activity on the Rainfall over India: Cycle-to-Cycle Variations
 J. Astrophys. Astr. (2006) 27, 367 372 The Influence of Solar Activity on the Rainfall over India: Cycle-to-Cycle Variations K. M. Hiremath Indian Institute of Astrophysics, Bangalore 560 034, India. e-mail:
The 2009 Hurricane Season Overview
 The 2009 Hurricane Season Overview Jae-Kyung Schemm Gerry Bell Climate Prediction Center NOAA/ NWS/ NCEP 1 Overview outline 1. Current status for the Atlantic, Eastern Pacific and Western Pacific basins
UPDATE OF REGIONAL WEATHER AND SMOKE HAZE (December 2017)
") UPDATE OF REGIONAL WEATHER AND SMOKE HAZE (December 2017) 1. Review of Regional Weather Conditions for November 2017 1.1 In November 2017, Southeast Asia experienced inter-monsoon conditions in the first
UPDATE OF REGIONAL WEATHER AND SMOKE HAZE (December 2017) 1. Review of Regional Weather Conditions for November 2017 1.1 In November 2017, Southeast Asia experienced inter-monsoon conditions in the first
Decreased monsoon precipitation in the Northern Hemisphere due to anthropogenic aerosols
 Decreased monsoon precipitation in the Northern Hemisphere due to anthropogenic aerosols Article Supplemental Material Polson, D., Bollasina, M., Hegerl, G. C. and Wilcox, L. J. (214) Decreased monsoon
Altiplano Climate. Making Sense of 21st century Scenarios. A. Seth J. Thibeault C. Valdivia
 Altiplano Climate Making Sense of 21st century Scenarios A. Seth J. Thibeault C. Valdivia Overview Coupled Model Intercomparison Project (CMIP3) How do models represent Altiplano climate? What do models
Effect of rainfall and temperature on rice yield in Puri district of Odisha in India
 2018; 7(4): 899-903 ISSN (E): 2277-7695 ISSN (P): 2349-8242 NAAS Rating: 5.03 TPI 2018; 7(4): 899-903 2018 TPI www.thepharmajournal.com Received: 05-02-2018 Accepted: 08-03-2018 A Baliarsingh A Nanda AKB
Karonga Climate Profile: Full Technical Version
 Karonga Climate Profile: Full Technical Version Prepared by: University of Cape Town November 2017 For enquiries regarding this Climate Profile, please contact Lisa van Aardenne (lisa@csag.uct.ac.za) or
Multi-model Projection of July August Climate Extreme Changes over China under CO 2 Doubling. Part I: Precipitation
 ADVANCES IN ATMOSPHERIC SCIENCES, VOL. 28, NO. 2, 2011, 433 447 Multi-model Projection of July August Climate Extreme Changes over China under CO 2 Doubling. Part I: Precipitation LI Hongmei 1,2 ( ), FENG
Decrease of light rain events in summer associated with a warming environment in China during
 GEOPHYSICAL RESEARCH LETTERS, VOL. 34, L11705, doi:10.1029/2007gl029631, 2007 Decrease of light rain events in summer associated with a warming environment in China during 1961 2005 Weihong Qian, 1 Jiaolan
KUALA LUMPUR MONSOON ACTIVITY CENT
 T KUALA LUMPUR MONSOON ACTIVITY CENT 2 ALAYSIAN METEOROLOGICAL http://www.met.gov.my DEPARTMENT MINISTRY OF SCIENCE. TECHNOLOGY AND INNOVATIO Introduction Atmospheric and oceanic conditions over the tropical
Interactive comment on Understanding the Australian Monsoon change during the Last Glacial Maximum with multi-model ensemble by Mi Yan et al.
 Clim. Past Discuss., https://doi.org/10.5194/cp-2018-24-ac1, 2018 Author(s) 2018. This work is distributed under the Creative Commons Attribution 4.0 License. Interactive comment on Understanding the Australian
Evaluation and diagnosis of General Circulation Climate Models (GCMs) Iñigo Errasti Arrieta
 Iñigo Errasti Arrieta") Evaluation and diagnosis of General Circulation Climate Models (GCMs) Iñigo Errasti Arrieta inigo.errasti@ehu.es EOLO Research Group on Meteorology, Climate and Environment www.ehu.es/eolo/index.html Dept.
Evaluation and diagnosis of General Circulation Climate Models (GCMs) Iñigo Errasti Arrieta inigo.errasti@ehu.es EOLO Research Group on Meteorology, Climate and Environment www.ehu.es/eolo/index.html Dept.
The study of the impact of climate variability on Aman rice yield of Bangladesh
 The study of the impact of climate variability on Aman rice yield of Bangladesh Toma Rani Saha 1 and Dewan Abdul Quadir 2 Abstract An attempt has been made to investigate the relationship of climate variability
NIWA Outlook: October - December 2015
 October December 2015 Issued: 1 October 2015 Hold mouse over links and press ctrl + left click to jump to the information you require: Overview Regional predictions for the next three months: Northland,
particular regional weather extremes
 SUPPLEMENTARY INFORMATION DOI: 1.138/NCLIMATE2271 Amplified mid-latitude planetary waves favour particular regional weather extremes particular regional weather extremes James A Screen and Ian Simmonds
More extreme precipitation in the world s dry and wet regions
 More extreme precipitation in the world s dry and wet regions Markus G. Donat, Andrew L. Lowry, Lisa V. Alexander, Paul A. O Gorman, Nicola Maher Supplementary Table S1: CMIP5 simulations used in this
Journal of of Computer Applications Research Research and Development and Development (JCARD), ISSN (Print), ISSN
, ISSN (Print), ISSN") JCARD Journal of of Computer Applications Research Research and Development and Development (JCARD), ISSN 2248-9304(Print), ISSN 2248-9312 (JCARD),(Online) ISSN 2248-9304(Print), Volume 1, Number ISSN
JCARD Journal of of Computer Applications Research Research and Development and Development (JCARD), ISSN 2248-9304(Print), ISSN 2248-9312 (JCARD),(Online) ISSN 2248-9304(Print), Volume 1, Number ISSN
Glossary. The ISI glossary of statistical terms provides definitions in a number of different languages:
 Glossary The ISI glossary of statistical terms provides definitions in a number of different languages: http://isi.cbs.nl/glossary/index.htm Adjusted r 2 Adjusted R squared measures the proportion of the
Dynamics of summer monsoon active phases and onset over Pakistan
 Dynamics of summer monsoon active phases and onset over Pakistan F. S. Syed 1, J. H. Yoo 2, H. Körnich 3, F. Kucharski 2 and M. Latif 1 1) Department of Meteorology, COMSATS Institute of Information Technology,
Seasonal Rainfall Trend Analysis
 RESEARCH ARTICLE OPEN ACCESS Seasonal Rainfall Trend Analysis Devdatta V. Pandit Research Scholar, Dept. of SWCE, M.P.K.V, Rahuri- 413722, Ahmednagar. (M., India ABSTRACT This study aims to detect the
The climate change penalty on US air quality: New perspectives from statistical models
 The climate change penalty on US air quality: New perspectives from statistical models Charles River Path, Boston, July 2010 Salt Lake City, January 2013 Loretta J. Mickley, Lu Shen, Xu Yue Harvard University
Water management in a semi-arid region: an analogue algorithm approach for rainfall seasonal forecasting
 Water management in a semi-arid region: an analogue algorithm approach for rainfall seasonal forecasting Maracchi G., M. Pasqui and F. Piani IBIMET-CNR Consiglio Nazionale delle Ricerche INTERNATIONAL
Dengue Forecasting Project
 Dengue Forecasting Project In areas where dengue is endemic, incidence follows seasonal transmission patterns punctuated every few years by much larger epidemics. Because these epidemics are currently
SEASONAL CLIMATE PREDICTION
 SEASONAL CLIMATE PREDICTION David Walland Australian Bureau of Meteorology WMO RA-V Seminar on Climate Services Honiara, Solomon Islands, 1-4 November 2011 Overview Major climate Drivers in the region
High initial time sensitivity of medium range forecasting observed for a stratospheric sudden warming
 GEOPHYSICAL RESEARCH LETTERS, VOL. 37,, doi:10.1029/2010gl044119, 2010 High initial time sensitivity of medium range forecasting observed for a stratospheric sudden warming Yuhji Kuroda 1 Received 27 May
Stochastic Hydrology. a) Data Mining for Evolution of Association Rules for Droughts and Floods in India using Climate Inputs
 Data Mining for Evolution of Association Rules for Droughts and Floods in India using Climate Inputs") Stochastic Hydrology a) Data Mining for Evolution of Association Rules for Droughts and Floods in India using Climate Inputs An accurate prediction of extreme rainfall events can significantly aid in policy
Stochastic Hydrology a) Data Mining for Evolution of Association Rules for Droughts and Floods in India using Climate Inputs An accurate prediction of extreme rainfall events can significantly aid in policy
Meta-heuristic ant colony optimization technique to forecast the amount of summer monsoon rainfall: skill comparison with Markov chain model
 Meta-heuristic ant colony optimization technique to forecast the amount of summer monsoon rainfall: skill comparison with Markov chain model Presented by Sayantika Goswami 1 Introduction Indian summer
Evidence Linking Arctic Amplification with Changing Weather Patterns in Mid-Latitudes
 Evidence Linking Arctic Amplification with Changing Weather Patterns in Mid-Latitudes Jennifer Francis Institute of Marine and Coastal Sciences Rutgers, the State University of New Jersey Steve Vavrus
Seasonal Climate Watch July to November 2018
 Seasonal Climate Watch July to November 2018 Date issued: Jun 25, 2018 1. Overview The El Niño-Southern Oscillation (ENSO) is now in a neutral phase and is expected to rise towards an El Niño phase through
Impacts of Climate Change on Surface Water in the Onkaparinga Catchment
 Impacts of Climate Change on Surface Water in the Onkaparinga Catchment Final Report Volume 2: Hydrological Evaluation of the CMIP3 and CMIP5 GCMs and the Non-homogenous Hidden Markov Model (NHMM) Westra,
Interdecadal variation in rainfall patterns in South West of Western Australia
 Interdecadal variation in rainfall patterns in South West of Western Australia Priya 1 and Bofu Yu 2 1 PhD Candidate, Australian Rivers Institute and School of Engineering, Griffith University, Brisbane,
NOAA 2015 Updated Atlantic Hurricane Season Outlook
 NOAA 2015 Updated Atlantic Hurricane Season Outlook Dr. Gerry Bell Lead Seasonal Forecaster Climate Prediction Center/ NOAA/ NWS Collaboration With National Hurricane Center/ NOAA/ NWS Hurricane Research