Characterizing Tidal Inundation of Wetlands in the Murderkill Estuary (Kent County, DE)
|
|
|
- Noel Alexander
- 6 years ago
- Views:
Transcription
1 Characterizing Tidal Inundation of Wetlands in the Murderkill Estuary (Kent County, DE) Tom McKenna Delaware Geological Survey University of Delaware Thermal Imaging Can temperature be used as an indicator of inundation? LiDAR Surface Elevation Tidal Inundation January 14, 2009 Supported by Kent County & Delaware DNREC
 Question: appropriate TMDLs for")
 river / marsh biogeochemical i interaction?")
2 What causes low DO in the tidal Murderkill River? Issue: low DO (EPA impaired waters ) Question: appropriate TMDLs for nutrients? (EPA pollution control strategy ) river / marsh biogeochemical i interaction? ti Webbs Marsh July 3, 2008 low tide WWTP extensive salt marsh Waste Water Treatment Plant? NJ DE Bay DE


3 McGinnis Pond Cou rse y Pond Andrews Lake McColley Pond De laware Ba y Primary Research Question What processes, sources, and sinks control low DO in the tidal Murderkill River? Numerical Water-Quality Modeling site-specificspecific conceptual models and input data parameterizations of processes that are difficult to model explicitly and/or require information not easily obtainable tidal inundation of marshes biogeochemical cycling in marshes nutrient fluxes in/out marshes primary productivity sediment oxygen demand WWTP

 inundation / vegetation relationship very dynamic")


4 Tidal inundation of marshes The flow of water on salt marsh platforms is still poorly characterized. New conceptual models are being developed. Challenges: microtopography groundwater / surface-water interaction anthropogenic alteration (since late 1600s) inundation / vegetation relationship very dynamic system dense vegetation overland flow in estuary-scalescale models marsh platform upland primary tidal channel secondary tidal channel Discrepancies in tidal phase and elevation in a numerical model can be accommodated by the modeling calibration process but can severely limit the explanatory power and predictive capabilities of the model. (French, 2003)
5 Methods for determining inundation Hydrodynamic Model (Overland Flow) Tide Gages Elevation Survey Vegetation Survey Comment Model based on distribution of vegetation communities (indirect) No Few Yes Yes assumes correct No No No Yes conceptual model Model based on tide and ground-surface elevation (direct) Yes Many ground-based Yes Cadillac Yes/No Many/Few ground-based or LiDAR Yes/No No Few LiDAR No Temperature
6 common x,y,z datum apples to apples Components of elevation marsh surface (LiDAR) very low relief minimize error and remove bias instrument locations (e.g. tide level) preliminary inundation model highly parameterized data loggers Inundation Study water level, temperature, and salinity time-series to document inundation and develop & test models air temperature & pressure, solar radiation temperature on marsh platform (air/water) Can we use temperature as an indicator of inundation? thermal imaging Can we use temperature as an indicator of inundation?
7 Model for tidal inundation Preliminary model makes VERY simple (and wrong) assumption of Instantaneous inundation of entire marsh based on water elevation at Bowers Beach. How wrong? Working towards more complex representation: tidal propagation: function for instantaneous tide level for specified reaches of Murderkill River using data from tide gages at Frederica and Bowers Beach TL r = f(xr,t) assign TL r to a subset of marshes along the reach marsh subset inundated based on TL r and set of spatial parameters representing (raster layers): marsh elevation attenuation/amplification of tidal amplitude phase shift of tide based on distance from river/creek/ditch
. Marsh platform instrumentation?")
? Water flow and heat transfer are highly-coupled processes.")
8 Testing model of tidal inundation Direct measurement: water level, temperature, and salinity in tidal creeks / ditches using data loggers (time and instrument intensive). Marsh platform instrumentation? ALTERNATIVE: Can observations of environmental temperature be used to capture spatio-temporal temporal dynamics of inundation (less expensive, more representative of spatial heterogeneity)? Water flow and heat transfer are highly-coupled processes. 7:19 DST 105 Temperature loggers on marsh platform Environmental Thermography
9 common x,y,z datum apples to apples Components of elevation marsh surface (LiDAR) very low relief minimize error and remove bias instrument locations (e.g. tide level) preliminary inundation model highly parameterized data loggers Inundation Study water level, temperature, and salinity time-series to document inundation and develop & test models air temperature & pressure, solar radiation temperature on marsh platform (air/water) Can we use temperature as an indicator of inundation? thermal imaging Can we use temperature as an indicator of inundation?
10 Establishing a common vertical datum low relief on marsh platforms so minimizing elevation error and bias is critical asset source datum vertical type datum LiDAR monuments USGS DELDOT ellipsoidal ellipsoidal NAD83 NAD83 monuments NGS ellipsoidal NAD83 monuments NGS orthometric NAVD88 tide gages USGS orthometric NGVD29 tide prediction NOAA tidal MLLW Geoid model: GEOID03 / VDATUM software (NOAA) convert between ellipsoid, orthometric, and tidal datums Conducted least squares adjusted GPS-RTK survey 8 reference monuments; minimally constrained
11 Survey corrections Elevation adjustments of up to 55 cm! Significant for accurate modeling of marsh platform inundation and hydrodynamics in river. Correction (m) Location reference elevation value NGVD29 to NAVD88 least square adjust Total (m) USGS Bowers gage USGS Webbs gage USGS Frederica gage N Bowers ref. monument Barretts Ch. ref. monument LiDAR ref. monument
12 common x,y,z datum apples to apples Components of elevation marsh surface (LiDAR) very low relief minimize error and remove bias instrument locations (e.g. tide level) preliminary inundation model highly parameterized data loggers Inundation Study water level, temperature, and salinity time-series to document inundation and develop & test models air temperature & pressure, solar radiation temperature on marsh platform (air/water) Can we use temperature as an indicator of inundation? thermal imaging Can we use temperature as an indicator of inundation?


13 ELEVATION MAPPING LIDAR survey by USGS / NASA Mark Nardi & Wayne Wright 2008; low spring tide; leaf-off EAARL Experimental Advanced Airborne Ranging g LiDAR
14 Digital Elevation Model LiDAR survey scale optimized for marsh topography Murderkill River salt marsh uplands LiDAR data collected for other purposes by commercial LiDAR vendors is not optimal for mapping marsh topography. Delaware Bay
15 common x,y,z datum apples to apples Components of elevation marsh surface (LiDAR) very low relief minimize error and remove bias instrument locations (e.g. tide level) preliminary inundation model highly parameterized data loggers Inundation Study water level, temperature, and salinity time-series to document inundation and develop & test models air temperature & pressure, solar radiation temperature on marsh platform (air/water) Can we use temperature as an indicator of inundation? thermal imaging Can we use temperature as an indicator of inundation?
16 Cumulative Probability of Tide Being Below an Absolute Elevation 3 gages (USGS) Bowers Frederica Webbs Slough tidal datums shown for Bowers (VDatum) Preliminary model makes VERY simple (and wrong) assumption of Instantaneous inundation based on water elevation at Bowers Beach But how wrong? Fraction of time wat ter level be elow given elevation -1.5 MLLW MLW MTL MH HW 85% of time below MHW 75th % MH HHW 45% of time below MTL 2% of time below MLW Elevation (m) median 25th %
17 Digital Elevation Model LiDAR Delaware Bay Murderkill River uplands salt marsh
18 elevation < mean tide level 002mNAVD m NAVD88 LSA using tide levels from Bowers Beach gage
19 elevation < 0.4 m 04mNAVD m NAVD88 LSA using tide levels from Bowers Beach gage
20 elevation < mean high water 06mNAVD m NAVD88 LSA using tide levels from Bowers Beach gage
21 elevation < mean highest high water 075mNAVD m NAVD88 LSA using tide levels from Bowers Beach gage
22 elevation < 0.9 m 09mNAVD LSA (> MHHW) using tide levels from Bowers Beach gage
23 common x,y,z datum apples to apples Components of elevation marsh surface (LiDAR) very low relief minimize error and remove bias instrument locations (e.g. tide level) preliminary inundation model highly parameterized data loggers Inundation Study water level, temperature, and salinity time-series to document inundation and develop & test models air temperature & pressure, solar radiation temperature on marsh platform (air/water) Can we use temperature as an indicator of inundation? thermal imaging Can we use temperature as an indicator of inundation?
24 Data Loggers in Webbs Marsh ~ 1 year at 6-minute sampling interval temperature temperature, salinity, level temperature, salinity, level, velocity, ph, DO Murderkill R WS Murderkill R
25 Likely Temperature Signals from Inundation? season air temperature water day nite spring warm cool warm/cool summer warm cool warm fall cool cool warm/cool winter cool cold cool
26 Temperature signals of inundation at 3 sites on the marsh platform (over 7 days) inundation progresses through time from site 1 to site 3 Jun 1, 2008 Jun 8, 2008 o C 1 night day start of inundation at site 1 start of inundation at site 3 o C o C 2 3 o C Water Webbs Slough (WS) air temp. temperature difference (site 1 site WS) m Webbs Slough (WS) tide
27 Phase lag of inundation relative to tide level at Webbs Slough area minutes secondary ditches Spartina alterniflora near ditches Spartina alterniflora away from ditches Spartina patens 60-90
28 common x,y,z datum apples to apples Components of elevation marsh surface (LiDAR) very low relief minimize error and remove bias instrument locations (e.g. tide level) preliminary inundation model highly parameterized data loggers Inundation Study water level, temperature, and salinity time-series to document inundation and develop & test models air temperature & pressure, solar radiation temperature on marsh platform (air/water) Can we use temperature as an indicator of inundation? thermal imaging Can we use temperature as an indicator of inundation?
29 MULTI-SPECTRAL IMAGING Reflected Energy Emitted Energy Thermal Bands UV Visible 0.4µm NIR SWIR 1.0µm 1.7µm MWIR 3.0µm LWIR 5.0µm thi study this t d 8.0µm 14.0µm
30 Environmental Thermography (Thermal Imaging of the Environment) measure apparent temperature of remote surfaces located centimeters to kilometers away absolute temperature can be calculated emissivity of a material (e.g. water, sediment, vegetation) geometry of the observing system can be used as a quick investigative tool for detailed lab / field studies of dynamic processes natural, engineered, industrial


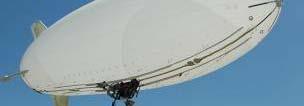

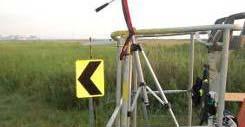
31 Imaging g Platforms

 12 C 18")


32 lift platform Temperature Time Series of Tidal Mixing in Webbs Slough (May 15, 2008) 12 C 18 visual Cooler water from the Murderkill River flows into Webbs Slough during flood tide and back out during ebb tide 5:34 DST 5:49 DST 6:04 DST 6:19 DST 0 min flood tide sunrise :34 DST 6:49 DST 7:04 DST 7:19 DST high ebb 75 tide tide :34 DST 7:49 DST 8:04 DST 8:19 DST min


33 Temperature Time Series Showing Inundation of Marsh Platform A flood tide 8:44 PM EST B warmer water (gray blue) on colder (red) marsh surface visual 12/13/2008 B A thermal imager location B high tide 9:04 PM EST A B ebb tide 9:42 PM A July 31, 2008 early evening


")
 B A")
34 Image of Marsh Platform Inundation warmer water flowing onto cold marsh surface Webbs Marsh December 13, 2008 high spring tide cold morning (subfreezing) helicopter platform inundated platform is warm (orange) B A B A channels are hot (yellow)


35 Differentiating Sources of Water Visual Image Thermal Image cold water (black) ponded on marsh platform after recent rain event B B A A warm water (white) in Brockonbridge Gut, Webbs Slough, and ditches 12/13/2008 9:56 AM high tide
36 Conclusions Salt-marsh elevations in upper Murderkill Estuary (Frederica) are lower than lower estuary (Bowers Beach) Common vertical datum is critical for quantifying tidal inundation using in-situ instrumentation. Environmental temperature can be used to capture spatio-temporal dynamics of inundation. inexpensive in-situ data loggers environmental thermography
Savannah Harbor Expansion Project
 Savannah Harbor Expansion Project Evaluation of Hurricane Surge Impacts with Proposed Mitigation Plan December 2007 Introduction This report summarizes the results of hurricane surge impacts with implementation
Pablo Bay in Sonoma, Solano, and Napa Counties. It is owned and managed by the U.S. Fish and Wildlife
 Appendix L San Pablo Bay Marsh Introduction San Pablo Bay National Wildlife Refuge marsh (hereafter San Pablo) is located on the north shore of San Pablo Bay in Sonoma, Solano, and Napa Counties. It is
Coastal Tidal Marshes
 Virginia s Wetlands Coastal Tidal Marshes Hydrology driven by lunar tides; Stresses include tidal inundation and/or salts; Found along high latitudes along intertidal coasts; Comprise ~ 70% wetlands of
Analysis of Tides and Storm Surge from Observational Records in the Delaware Inland Bays
 Analysis of Tides and Storm Surge from Observational Records in the Delaware Inland Bays John Callahan Delaware Geological Survey Coastal GeoTools Conference March 30 April 2, 2015 Charleston, SC Outline
John Callahan (Delaware Geological Survey) Kevin Brinson, Daniel Leathers, Linden Wolf (Delaware Environmental Observing System)
 Kevin Brinson, Daniel Leathers, Linden Wolf (Delaware Environmental Observing System)") John Callahan (Delaware Geological Survey) Kevin Brinson, Daniel Leathers, Linden Wolf (Delaware Environmental Observing System) Delaware is extremely vulnerable to the impacts of coastal flooding Tropical
John Callahan (Delaware Geological Survey) Kevin Brinson, Daniel Leathers, Linden Wolf (Delaware Environmental Observing System) Delaware is extremely vulnerable to the impacts of coastal flooding Tropical
Mapping Predicted Tidal Exposure Durations Using a MLLW-Referenced LiDAR Terrain Model
 Mapping Predicted Tidal Exposure Durations Using a MLLW-Referenced LiDAR Terrain Model for Management of Spartina alterniflora in Willapa Bay, Washington Meeting the Challenge: Invasive Plants in PNW Ecosystems
Ellipsoid Hydro Datum Geoid Errors
 Ellipsoid Hydro Datum Geoid Errors Jack L. Riley Office of Coast Survey Hydrographic Systems & Technology Branch Geoid Errors via Ellipsoid Hydrography? Per datum hydro Traditional & ellipsoid referenced
USGS efforts to model sea-level rise impact to tidal marshes along the California coast.
 USGS efforts to model sea-level rise impact to tidal marshes along the California coast. Karen Thorne 1 J.Y Takekawa 1, K. Buffington 1, K. Swanson 2, J. Drexler 2, D.Schoellhamer 2, M. Casazza 3, and
TILT, DAYLIGHT AND SEASONS WORKSHEET
 TILT, DAYLIGHT AND SEASONS WORKSHEET Activity Description: Students will use a data table to make a graph for the length of day and average high temperature in Utah. They will then answer questions based
Creating a Bathymetric Database & Datum Conversion
 Creating a Bathymetric Database & Datum Conversion Mitchell Brown Civil Engineering Technician Mitchell.E.Brown@erdc.dren.mil June 11, 2012 US Army Corps of Engineers BUILDING STRONG Introduction to Bathymetric
L OWER N OOKSACK R IVER P ROJECT: A LTERNATIVES A NALYSIS A PPENDIX A: H YDRAULIC M ODELING. PREPARED BY: LandC, etc, LLC
 L OWER N OOKSACK R IVER P ROJECT: A LTERNATIVES A NALYSIS A PPENDIX A: H YDRAULIC M ODELING PREPARED BY: LandC, etc, LLC TABLE OF CONTENTS 1 Introduction... 1 2 Methods... 1 2.1 Hydraulic Model... 1 2.2
Spatial Distribution of Salt Marsh Vegetation Cover and Salinity Regimes in Response to Mosquito Ditching
 Spatial Distribution of Salt Marsh Vegetation Cover and Salinity Regimes in Response to Mosquito Ditching Andrew J. Paolucci University of Rhode Island Department of Natural Resources Science NRS 533 Final
The Integration of Bathymetry, Topography and Shoreline and the Vertical Datum Transformations behind It
 VOL. 3 No. 3 (NEW SERIES) NOVEMBER 2002 _ The Integration of Bathymetry, Topography and Shoreline and the Vertical Datum Transformations behind It By Dr. Bruce Parker, National Ocean Service, NOAA, USA
Sea Level Rise in Miami-Dade County Florida Implications for Management of Coastal Wetlands and the Everglades
 Sea Level Rise in Miami-Dade County Florida Implications for Management of Coastal Wetlands and the Everglades Peter W. Harlem Dr. John F. Meeder Florida International University Southeast Environmental
Some Thoughts on the Role of Elevation
 Some Thoughts on the Role of Elevation Data in Sea-level Rise Impact Assessments Rob Thieler* U.S. Geological Survey Coastal and Marine Geology Program Woods Hole, MA *i l d t i l d f D C h D G h *includes
GISC3325 Spring 2011 Final Exam
 GISC3325 Spring 2011 Final Exam Name: Carefully read each question. Identify the important elements and the question being asked. Show your work for partial credit. No credit for undocumented wrong answers.
SUWANNEE RIVER WATER MANAGEMENT DISTRICT 9225 CR 49 LIVE OAK FLORIDA DECEMBER 2015
 HYDRODYNAMIC MODEL DEVELOPMENT, CALIBRATION, AND MFL FLOW REDUCTION AND SEA LEVEL RISE SIMULATION FOR THE TIDAL PORTION OF THE ECONFINA RIVER ECONFINA RIVER, FLORIDA SUWANNEE RIVER WATER MANAGEMENT DISTRICT
Lake Champlain Richelieu River Flood Inundation Mapping and Forecasting Tool
 Lake Champlain Richelieu River Flood Inundation Mapping and Forecasting Tool Rob Flynn USGS New England Water Science Center, NH/VT Office U.S. Department of the Interior U.S. Geological Survey Lake Champlain
Current and Future Technology Applications for Coastal Zone Management. Bruce K. Carlisle, Acting Director Office of Coastal Zone Management
 Current and Future Technology Applications for Coastal Zone Management Bruce K. Carlisle, Acting Director Office of Coastal Zone Management The Massachusetts Coastal Zone Management Program Approved in
Preliminary Data Release for the Humboldt Bay Sea Level Rise Vulnerability Assessment: Humboldt Bay Sea Level Rise Inundation Mapping
 Preliminary Data Release for the Humboldt Bay Sea Level Rise Vulnerability Assessment: Humboldt Bay Sea Level Rise Inundation Mapping Prepared by: Jeff Anderson, Northern Hydrology & Engineering (jeff@northernhydrology.com)
The Delaware Environmental Monitoring & Analysis Center
 The Delaware Environmental Monitoring & Analysis Center Tina Callahan Delaware Estuary Science & Environmental Summit 2013 January 27-30, 2013 What is DEMAC? Delaware Environmental Monitoring & Analysis
Ecosystems Chapter 4. What is an Ecosystem? Section 4-1
 Ecosystems Chapter 4 What is an Ecosystem? Section 4-1 Ecosystems Key Idea: An ecosystem includes a community of organisms and their physical environment. A community is a group of various species that
PH YSIC A L PROPERT IE S TERC.UCDAVIS.EDU
 PH YSIC A L PROPERT IE S 8 Lake surface level Daily since 1900 Lake surface level varies throughout the year. Lake level rises due to high stream inflow, groundwater inflow and precipitation directly onto
Mesoscale Meteorological Impacts on Criteria Air Pollutants Along Utah's Wasatch Front as Measured by Mobile Platforms
 J6.4 Mesoscale Meteorological Impacts on Criteria Air Pollutants Along Utah's Wasatch Front as Measured by Mobile Platforms Alexander A. Jacques, Erik T. Crosman, John D. Horel, Logan Mitchell, John C.
Taunton River Salt Marsh Assessment Results from 2014 season
 Taunton River Salt Marsh Assessment Results from 2014 season December, 2014 During the late summer and fall of 2014, Save The Bay evaluated salt marshes in Assonet Bay, Freetown and Broad Cove in Dighton
Assessing marsh response from sea-level rise applying local site conditions: Humboldt Bay wetlands
 Assessing marsh response from sea-level rise applying local site conditions: Humboldt Bay wetlands U. S. Geological Survey, Western Ecological Research Center Addendum - Data Summary Report February 23,
Wetland Definition Diagram
 Wetland Organisms 1 Wetland Definition Diagram 2 Stress Experienced In Wetlands Anoxia Salt Concentrations Water Fluctuation 3 Anoxic Conditions Soils saturated/inundated Anaerobic Conditions May vary
Using Remote Sensing to Map the Evolution of Marsh Vegetation in the South Bay of San Francisco
 Using Remote Sensing to Map the Evolution of Marsh Vegetation in the South Bay of San Francisco Brian Fulfrost Design, Community and Environment (DC&E) 6 th Annual Bay-Delta Science Conference PROJECT
Factors Governing Successful Tidal Wetland Mitigation. Walter I. Priest, III Wetland Design and Restoration ASWM Webinar 16 July 2018
 Factors Governing Successful Tidal Wetland Mitigation Walter I. Priest, III Wetland Design and Restoration ASWM Webinar 16 July 2018 Goals and Objectives Successful Tidal Wetland Mitigation Primary production
Sentinel Site Development of a Major Salt Marsh System in the Mid-Atlantic Region (USA)
") Open Journal of Ecology, 2014, 4, 77-86 Published Online March 2014 in SciRes. http://www.scirp.org/journal/oje http://dx.doi.org/10.4236/oje.2014.43010 Sentinel Site Development of a Major Salt Marsh
Open Journal of Ecology, 2014, 4, 77-86 Published Online March 2014 in SciRes. http://www.scirp.org/journal/oje http://dx.doi.org/10.4236/oje.2014.43010 Sentinel Site Development of a Major Salt Marsh
WIND EFFECTS ON CHEMICAL SPILL IN ST ANDREW BAY SYSTEM
 WIND EFFECTS ON CHEMICAL SPILL IN ST ANDREW BAY SYSTEM PETER C. CHU, PATRICE PAULY Naval Postgraduate School, Monterey, CA93943 STEVEN D. HAEGER Naval Oceanographic Office, Stennis Space Center MATHEW
Coastal Ecosystems: Salt Marshes and Mangroves. Marine Biology Dr. Ouida Meier
 Coastal Ecosystems: Salt Marshes and Mangroves Marine Biology Dr. Ouida Meier Factors Driving Coastal Ecosystems Latitude temperature light, seasonality Tidal cycles amplitude frequency Wave energy Degree
The National Spatial Reference System of the Future
 The National Spatial Reference System of the Future William Stone Southwest Region (AZ, NM, NV, UT) Geodetic Advisor william.stone@noaa.gov NOAA s National Geodetic Survey geodesy.noaa.gov Salt Lake City
Final Exam: Monday March 17 3:00-6:00 pm (here in Center 113) Slides from Review Sessions are posted on course website:
 Slides from Review Sessions are posted on course website:") Final Exam: Monday March 17 3:00-6:00 pm (here in Center 113) 35% of total grade Format will be all multiple choice (~70 questions) Final exam will cover entire course - material since 2 nd midterm weighted
Final Exam: Monday March 17 3:00-6:00 pm (here in Center 113) 35% of total grade Format will be all multiple choice (~70 questions) Final exam will cover entire course - material since 2 nd midterm weighted
Tony Pratt, DNREC to The Center for the Inland Bays Scientific and Technical Advisory Committee. August 21, 2009
 Sea Level Rise in Delaware Presented by Tony Pratt, DNREC to The Center for the Inland Bays Scientific and Technical Advisory Committee August 21, 2009 Sea level has been fluctuating ever since there have
A) usually less B) dark colored and rough D) light colored with a smooth surface A) transparency of the atmosphere D) rough, black surface
 usually less B) dark colored and rough D) light colored with a smooth surface A) transparency of the atmosphere D) rough, black surface") 1. Base your answer to the following question on the diagram below which shows two identical houses, A and B, in a city in North Carolina. One house was built on the east side of a factory, and the other
1. Base your answer to the following question on the diagram below which shows two identical houses, A and B, in a city in North Carolina. One house was built on the east side of a factory, and the other
Modeling Coastal Change Using GIS Technology
 Emily Scott NRS 509 Final Report December 5, 2013 Modeling Coastal Change Using GIS Technology In the past few decades, coastal communities around the world are being threatened by accelerating rates of
Susquehanna River Basin A Research Community Hydrologic Observatory. NSF-Funded Infrastructure Proposal in Support of River Basin Hydrologic Sciences
 Susquehanna River Basin A Research Community Hydrologic Observatory NSF-Funded Infrastructure Proposal in Support of River Basin Hydrologic Sciences Fundamental Problem: How Do Humans and Climate Impact
High Resolution Numerical Models of Tidal Marshes in the Delaware Bay
 High Resolution Numerical Models of Tidal Marshes in the Delaware Bay Ramona Stammermann Dept. of Civil, Architectural & Environmental Engineering, Drexel University, Philadelphia, PA Michael Piasecki
Home About Us Articles Press Releases Image Gallery Contact Us Media Kit Free Subscription 10/5/2006 5:56:35 PM
 Home About Us Articles Press Releases Image Gallery Contact Us Media Kit Free Subscription 10/5/2006 5:56:35 PM Industry Resources Industry Directory NASA Links Missions/Launches Calendar Human development
Lithosphere: (Rocky Sphere) Solid, rocky, outer layer of the Earth. Includes the crust and part of the upper mantle. Lithosphere
 Solid, rocky, outer layer of the Earth. Includes the crust and part of the upper mantle. Lithosphere") Lithosphere: (Rocky Sphere) Solid, rocky, outer layer of the Earth. Includes the crust and part of the upper mantle. Lithosphere Permafrost Permafrost Ground that is at a temperature of 0 or below for
Lithosphere: (Rocky Sphere) Solid, rocky, outer layer of the Earth. Includes the crust and part of the upper mantle. Lithosphere Permafrost Permafrost Ground that is at a temperature of 0 or below for
COASTAL DATA APPLICATION
 2015 Coastal GeoTools Proactive By Design. Our Company Commitment COASTAL DATA APPLICATION Projecting Future Coastal Flood Risk for Massachusetts Bay Bin Wang, Tianyi Liu, Daniel Stapleton & Michael Mobile
Town of Cape Elizabeth: A summary of some of the latest sea level rise science and storm surge data to help guide municipal ordinance changes
 Town of Cape Elizabeth: A summary of some of the latest sea level rise science and storm surge data to help guide municipal ordinance changes May 29, 2014 Peter A. Slovinsky, Marine Geologist Maine Geological
Lake Tahoe Watershed Model. Lessons Learned through the Model Development Process
 Lake Tahoe Watershed Model Lessons Learned through the Model Development Process Presentation Outline Discussion of Project Objectives Model Configuration/Special Considerations Data and Research Integration
3) What is the difference between latitude and longitude and what is their affect on local and world weather and climate?
 What is the difference between latitude and longitude and what is their affect on local and world weather and climate?") www.discoveryeducation.com 1) Describe the difference between climate and weather citing an example of each. Describe how water (ocean, lake, river) has a local effect on weather and climate and provide
www.discoveryeducation.com 1) Describe the difference between climate and weather citing an example of each. Describe how water (ocean, lake, river) has a local effect on weather and climate and provide
Sea Level Rise and the Scarborough Marsh Scarborough Land Trust Annual Meeting April 24, 2018
 Sea Level Rise and the Scarborough Marsh Scarborough Land Trust Annual Meeting April 24, 2018 Peter A. Slovinsky, Marine Geologist Maine Geological Survey Funded by: 50% 40% Figure modified from Griggs,
Sediment Dynamics in Restored Tidal Wetlands of San Francisco Bay
 Sediment Dynamics in Restored Tidal Wetlands of San Francisco Bay John Callaway & Jennifer Gagnon (USF) Lisa Schile (UC Berkeley) Evyan Borgnis & Tom Parker (SFSU) Donna Ball (HT Harvey & Assoc.) Gene
Characterization of Coastal Wetland Systems using Multiple Remote Sensing Data Types and Analytical Techniques
 Characterization of Coastal Wetland Systems using Multiple Remote Sensing Data Types and Analytical Techniques Daniel Civco, James Hurd, and Sandy Prisloe Center for Land use Education and Research University
Atmospheric Composition and Structure
 Atmospheric Composition and Structure Weather and Climate What is weather? The state of the atmosphere at a specific time and place. Defined by: Humidity, temperature, wind speed, clouds, precipitation,
One of the coldest places in the country - Peter Sinks yet again sets this year s coldest temperature record for the contiguous United States.
 One of the coldest places in the country - Peter Sinks yet again sets this year s coldest temperature record for the contiguous United States. In the early morning of February 22, 2010 the temperature
The rate and fate of coastal carbon burial
 The rate and fate of coastal carbon burial Matthew L. Kirwan, Virginia Institute of Marine Science Main Points Marsh size Marsh accretion 1. SLR drives wetland carbon burial in vertical and lateral dimensions
PHYSICAL PROPERTIES TAHOE.UCDAVIS.EDU 8
 PHYSICAL PROPERTIES 8 Lake surface level Daily since 1900 Lake surface level varies throughout the year. Lake level rises due to high stream inflow, groundwater inflow, and precipitation directly onto
Radiative Climatology of the North Slope of Alaska and the Adjacent Arctic Ocean
 Radiative Climatology of the North Slope of Alaska and the Adjacent Arctic Ocean C. Marty, R. Storvold, and X. Xiong Geophysical Institute University of Alaska Fairbanks, Alaska K. H. Stamnes Stevens Institute
Draft for Discussion 11/11/2016
 Coastal Risk Consulting (CRC) Climate Vulnerability Assessment for Village of Key Biscayne Deliverable 1.1 in Statement of Work. Preliminary Vulnerability Assessment Identifying Flood Hotspots Introduction...
SAN FRANCISCO DISTRICT INFORMATION REQUESTED FOR VERIFICATION OF CORPS JURISDICTION
 DEPARTMENT OF THE ARMY SAN FRANCISCO DISTRICT, U.S. ARMY CORPS OF ENGINEERS 1455 MARKET STREET SAN FRANCISCO, CALIFORNIA 94103-1398 SAN FRANCISCO DISTRICT INFORMATION REQUESTED FOR VERIFICATION OF CORPS
3.7 VISUAL RESOURCES Environmental Setting
 2 3 4 5 6 7 8 9 0 2 3 4 5 6 7 8 9 20 2 22 23 24 25 26 27 28 29 30 3 32 33 34 35 36 37 38 39 40 4 3.7 VISUAL RESOURCES This section assesses the effects of the treatment techniques on views from public
Bathymetry Data and Models: Best Practices
 Bathymetry Data and Models: Best Practices Barry Eakins & Lisa Taylor The NOAA National Geophysical Data Center Over 600 data types - from the core of the Earth to the surface of the Sun NGDC Bathymetry
PLANT COMMUNITY COMPOSITION OF THE BUCKTOWN CREATED MARSH:
 PLANT COMMUNITY COMPOSITION OF THE BUCKTOWN CREATED MARSH: A PRELIMINARY ASSESSMENT Prepared for: John Lopez, Director Coastal Sustainability Program Lake Pontchartrain Basin Foundation Prepared by: Mark
VERIFICATION OF HIGH-RESOLUTION MESOSCALE SIMULATIONS USING LAND-SURFACE TEMPERATURE FIELDS DERIVED FROM SATELLITES
 VERIFICATION OF HIGH-RESOLUTION MESOSCALE SIMULATIONS USING LAND-SURFACE TEMPERATURE FIELDS DERIVED FROM SATELLITES M.A. Jiménez and J.Cuxart Universitat de les Illes Balears Palma de Mallorca, Spain ü
3. Which color of the visible light has the shortest wavelength? A) violet B) green C) yellow D) red
 violet B) green C) yellow D) red") Name: Topic 6 Test 1. Which process is responsible for the greatest loss of energy from Earth's surface into space on a clear night? A) condensation B) conduction C) radiation D) convection 2. Base your
Name: Topic 6 Test 1. Which process is responsible for the greatest loss of energy from Earth's surface into space on a clear night? A) condensation B) conduction C) radiation D) convection 2. Base your
ELKHORN SLOUGH TECHNICAL REPORT SERIES 2012: 2
 ELKHORN SLOUGH TECHNICAL REPORT SERIES 2012: 2 Sponsored by the Elkhorn Slough National Estuarine Research Reserve and the Elkhorn Slough Foundation Water levels, wetland elevations, and marsh loss Eric
Surface Circulation Ocean current Surface Currents:
 All Write Round Robin G1. What makes up the ocean water? G2. What is the source of the salt found in ocean water? G3. How does the water temperature affect the density of ocean water? G4. How does the
Groundwater dynamics and surface water-groundwater interaction in a prograding delta island, Louisiana, USA
 Supplementary Information Groundwater dynamics and surface water-groundwater interaction in a prograding delta island, Louisiana, USA Michael T. O Connor 1* and Kevan B. Moffett 1,2 1 Department of Geological
A Study of Coastal Flooding at Jarvis Creek, Connecticut
 A Study of Coastal Flooding at Jarvis Creek, Connecticut James O'Donnell, Michael Whitney and Kay Howard Strobel Connecticut Institute for Resilience and Climate Adaptation and Department of Marine Sciences
Nitrogen and phosphorus dynamics in restored riverine floodplains in intensively managed watersheds
 Nitrogen and phosphorus dynamics in restored riverine floodplains in intensively managed watersheds Sara McMillan 1, Alex Johnson 1, Celena Alford 1, Greg Noe 2, Venkatesh Merwade 1, Sayan Dey, 1 Siddharth
Application of SLAMM to Coastal Connecticut. Final Report
 Application of SLAMM to Coastal Connecticut Final Report Prepared for: New England Interstate Water Pollution Control Commission Lowell, MA Emily Bird Project Manager Environmental Analyst Prepared by:
Moving Freshwater to the Ocean: Hydrology-Ocean Model Coupling
 Moving Freshwater to the Ocean: Hydrology-Ocean Model Coupling Cheryl Ann Blain 1, Tim Campbell 1, Song Yang 2, Aubrey Dugger 3, Paul Martin 1, Tommy Jenson 1 Naval Research Laboratory 1 Oceanography Division,
PRELIMINARY DRAFT FOR DISCUSSION PURPOSES
 Memorandum To: David Thompson From: John Haapala CC: Dan McDonald Bob Montgomery Date: February 24, 2003 File #: 1003551 Re: Lake Wenatchee Historic Water Levels, Operation Model, and Flood Operation This
Signals of sea-level rise in Delaware and Chesapeake Bay tides
 Signals of sea-level rise in Delaware and Chesapeake Bay tides Andrew C. Ross and Raymond G. Najjar Pennsylvania State University Also thanks to Ming Li, Serena Lee, Fan Zhang, Wei Liu Observations show
GSA DATA REPOSITORY D. Livsey and A.R. Simms
 GSA DATA REPOSITORY 2013273 D. Livsey and A.R. Simms Supplementary Information The supplementary information is divided into three sections: (1) Tide model and datums, (2) Vertical error calculation, and
* We will go as a class to the bathroom at 8:18!
 Unpack/ Write down homework Turn in ANY papers from home Get computer & book boxes Work on Government Shortcut--DUE THURSDAY! Work on ANY unfinished work- DUE THURSDAY * We will go as a class to the bathroom
Habitat Suitability for Forage Fishes in Chesapeake Bay
 Habitat Suitability for Forage Fishes in Chesapeake Bay Aug 2017 Jul 2019 Mary C Fabrizio Troy D Tuckey Aaron J Bever Michael L MacWilliams 21 June 2018 Photo: Chesapeake Bay Program Motivation Production
ATMOSPHERIC ENERGY and GLOBAL TEMPERATURES. Physical Geography (Geog. 300) Prof. Hugh Howard American River College
 Prof. Hugh Howard American River College") ATMOSPHERIC ENERGY and GLOBAL TEMPERATURES Physical Geography (Geog. 300) Prof. Hugh Howard American River College RADIATION FROM the SUN SOLAR RADIATION Primarily shortwave (UV-SIR) Insolation Incoming
ATMOSPHERIC ENERGY and GLOBAL TEMPERATURES Physical Geography (Geog. 300) Prof. Hugh Howard American River College RADIATION FROM the SUN SOLAR RADIATION Primarily shortwave (UV-SIR) Insolation Incoming
9 th INTECOL Orlando, Florida June 7, 2012
 Restoration of the Everglades Saline Wetlands and Florida Bay: Responses Driven from Land and Sea David Rudnick 1, Colin Saunders 2, Carlos Coronado 2, Fred Sklar 2 Erik Stabenau 1, Vic Engel 1, Rene Price
Appendix B. SLAMM Analysis of Kenai Peninsula and Anchorage, AK. Final Report
 Appendix B SLAMM Analysis of Kenai Peninsula and Anchorage, AK Final Report For: Jim Adams Director, Pacific Region National Wildlife Federation Anchorage, AK And: David Wigglesworth Coastal Program Manager
Ground Water Control of Tree Island Origin, Genesis and Destruction. By John F. Meeder and Peter W. Harlem SERC,FIU
 Ground Water Control of Tree Island Origin, Genesis and Destruction By John F. Meeder and Peter W. Harlem SERC,FIU Functional Definition Our functional definition of a Tree Island is; an isolated scrub
Gulf Research Reports
 Gulf Research Reports Volume 7 Issue 2 January 1982 Elevational Variations in the Lowest Limit of Spartina Colonization in a Virginia Salt Marsh Thomas G. Reidenbaugh William C. Banta Santoria Mendoza
Sea Level Rise Study Summary Town of South Bethany
 Sea Level Rise Study Summary Town of South Bethany This presentation was prepared by Anchor QEA for the Town of South Bethany using Federal Funds under award NA14 NOS 419 0123 from the Delaware Coastal
Adaptation to Sea Level Rise A Regional Approach
 Adaptation to Sea Level Rise A Regional Approach Project Partners: in Saco Bay, ME Peter Slovinsky, Marine Geologist Maine Geological Survey, Department of Conservation Project Funding from: Saco Bay Hazards
OCEAN HYDRODYNAMIC MODEL
 Jurnal Teknologi Pengelolaan Limbah (Journal of Waste Management Technology), ISSN 1410-9565 Volume 10 Nomor 1 Juli 2007 (Volume 10, Number 1, July, 2007) Pusat Teknologi Limbah Radioaktif (Radioactive
Science 8 Unit 1 Test Review Analyze factors that affect productivity and species distribution in marine and fresh water environments.
 Science 8 Unit 1 Test Review How does water shape our world? 1. Define a water system in your own words 2. What is water important for? (3 things at least) 3. What is water made of? Water in our world
Arizona Climate Summary February 2016 Summary of conditions for January 2016
 January 2016 Temperature and Precipitation Summary Arizona Climate Summary February 2016 Summary of conditions for January 2016 January 1 st 14 th : The new year began with high pressure over the southwest
Positioning the Pacific: NOAA s Geospatial Activities. Juliana Blackwell, Director NOAA s National Geodetic Survey March 6, 2012
 Positioning the Pacific: NOAA s Geospatial Activities Juliana Blackwell, Director NOAA s National Geodetic Survey March 6, 2012 A Common Problem of the Early 19 th Century 1807 President Thomas Jefferson
Name NRS 409 Exam I. 1. (24 Points) Consider the following questions concerning standard data for GIS systems.
 Consider the following questions concerning standard data for GIS systems.") Read every question carefully. You may use a calculator if you wish. Conversion tables are provided at the end of the exam. If you have any questions, raise your hand. Be sure to show your work on computational
Read every question carefully. You may use a calculator if you wish. Conversion tables are provided at the end of the exam. If you have any questions, raise your hand. Be sure to show your work on computational
Considering Nitrogen and Black Mangrove in Context: Lessons Learned
 Considering Nitrogen and Black Mangrove in Context: Lessons Learned Christine N. Pickens 1 Karen L. McKee 2 Mark W. Hester 1 1 Coastal Plant Ecology Laboratory, University of Louisiana at Lafayette 2 US
Chapter 52 An Introduction to Ecology and the Biosphere
 Chapter 52 An Introduction to Ecology and the Biosphere Ecology The study of the interactions between organisms and their environment. Ecology Integrates all areas of biological research and informs environmental
Topography, hydrology and Spartina alterniflora growth range for restored salt marsh Elders Point East, Jamaica Bay, New York.
 Topography, hydrology and Spartina alterniflora growth range for restored salt marsh Elders Point East, Jamaica Bay, New York. Farshad Shafiei National Park Service, Gateway Faculty of Science 2012 Faculty
Chapter 3 Packet. and causes seasons Earth tilted at 23.5 / 365 1/4 days = one year or revolution
 Name Chapter 3 Packet Sequence Section 1 Seasons and Weather : and causes seasons Earth tilted at 23.5 / 365 1/4 days = one year or revolution solstice - begins summer in N. hemisphere, longest day winter
GEOGRAPHY EYA NOTES. Weather. atmosphere. Weather and climate
 GEOGRAPHY EYA NOTES Weather and climate Weather The condition of the atmosphere at a specific place over a relatively short period of time Climate The atmospheric conditions of a specific place over a
Environmental Science
 Environmental Science A Study of Interrelationships Cui Jiansheng Hebei University of Science and Technology CH06 Kinds of Ecosystems and Communities Chapter Objectives After reading this chapter, you
Chapter 2: Physical Geography
 Chapter 2: Physical Geography Pg. 39-68 Learning Goals for Chp2: q q q q q Explain how the Earth moves in space and why seasons change. Outline the factors that influence climate and recognize different
Section 145 Climate Change and Sea Level Rise
 Section 145 Climate Change and Sea Level Rise A. Definitions Rhode Island Coastal Resources Management Program 1. Climate is the long-term weather average observed within a geographic region, and climate
Energy Systems, Structures and Processes Essential Standard: Analyze patterns of global climate change over time Learning Objective: Differentiate
 Energy Systems, Structures and Processes Essential Standard: Analyze patterns of global climate change over time Learning Objective: Differentiate between weather and climate Global Climate Focus Question
Thermal / Solar. When air is warmed it... Rises. Solar Energy. Evaporation. Condensation Forms Clouds
 Thermal / Solar Light from the Sun is transformed into what type of energy when it hits Earth's surface? Rises When air is warmed it... Solar Energy Water moves through the water cycle using what type
BUILDING AN ACCURATE GIS
 BUILDING AN ACCURATE GIS 2006 GIS in the Rockies Denver, Colorado September 13, 2006 William E. Linzey United States Department of Commerce National Oceanic and Atmospheric Administration National Geodetic
Development of the Global Environment
 Development of the Global Environment G302: Spring 2004 A course focused on exploration of changes in the Earth system through geological history Simon C. Brassell Geological Sciences simon@indiana.edu
THIN-LAYER PLACEMENT OF DREDGE MATERIAL FOR MARSH NOURISHMENT, RESOTRATION, AND RESPONSE TO SEA LEVEL RISE
 THIN-LAYER PLACEMENT OF DREDGE MATERIAL FOR MARSH NOURISHMENT, RESOTRATION, AND RESPONSE TO SEA LEVEL RISE Case studies and lesson learned regarding thin-layer deposition projects in Delaware, New Jersey,
Week: Dates: 3/2 3/20 Unit: Climate
 clementaged.weebly.com Name: EVEN Period: Week: 28 30 Dates: 3/2 3/20 Unit: Climate Monday Tuesday Wednesday Thursday Friday 2 O 3 E *Vocabulary *Water in the Atmosphere and Clouds Notes *Cloud Drawings
Appendix D. Model Setup, Calibration, and Validation
 . Model Setup, Calibration, and Validation Lower Grand River Watershed TMDL January 1 1. Model Selection and Setup The Loading Simulation Program in C++ (LSPC) was selected to address the modeling needs
Average Weather For Coeur d'alene, Idaho, USA
 Average Weather For Coeur d'alene, Idaho, USA Information courtesy of weatherspark.com Location This report describes the typical weather at the Coeur d'alene Air Terminal (Coeur d'alene, Idaho, United