K.B.R.R. Hariprasad, C.V. Srinivas, A.Bagavath Singh, S. Vijaya Bhaskara Rao, R. Baskaran, B. Venkatraman
|
|
|
- Gerald Blaise Woods
- 6 years ago
- Views:
Transcription
00147-1 DOI: doi: 10.1016/j.atmosres.2014.03.")
1 Accepted Manuscript Numerical Simulation and Intercomparison of Boundary Layer Structure with different PBL schemes in WRF using experimental observations at a Tropical site K.B.R.R. Hariprasad, C.V. Srinivas, A.Bagavath Singh, S. Vijaya Bhaskara Rao, R. Baskaran, B. Venkatraman PII: S (14) DOI: doi: /j.atmosres Reference: ATMOS 3128 To appear in: Atmospheric Research Received date: 11 October 2013 Revised date: 24 March 2014 Accepted date: 28 March 2014 Please cite this article as: Hariprasad, K.B.R.R., Srinivas, C.V., Singh, A.Bagavath, Vijaya Bhaskara Rao, S., Baskaran, R., Venkatraman, B., Numerical Simulation and Intercomparison of Boundary Layer Structure with different PBL schemes in WRF using experimental observations at a Tropical site, Atmospheric Research (2014), doi: /j.atmosres This is a PDF file of an unedited manuscript that has been accepted for publication. As a service to our customers we are providing this early version of the manuscript. The manuscript will undergo copyediting, typesetting, and review of the resulting proof before it is published in its final form. Please note that during the production process errors may be discovered which could affect the content, and all legal disclaimers that apply to the journal pertain.
2 Numerical Simulation and Intercomparison of Boundary Layer Structure with different PBL schemes in WRF using experimental observations at a Tropical site K.B.R.R.Hariprasad 1, C.V.Srinivas 1, A.Bagavath Singh 1, S.Vijaya Bhaskara Rao 2 R.Baskaran 1, B.Venkatraman 1 1. Radiological Safety Division, Radiological Safety & Environment Group, Indira Gandhi Centre for Atomic Research, Kalpakkam 2. Department of Physics, Sri Venkateswara University, Tirupati Corresponding Author: C.V.Srinivas, Radiological Safety & Environment Group, Indira Gandhi Centre for Atomic Research, Kalpakkam , India cvsri@igcar.gov.in; Tel:
3
4 Abstract In this study the performance of seven PBL parameterizations in the Weather Research and Forecast (WRF-ARW) mesoscale model was tested at the tropical site Kalpakkam. Meteorological observations collected during an intense observation campaign for wind field modelling called Round Robin Exercise (RRE) were used for comparison. High resolution simulations were conducted for a warm summer condition in September The observations included GPS Sonde vertical profiles, surface level data from meteorological towers and turbulent fluxes from sonic anemometers. Sensitivity experiments with seven PBL schemes [Mellor-Yamada-Janjic (MYJ), Mellor-Yamada-Nakanishi-Niino (MYNN), Quasi Normal Scale Elimination (QNSE), Yonsei University (YSU), Asymmetric Convective Model (ACM2), Bougeault- Lacarrére (BL), Bretherton-Park (UW)] indicated that while all the schemes similarly produced the stable boundary layer characteristics there were large differences in the convective daytime PBL. It has been found that while ACM2, QNSE produced highly unstable and deep convective layers, the UW produced relatively shallow mixed layer and all other schemes (YSU, MYNN, MYJ, BL) produced intermediately deep convective layers. All the schemes well produced the vertical wind directional shear within the PBL. A wide variation in the eddy diffusivities were simulated by different PBL schemes in convective daytime condition. ACM2, UW produced excessive diffusivities which led to relatively weaker winds, warmer and dryer mixed layers with these schemes. Overall the schemes MYNN, YSU simulated the various PBL quantities in better agreement with observations. The differences in the simulated PBL structures could be partly due to various surface layer formulations that produced variation in friction velocity and heat fluxes in each case. [Keywords: Mesoscale, WRF, Boundary Layer, PBL parameterization, RRE experiment]
5 1. Introduction Mesoscale atmospheric models have been widely used in short-range weather prediction, atmospheric dispersion and air quality assessment (e.g., Hu et al, 2010; Jimenez et al. 2006; Zhang et al. 2006). Among a number of factors physics parameterizations in numerical models are very important to simulate the atmosphere realistically. The Planetary Boundary Layer (PBL) turbulence is especially influential in the simulation of low level atmospheric winds and clouds and diffusion of dynamical and thermodynamical quantities. The turbulent mixing in PBL determines the vertical transport of heat, moisture, momentum and other physical properties (Garrat, 1994; Stull, 1988). Excessive turbulent mixing leads to too warm, dry and thick PBLs, which influences the simulation of important meteorological systems such as convective storms through alteration of convective available energy and hurricanes by influencing the friction and winds (Braun and Tao, 2000). The vertical mixing due to turbulent motions in the PBL is not explicitly resolved in atmospheric models even at the highest possible resolution. The net effect of all the scales of eddies is parameterized using closure techniques based on gradients of resolved quantities. The key parameters that determine the to-and-fro transfer and diffusion of fluxes between the surface and atmosphere are surface drag coefficients for momentum (C d ), moisture and heat (C k ), eddy diffusivity for momentum (K m ), and moisture and heat (K h ). The PBL schemes influence the simulation of various atmospheric phenomena by producing substantial differences in the simulated temperature and moisture profiles and subsequent interaction with other model physics (Fast et al., 1995; Bright and Mullen 2002; Fast et al. 1995; Misenis and Zhang 2010). The uncertainty in the estimates of the PBL parameters with various PBL schemes is due to different assumptions regarding the transport of mass, moisture, and energy leading to variation in the structure of simulated atmospheric phenomena.
6 Hong and Pan (1996) showed precipitation simulations given by numerical weather forecast models were sensitive to the vertical mixing formulation. In the case of Hurricanes a number of studies (Bhaskar Rao et al. 2006; Braun and Tao 2000; Gopalakrishnan et al. 2013; Montgomery et al. 2010; Nolan et al a,b; Smith and Thomsen 2010; Srinivas et al. 2007a; Srinivas et al. 2012) have shown that the structure, intensity, track and precipitation simulations were influenced by the PBL physics through alteration of primary and secondary circulation. With the continuous developments in models and improvements in PBL physics several intercomparison studies have been made to study the suitability and application of specific schemes over various regions. Berg et al. (2005) have shown that the MM5 simulated PBL characteristics at an extratropical observation station were sensitive to the turbulence closure schemes and that simple first order schemes like Blackadar (1979) well represented the observed convective boundary layer structure. Steeneveld et al. (2008) compared simulations of PBL diurnal patterns from three regional models with observations from Cooperative Atmosphere-Surface Exchange Study (CASES-99: Poulos et al. 2002) experimental campaign. Their study reported that the simulated diurnal structures in both daytime and night time were sensitive to the selected PBL parameterization schemes. In the case of air quality studies Yerramilli et al. (2010; 2012) showed that the surface ozone simulations produced by WRF/Chem model were influenced by the PBL parameterization schemes and that the k-theory based first-order YSU scheme produced better results than the ACM2, MYJ schemes for simulating the diurnal cycle and Ozone mixing ratios in the Mississippi Gulf coastal region. Hu et al. (2010) studied three PBL parameterizations within WRF-ARW model for air quality application in Texas, and it was shown that the YSU, ACM2 produced better simulations for both stable and unstable conditions and that the MYJ produces coldest and moistest biases in the PBL. Madala et al (2013) have shown that the
7 thunderstorm simulations at a tropical station Gadanki were influenced by the PBL parameterization and cores of strong convective updrafts were obtained with Mellor-Yamada- Janjic scheme. The PBL parameterizations in numerical models have been mostly tested in subtropical and higher latitudes and very few studies (Srinivas et al. 2007b; Sanjay et al 2008) exist over tropical regions. Recently Shin and Hong (2011) compared five PBL schemes within WRF model using CASES-99 field data. Interestingly their study revealed that the PBL structure was better represented by non-local schemes under unstable / convective conditions and TKE closure local schemes in stable conditions. Such studies are generally rare in the tropical regions mainly due to lack of experimental observations. However, the tropical regions are interesting cases where convection is a dominant turbulent process and assessing the PBL parameterizations becomes important under convective conditions. The objective of the present work is to study the performance of the turbulence parameterization schemes in the WRF mesoscale model for the simulation of boundary layer flow structure at a tropical site. Towards this objective the observations collected at the Kalpakkam station, India during the Round Robin Exercise (RRE) field meteorological experiment (Srinivas et al. 2011) were used for validation of the simulated PBL structure. The paper is organized as follows: In section 2 model and design of numerical simulations are described. In section 3, the conceptual differences in PBL physics are presented. Section 4 provides the details of observations used for model comparison. Results of the simulations for winds, surface level variables, PBL height are presented in section 5. In section 6 conclusions and summary of main findings along with a discussion for future research are given. 2. Numerical model and simulations The Advanced Research WRF (WRF-ARW v3.2) mesoscale model developed by National Center for Atmospheric Research (NCAR), USA was used for the simulations in this study. It is
8 a mass conservative finite difference model and uses non-hydrostatic compressible Euler equations, terrain-following hydrostatic pressure vertical coordinate and Arakawa-C type horizontal grid (Skamarock et al., 2008). The prognostic variables include the three-dimensional wind, perturbation quantities of potential temperature, geopotential, surface pressure, turbulent kinetic energy and moisture. The model is flexible with a number of options for spatial discretization, diffusion, nesting, lateral boundary conditions and physics parameterizations as well as the terrain & topographic datasets compatible to different regions. In this study the WRF model was configured with 4-domains of horizontal resolutions 27 km, 9 km, 3 km, 1 km (Figure. 1a). The inner fine nest covers the experimental site Kalpakkam and adjoining areas. The model physics included Kain-Fritsch scheme (Kain and Fritsch, 1993) for convection, WRF single moment (WSM3) scheme for cloud microphysics, NOAH scheme (Chen et al. 2001) for land surface processes, RRTM scheme (Mlawer et al. 1997) for longwave radiation and Dudhia scheme for shortwave radiation. No convection scheme was employed for the fine domains 3 and 4. The domain and physics are given in Table 1. Simulations were conducted for September2010 in a summer warm period characterized with southwesterly synoptic flow condition. The model was initialized at 00 UTC on 22 September2010 and integrated for 48 hours. The 3-dimensional National Centers for Environmental Prediction (NCEP) Global Forecasting System (GFS) meteorological analysis data available at 0.5 degree resolution (~50 km) was used for the initial conditions. The boundary conditions to the outer domain were updated from 3 hourly GFS forecasts. The USGS elevation data, FAO soil data and MODIS land use data available at 10 min, 5 min, 30 sec resolution were used to define the surface fields in the model.
9 As mentioned earlier, the PBL physics influences the simulation of winds, mixed layer height and other state variables in the lower atmosphere. To study the above features seven different PBL schemes were used. The selected PBL schemes were Yonsei University (YSU) non-local diffusion (Hong et al. 2006), Mellor-Yamada-Janjic (MYJ) TKE closure (Janjic, 1994), Mellor-Yamada-Nakanishi-Niino level 2.5 (MYNN) local closure (Nakanishi and Niino 2004), Asymmetric Convective Model (ACM2) (Pleim, 2007), Bougeault and Lacarrére (1989) (BL), Quasi Normal Scale Elimination (QNSE) (Sukoriansky et al. 2005), University of Washington Moist Turbulence scheme (UW) (Bretherton and Park, respectively. Surface layer schemes compute friction velocities and surface exchange coefficients that facilitate the estimation of surface heat, moisture fluxes by the land-surface models and momentum fluxes consistent with the flux-profile relationships. The surface fluxes provide the lower boundary condition for the computation of vertical transport in the PBL. The surface layer schemes used in experiments were: Eta similarity theory (Janjic, 1990) with MYJ, Pleim-Xue (PX) similarity (Pleim 2006) with ACM2, QNSE similarity (Galperin and Sukoriansky 2010) with QNSE, UW similarity scheme with UW, and MM5 similarity (Zhang and Anthes 1982) with YSU, MYNN, BL as per their compatibility. The YSU, ACM are first-order and the rest are one-and-half order closures. The conceptual differences in different PBL schemes are discussed below. 3. Description of PBL closures Two approaches of PBL turbulence closure called local or non-local are generally followed in numerical models to obtain closed solution for the turbulence terms (Stensrud, 2007). In local closure the turbulent fluxes are derived from known quantities or their vertical derivatives at the same grid point. In non-local closure the turbulence fluxes are related to known quantities at any number of grid points elsewhere in the vertical (Stull, 1988; Shin et al 2011). The first order
10 closure is formulated following the gradient transport or K-theory where the second moments are parameterized. Here, any variable c (u,v,ө,q) is written as where the turbulent flux of cu ' ' is given by j (1) (2) where K is the eddy diffusivity coefficient. To overcome the deficiencies of unrealistic near surface adiabatic layers under strong heating condition and to obtain flux transports under strongly unstable environments higher order closures are proposed. They solve additional prognostic equation for turbulent kinetic energy (TKE) for the higher moments (Mellor and Yamada, 1982; Janjic, 994). Here, the eddy diffusivity coefficients for momentum and heat are parameterized through the use of TKE following the mixing length theory as (3) where S is the dimensionless stability function (S m for momentum, S h for heat or moisture), l is the turbulent macroscale or master length scale and e is the TKE. S m and S h are coefficients modifying l as a function of Richardson number (Ri) quantifying wind shear and buoyancy. The diagnostic equations used to obtain parameters S and l differ in different TKE closures MYJ, MYNN, QNSE, BouLac and UW. The TKE is predicted using the relation (4)
11 The first and second terms on the right hand side of equation (4) represent production due to shear, the third term represents the buoyancy, the fourth term represents the vertical TKE flux and pressure fluctuation, and the last term ε represents dissipation of TKE by molecular processes. The PBL height is diagnosed using a TKE threshold. The equations for heat and moisture include a term that allows mixing against local-gradient to represent large-eddy effects. In the YSU non-local scheme (Hong et al 2006) the diffusion equations for prognostic variables (u,v,ө,q are expressed as (5) لا where c is a correction to the local gradient to represent effects of large-scale eddies under. Here, the eddy diffusivity for momentum is defined as (6) where k is the von Karman constant (=.4, z is the height above the ground, h is the height of the boundary layer, w s is the mixed layer velocity scale defined form surface friction velocity and wind profile function at the surface layer top and the exponent p (p~2) is the profile shape constant (Holtslag and Boville, 1993; Troen and Mahrt, 1986). The counter gradient flux is expressed as لا (7) where ( wc ' ') 0 is the surface flux for u,v,q and and b is a constant of proportionality. The term on the right side in Eq.(5) is the entrainment flux which is taken proportional to the surface buoyancy flux. The eddy diffusivity for temperature and moisture (K h ) is computed from K m in
12 Eq.(7) by using the Prandtl number relationship. The stability functions are derived from PBL height and Obukhov length. The boundary layer height is determined by where Rib cr is the critical bulk Richardson number, U(h) is the horizontal wind speed at h, vz is the virtual potential temperature at the lowest level (30 to 50 m), v (h) is the virtual potential temperature at h, and s is the potential temperature near the surface. The Asymmetric Convective Model (ACM2: Pleim, 2007) uses local-closure for stable conditions and non-local closure for unstable conditions. 4. Observational Data The observations used in the present work were gathered in special field experiments under Round Robin Exercise (RRE) study program to validate the atmospheric flow field models for airborne effluent dispersion at the tropical coastal site Kalpakkam (Srinivas et al. 2011). Under this programme meteorological observations were collected during an Intensive Observation Period (IOP) September 2010 in a domain of 100 km range from Kalpakkam ( N and E) (Figure.1b) station situated between Chennai and Pondicherry cities on the (8) southeast coast of India. The observations were collected in three spatial domains (meso, local, microscale) around Kalpakkam from August 2010 to February 2011 by deploying multi-level meteorological towers, portable masts, Ultrasonic Anemometers, Automated Weather Stations, UHF Doppler Wind Profiler, GPS Radiosonde, Pyrhelio/Pyrgeometers, soil moisture and temperature probes. Measurements during the IOP included micrometeorological observations, turbulent components (u,v,w,ө at 5 locations (Kalpakkam, Anupuram, Vittalapuram, Chennai, Kattankulathur, Gadanki), vertical profiles of winds, temperature, humidity at 2
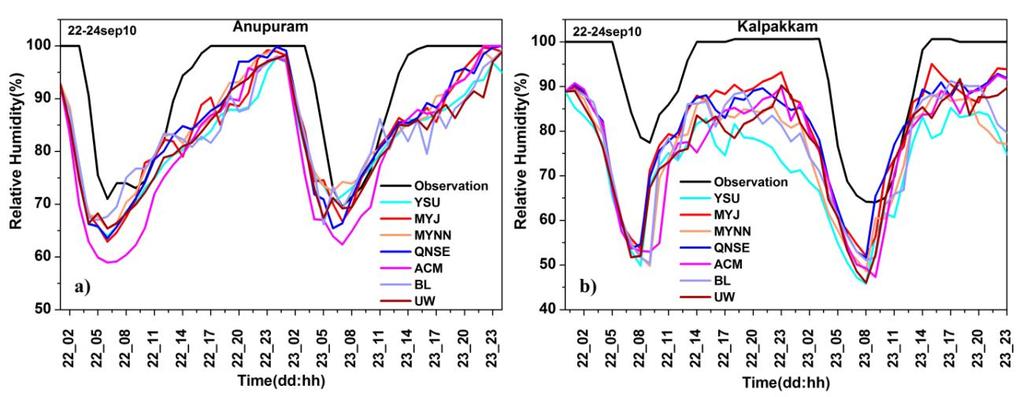
13 locations (Kalpakkam, Chennai), short-wave/ long-wave, soil temperature, soil moisture at 1 location (Kalpakkam) respectively. The mesoscale domain has plain topography with a few hillocks located at about 45 km on the western and northwestern sides. The land cover primarily comprises agriculture fields, scrubland and wastelands. The soil textural type is red loamy at the site and changes to silt loam at the coast. 5. Results The synoptic weather condition during the IOP in September 2010 was analysed from NCEP GFS global model meteorological analysis (Figure 2). A south north pressure gradient existed over the Indian Peninsula with high pressure distributed to the south and low pressures along the axis of the monsoon trough extending from northwest India to the head of Bay of Bengal near Calcutta during the observation period. The surface winds in September 2010 were mostly westerly / south-westerly with wind speed of order of 4 to 7 ms -1 in the southern Peninsular India. In the upper air at 200hPa (~14km, top of troposphere) the winds were easterly. Results of qualitative and quantitative comparison of simulated PBL variables winds, temperature, humidity, surface fluxes, vertical profiles of the above parameters and their time-height variations from the fine nest domain are presented. a) Diurnal evolution of Surface variables: The time variation of the surface level meteorological variables simulated by ARW at Anupuram and Kalpakkam stations along with observations are presented in Figures 3-6. The diurnal wavy pattern in surface level temperature, humidity and winds could be simulated as in observations at both the stations. However, the magnitudes of simulated variables differed among various schemes. Most PBL schemes produced a warm bias in the daytime air temperature and a slight cold bias in the night time air temperature. Among the
14 non-local schemes the ACM2 scheme simulated considerable overestimation of daytime temperature and a small underestimation in the night time temperature. The YSU produced a slight warm bias in both day and night temperatures. Among the higher order schemes MYNN produced a slight warm bias and simulated the night time temperature in better agreement with observations than other TKE schemes. The local closures MYJ, QNSE, UW, BL produced considerable warm and cold biases in the day and night time temperatures. The MYJ and QNSE simulated the largest clod and warm bias in the air temperatures. At the inland station Anupuram most PBL schemes produced a slight cold bias and the ACM2 scheme produced a warm bias in day temperature. Shin and Hong (2011) also reported warmer bias with ACM2 scheme and a cold bias with QNSE while comparing with observations during the convective time. Surface level relative humidity comparisons (Figure 4) shows that humidity was underestimated with all the PBL schemes at both the stations. Underestimation of humidity by MYJ and YSU schemes was also reported by Misenis and Zhang (2010) in air quality simulations over the coastal Mississippi. YSU, MYNN, MYJ, QNSE and BL schemes exhibited lower dry bias in both day and night time humidity relative to other schemes. The non-local scheme ACM2 produced a large dry bias in both day and night time humidity. Among the TKE schemes MYJ and QNSE simulated humidity in better agreement with the observations followed bybl, MYNN and UW. Overall MYJ and QNSE simulated the surface relative humidity reasonably well. The above results are similar to those found in Hu et al. (2010) in Texas (USA) and in Garcıa-Dıez et al (2013) over Europe. The above studies also reported significantly less bias with YSU than MYJ, ACM2 for temperature, humidity. The comparisons indicate that the differences among surface thermodynamic variables from different schemes were maximum at daytime and minimum at nighttime as also found in Shin and Hong (2011).
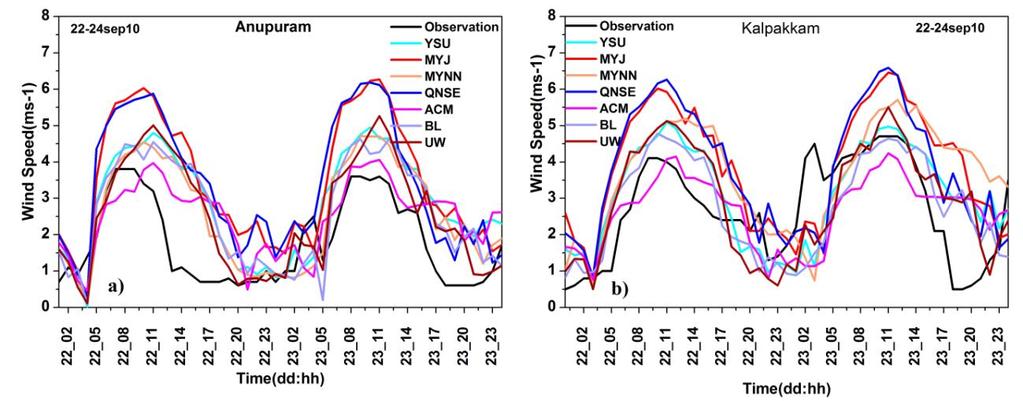
15 The time variation of winds at 10-m level from different experiments (Figure 5) indicated considerable overestimation of winds with MYJ, QNSE in both day and nighttime. The other schemes YSU, MYNN, BL, UW and ACM2 produced moderately stronger winds in both day and night time relative to observed winds at both stations. Overestimation of winds with WRF was also reported by Steeneveld et al (2008). Overall the ACM2 produced lesser deviations in both day and night time wind speed simulations. Wind speed predictions with YSU, MYNN, BL were better at Kalpakkam than at Anupuram. MYJ and QNSE simulated the highest wind speed errors at both the stations. Unlike in Shin and Hong (2011) where the wind components were more divergent at nighttime, present study shows the winds from different schemes were divergent at the tropical site in both daytime and nighttime with large deviations from observations. There were large directional shears in the simulations MYJ, QNSE in the initial time period (Figure 6). Unlike at Anupuram the directional deviations of about deg were found with all the PBL schemes for the coastal site Kalpakkam, which could be due to the abrupt contrast of land-water terrain at the Kalpakkam site. Barring these few deviations all the PBL schemes well simulated the windflow direction. The differences in the simulated surface level winds and thermodynamical variables can be explained from the differences in the friction velocity (u*) and surface fluxes. Comparison of time variation of u* (Figure 7) indicated that the frictional velocity was generally underestimated indicating underprediction of the shear force in the surface boundary layer in all simulations. The u* values simulated by YSU, MYNN, BL were nearly similar which is due to the use of a common surface layer scheme in the above simulations. The ACM2 and UW schemes that use their respective surface layer schemes (Pleim-Xue, UW M-O theory) produced large underestimation of frictional velocity. The variation in exchange coefficients and friction
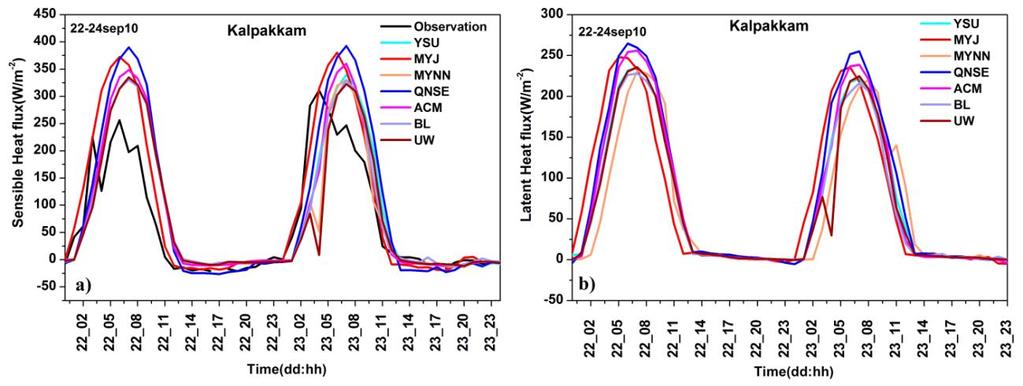
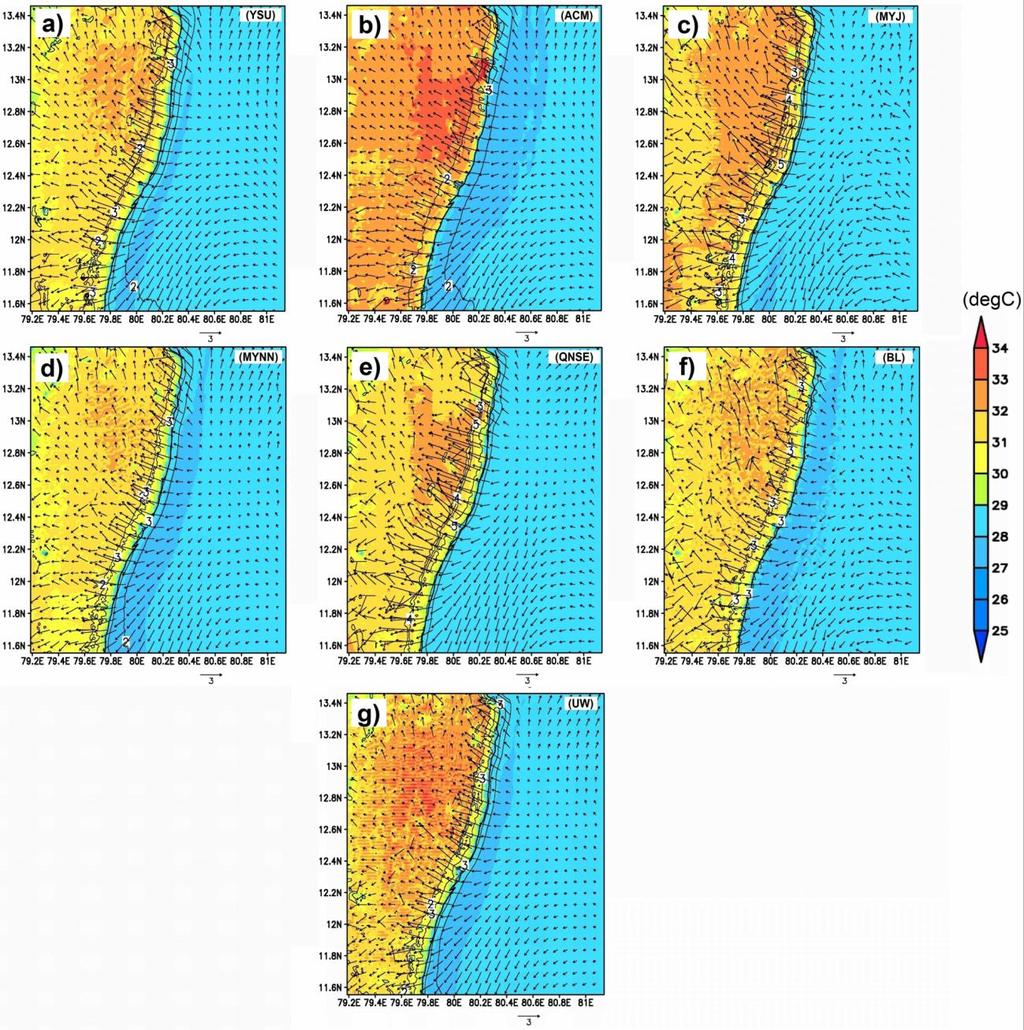
16 velocity can influence simulated sensible heat fluxes. The sensible heat and latent heat flux comparisons show that a large bias is simulated in the daytime flux by various schemes (Figure 8). All the PBL schemes overestimated the sensible heat flux on the first day of simulation and an improvement was noted in the simulated heat flux on the second day. This could be due to certain spinup time taken by the Noah land surface model for adjusting to the soil and vegetation processes to evolve the surface fluxes. While all the schemes similarly simulated the night time fluxes the MYJ, QNSE, ACM2 schemes produced higher daytime fluxes relative to observed fluxes. Further the latent heat flux was almost comparable in magnitude to sensible heat which could be due to high soil moisture and transfer of energy by evaporative process in the coastal environment. Overall, the MYNN and YSU show a better comparison of the surface heat flux simulation. The same time variations were found in the latent heat flux simulation and the schemes MYNN, YSU produced better latent heat flux simulations. The higher/lower sensible heat flux in QNSE/YSU in convective condition may be attributed to the simulated surface exchange coefficients in the respective schemes (Shin and Hong, 2011). b) Boundary layer flow field: The simulated surface level (10 m) flow field from the fine nest is analysed during the unstable daytime at 12 IST (Figure 9). In the morning conditions calm westerly flow (~1 ms -1 ) was simulated over the land in all the experiments and the winds were slightly stronger (1 to 1.5 ms -1 ) over the ocean relative to the land (0.5 to 1.5 ms -1 ) region. During the daytime large variations were found in the simulated surface temperature and flow field in different simulations. Large air temperature gradients (~5-7 C) across the land and sea interface at the coast were found in the simulations ACM2, MYJ, QNSE. Correspondingly stronger sea breeze with ACM2, MYJ, QNSE (4-5 ms -1 ) and weaker winds with YSU, MYNN, BL, UW (2 to 3 ms -1 ) were simulated. The relatively higher atmospheric temperatures simulated
17 with ACM2, MYJ, QNSE indicated relatively higher convective turbulence, higher diffusion and therefore a relatively deep boundary layer formation in these cases. Sea breeze flow was more organized with YSU, ACM2, MYNN, UW and was highly divergent in the cases MYJ, QNSE, and BL. The vertical extent of the sea breeze was found up to 700 m with MYJ, QNSE, and up to 400 m / 500 m in the other cases (not shown). Factors such as PBL height, wind shear, and entrainment of free atmospheric air into the PBL affect the wind distribution and mesoscale circulations (Arya, 2001). These factors are inturn related to the surface fluxes and PBL diffusivities which are analysed further in the following discussions. c) Vertical PBL structure: Vertical profiles of simulated potential temperature, relative humidity, wind speed and wind direction at 06 IST, 12 IST, 16 IST corresponding to morning, daytime and sea breeze time in the afternoon for Anupuram station are shown in Figures 10, 11, 12 and 13 respectively. The potential temperature profiles indicate slight overestimation in the temperature during the morning time. Above 50 m, highly stable conditions were simulated with all the PBL schemes giving similar vertical temperature variation in the morning as in observations. The local-closures QNSE, MYJ, UW, and BL produced highly stable conditions compared to other schemes. During the convective conditions at 12 IST the radiosonde data indicate development of a well mixed layer growing up to 900 m above ground level (AGL). A shallow unstable surface layer (extending to ~100 m AGL) was also found. The profiles with MYJ, BL, UW indicated a shallow 600 m deep mixed layer, YSU, MYNN indicated 800 m deep mixed layers whereas ACM2 and QNSE produced deeper (~1000 m) convective layers. During the sea breeze hours the potential temperature profiles show shallow convective mixed layer with a vertical extent of about 400 m AGL. This shallow mixed layer during sea breeze is well known as the thermal internal boundary layer (TIBL) in coastal regions. The development of sea breeze
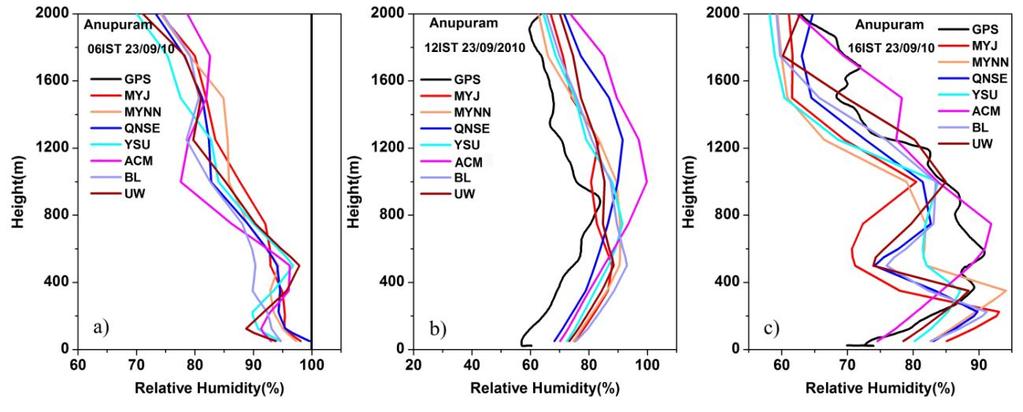
18 in the afternoon at the coastal site can be recognized from a change in the wind direction from southwesterly (~225) to southeasterly (~120), strengthening of the winds from 3 ms -1 to 5 ms -1 and increase in the relative humidity from 50% to 80%. While ACM2 produced a deeper (~750 m deep) mixed layer during the sea breeze time, the experiments QNSE, MYJ, UW produced relatively shallow mixed layers (<400 m deep) than that was found in the actual profile. Of all the seven experiments YSU, MYNN, BL well simulated the mixed layer (350 m deep) characteristics during the sea breeze time. Well developed deep convective mixed layers using YSU, and shallow layers with MYJ were also reported by Misenis and Zhang (2010) in air quality simulations using WRF-Chem. With reference to the relative humidity, the profile comparisons show vertically decreasing humidity in the morning, increasing humidity in the convective daytime up to 1000 m AGL at 12 IST and up to 400 m AGL during the sea breeze hours. The morning humidity profiles ingeneral show a steep unstable surface layer with humidity drastically falling up to m AGL and then increasing to a height of 400 m AGL. The MYNN, YSU, UW and to some extent the ACM2 experiments produced these stable layer humidity characteristics well, while the rest of the simulations (MYJ, QNSE, BL) produced a continuously falling humidity in the lower atmosphere. Observations at this time, however, were erroneous which may be due to the failure of the humidity sensor of the Radiosonde. During the convective daytime conditions the humidity profiles given by QNSE, ACM2 indicated an increasing moist bias with height as in the case of temperature. The vertical variations of humidity simulated with MYJ, UW and BL were indicative of a relatively shallow (~500 m deep at 12 IST; ~250 m deep at 16 IST) mixed layer development in comparison to the observed layer with radiosonde. The humidity profiles simulated with MYNN and YSU were more realistic both in convective noon time (12 IST) as
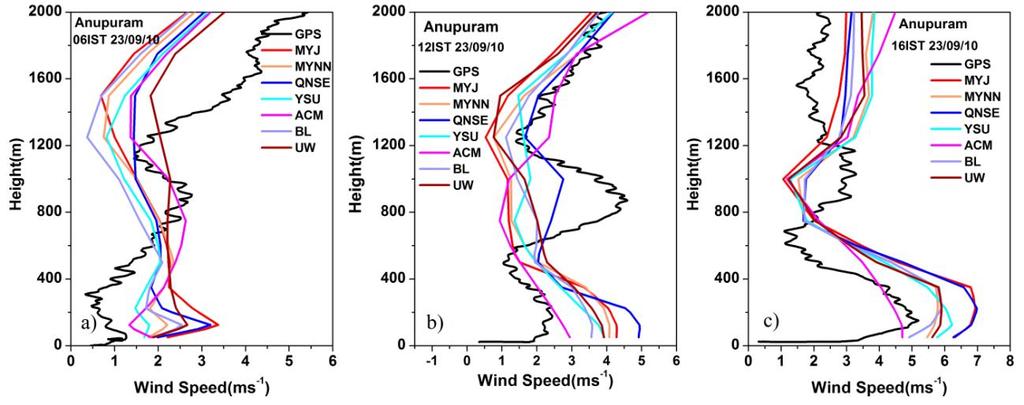
19 well as during sea breeze time (16 IST). The simulated thermodynamic properties show that QNSE, ACM2, YSU, UW generally produced dry and warm layers which could be due to excessive mixing (by larger eddy exchange coefficient for heat and moisture) computed in these schemes. The other schemes MYJ, MYNN, BL produced relatively cold and humid layers. The above results of YSU simulating slightly more warm and dry layers than MYJ are consistent with those obtained by Hu et al (2010) using WRF over Texas and Kim et al (2006) using WRF- Chem in airquality study. The deficiencies in reproducing the temperature and humidity by various schemes at the coastal site in the present study could be attributed to the deficiencies in capturing small-scale meteorological phenomena under complex weather patterns involving land/sea interactions as was also reported by Misneis and Zhang (2010). Comparison of wind speed profiles (Figure 12) shows that during the stable morning conditions all the simulations overestimated wind speed in the first 600 m AGL. Here, the ACM2, MYNN and YSU indicate better comparisons than the other experiments. Above 600 m most of the simulations produced lower wind speeds than the observations except ACM2 and UW. Similarly, during the convective daytime conditions except ACM2 all the experiments especially QNSE and MYJ produced higher wind speed in the lower 400 m region of the atmosphere. In the layer above 400 m AGL the QNSE shows a better comparison than the other schemes. During the sea breeze (16 IST) the same pattern of vertical variation of wind speeds as at noon time were found in the simulations. Overall, the YSU, MYNN, BL, ACM2 schemes produced better wind speed comparisons than the rest. The large differences between simulated and observed wind profiles in the layer above 600 m could be due to the horizontal drift of the radiosonde from its release location.
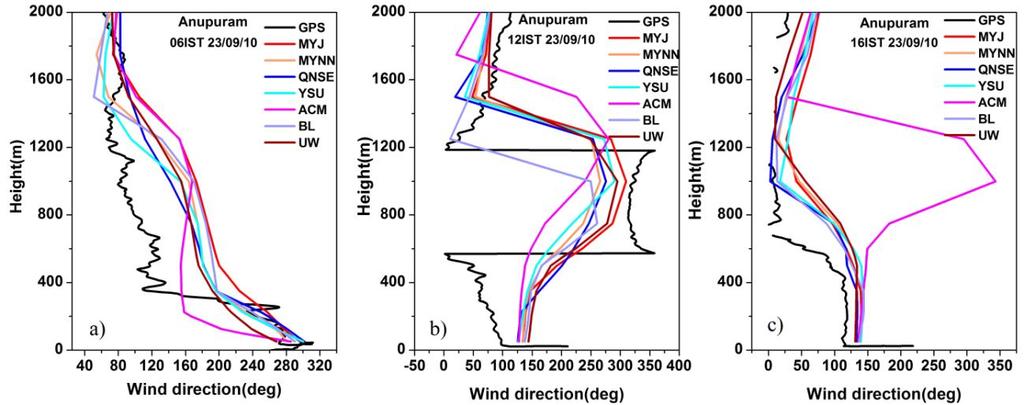
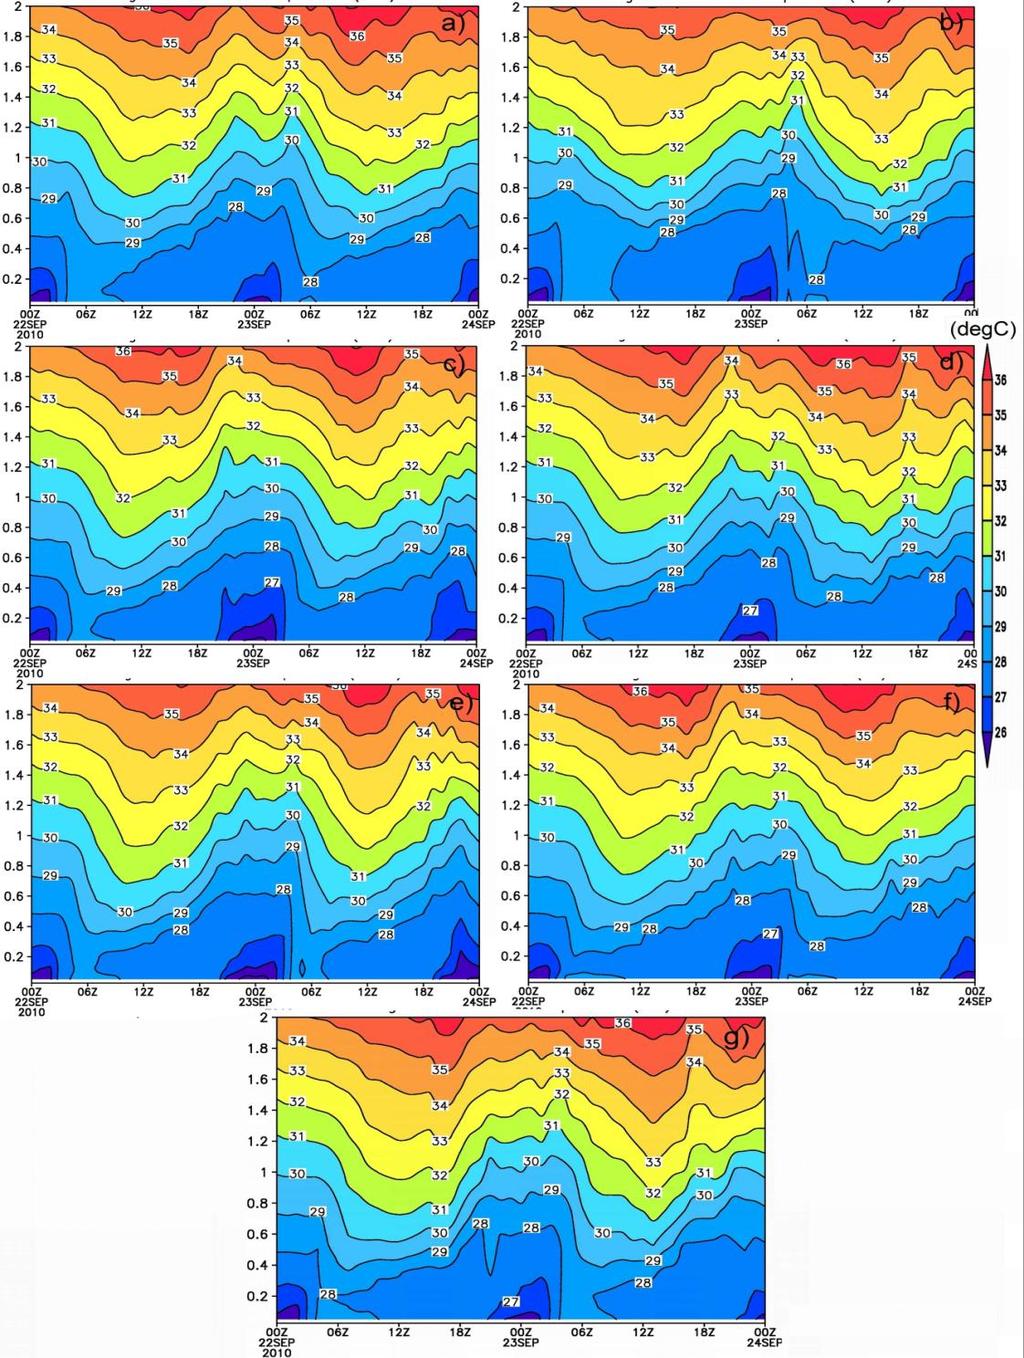
20 Comparison of the vertical variation of wind direction (Figure 13) indicated that all the simulations well produced the vertical wind directional shear in the boundary layer. All the schemes indicate westerly / southwesterly boundary layer flow in the late night/ morning time and the occurrence of sea breeze in the m layer in the daytime. The simulated direction profiles with YSU, QNSE, BL and MYNN were in better agreement with observations than the others in both stable and unstable conditions. The direction comparisons clearly show southeasterly sea breeze flow simulation in the lower levels up to 500 m AGL in agreement with observations. ACM2 produced slightly higher shear than other schemes at about 1 km region. Santos-Alamillos et al (2013) in a study of wind flow with WRF over southern Spain showed the wind direction estimates were more sensitive to the terrain characteristics rather than the model physics. Our present results also show less direction deviations with different PBL physics for the coastal site. c) Time Evolution of PBL: Intercomparison of the time-height variations from 00 UTC 22 to 00 UTC 24 September 2010 in potential temperature (θ) (Figure. 14) and specific humidity (q) (Figure 15) for the model grid at Kalpakkam indicates the model simulated the evolution of the boundary layer generally well in all the PBL schemes, but with some differences. During the period from local night (00 IST / 18 UTC) to local morning (08 IST/ 02 UTC) the simulated mean potential temperature increased with height indicating stable statification in all the cases. Both the local as well as the non-local diffusion schemes similarly produced the nocturnal boundary characteristics at the observation site. At around 06 IST/ 00 UTC all the simulations showed highly stable temperataure stratification and the local closures (MYJ, QNSE, BL, UW) more clearly depicted the stable boundary layer formation in agreement with the corresponding Radiosonde observations (Figure 10a). In the daytime from 09 IST/03 UTC onwards the
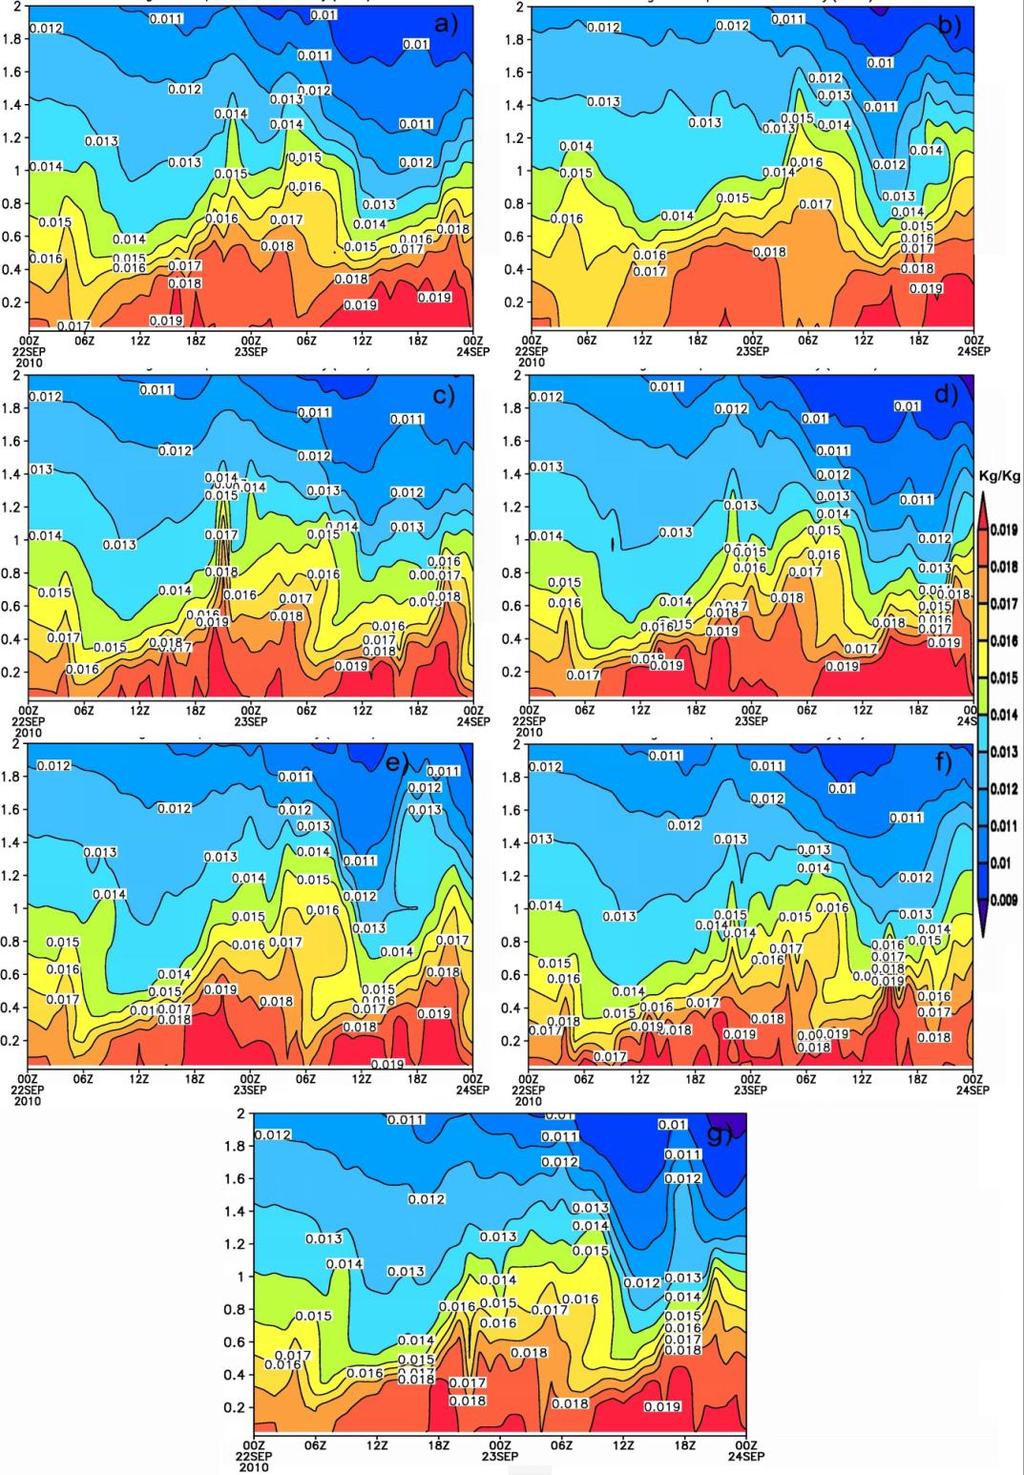
21 potential temperature remained uniform up to a certain height and then increased from 0.6 km upwards indicating development of well mixed conditions from 09 IST onwards. The layer within which the temperataure remained uniform had reduced from 0.6 km to 0.4 km at 12 IST/ 06 UTC and further to 0.2 km at 15 IST/ 09 UTC. This alteration in the mixed layer depth to a minimum value in the afternoon is a unique feature of coastal locations and is due to the well known phenomena of TIBL formation at the coast. The vertical extent of the daytime convective (or unstable) boundary layer was variously simulated in different experiments. The well mixed layer height was simulated as 0.6 km with YSU, MYJ, MYNN; 0.7 km with ACM2, 0.9 km with QNSE, 0.55 with UW, BL schemes. The QNSE, produced the deepest boundary layer followed by ACM2, YSU, MYNN, MYJ, BL, UW schemes. The PBL schemes QNSE, ACM2 and UW produced extremities (deep/shallow) in mixed layer simulations. The above results of formation of deeper convective boundary layers with QNSE, ACM2; shallow layers with UW and moderately deep conective layers with YSU, MYNN, BL, MYJ schemes were supported by Radiosonde observations in the earlier discussion. Simulation of deep boundary layers with ACM2 and moderately deep layers with YSU and MYJ were also reported by Garcıa-Dıez et al (2013) over Europe. The diurnal evolution of the PBL could also be analysed from the time-height variations in specific humidity (Figure 15). The stable boundary layers during the night and morning were marked with decreasing specific humidity whereas the unstable layers in the daytime were marked with near uniform vertical humidity distribution. The deepest boundary layers during the daytime were found with QNSE followed by ACM2, MYJ, YSU, MYNN, BL and UW. The local closure TKE schemes (MYJ, MYNN, QNSE, BL and UW) produced steep vertical gradients in the humidity distribution during the night stable atmospheric conditions (at 03 IST/
22 21 UTC) as compared to the non-local schemes. However, the non-local schemes produced distinctly uniform humidity distributions during the convective day time conditions (12 IST/06 UTC) as compared to the local-closure schemes thus showing the expected well mixed conditions. The local schemes produced relatively higher humidity (0.019 kg/kg) in the lower layers as compared to the non-local schemes (~0.017 kg/kg) under convective conditions indicating lesser mixing as compared to the non-local schemes. d) PBL Height: Various methods are used in model PBL formulations for the estimation of boundary layer height involving thermodynamics, dynamics, using parameters like the critical Richardson number, threshold TKE, potential temperature etc (e.g., Noh et al. 2003; Troen and Mahrt, 1986; Vogelezang and Holtslag, 1996; Shin and Hong, 2011). The PBL height is diagnosed from bulk Richardson number by comparing with critical Richardson number in YSU and ACM2 schemes. In YSU scheme bulk Richardson number is calculated from the surface. For convective conditions its value is set to zero, whereas in stable conditions R i is taken > 0 (0 to 0.25). In the case of ACM2, PBL is considered to comprise a free convective layer and an entrainment layer. The height of free convective layer is diagnosed from the temperature of the rising plume. The height at which the temperature of the rising plume is equal to the temperature of the surrounding environment is considered as the top of the free convective layer. The depth of the entrainment layer estimated from the critical Richardson number is added to the height of the free convection layer to obtain the height of the PBL. In the case of local PBL schemes (i.e., MYJ, QNSE, MYNN, BL, UW), PBL height is diagnosed as the height where prognostic TKE reaches a sufficiently small value (of the order of m 2 /s 2 ) (Shin and Hong, 2011). In the present study the PBL height was analysed from daytime Radiosonde observations using potential temperature profile specifically for the morning (06 IST) and noon (12 IST) conditions.
23 The comparison shows that during daytime the QNSE, ACM2 simulated very deep boundary layers, UW simulated shallow PBL while MYJ, MYNN, YSU, BL simulated intermediately deep layers (Figure. 16). During the night time while ACM2, BL, YSU, UW produced very shallow layers MYNN, QNSE, MYJ simulated unrealistic deep layers. The time variations show that while ACM2, QNSE, MYJ, UW produced a sudden decay of PBL around the day/night transition (15IST), the MYNN,YSU, BL schemes simulated extended mixed layers through night indicating a gradual decay of PBL and higher nocturnal PBL height (439 m to 575 m) (Table 2). During the stable morning conditions the local closures (QNSE,MYJ, MYNN, BL) except UW produced deeper layers in contrast to the non-local schemes YSU and ACM2 (Table 2). However, during the daytime, except QNSE and MYJ, the local closures produced relatively shallow convective layers in comparison to the non-local closures. Among nonlocal PBL schemes ACM2 produced deeper boundary layers (PBL height: m/59m) relative to the YSU (PBL height: 871.9m/29.97m) during both e convective and stable conditions. Among the local PBL schemes QNSE produced very deep boundary layers (PBL height: 1308m/259m) and UW produced shallow (PBL height: 402m/29m) boundary layers during the convective and stable conditions respectively indicating extremities. From the diurnal cycle the YSU, MYNN, BL schemes produced more realistic time variation in the PBL heights in better agreement with profile observations. Shin and Hong (2011) while evaluating WRF PBL formulations with CASES observations also reported simulation of deep mixed layers with QNSE, ACM2, MYJ; moderate layers with YSU and shallow layers with BL. Our present results from the tropical site corroborate findings of the above study. e) Eddy diffusivities: The differences in the simulation of dynamic and thermodynamic variables in the lower atmosphere could be related to the variation in the simulation of the eddy exchange
24 coefficients for momentum (K m ) and heat / moisture (K h ) by various schemes. We analysed the K h, K m parameters from various schemes and presented in Figure 17 and Table 3. Among the seven PBL schemes used ACM2 and BL assume the eddy diffusivity for momentum as identical to that for enthalpy (Prandtl number K m /K h ~1) whereas in MYJ, MYNN, QNSE, YSU and UW schemes K h is larger than K m. Under unstable conditions or strong shear the assumption of K m =K h may not be valid. The time averaged K m, K h for the period (01 UTC-19 UTC) representing unstable conditions and for the period (19 UTC 22 September UTC 23 September 2010) representing stable conditions are presented in the above figure. Each TKE scheme used a different approach to calculate S and l parameters used in the expression for K. As expected though all the schemes indicated higher eddy diffusivities during unstable regime relative to the stable regime the ACM2, MYNN and UW produced higher K m and K h values relative to other PBL schemes. While the ACM2, UW produced the largest diffusivities, the BL and QNSE simulated least diffusivities indicating extremities in turbulent mixing in the above schemes. The K m values with ACM2, UW were about 5 times higher relative to most PBL schemes. This had lead to stronger simulated winds with QNSE, MYJ schemes relative to the ACM2, UW as discussed earlier. Similarly the K h was comparatively higher in ACM2, UW which tend to produce higher mixing of heat or moisture and hence warmer and dry boundary layer. During the stable atmospheric conditions the simulated K m, K h were nearly of the same order of magnitude and ACM2, UW produced slight higher values of K m, K h. Hence in stable atmospheric conditions the simulated quantities from all the schemes nearly converged. Thus in general ACM2, UW simulated higher diffusivities for momentum and heat/ moisture in comparison to MYJ, YSU, MYNN, QNSE, BL which resulted in variations in the simulated PBL parameters. Overall the K m, K h values simulated with YSU, MYNN schemes are in the
25 intermediate range of the seven PBL schemes in both stable and convective conditions and hence produced lesser errors in the simulated mean variables. The mean model error statistics from various PBL simulations for different variables are presented in Table 4. As discussed earlier YSU/MYNN has shown better results in 2mtemperature prediction (RMSE=1.03/1.123, Bias=-0.004/-0.28) and MYJ/QNSE has shown largest cold bias (-0.68/-0.84; RMSE =1.33/1.43) relative to other schemes. For humidity, MYJ/QNSE showed less dry bias (-9.59/-9.76) and less RMSE (11.88/12.08) relative to other schemes. In the case of 10m-wind speed, ACM2 produced least bias 0.35 and RMSE (1.19) and MYJ/QNSE generated largest biases (1.44/1.37) and RMSE (1.87/1.79) of various PBL schemes. 6. Conclusions In this study numerical simulations were conducted with WRF-ARW mesoscale model to study the Planetary Boundary Layer characteristics at the tropical site Kalpakkam on the southeast coast of India. The ability of the model to reproduce the observed features was studied by conducting simulations with seven PBL schemes and by intercomparison. The observations collected during an intensive field measurement campaign RRE were used to verify the results from different numerical experiments. Diagnosis of the surface level meteorological variables (winds, temperature, humidity, surface fluxes) and their vertical variation indicated that for temperature the non-local PBL scheme YSU and the higher order local-closure TKE scheme MYNN produced better results. For humidity MYJ, MYNN, QNSE simulated reasonably well while ACM2, YSU produced large dry bias in the night time. For wind speed the combined local/ non-local scheme ACM2 produced better simulations, and local closures MYJ, QNSE considerably overestimated the winds while the other schemes (YSU, MYNN, BL, UW)
26 simulated moderately stronger winds relative to observations. However, all the PBL schemes reproduced the wind direction reasonably well. Though large underestimation of friction velocity was found in the case of ACM2, the higher eddy diffusivities found with ACM2 seem to provide better wind simulations than the other cases. While all the PBL schemes well simulated the stable morning profiles, there were large differences in the convective daytime profiles. The vertical extents of unstable surface layer, well mixed layer and inversion layer were differently simulated by different PBL parameterizations. A wide variation was found in the simulated PBL heights by different schemes. Relatively shallow convective boundary layers with UW (402 m), very deep mixed layers with ACM2, QNSE (1200m to 1308m) and moderately deep layers with YSU,BL,MYJ, MYNN (800m to 1070m) were simulated. This variation in mixing height simulation could be due to the use of different formulations for PBL height in different schemes. Considering the diurnal cycle the YSU, BL, MYNN schemes produced more realistic time variation in the PBL heights in better agreement with radiosonde profile data. Of all the seven experiments YSU and MYNN well simulated the mixed layer characteristics (lesser temperature, higher humidity, moderate winds) during the sea breeze time. A wide variation of diffusivities (K h, K m ) was produced by different PBL schemes which had led to variations in the vertical extent of mixed layer, magnitudes of thermodynnamical variables and momentum. The ACM2, UW, MYNN simulated higher diffusivities than MYJ, YSU, QNSE, BL for momentum and heat/ moisture in both stable and unstable atmospheric conditions. The higher exchange coefficients in the case of ACM2, UW, MYNN produced relatively lesser winds, warm and dry mixed layers in these cases in comparison to the other PBL schemes. The K m, K h values from YSU, MYJ and BL were in the intermediate range of the seven PBL schemes and they
27 produced lesser errors in the simulated mean variables. The variations in the simulated quantities could be partly also due to the variation in the use of different surface layer formulations with different PBLs as evident from the variation in the simulated friction velocity and surface fluxes. A comprehensive examination of all the schemes in the present study indicated that no scheme perfectly works for all the variables and for all the stability conditions. In general the observational comparison indicated the non-local scheme YSU produced more realistic atmospheric structures during the convective conditions and the TKE closures MYNN produced more realistic vertical structures during the stable conditions. These results corroborate the findings from earlier intercomparison studies by Hu et al. (2010), Shin et al and Steeneveld, (2008) with WRF model. The simulations in the present study were focused on a warm convective period at the tropical coastal site. The boundary layer structure simulated by WRF needs to be assessed for a stable cold season as well as an inland station to further study the performance of the PBL schemes in tropical conditions. It is also required to use continuous observations like Wind profiler to assess the temporal evolution of the PBL simulated by the model. Acknowledgements: Authors thank S.A.V. Satya Murty, Director, EIRSG, for the encouragement in carrying out the study. The observations used in the study were obtained from the Round Robin Exercise project coordinated by IGCAR and funded by Board of Research in Nuclear Sciences, DAE, Mumbai. Authors acknowledge NCEP/NOAA for the public access of GFS analysis/forecasts used in the study. ARW model was obtained from NCAR, USA. Thanks are due to anonymous reviewers for their technical comments which helped to improve the manuscript. References:
28 Arya, S.P Introduction to Micrometeorology. Academic Press, Apr 25, 2001, 420 pp. Berg, L.K., Zhong, S., Sensitivity of MM5-simulated boundary layer characteristics to turbulence parameterizations. J. Appl. Meteorol. 44 (9), Bhaskar Rao, D.V., Hari Prasad, D., Numerical prediction of the Orissa super-cyclone (1999): Sensitivity to the parameterization of convection, boundary layer and explicit moisture processes. Mausam. 57(1), Blackadar, A.K., High-resolution models of the planetary boundary layer. in : Pfafflin, J.R., Ziegler, E.N. (Eds.), Adv. Environ. Sci. Eng. vol.1, Gordon and Breach Science Publishers, pp Bougeault, P., Lacarrére, P., Parameterization of orography-induced turbulence in a mesobeta-scale model. Mon. Weather Rev. 117, Bright, D. R., Mullen, S.L., The sensitivity of the numerical simulation of the southwest monsoon boundary layer to the choice of PBL turbulence scheme in MM5. Wea. Forecasting, 17, Braun, S. A., Tao, W.K., Sensitivity of high-resolution simulations of Hurricane Bob (1991) to planetary boundary layer parameterizations. Mon. Weather Rev. 128, Bretherton, C.S., Park, S., A new moist turbulence parameterization in the Community Atmosphere Model. J. Climate. 22, Burk, S.D., Thompson, W.T., A vertically nested regional numerical prediction model with second-order closure physics. Mon. Weather Rev. 117, Chen, F., Pielke R. Sr., Mitchell, K., Development and application of land-surface models for mesoscale atmospheric models: in: Lakshmi, V., Alberston, J., Schaaake., (Eds.), Problems and Promises. Observation and Modeling of the Land Surface Hydrological Processes, American Geophysical Union, Fast, J.D., O Steen, B.L., Addis, R.P., 1 5. Advanced atmospheric modeling for emergency response. J. Appl. Meteorol. 34 (3), Garratt, J.R., The Atmospheric Boundary Layer. Cambridge Atmospheric and Space Science Series. 316 pp. Garcıa-Dıez M, Fernandez J, Fita L. Yague C. 13. Seasonal dependence of WRF model biases and sensitivity to PBL schemes over Europe. Q. J. R. Meteorol. Soc. 139: DOI: /qj.1976
29 Galperin B, Sukoriansky S (2010) Progress in turbulence parameterization for geophysical flows. In: The 3 rd international workshop on Next-generation NWP models: bridging parameterization, explicit clouds, and large eddies. Seoul, Korea, Gopalakrishnan, S.G., Frank, M., Zhang, J.A., Zhang, X., Bao, J.W., Tallapragada, V., A Study of the Impacts of Vertical Diffusion on the Structure and Intensity of the Tropical Cyclones Using the High-Resolution HWRF System. J. Atmos. Sci. 70, doi: Holtslag, A.A., Boville, B.A., Local versus nonlocal boundary layer diffusion in a global climate model. J. Climate. 6, Hong, S.Y., Pan, H.L., Nonlocal boundary layer vertical diffusion in a Medium-Range Forecast model. Mon. Weather Rev. 124, Hong, S.Y., Noh, Y., Dudhia, J., A new vertical diffusion package with an explicit treatment of entrainment processes. Mon. Weather Rev. 134, Hu, X.M., Nielson-Gammon, J.W., Zhang, X., Evaluation of Three Planetary Boundary Layer Schemes in the WRF Model. J. Appl. Meteorol. 49, Janjic, Z.A., The step-mountain coordinate: physics package. Mon Weather Rev 118: Janjic, Z.A., The step-mountain ETA coordinate model: further development of the convection, viscous sublayer and turbulence closure scheme. Mon. Weather. Rev. 122(5), Jimenez, P., Jorba, O., Parra, R., Baldasano, J.M., Evaluation of MM5 EMICAT2000 CM AQ performance and sensitivity in complex terrain: High resolution application to the nort heastern Iberian Peninsula. Atmos. Environ. 40, Kain, J.S., Fritsch, J.M., Convective parameterization for mesoscale models: the Kain- Fritcsh scheme, in: Emanuel, K.A., Raymond, D.J. (Eds.), The Representation of Cumulus Convection in Numerical Models. American Meteorological Society, Boston, MA, USA. Kim, S-W., McKeen, S.A., Hsie, E.Y., Trainer, M.K., Frost, G.J., Grell, G.A., Peckham, S.E., The Influence of PBL parameterizations on the distributions of chemical species in a mesoscale chemical transport model, WRF-Chem. 17th Symposium on Boundary Layers and Turbulence. American Meteorological Society, 21 May Abstract. J3.3 (
30 Madala, S., Satyanarayana, A.N.V., Narayana Rao, T Performance evaluation of PBL and cumulus parameterization schemes of WRF-ARW model in simulating severe thunderstorm events over Gadanki MST radar facility Case study. Atmos. Res.139, Mellor, G.L., Yamada, T., Development of a turbulence closure model for geophysical fluid problems. Rev. Geophys. Space Phys. 20, Misenis, C., Zhang, Y An examination of sensitivity of WRF/Chem predictions to physical parameterizations, horizontal grid spacing, and nesting options. Atmos. Res. 97, Mlawer, E.J., Taubman, S.J., Brown, P.D., Iacono, M.J., Clough, S.A., Radiative transfer for inhomogeneous atmosphere: RRTM, a validated correlated-k model for the longwave. J. Geophys. Res. 102, Montgomery, M. T., Smith, R. K., Nguyen, S., Sensitivity of tropical cyclone models to the surface drag coefficient. Q. J. Roy. Meteorol. Soc. 136, Mukhopadhyay, P., Taraphdar, S., Goswami, B.N., Krishnakumar, K., Indian summer monsoon precipitation climatology in a high-resolution regional climate model: Impacts of convective parameterization on systematic biases. Weather Forecast. 25(2), Nakanishi, M., Niino, H., An improved Mellor-Yamada level-3 model with condensation physics: Its design and verification. Bound. Layer Meteorol. 112, Noh, Y., Cheon, W. G., Hong, S. Y., Raasch, S., Improvement of the K-profile model for the planetary boundary layer based on large eddy simulation data. Bound. Layer Meteorol. 107, Nolan, D.S., Zhang, J.A., Stern, D.P., 2009a. Evaluation of planetary boundary layer parameterizations in tropical cyclones by comparison of in-situ data and high-resolution simulations of Hurricane Isabel (2003). Part I: Initialization, maximum winds, and outer core boundary layer structure. Mon. Weather. Rev. 137, Nolan, D.S., Zhang, J.A., Stern, D.P., 2009b. Evaluation of planetary boundary layer parameterizations in tropical cyclones by comparison of in-situ data and high-resolution simulations of Hurricane Isabel (2003). Part II: Inner core boundary layer and eyewall structure. Mon. Weather. Rev. 137, Pleim J.E., A simple, efficient solution of flux profile relationships in the atmospheric surface layer. J Appl Meteorol Clim 45: Pleim, J.E., A combined local and non-local closure model for the atmospheric boundary layer. Part 1: Model description and testing. J. Appl. Meteorol. Climatol. 46,
31 Poulos, G.S., Blumen, W., Fritts, D.C., Lundquist, J.K., Sun, J., Burns, S.P., Nappo, C., Banta, R., Newson, R., Cuxart, J., Terradellas, E., Balsley, B., Jensen, M., CASES-99: A comprehensive investigation of the stable nocturnal boundary layer. Bull. Am. Meteorol. Soc. 83(4), Santos-Alamillos, F.J., Pozo-Va Zquez, D., Ruiz-Arias, J.A., Lara-Fanego, V., Tovar-Pescador. J Analysis of WRF Model Wind Estimate Sensitivity to Physics Parameterization Choice and Terrain Representation in Andalusia (Southern Spain). J Appl Meteorology and Climatology. Vol 52, Sanjay, J., Assessment of Atmospheric Boundary-Layer Processes represented in the numerical model MM5 for a Clear Sky Day using LASPEX Observations. Bound. Layer Meteorol, 129, Shin, H.H., Hong, S.Y., Intercomparison of Planetary Boundary-Layer Parameterizations in the WRF Model for a Single Day from CASES-99. Bound. Layer Meteorol. 139, Skamarock W.C., Klemp, J.B., Dudhia J., Gill D.O., Barker D.M., Duda, M.G., Huang X.Y., Wang, W., Powers J.G., A description of the advanced research WRF Version 3. NCAR Technical Note, NCAR/TN-475+STR. Mesoscale and Microscale Meteorology Division, National Center for Atmospheric Research, Boulder, CO, USA. Smith, R.K., Thomsen, G.L., Dependence of tropical-cyclone intensification on the boundary-layer representation in a numerical model. Q. J. R. Meteorol. Soc. 136, Srinivas, C.V., Venkatesan, R., Bhaskar Rao, D.V., Hari Prasad, D., 2007a. Numerical Simulation of Andhra Severe Cyclone (2003): Model Sensitivity to the Boundary Layer and Convection Parameterization. Pure Appl. Geophys. 164, Srinivas, C.V., Venkatesan, R., Bagavath Singh, A., 2007b. Sensitivity of mesoscale simulations of land-sea breeze to boundary layer parameterization. Atmos. Environ. 41, Srinivas, C.V., Bagavath Singh, A., Venkatesan, R., Baskaran, R., Creation of Benchmark Meteorological Observations for RRE on Atmospheric Flowfield Simulation at Kalpakkam. IGC Report 213. Indira Gandhi Centre for Atomic Research, Kalpakkam , Tamilnadu, India. Srinivas, C.V., Bhaskar Rao, D.V., Yesubabu, V., Baskaran, R., Venkatraman, B., 2012a. Tropical cyclone predictions over the Bay of Bengal using the high-resolution Advanced Research Weather Research and Forecasting (ARW) model. Q. J. R. Meteorol. Soc. DOI: /qj.2064.
32 Steeneveld, G.J., Mauritsen, T., DeBruijn, E.I.F., De Arellano, J.V.G., Svensson, G., Holtslag, A.A.M., Evaluation of limited-area models for the representation of the diurnal cycle and contrasting nights in CASES-99. J Appl. Meteorol. Climatol. 47, Stensrud, D., Parameterization Schemes: Keys to Understanding Numerical Weather Prediction Models. Cambridge University Press. 459 pp. Stull, RB., An introduction to boundary layer meteorology. Kluwer, Dordrecht, Holland, pp680. Sukoriansky, S., Galperin, B., Perov, V., Application of a new spectral theory of stable stratified turbulence to the atmospheric boundary layer over sea ice. Bound. Layer Meteorol. 117, Troen, I., Mahrt, L., A simple model of the atmospheric boundary layer: Sensitivity to surface evaporation. Bound. Layer Meteorol. 37, Vogelezang, D. H. P., Holtslag, A. A. M., Evaluation and model impacts of alternative boundary-layer height formulations. Bound. Layer Meteorol. 81, Yerramilli, A., Challa, V.S., Dodla, V.B.R., Dasari, H.P., Young, J.H., Patrick, C., Baham, J.M., Hughes, R., Hardy, M.G., Swanier, S.J., Simulation of Surface ozone pollution in the Central Gulf Coast Region using WRF/Chem model: sensitivity to PBL and land surface physics. Adv. Meteorol. Article ID , pp. 24. doi: /2010/ Yerramilli, A., Challa, V.S., Dodla, V.B.R., Myles, L., Pendergrass, W.R., Vogel, C.A., Tuluri, F., Baham, J.M., Hughes, R., Patrick, C., Young, J., Swanier, S., Simulation of surface ozone pollution in the Central Gulf Coastal region during summer synopti c condition using WRF/Chem air quality model. Atmos. Pollut. Res. 3, doi: /APR Zhang, D., Anthes, R.A., A high-resolution model of the planetary boundary layer sensitivity tests and comparison with SESAME-79 data. J Appl Meteorol 21: Zhang, Y., Liu, P., Pun, B., Seigneur, C., A comprehensive performance evaluation of M M5 CMAQ for the summer 1999 southern oxidants study episode Part I: Evaluation prot ocols, databases, and meteorological predictions. Atmos. Environ. 40,
33 LIST OF TABLES S.No Table Title 1. Details of the model configuration 2. Comparison of simulated PBL height from different experiments 3. Comparison of diffusivity coefficients under different stability conditions from experiments with different PBL schemes 4. Model error statistics
34 LIST OF FIGURES S.No Table Title 1. Domain specification used in ARW (a) and study area in the fine nest domain (b) details of observation instruments. 2. Synoptic Weather conditions during the observation period (a) mean sea level pressure and Winds at 925hPa (b) geopotential height (m) and Winds at 200hPa. 3. Time variation of the 2m level temperature at a) Anupuram and b) Kalpakkam stations. 4. Time variation of the 2m level relative humidity at a) Anupuram and b) Kalpakkam stations. 5. Time variation of the 10m level wind speed (ms -1 ) at Anupuram and Kalpakkam stations. 6. Comparison of Wind direction at 10 m level from different simulations along with observations at a) Anupuram and b) Kalpakkam. 7. Time variation of friction velocity simulated at Anupuram station in different numerical experiments. 8. Time variation of surface fluxes simulated in different numerical experiments a) sensible heat flux (Watts/m 2 ) and b) latent heat flux (Watts/m 2 ). 9. Simulated surface level flow-field at 12 IST (06UTC) 22 September 2010 from simulations with different PBL schemes a) YSU b) ACM2 c) MYJ d) MYNN e) QNSE f) BL and g) UW 10. Simulated vertical profiles of potential temperature at a) 06 IST, b) 12 IST and c) 16 IST 23 September 2010 at Anupuram along with GPS sonde profiles 11. Simulated vertical profiles of relative humidity at a) 06 IST, b) 12 IST and c) 16 IST on 23 September 2010 at Anupuram along with GPS sonde profiles 12. Simulated vertical profiles of wind speed at a) 06 IST, b) 12 IST and c) 16 IST on 23 September 2010 at Anupuram along with GPS sonde profiles 13. Simulated vertical profiles of wind direction at a) 06 IST, b) 12 IST and c) 16 IST on 23 September 2010 at Anupuram along with GPS sonde profiles 14. Time-height section of potential temperature (θ) in September 2010 at Kalpakkam from different numerical experiments a)ysu, b)acm2, c)myj, d)mynn, e) QNSE, f) BL g)uw. The temperature contours are drawn as (θ-273) and shown in units of degrees Kelvin. Times indicated on the x-axis are in UTC. 15. Time-height section of specific humidity (kg/kg) in September 2010 at Kalpakkam from different numerical experiments a)ysu, b)acm2, c)myj, d)mynn, e)qnse, f)bl, g)uw. Times indicated on the x-axis are in UTC. 16. Time variation of PBL height in September 2010 from simulations with different PBL schemes along with observed PBL height (in dots) at Anupuram. 17. Eddy diffusivity coefficients K m (for momentum) and K h (for enthalpy). The top panels (a for Km; b for Kh) are for the unstable conditions and the bottom panels (c for Km; d for Kh) are for the stable conditions.
35 Fig1
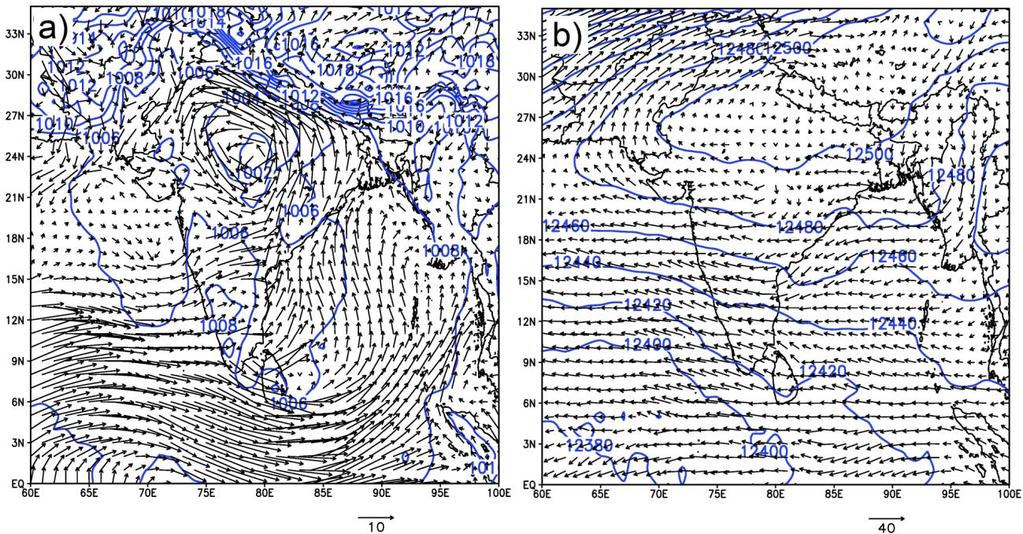
36 Fig2
37 Fig3
38 Fig4
39 Fig5
40 Fig6
41 Fig7
42 Fig8
43 Fig9
44 Fig10
45 Fig11
46 Fig12
47 Fig13
48 Fig14
49 Fig15
The Fifth-Generation NCAR / Penn State Mesoscale Model (MM5) Mark Decker Feiqin Xie ATMO 595E November 23, 2004 Department of Atmospheric Science
 Mark Decker Feiqin Xie ATMO 595E November 23, 2004 Department of Atmospheric Science") The Fifth-Generation NCAR / Penn State Mesoscale Model (MM5) Mark Decker Feiqin Xie ATMO 595E November 23, 2004 Department of Atmospheric Science Outline Basic Dynamical Equations Numerical Methods Initialization
The Fifth-Generation NCAR / Penn State Mesoscale Model (MM5) Mark Decker Feiqin Xie ATMO 595E November 23, 2004 Department of Atmospheric Science Outline Basic Dynamical Equations Numerical Methods Initialization
Evaluating winds and vertical wind shear from Weather Research and Forecasting model forecasts using seven planetary boundary layer schemes
 WIND ENERGY Wind Energ. 2014; 17:39 55 Published online 28 October 2012 in Wiley Online Library (wileyonlinelibrary.com)..1555 RESEARCH ARTICLE Evaluating winds and vertical wind shear from Weather Research
WRF/Chem forecasting of boundary layer meteorology and O 3. Xiaoming 湖南气象局 Nov. 22 th 2013
 WRF/Chem forecasting of boundary layer meteorology and O 3 Xiaoming Hu @ 湖南气象局 Nov. 22 th 2013 Importance of O 3, Aerosols Have adverse effects on human health and environments Reduce visibility Play an
Impacts of the Lowest Model Level Height on the Performance of Planetary Boundary Layer Parameterizations
 664 M O N T H L Y W E A T H E R R E V I E W VOLUME 140 Impacts of the Lowest Model Level Height on the Performance of Planetary Boundary Layer Parameterizations HYEYUM HAILEY SHIN AND SONG-YOU HONG Department
Uncertainties in planetary boundary layer schemes and current status of urban boundary layer simulations at OU
 Uncertainties in planetary boundary layer schemes and current status of urban boundary layer simulations at OU Xiaoming Hu September 16 th @ 3:00 PM, NWC 5600 Contributors: Fuqing Zhang, Pennsylvania State
A Modeling Study of PBL heights
 A Modeling Study of PBL heights JEFFREY D. DUDA Dept. of Geological and Atmospheric Sciences, Iowa State University, Ames, Iowa I. Introduction The planetary boundary layer (PBL) is the layer in the lower
VALIDATION OF BOUNDARY-LAYER WINDS FROM WRF MESOSCALE FORECASTS WITH APPLICATIONS TO WIND ENERGY FORECASTING
 VALIDATION OF BOUNDARY-LAYER WINDS FROM WRF MESOSCALE FORECASTS WITH APPLICATIONS TO WIND ENERGY FORECASTING Caroline Draxl, Andrea N. Hahmann, Alfredo Peña, Jesper N. Nissen, and Gregor Giebel Risø National
An analysis of Wintertime Cold-Air Pool in Armenia Using Climatological Observations and WRF Model Data
 An analysis of Wintertime Cold-Air Pool in Armenia Using Climatological Observations and WRF Model Data Hamlet Melkonyan 1,2, Artur Gevorgyan 1,2, Sona Sargsyan 1, Vladimir Sahakyan 2, Zarmandukht Petrosyan
Investigation of surface layer parameterization in WRF model & its impact on modeled nocturnal wind biases
 Investigation of surface layer parameterization in WRF model & its impact on modeled nocturnal wind biases Pius Lee 1, Fantine Ngan 1,2, Hang Lei 1,2, Li Pan 1,2, Hyuncheol Kim 1,2, and Daniel Tong 1,2
The Effect of Sea Spray on Tropical Cyclone Intensity
 The Effect of Sea Spray on Tropical Cyclone Intensity Jeffrey S. Gall, Young Kwon, and William Frank The Pennsylvania State University University Park, Pennsylvania 16802 1. Introduction Under high-wind
Evaluation of nonlocal and local planetary boundary layer schemes in the WRF model
 JOURNAL OF GEOPHYSICAL RESEARCH, VOL. 117,, doi:10.1029/2011jd017080, 2012 Evaluation of nonlocal and local planetary boundary layer schemes in the WRF model Bo Xie, 1 Jimmy C. H. Fung, 1,2 Allen Chan,
Impact of different cumulus parameterizations on the numerical simulation of rain over southern China
 Impact of different cumulus parameterizations on the numerical simulation of rain over southern China P.W. Chan * Hong Kong Observatory, Hong Kong, China 1. INTRODUCTION Convective rain occurs over southern
Evaluation of High-Resolution WRF Model Simulations of Surface Wind over the West Coast of India
 ATMOSPHERIC AND OCEANIC SCIENCE LETTERS, 2014, VOL. 7, NO. 5, 458 463 Evaluation of High-Resolution WRF Model Simulations of Surface Wind over the West Coast of India S. VISHNU and P. A. FRANCIS Indian
Advanced Hurricane WRF (AHW) Physics
 Physics") Advanced Hurricane WRF (AHW) Physics Jimy Dudhia MMM Division, NCAR 1D Ocean Mixed-Layer Model 1d model based on Pollard, Rhines and Thompson (1973) was added for hurricane forecasts Purpose is to represent
Advanced Hurricane WRF (AHW) Physics Jimy Dudhia MMM Division, NCAR 1D Ocean Mixed-Layer Model 1d model based on Pollard, Rhines and Thompson (1973) was added for hurricane forecasts Purpose is to represent
SIMULATION OF ATMOSPHERIC STATES FOR THE CASE OF YEONG-GWANG STORM SURGE ON 31 MARCH 2007 : MODEL COMPARISON BETWEEN MM5, WRF AND COAMPS
 SIMULATION OF ATMOSPHERIC STATES FOR THE CASE OF YEONG-GWANG STORM SURGE ON 31 MARCH 2007 : MODEL COMPARISON BETWEEN MM5, WRF AND COAMPS JEONG-WOOK LEE 1 ; KYUNG-JA HA 1* ; KI-YOUNG HEO 1 ; KWANG-SOON
Simulating roll clouds associated with low-level convergence in WRF
 Simulating roll clouds associated with low-level convergence in WRF Abhnil Prasad1,3, Steven Sherwood1,3 and Hélène Brogniez2 1 Climate Change Research Centre, University of New South Wales, Sydney, NSW,
Sensitivity of precipitation forecasts to cumulus parameterizations in Catalonia (NE Spain)
") Sensitivity of precipitation forecasts to cumulus parameterizations in Catalonia (NE Spain) Jordi Mercader (1), Bernat Codina (1), Abdelmalik Sairouni (2), Jordi Cunillera (2) (1) Dept. of Astronomy and
Sensitivity of precipitation forecasts to cumulus parameterizations in Catalonia (NE Spain) Jordi Mercader (1), Bernat Codina (1), Abdelmalik Sairouni (2), Jordi Cunillera (2) (1) Dept. of Astronomy and
Weather Research and Forecasting Model. Melissa Goering Glen Sampson ATMO 595E November 18, 2004
 Weather Research and Forecasting Model Melissa Goering Glen Sampson ATMO 595E November 18, 2004 Outline What does WRF model do? WRF Standard Initialization WRF Dynamics Conservation Equations Grid staggering
A New Vertical Diffusion Package with an Explicit Treatment of Entrainment Processes
 2318 M O N T H L Y W E A T H E R R E V I E W VOLUME 134 A New Vertical Diffusion Package with an Explicit Treatment of Entrainment Processes SONG-YOU HONG AND YIGN NOH Department of Atmospheric Sciences,
A New Ocean Mixed-Layer Model Coupled into WRF
 ATMOSPHERIC AND OCEANIC SCIENCE LETTERS, 2012, VOL. 5, NO. 3, 170 175 A New Ocean Mixed-Layer Model Coupled into WRF WANG Zi-Qian 1,2 and DUAN An-Min 1 1 The State Key Laboratory of Numerical Modeling
CHAPTER 8 NUMERICAL SIMULATIONS OF THE ITCZ OVER THE INDIAN OCEAN AND INDONESIA DURING A NORMAL YEAR AND DURING AN ENSO YEAR
 CHAPTER 8 NUMERICAL SIMULATIONS OF THE ITCZ OVER THE INDIAN OCEAN AND INDONESIA DURING A NORMAL YEAR AND DURING AN ENSO YEAR In this chapter, comparisons between the model-produced and analyzed streamlines,
Sensitivity of tropical cyclone Jal simulations to physics parameterizations
 Sensitivity of tropical cyclone Jal simulations to physics parameterizations R Chandrasekar and C Balaji Department of Mechanical Engineering, Indian Institute of Technology, Madras, Chennai 6 36, India.
Assessing WRF PBL Schemes for Wind Energy Applications
 Assessing WRF PBL Schemes for Wind Energy Applications Branko Kosović, Yubao Liu, Youwei Liu, Will Cheng NCAR Workshop May 12, 21 NATIONAL CENTER FOR ATMOSPHERIC RESEARCH In the Past PBL Parameterizations
Towards the Fourth GEWEX Atmospheric Boundary Layer Model Inter-Comparison Study (GABLS4)
") Towards the Fourth GEWEX Atmospheric Boundary Layer Model Inter-Comparison Study (GABLS4) Timo Vihma 1, Tiina Nygård 1, Albert A.M. Holtslag 2, Laura Rontu 1, Phil Anderson 3, Klara Finkele 4, and Gunilla
Towards the Fourth GEWEX Atmospheric Boundary Layer Model Inter-Comparison Study (GABLS4) Timo Vihma 1, Tiina Nygård 1, Albert A.M. Holtslag 2, Laura Rontu 1, Phil Anderson 3, Klara Finkele 4, and Gunilla
UNIVERSITY OF CALIFORNIA
 UNIVERSITY OF CALIFORNIA Methods of Improving Methane Emission Estimates in California Using Mesoscale and Particle Dispersion Modeling Alex Turner GCEP SURE Fellow Marc L. Fischer Lawrence Berkeley National
Lecture 12. The diurnal cycle and the nocturnal BL
 Lecture 12. The diurnal cycle and the nocturnal BL Over flat land, under clear skies and with weak thermal advection, the atmospheric boundary layer undergoes a pronounced diurnal cycle. A schematic and
6.11 BOUNDARY LAYER EVOLUTION OVER PHILADELPHIA, PA DURING THE 1999 NARSTO-NE-OPS PROJECT: COMPARISON OF OBSERVATIONS AND MODELING RESULTS
 6.11 BOUNDARY LAYER EVOLUTION OVER PHILADELPHIA, PA DURING THE 1999 NARSTO-NE-OPS PROJECT: COMPARISON OF OBSERVATIONS AND MODELING RESULTS Kevin L. Civerolo 1,*, Jia-Yeong Ku 1, Bruce G. Doddridge 2, Richard
Meteorological Modeling using Penn State/NCAR 5 th Generation Mesoscale Model (MM5)
") TSD-1a Meteorological Modeling using Penn State/NCAR 5 th Generation Mesoscale Model (MM5) Bureau of Air Quality Analysis and Research Division of Air Resources New York State Department of Environmental
TSD-1a Meteorological Modeling using Penn State/NCAR 5 th Generation Mesoscale Model (MM5) Bureau of Air Quality Analysis and Research Division of Air Resources New York State Department of Environmental
Testing and Improving Pacific NW PBL forecasts
 Testing and Improving Pacific NW PBL forecasts Chris Bretherton and Matt Wyant University of Washington Eric Grimit 3Tier NASA MODIS Image Testing and Improving Pacific NW PBL forecasts PBL-related forecast
Tue 2/16/2016. Wrap-up on some WRF PBL options Paper presentations (Hans, Pat, Dylan, Masih, Xia, James) Begin convective parameterization (if time)
 Begin convective parameterization (if time)") Tue 2/16/2016 Finish turbulence and PBL closure: Wrap-up on some WRF PBL options Paper presentations (Hans, Pat, Dylan, Masih, Xia, James) Begin convective parameterization (if time) Reminders/announcements:
Tue 2/16/2016 Finish turbulence and PBL closure: Wrap-up on some WRF PBL options Paper presentations (Hans, Pat, Dylan, Masih, Xia, James) Begin convective parameterization (if time) Reminders/announcements:
TAPM Modelling for Wagerup: Phase 1 CSIRO 2004 Page 41
 We now examine the probability (or frequency) distribution of meteorological predictions and the measurements. Figure 12 presents the observed and model probability (expressed as probability density function
Creating Meteorology for CMAQ
 Creating Meteorology for CMAQ Tanya L. Otte* Atmospheric Sciences Modeling Division NOAA Air Resources Laboratory Research Triangle Park, NC * On assignment to the National Exposure Research Laboratory,
P Hurricane Danielle Tropical Cyclogenesis Forecasting Study Using the NCAR Advanced Research WRF Model
 P1.2 2004 Hurricane Danielle Tropical Cyclogenesis Forecasting Study Using the NCAR Advanced Research WRF Model Nelsie A. Ramos* and Gregory Jenkins Howard University, Washington, DC 1. INTRODUCTION Presently,
4.4 EVALUATION OF AN IMPROVED CONVECTION TRIGGERING MECHANISM IN THE NCAR COMMUNITY ATMOSPHERE MODEL CAM2 UNDER CAPT FRAMEWORK
 . EVALUATION OF AN IMPROVED CONVECTION TRIGGERING MECHANISM IN THE NCAR COMMUNITY ATMOSPHERE MODEL CAM UNDER CAPT FRAMEWORK Shaocheng Xie, James S. Boyle, Richard T. Cederwall, and Gerald L. Potter Atmospheric
THE INFLUENCE OF HIGHLY RESOLVED SEA SURFACE TEMPERATURES ON METEOROLOGICAL SIMULATIONS OFF THE SOUTHEAST US COAST
 THE INFLUENCE OF HIGHLY RESOLVED SEA SURFACE TEMPERATURES ON METEOROLOGICAL SIMULATIONS OFF THE SOUTHEAST US COAST Peter Childs, Sethu Raman, and Ryan Boyles State Climate Office of North Carolina and
WRF Model Simulated Proxy Datasets Used for GOES-R Research Activities
 WRF Model Simulated Proxy Datasets Used for GOES-R Research Activities Jason Otkin Cooperative Institute for Meteorological Satellite Studies Space Science and Engineering Center University of Wisconsin
INVESTIGATION FOR A POSSIBLE INFLUENCE OF IOANNINA AND METSOVO LAKES (EPIRUS, NW GREECE), ON PRECIPITATION, DURING THE WARM PERIOD OF THE YEAR
, ON PRECIPITATION, DURING THE WARM PERIOD OF THE YEAR") Proceedings of the 13 th International Conference of Environmental Science and Technology Athens, Greece, 5-7 September 2013 INVESTIGATION FOR A POSSIBLE INFLUENCE OF IOANNINA AND METSOVO LAKES (EPIRUS,
Proceedings of the 13 th International Conference of Environmental Science and Technology Athens, Greece, 5-7 September 2013 INVESTIGATION FOR A POSSIBLE INFLUENCE OF IOANNINA AND METSOVO LAKES (EPIRUS,
Observations and WRF simulations of fog events Engineering at the Spanish Northern Plateau
 Open Sciences doi:10.5194/asr-8-11-2012 Author(s) 2012. CC Attribution 3.0 License. Advances in Science & Research Open Access Proceedings Drinking Water Observations and WRF simulations of fog events
608 SENSITIVITY OF TYPHOON PARMA TO VARIOUS WRF MODEL CONFIGURATIONS
 608 SENSITIVITY OF TYPHOON PARMA TO VARIOUS WRF MODEL CONFIGURATIONS Phillip L. Spencer * and Brent L. Shaw Weather Decision Technologies, Norman, OK, USA Bonifacio G. Pajuelas Philippine Atmospheric,
GEWEX Atmospheric Boundary Layer Model
 GEWEX Atmospheric Boundary Layer Model Inter-comparison Studies Timo Vihma 1, Tiina Kilpeläinen 1, Albert A.M. Holtslag 2, Laura Rontu 1, Phil Anderson 3, Klara Finkele 4, and Gunilla Svensson 5 1 Finnish
Improved Atmospheric Stable Boundary Layer Formulations for Navy Seasonal Forecasting
 DISTRIBUTION STATEMENT A. Approved for public release; distribution is unlimited. Improved Atmospheric Stable Boundary Layer Formulations for Navy Seasonal Forecasting Michael Tjernström Department of
A Combined Local and Nonlocal Closure Model for the Atmospheric Boundary Layer. Part I: Model Description and Testing
 SEPTEMBER 2007 P L E I M 1383 A Combined Local and Nonlocal Closure Model for the Atmospheric Boundary Layer. Part I: Model Description and Testing JONATHAN E. PLEIM Atmospheric Sciences Modeling Division,*
Evaluation of Planetary Boundary Layer Scheme Sensitivities for the Purpose of Parameter Estimation
 3400 M O N T H L Y W E A T H E R R E V I E W VOLUME 138 Evaluation of Planetary Boundary Layer Scheme Sensitivities for the Purpose of Parameter Estimation JOHN W. NIELSEN-GAMMON Department of Atmospheric
Improved Representation of Boundary Layer Clouds over the Southeast Pacific in ARW-WRF Using a Modified Tiedtke Cumulus Parameterization Scheme*
 NOVEMBER 2011 Z H A N G E T A L. 3489 Improved Representation of Boundary Layer Clouds over the Southeast Pacific in ARW-WRF Using a Modified Tiedtke Cumulus Parameterization Scheme* CHUNXI ZHANG, YUQING
ABSTRACT 1. INTRODUCTION
 OBSERVATION, ANALYSIS AND MODELING OF THE SEA BREEZE CIRCULATION DURING THE NOAA/ARL-JSU METEOROLOGICAL FIELD EXPERIMENT SUMMER 2009 William R. Pendergrass, LaToya Myles, Christoph A. Vogel (NOAA/Air Resources
Work Plan. Air Quality Research Program (AQRP) Project 12-TN1
 Project 12-TN1") Work Plan Air Quality Research Program (AQRP) Project 12-TN1 Investigation of surface layer parameterization of the WRF model and its impact on the observed nocturnal wind speed bias: Period of investigation
Work Plan Air Quality Research Program (AQRP) Project 12-TN1 Investigation of surface layer parameterization of the WRF model and its impact on the observed nocturnal wind speed bias: Period of investigation
Surface layer parameterization in WRF
 Surface layer parameteriation in WRF Laura Bianco ATOC 7500: Mesoscale Meteorological Modeling Spring 008 Surface Boundary Layer: The atmospheric surface layer is the lowest part of the atmospheric boundary
MM5 v3.6.1 and WRF v3.5.1 model comparison of standard and surface energy variables in the development of the planetary boundary layer
 doi:10.5194/gmd-7-2693-2014 Author(s) 2014. CC Attribution 3.0 License. MM5 v3.6.1 and WRF v3.5.1 model comparison of standard and surface energy variables in the development of the planetary boundary
PERFORMANCE OF THE WRF-ARW IN THE COMPLEX TERRAIN OF SALT LAKE CITY
 P2.17 PERFORMANCE OF THE WRF-ARW IN THE COMPLEX TERRAIN OF SALT LAKE CITY Jeffrey E. Passner U.S. Army Research Laboratory White Sands Missile Range, New Mexico 1. INTRODUCTION The Army Research Laboratory
2 1-D Experiments, near surface output
 Tuning CBR A.B.C. Tijm 1 Introduction The pre 6.2 reference Hirlam versions have a positive bias in the wind direction under stable conditions (night and winter conditions), accompanied by too strong near
PBL and precipitation interaction and grey-zone issues
 PBL and precipitation interaction and grey-zone issues Song-You Hong, Hyun-Joo Choi, Ji-Young Han, and Young-Cheol Kwon (Korea Institute of Atmospheric Prediction Systems: KIAPS) Overview of KIAPS (seminar
Regional Scale Modeling and Numerical Weather Prediction
 Regional Scale Modeling and Numerical Weather Prediction Jimy Dudhia NCAR/MMM Mesoscale & Microscale Meteorological Division / NCAR Overview of talk WRF Modeling System Overview WRF Model Dynamics Physics
Atmospheric Boundary Layers
 Lecture for International Summer School on the Atmospheric Boundary Layer, Les Houches, France, June 17, 2008 Atmospheric Boundary Layers Bert Holtslag Introducing the latest developments in theoretical
Improved rainfall and cloud-radiation interaction with Betts-Miller-Janjic cumulus scheme in the tropics
 Improved rainfall and cloud-radiation interaction with Betts-Miller-Janjic cumulus scheme in the tropics Tieh-Yong KOH 1 and Ricardo M. FONSECA 2 1 Singapore University of Social Sciences, Singapore 2
Air Pollution Meteorology
 Air Pollution Meteorology Government Pilots Utilities Public Farmers Severe Weather Storm / Hurricane Frost / Freeze Significant Weather Fog / Haze / Cloud Precipitation High Resolution Weather & Dispersion
Analysis of the role of the planetary boundary layer schemes during a severe convective storm
 Annales Geophysicae (2004) 22: 1861 1874 SRef-ID: 1432-0576/ag/2004-22-1861 European Geosciences Union 2004 Annales Geophysicae Analysis of the role of the planetary boundary layer schemes during a severe
Evaluation of nonlocal and local planetary boundary layer schemes in the WRF model
 Evaluation of nonlocal and local planetary boundary layer schemes in the WRF model Bo Xie,Jimmy C. H. Fung,Allen Chan,and Alexis Lau Received 31 October 2011; revised 13 May 2012; accepted 14 May 2012;
Validation of Boundary Layer Winds from WRF Mesoscale Forecasts over Denmark
 Downloaded from orbit.dtu.dk on: Dec 14, 2018 Validation of Boundary Layer Winds from WRF Mesoscale Forecasts over Denmark Hahmann, Andrea N.; Pena Diaz, Alfredo Published in: EWEC 2010 Proceedings online
Supplementary Material
 Supplementary Material Model physical parameterizations: The study uses the single-layer urban canopy model (SLUCM: Kusaka et al. 2001; Kusaka and Kimura 2004; Liu et al. 2006; Chen and Dudhia 2001; Chen
Forecasting the Diabatic Offshore Wind Profile at FINO1 with the WRF Mesoscale Model
 Forecasting the Diabatic Offshore Wind Profile at with the WRF Mesoscale Model D. Muñoz-Esparza; von Karman Institute for Fluid Dynamics, Belgium B. Cañadillas; DEWI GmbH, Wilhelmshaven D. Muñoz-Esparza
Modeling rainfall diurnal variation of the North American monsoon core using different spatial resolutions
 Modeling rainfall diurnal variation of the North American monsoon core using different spatial resolutions Jialun Li, X. Gao, K.-L. Hsu, B. Imam, and S. Sorooshian Department of Civil and Environmental
Polar Meteorology Group, Byrd Polar Research Center, The Ohio State University, Columbus, Ohio
 JP2.14 ON ADAPTING A NEXT-GENERATION MESOSCALE MODEL FOR THE POLAR REGIONS* Keith M. Hines 1 and David H. Bromwich 1,2 1 Polar Meteorology Group, Byrd Polar Research Center, The Ohio State University,
Addressing Diurnal Temperature Biases in the WRF Model
 Addressing Diurnal Temperature Biases in the WRF Model Jeffrey Massey University of Utah Collaborators: Jim Steenburgh, Jason Knievel, Sebastian Hoch, Josh Hacker Long term 2-m temperature verification
Numerical simulation of marine stratocumulus clouds Andreas Chlond
 Numerical simulation of marine stratocumulus clouds Andreas Chlond Marine stratus and stratocumulus cloud (MSC), which usually forms from 500 to 1000 m above the ocean surface and is a few hundred meters
A Note on the Estimation of Eddy Diffusivity and Dissipation Length in Low Winds over a Tropical Urban Terrain
 Pure appl. geophys. 160 (2003) 395 404 0033 4553/03/020395 10 Ó Birkhäuser Verlag, Basel, 2003 Pure and Applied Geophysics A Note on the Estimation of Eddy Diffusivity and Dissipation Length in Low Winds
A WRF Ensemble for Improved Wind Speed Forecasts at Turbine Height
 212 W E A T H E R A N D F O R E C A S T I N G VOLUME 28 A WRF Ensemble for Improved Wind Speed Forecasts at Turbine Height ADAM J. DEPPE AND WILLIAM A. GALLUS JR. Department of Geological and Atmospheric
A R C T E X Results of the Arctic Turbulence Experiments Long-term Monitoring of Heat Fluxes at a high Arctic Permafrost Site in Svalbard
 A R C T E X Results of the Arctic Turbulence Experiments www.arctex.uni-bayreuth.de Long-term Monitoring of Heat Fluxes at a high Arctic Permafrost Site in Svalbard 1 A R C T E X Results of the Arctic
Tropical cyclone predictions over the Bay of Bengal using the high-resolution Advanced Research Weather Research and Forecasting (ARW) model
 model") Quarterly Journal of the Royal Meteorological Society Q. J. R. Meteorol. Soc. 139: 1810 1825, October 2013 A Tropical cyclone predictions over the Bay of Bengal using the high-resolution Advanced Research
Quarterly Journal of the Royal Meteorological Society Q. J. R. Meteorol. Soc. 139: 1810 1825, October 2013 A Tropical cyclone predictions over the Bay of Bengal using the high-resolution Advanced Research
Atm S 547 Boundary Layer Meteorology
 Lecture 8. Parameterization of BL Turbulence I In this lecture Fundamental challenges and grid resolution constraints for BL parameterization Turbulence closure (e. g. first-order closure and TKE) parameterizations
SCIENCE CHINA Earth Sciences
 SCIENCE CHINA Earth Sciences RESEARCH PAPER July 2014 Vol.57 No.7: 1480 1493 doi: 10.1007/s11430-013-4801-4 Impacts of boundary layer parameterization schemes and air-sea coupling on WRF simulation of
Development of a Coupled Atmosphere-Ocean-Land General Circulation Model (GCM) at the Frontier Research Center for Global Change
 at the Frontier Research Center for Global Change") Chapter 1 Atmospheric and Oceanic Simulation Development of a Coupled Atmosphere-Ocean-Land General Circulation Model (GCM) at the Frontier Research Center for Global Change Project Representative Tatsushi
Chapter 1 Atmospheric and Oceanic Simulation Development of a Coupled Atmosphere-Ocean-Land General Circulation Model (GCM) at the Frontier Research Center for Global Change Project Representative Tatsushi
MARINE BOUNDARY-LAYER HEIGHT ESTIMATED FROM NWP MODEL OUTPUT BULGARIA
 MARINE BOUNDARY-LAYER HEIGHT ESTIMATED FROM NWP MODEL OUTPUT Sven-Erik Gryning 1 and Ekaterina Batchvarova 1, 1 Wind Energy Department, Risø National Laboratory, DK-4 Roskilde, DENMARK National Institute
Wind Flow Modeling The Basis for Resource Assessment and Wind Power Forecasting
 Wind Flow Modeling The Basis for Resource Assessment and Wind Power Forecasting Detlev Heinemann ForWind Center for Wind Energy Research Energy Meteorology Unit, Oldenburg University Contents Model Physics
Influences of PBL Parameterizations on Warm-Season Convection-Permitting Regional Climate Simulations
 Influences of PBL Parameterizations on Warm-Season Convection-Permitting Regional Climate Simulations Stan Trier (NCAR/MMM) Andreas Prein (NCAR/ASP) and Changhai Liu (NCAR/RAL) GEWEX Convection-Permitting
Diagnosing the Climatology and Interannual Variability of North American Summer Climate with the Regional Atmospheric Modeling System (RAMS)
") Diagnosing the Climatology and Interannual Variability of North American Summer Climate with the Regional Atmospheric Modeling System (RAMS) Christopher L. Castro and Roger A. Pielke, Sr. Department of
Diagnosing the Climatology and Interannual Variability of North American Summer Climate with the Regional Atmospheric Modeling System (RAMS) Christopher L. Castro and Roger A. Pielke, Sr. Department of
Development of a High-Resolution Coupled Atmosphere-Ocean-Land General Circulation Model for Climate System Studies
 Chapter 1 Earth Science Development of a High-Resolution Coupled Atmosphere-Ocean-Land General Circulation Model for Climate System Studies Project Representative Tatsushi Tokioka Frontier Research Center
Wind conditions based on coupling between a mesoscale and microscale model
 Wind conditions based on coupling between a mesoscale and microscale model José Laginha Palma and Carlos Veiga Rodrigues CEsA Centre for Wind Energy and Atmospheric Flows Faculty of Engineering, University
Mesoscale meteorological models. Claire L. Vincent, Caroline Draxl and Joakim R. Nielsen
 Mesoscale meteorological models Claire L. Vincent, Caroline Draxl and Joakim R. Nielsen Outline Mesoscale and synoptic scale meteorology Meteorological models Dynamics Parametrizations and interactions
The applicability of Monin Obukhov scaling for sloped cooled flows in the context of Boundary Layer parameterization
 Julia Palamarchuk Odessa State Environmental University, Ukraine The applicability of Monin Obukhov scaling for sloped cooled flows in the context of Boundary Layer parameterization The low-level katabatic
2.1 Temporal evolution
 15B.3 ROLE OF NOCTURNAL TURBULENCE AND ADVECTION IN THE FORMATION OF SHALLOW CUMULUS Jordi Vilà-Guerau de Arellano Meteorology and Air Quality Section, Wageningen University, The Netherlands 1. MOTIVATION
ABSTRACT 2 DATA 1 INTRODUCTION
 16B.7 MODEL STUDY OF INTERMEDIATE-SCALE TROPICAL INERTIA GRAVITY WAVES AND COMPARISON TO TWP-ICE CAM- PAIGN OBSERVATIONS. S. Evan 1, M. J. Alexander 2 and J. Dudhia 3. 1 University of Colorado, Boulder,
Environmental Fluid Dynamics
 Environmental Fluid Dynamics ME EN 7710 Spring 2015 Instructor: E.R. Pardyjak University of Utah Department of Mechanical Engineering Definitions Environmental Fluid Mechanics principles that govern transport,
The sensitivity to the microphysical schemes on the skill of forecasting the track and intensity of tropical cyclones using WRF-ARW model
 J. Earth Syst. Sci. (2017) 126:57 c Indian Academy of Sciences DOI 10.1007/s12040-017-0830-2 The sensitivity to the microphysical schemes on the skill of forecasting the track and intensity of tropical
Numerical Experiments of Tropical Cyclone Seasonality over the Western North Pacific
 Numerical Experiments of Tropical Cyclone Seasonality over the Western North Pacific Dong-Kyou Lee School of Earth and Environmental Sciences Seoul National University, Korea Contributors: Suk-Jin Choi,
NUMERICAL SIMULATION OF A BAY OF BENGAL TROPICAL CYCLONE: A COMPARISON OF THE RESULTS FROM EXPERIMENTS WITH JRA-25 AND NCEP REANALYSIS FIELDS
 NUMERICAL SIMULATION OF A BAY OF BENGAL TROPICAL CYCLONE: A COMPARISON OF THE RESULTS FROM EXPERIMENTS WITH JRA-25 AND NCEP REANALYSIS FIELDS Dodla Venkata Bhaskar Rao Desamsetti Srinivas and Dasari Hari
Turbulence in the Stable Boundary Layer
 Turbulence in the Stable Boundary Layer Chemical-Biological Information Systems Austin, TX 11 January 2006 Walter D. Bach, Jr. and Dennis M. Garvey AMSRD-ARL-RO-EV & -CI-EE JSTO Project: AO06MSB00x Outline
QUANTITATIVE VERIFICATION STATISTICS OF WRF PREDICTIONS OVER THE MEDITERRANEAN REGION
 QUANTITATIVE VERIFICATION STATISTICS OF WRF PREDICTIONS OVER THE MEDITERRANEAN REGION Katsafados P. 1, Papadopoulos A. 2, Mavromatidis E. 1 and Gikas N. 1 1 Department of Geography, Harokopio University
The authors are grateful to the reviewer s valuable comments that improved the manuscript.
 The authors are grateful to the reviewer s valuable comments that improved the manuscript. Anonymous Referee #1 A very complete set of observations at the surface and upper air are used to evaluate three
MEA 716 Exercise, BMJ CP Scheme With acknowledgements to B. Rozumalski, M. Baldwin, and J. Kain Optional Review Assignment, distributed Th 2/18/2016
 MEA 716 Exercise, BMJ CP Scheme With acknowledgements to B. Rozumalski, M. Baldwin, and J. Kain Optional Review Assignment, distributed Th 2/18/2016 We have reviewed the reasons why NWP models need to
For the operational forecaster one important precondition for the diagnosis and prediction of
 Initiation of Deep Moist Convection at WV-Boundaries Vienna, Austria For the operational forecaster one important precondition for the diagnosis and prediction of convective activity is the availability
1. Introduction. In following sections, a more detailed description of the methodology is provided, along with an overview of initial results.
 7B.2 MODEL SIMULATED CHANGES IN TC INTENSITY DUE TO GLOBAL WARMING Kevin A. Hill*, Gary M. Lackmann, and A. Aiyyer North Carolina State University, Raleigh, North Carolina 1. Introduction The impact of
Large-Eddy Simulations of Tropical Convective Systems, the Boundary Layer, and Upper Ocean Coupling
 DISTRIBUTION STATEMENT A. Approved for public release; distribution is unlimited. Large-Eddy Simulations of Tropical Convective Systems, the Boundary Layer, and Upper Ocean Coupling Eric D. Skyllingstad
Research Article Numerical Simulations and Analysis of June 16, 2010 Heavy Rainfall Event over Singapore Using the WRFV3 Model
 International Atmospheric Sciences Volume 2013, Article ID 825395, 8 pages http://dx.doi.org/.1155/2013/825395 Research Article Numerical Simulations and Analysis of June 16, 20 Heavy Rainfall Event over
Unified Cloud and Mixing Parameterizations of the Marine Boundary Layer: EDMF and PDF-based cloud approaches
 DISTRIBUTION STATEMENT A. Approved for public release; distribution is unlimited. Unified Cloud and Mixing Parameterizations of the Marine Boundary Layer: EDMF and PDF-based cloud approaches Joao Teixeira
The impact of rain on ocean wave evolution and its feedback to the atmosphere
 HAROKOPIO UNIVERSITY OF ATHENS DEPARTMENT OF GEOGRAPHY ATMOSPHERE AND CLIMATE DYNAMICS GROUP (ACDG) http://meteoclima.gr Coastal Hydrology and Surface Processes linked to Air/Sea Modeling: 1 st community
Atmospheric Sciences 321. Science of Climate. Lecture 13: Surface Energy Balance Chapter 4
 Atmospheric Sciences 321 Science of Climate Lecture 13: Surface Energy Balance Chapter 4 Community Business Check the assignments HW #4 due Wednesday Quiz #2 Wednesday Mid Term is Wednesday May 6 Practice
Department of Meteorology, University of Utah, Salt Lake City, UT. Second revision. Submitted to Monthly Weather Review.
 Sensitivity of Numerical Simulation of Early Rapid Intensification of Hurricane Emily (2005) to Cloud Microphysical and Planetary Boundary Layer Parameterizations XUANLI LI and ZHAOXIA PU * Department
Climatology of Surface Wind Speeds Using a Regional Climate Model
 Climatology of Surface Wind Speeds Using a Regional Climate Model THERESA K. ANDERSEN Iowa State University Mentors: Eugene S. Takle 1 and Jimmy Correia, Jr. 1 1 Iowa State University ABSTRACT Long-term
Arctic Boundary Layer
 Annual Seminar 2015 Physical processes in present and future large-scale models Arctic Boundary Layer Gunilla Svensson Department of Meteorology and Bolin Centre for Climate Research Stockholm University,
Air Quality Screening Modeling
 Air Quality Screening Modeling 2007 Meteorology Simulation with WRF OTC Modeling Committee Meeting September 16, 2010 Baltimore, MD Presentation is based upon the following technical reports available