Analysis and interpretation of New Zealand long-term pavement performance data December 2017
|
|
|
- Evangeline Johnson
- 6 years ago
- Views:
Transcription
1 Analysis and interpretation of New Zealand long-term pavement performance data December 2017 KL Neaylon, R Davies, L Harrow and R Henderson Opus Research, Opus International Consultants NZ Transport Agency research report 633 Contracted research organisation Opus International Consultants
2 ISBN (electronic) ISSN (electronic) NZ Transport Agency Private Bag 6995, Wellington 6141, New Zealand Telephone ; facsimile research@nzta.govt.nz Neaylon, KL, R Davies, L Harrow and R Henderson (2017) Analysis and interpretation of New Zealand longterm pavement performance data. NZ Transport Agency research report pp. Opus International Consultants was contracted by the NZ Transport Agency in 2015 to carry out this research. This publication is copyright NZ Transport Agency. This copyright work is licensed under the Creative Commons Attribution 4.0 International licence. You are free to copy, distribute and adapt this work, as long as you attribute the work to the NZ Transport Agency and abide by the other licence terms. To view a copy of this licence, visit While you are free to copy, distribute and adapt this work, we would appreciate you notifying us that you have done so. Notifications and enquiries about this work should be made to the Manager Research and Evaluation Programme Team, Research and Analytics Unit, NZ Transport Agency, at NZTAresearch@nzta.govt.nz. Keywords: asset management; long-term pavement performance (LTPP); road maintenance
3 An important note for the reader The NZ Transport Agency is a Crown entity established under the Land Transport Management Act The objective of the Agency is to undertake its functions in a way that contributes to an efficient, effective and safe land transport system in the public interest. Each year, the NZ Transport Agency funds innovative and relevant research that contributes to this objective. The views expressed in research reports are the outcomes of the independent research, and should not be regarded as being the opinion or responsibility of the NZ Transport Agency. The material contained in the reports should not be construed in any way as policy adopted by the NZ Transport Agency or indeed any agency of the NZ Government. The reports may, however, be used by NZ Government agencies as a reference in the development of policy. While research reports are believed to be correct at the time of their preparation, the NZ Transport Agency and agents involved in their preparation and publication do not accept any liability for use of the research. People using the research, whether directly or indirectly, should apply and rely on their own skill and judgement. They should not rely on the contents of the research reports in isolation from other sources of advice and information. If necessary, they should seek appropriate legal or other expert advice.
4 Acknowledgements The authors wish to thank Dr David Hitchinson, Dawn Inglis and Doug Brown for their guidance as the steering group, and Sean Rainsford and Dr Greg Arnold for their peer review.
5 Contents Executive summary... 7 Abstract Introduction Literature review LTPP programme establishment New Zealand Australia United States of America Analysis approaches to LTPP data Models New Zealand Australia United States of America New Zealand LTPP site locations Statistical analysis of the current New Zealand LTPP database Descriptive statistics Detailed review of selected case studies Site AKL1, both directions (Tamaki Drive RP 630 to 930) AKL3-S, both directions (Neilson St RP 815 to 1115) CAL-23, decreasing direction (SH2 RP 474/ ) CS-62, increasing direction MCC1-S, both directions NPY-5, increasing direction HUT1, increasing direction TAS1, increasing direction WEL1, increasing direction WEL5-S, decreasing direction CAL-48, decreasing direction (SH1S RP 618/ ) CS-42, increasing direction (SH73 RP 90/ ) CS-44, increasing direction (SH8 RP 99/ ) CS-49, increasing direction (SH1S RP 729/ ) DUN1, decreasing direction DUN4, decreasing direction QLD3-S, increasing direction QLD4, increasing direction GRE3, increasing direction GRE5-S, both directions LTPP database detailed statistical analysis Histograms and identification of relevant road works and outliers Selecting the data Linear ageing Review of maintenance strategies
6 5.1 Normal and sterilised sites NZ Transport Agency LTPP database completeness Completeness of the RAMM database Timing, type and quality of maintenance repairs Timing of maintenance repairs Type of maintenance repairs Quality of maintenance repairs Walking profilometer Crack definition and identification Crack progression and treatment type and timing Performance of different pavement and surfacing types Discussion Conclusions Recommendations Intermediate term Smart computing Short term Maintenance data Speed zone data Linear positions AADT data Soil moisture sensitivity Enforce the maintenance differences between normal and sterilised sites Missing data Photographs Separate treatment lengths Technical review of RAMM records for each LTPP site Timing of maintenance repairs Water cutting Appropriate maintenance treatments Known poor maintenance repairs Walking profilometer Crack assessment Surfacing and pavement codes Accuracy audit References Appendix A: LTPP site maintenance Appendix B: Preliminary report on LTPP data analysis Appendix C: Glossary
7 Executive summary The purpose of this research project was not to recalibrate existing models with updated local data, but rather to examine the existing dataset to determine the following: Which maintenance strategies have evidence of achieving optimum lives? Do any maintenance strategies have a negative effect? Does surfacing condition affect pavement life, and if so, how? What is the effectiveness of different maintenance interventions, and their timing? Is there scope to improve the long-term pavement performance (LTPP) experimental design? The key objectives of this research were to: Examine the LTPP database and use descriptive statistics to identify trends. Identify the key issues that cause pavements to fail, using correlations between pavement condition indices and pavement failure. In particular, does the LTPP data show that pavements displaying cracking are at a higher risk of failure? Recommend whether the dataset could be restructured to provide additional benefits. Following a detailed analysis, it was found that the data available to undertake a statistical analysis to identify factors that need to be present for accelerated condition trending was not sufficiently robust. It was therefore not possible to find useful or significant statistical correlations with this dataset as it stands. This in itself was a major outcome of the research. Statistically, the numerical data was insufficiently accurate or complete to undertake a sufficiently robust analysis to identify or suggest what factors need to be present for accelerated condition trending to take place. This then required significant and time-consuming collation of data from different sources and formats, followed by data cleansing. The data used to derive the dtims models would have needed similar collation and cleansing for the resulting models to be reasonable. However, there is much scope available to improve the quality of the data in the LTPP and the road assessment and maintenance management (RAMM) databases, so these valuable resources can be more easily utilised. Rather than pursuing further automated processing of data, a manual investigation was needed to investigate sites highlighted by the statistical analysis and to interpret site photographs, site notes and construction records. Thus the research moved from a purely statistical focus towards an engineering analysis of selected case studies. A table was then manually composed by a person with extensive experience in road maintenance, citing the engineering reasons for the anomalies highlighted by the statistical software. This proved to be time consuming and would be an expensive process to repeat regularly. This review was unable to identify any reliable data to show that pavements displaying cracking are at a higher risk of failure. The review does suggest, however, that the current selection of maintenance treatment type and the quality of maintenance and reconstruction practices may assist in making the level of service worse after 7
8 Analysis and interpretation of New Zealand long-term pavement performance data maintenance, compared with sterilised sites where maintenance is restricted to emergency repair work only. The maintenance practice of water cutting needs to be carefully reviewed. The detailed site notes revealed evidence that this maintenance activity can at times contribute to a more rapid condition deterioration of some pavements. In addition to the numerical data, there is a significant wealth of information contained in the visual observations, records and photographs collected by the survey contractor and stored within the LTPP database. This contributes to a greater understanding of the distress and maintenance activities at each site; however, it is very time consuming to extract information from a variety of formats under the current data structure. In the intermediate term, the LTPP data arrangement should be analysed and reorganised by smart computing specialists to enable data imputation through: data cleansing image analysis (eg crack mapping, site photographs) machine learning incorporation of big data from other sources. The aim is also to remove the reliance on resource-consuming human analysis. Recommendations are provided on how the dataset could be restructured in the short term to provide additional benefit. Abstract A comprehensive statistical analysis and review of the dataset was undertaken on the March 2015 LTPP database, including application of transformations on the skewed raw data. Following a detailed analysis, it was found that the numerical data available to undertake a statistical analysis to identify factors that need to be present for accelerated condition trending was not sufficiently robust. It is not possible to find useful or significant correlations with this data set as it stands A manual investigation by a person with extensive experience in road engineering and maintenance was undertaken. This investigated engineering explanations for the sites highlighted by the statistical analysis, which involved interpreting site photographs, notes and construction records. This review was unable to identify any reliable data to show pavements displaying cracking are at a higher risk of failure. It does suggest, however, that the current selection of maintenance treatment type and the quality of maintenance and reconstruction practices may assist in making the level of service worse after maintenance, compared with sterilised sites where maintenance is restricted to emergency repair work only. The maintenance practice of water cutting also needs to be carefully considered, as this may contribute to a more rapid condition deterioration. Recommendations are provided on how the dataset could be restructured to provide additional benefit. 8
9 1 Introduction 1 Introduction With an annual expenditure of over $3.0 billion, land transport represents a large part of the Government s balance sheet. The Government Policy Statement on Land Transport 2015/ /25 therefore maintains a focus on prioritising value for money, particularly with road maintenance. This focus on improving the returns from maintenance expenditure includes the ongoing implementation of the findings of the Road Maintenance Taskforce (for example, the One Network Road Classification system, which delivers optimal levels of service across New Zealand s diverse environment and road controlling authorities) and identification of further opportunities to improve productivity. One opportunity to improve value for money is in the procurement of road maintenance and renewals. The NZ Transport Agency (the Transport Agency) needs to be confident road maintenance works are not implemented prematurely, while there is still remaining service life from the existing treatment. Intervention too early wastes money, and maintenance delayed too long becomes more expensive. In accordance with world best practice, the Transport Agency uses specialist models such as highway development and management (HDM) software or the commercial software system Deighton Total Infrastructure Management System (dtims) to predict when maintenance is most economical. Long-term pavement performance (LTPP) sites were established in 2000 on state highways (SHs) and in 2003 on territorial local authority (TLA) networks to provide local data for calibrating these models. However, data from the LTPP sites can also be used to return to first principles and thus provide guidance on the basic and actual relationships between various measures of pavement condition and economic performance. The purpose of this research was not to recalibrate existing models with updated local data, but rather to examine the existing dataset to determine: What maintenance strategies have evidence of achieving optimum lives? Do any maintenance strategies have a negative effect? Does surfacing condition affect pavement life, and if so, how? What is the effectiveness of different maintenance interventions, and their timing? Is there scope to improve the LTPP experimental design? The key objectives of this research were: Examine the LTPP database and use descriptive statistics to identify trends. Identify the key issues that cause pavements to fail, using correlations between pavement condition indices and pavement failure. In particular, does the LTPP data show that pavements displaying cracking are at a higher risk of failure? Recommend whether the dataset could be restructured to provide additional benefits. 9-
10 Analysis and interpretation of New Zealand long-term pavement performance data 2 Literature review 2.1 LTPP programme establishment A number of LTPP studies have been established around the world, with a selection of the more relevant ones discussed below New Zealand New Zealand first embarked on a national pavement management system in 1998, utilising dtims together with the World Bank HDM pavement condition deterioration models (initially HDM-III and later HDM-4). These deterioration models needed to be calibrated to local New Zealand conditions. To do this required the establishment of the New Zealand LTPPs (Henning 2008). The LTPP programme was established in two parts (Henning et al 2004; Henning et al 2006). Transit NZ established 63 sections (48 as required by a well-considered selection matrix plus 15 backup sites) on the SH network in both the North Island and South Island during Approximately 21 road controlling authorities established 82 sections in both urban and rural areas. The 145 sites that initially formed the LTPP programme (63 sites on SHs and 82 on TLA roads) are scattered throughout New Zealand, and are monitored in detail both in terms of more detailed knowledge of inventory than is usually collected in routine network inventory surveys, and more detailed annual condition surveys. Over time, the number of sites has dropped due to maintenance or financial reasons, leaving a total of 130 sites that are currently active (NZ Transport Agency 2009). The sites are classified into two groups: 1 Sterilised: no maintenance is allowed other than pothole patching 2 Normal: more extensive maintenance such as resealing and pavement strengthening is allowed The factors considered important for inclusion in the original selection matrix are discussed below Climate Cenek (2001) used a combined climate and soil stability factor to derive a ratio between the subgrade wet strength and the moisture index, to identify different geologically sensitive areas. These are shown in figure
11 2 Literature review Figure 2.1 Climatic regions of New Zealand according to subgrade strength/moisture ratio (Cenek 2001) These outputs were then examined more closely to establish regions of similar climatic and soil conditions, and thus the SH network was divided into four calibration areas as shown in table 2.1. Table 2.1 Regional distribution based on climate and geology (Henning 2008)0F1 Moisture sensitivity High Moderate Low Limited Calibration section within SH region Northland, West Waikato, Gisborne, West Coast Coastal Otago, Auckland, Whanganui, Taranaki, Wellington Nelson, Marlborough, Napier, East Waikato Canterbury 1 The Central Waikato region did not appear on this list. 11
12 Analysis and interpretation of New Zealand long-term pavement performance data Traffic Traffic categorisations for different regions based on equivalent standard axles (ESAs) were established as shown in table 2.2. Table 2.2 Traffic classification (Henning 2008) Volume classification ESAs/day High- volume areas (eg Auckland and Wellington) ESAs/day Low- volume areas (eg Canterbury) Low <400 <100 Moderate 400 1, High >1,000 > Pavement strength The pavement classification used is based on the structural number (SN) of the pavement modified for the effects of material depth the adjusted structural number (SNP) (Rolt and Parkman 2000; Morosiuk et al 2001), as derived from falling weight deflectometer (FWD) measurements, as shown in table 2.3. Table 2.3 Pavement strength classification (Henning 2008) Pavement Weak Strong Description Unbound pavement with chipseals, total pavement depth < 300 mm; or estimated SNP < 3 Unbound pavement with chipseals, total pavement depth > 300 mm; or asphaltic concrete; or estimated SNP Pavement condition The factors used to express pavement condition/age are shown in table 2.4. Table 2.4 Pavement condition (Henning 2008) Parameter Old New Cracking >10% <10% Rut progression >6 mm <6 mm Surfacing age >5 years <5 years Pavement age >15 years <15 years The walking profilometer was nominated as the collection method for pavement shape data. Roughness is defined by Austroads (2007) as surface irregularities with wavelengths between 0.5 m (5x10 2 mm) and 50 m (5x10 4 mm) which equates with unevenness in figure
13 2 Literature review Figure 2.2 The relationship between surface characteristics and defect wavelength (source: PIARC 1987) Block cracking, pavement repairs and depressions should be expected to contribute to an overall increase in roughness Geometric criteria The geometric criteria adopted for site selection are summarised in table 2.5. Table 2.5 Geometric criteria (Henning et al 2004) Parameter Reason Guideline Horizontal curves Safety and data accuracy Should be able to drive through the curve safely at 80 km/h Gradient Consistency in deterioration Gradient <7% Sag vertical curves Variability in drainage conditions No sag vertical curves allowed Crest vertical curves Safety (for data collectors) Sufficient sight distance for 80 km/h Major drainage structures Total surface thickness Variability in drainage conditions and compaction Very thick chipseal layers believed to corrupt some models No major drainage structure allowed unless very deep and with no impact on surface roughness measurement Total surface thickness <70 mm The New Zealand LTPP programme commenced on the SH network during The first calibration analysis was undertaken in
14 Analysis and interpretation of New Zealand long-term pavement performance data Australia The establishment of the Australian LTPP programme appears to be ad hoc compared with the New Zealand development, and could be described as an amalgamation of many discrete components. A brief history has been extracted from the literature (Martin 1994; Roberts and Martin 1996; Hoque 2003; Austroads 2014; Choummanivong 2015) ALF- LTPP study Prior to 1995, a number of sites had been established to compare the predictions from the Australian Road Research Board s (ARRB) accelerated loading facility (ALF) with that of full-scale in-service pavement sections SHRP LTPP study In 1995 Austroads participated in the US Strategic Highway Research Program (SHRP) and established its own LTPP programme in Australia. Nineteen test sections including asphalt, granular and concrete pavements, and those set up for the ALF-LTPP study, were established in South Australia, Victoria, New South Wales and Queensland LTPPM study In 1999 under funding from the Austroads Business Systems Program, another study was established to examine the influence of maintenance activities on long-term pavement performance (LTPPM). For this study an additional eight sites were established in four states (Victoria, New South Wales, Queensland and Tasmania), which accounted for different climates and levels of traffic AAPA- LTPP study In 1999 the Australian Asphalt Pavement Association (AAPA) sponsored a pilot study of a selection of heavy duty asphalt pavements in four Australian states. These sites were up to 30 years old, and it was found more control was required to define the influence of the stiffness of the asphalt mix on performance State road authority sites A large number of pavement performance sites are being monitored individually by various state road jurisdictions, largely on an ad hoc basis Stabilised pavements database Following the Austroads project Characterisation and specification of stabilised quarry and recycled materials, a national database was established for the long-term performance modelling of stabilised pavements ALF- SHRP- LTPPM combined In 2001/02 these studies were combined to be more cost effective, and their data was compiled into a single database, the LTPP/LTPPM database Development of a national database By 2002/03 the number of LTPP sites reached 27 following the addition of new AAPA sites, and the older Australian Capital Territory (ACT) sites, to the existing ALF-SHRP-LTPPM combination Attrition By 2014, of the 27 current LTPP sites 15 had reached a pavement age of 18 years, although some had been lightly maintained to extend their pavement life to maintain road user safety standards. Over the last 14
15 2 Literature review few years the $2.25 billion western ring road upgrade in Melbourne has progressively moved through eight LTPP sites and transformed these sites beyond recognition (Austroads 2014). By September 2015, due to roadworks and the decommissioning of a number of sites, the only active sites remaining were: 13 LTPP and six LTPPM sites in Tasmania, South Australia, Victoria, New South Wales and Queensland (including an AAPA site); and six ACT LTPP sites. (Choummanivong 2015). Details of these sites can be found in Austroads (2014) Renewal To partially compensate for the loss of eight LTPP sites on the one road project, a steering group was formed in 2012 with a view to establishing replacement sites. Site establishment guidelines were set (Clayton 2000), which can be briefly summarised as: consideration of pavement composition and availability of materials testing information availability of construction and maintenance activity records suitability of alignment, ie no sharp curves and longitudinal steep grade (less than 2%) minimum length of 200 m consistency of subgrade conditions availability of traffic volume information practicality and safety issues availability of historic pavement performance (preferably). It appears that a specific programme design matrix similar to New Zealand practice was not established. A number of potential sites were then offered in South Australia, of which two have since been established (Austroads 2014; Austroads 2015a). Clayton (2000) specified collection of the following data for LTTP projects material tests traffic distress (visual assessment) profile (roughness) deflection environment maintenance rehabilitation. The overall objective of the now combined Australian LTPP project was to enhance asset management strategies through the development of improved pavement performance models based on observed pavement behaviour. The two main aims of this were to (Hoque 2003): compare the results of accelerated pavement testing studies with observed in-service performance investigate the quantitative influence that maintenance has on observed pavement performance. 15
16 Analysis and interpretation of New Zealand long-term pavement performance data Data collected from the Australian LTPP and LTPPM (the maintenance effects study) has been compiled into a single database and posted on the LTPP website ( for unrestricted access United States of America The SHRP was originally proposed in TRB (1984), which quotes: This study outlines a strategy for screening potential highway research areas to identify the most promising for a national program and thereby identifies six priority areas where a concerted research effort can produce major innovations that will increase the productivity and safety of the nation's highway system: asphalt, long-term pavement performance, maintenance, cost-effectiveness protection of concrete bridge components, cement and concrete in highway pavements and structures, and chemical control of snow and ice on highways. The programme s aim was to Increase pavement life by the investigation of the long-term performance of various designs of pavement structures and rehabilitated pavement structures, using different materials and under different loads, environments, subgrades, soils, and maintenance practices. (FHWA 2000) The LTPP programme was initiated as a 20-year SHRP project in 1987 and designed a partnership between the individual US States and Canadian provincial highway agencies, the American Association of State Highway and Transportation Officials (AASHTO), the Transportation Research Board (TRB), the Canadian Strategic Highway Research Program and the Federal Highway Administration (FHWA 2008) The strategic plan for LTPP data analysis is as follows (FHWA 1999): Improve traffic characterisation and prediction. Improve characterisation of materials. Improve consideration of environmental effects in pavement design and performance prediction. Improve evaluation and use of pavement condition data in pavement management. Evaluate existing and/or develop new pavement response and performance models applicable to pavement design and performance prediction. Provide guidance for maintenance and rehabilitation strategy selection and performance prediction. Quantify the performance impact of specific design features (presence or absence of positive drainage, differing levels of pre-rehab surface preparation etc). The pavement test sections are organised as 17 specifically designed experiments, under two broad categories (Turner-Fairbank Highway Research Centre 2015): General pavement studies (GPS). These number 918 test sections and are restricted to materials and designs in current practice, and have a strategic importance Specific pavement studies (SPS). These number 1,591 test sections and have been specifically constructed to study certain engineering factors in pavement design. These two broad categories and 17 specific experiments are summarised in tables 2.6 and
17 2 Literature review Table 2.6 General pavement study (GPS) experiments (Turner- Fairbank 2015) Experiment Experiment title Total sections Active sections GPS-1 Asphalt concrete (AC) pavement on granular base GPS-2 Asphalt concrete (AC) pavement on bound base 65 8 GPS-3 Jointed plain concrete pavement GPS-4 Jointed reinforced concrete pavement GPS-5 Continuously reinforced concrete pavement GPS-6 AC overlay on AC pavement GPS-7 AC overlay on Portland cement concrete (PCC) pavement GPS-9 Unbonded PCC overlay on PCC pavement Total Table 2.7 Specific pavement study (SPS) experiments (Turner- Fairbank 2015) Experiment Experiment title Total sections Active sections SPS-1 Strategic study of structural factors for flexible pavements SPS-2 Strategic study of structural factors for rigid pavements SPS-3 Preventative maintenance effectiveness of flexible pavements SPS-4 Preventative maintenance effectiveness of rigid pavements SPS-5 Rehabilitation of AC pavements SPS-6 Rehabilitation of jointed Portland cement concrete pavements SPS-7 Bonded PCC overlays on concrete pavements 39 0 SPS-8 Study of the environmental effects in the absence of heavy loads SPS-9P/ SPS-9A Validation and refinement of SuperPave asphalt specifications and mix design process/superpave asphalt binder study Total 1, As in 2014, the LTPP programme monitors 2,509 in-service pavement test sections. Performance records, in some cases as old as 25 years have been collected and processed, and are publicly available from Analysis approaches to LTPP data A review of how the LTPP data is used, is useful when investigating the requirements of an LTPP database Models Mathematical models are commonly used for problem solving. There are two different general approaches to building mathematical models: Mechanistic modelling. The model is based on established physical theories relevant to the problem, such as stress analysis, elasticity, or modulus. This model can be called a physics-based model, as these theories are the underlying mechanisms for the starting point for the model building. 17
18 Analysis and interpretation of New Zealand long-term pavement performance data Empirical modelling. The observed data available forms the basis for the model building, and it does not require a theoretical understanding of the underlying mechanisms involved. This kind of model can also be called a data-dependent model (Murthy et al 2004). For modelling road deterioration and maintenance effects there may be a third approach, Mechanistic-empirical, or structured empirical, identifying functional form and primary variables from external sources, and then using various statistical techniques to quantify their impact. The resulting models combine both the theoretical an experimental basis of mechanistic models with the behaviour observed in empirical studies (ND Lea International 1995). In empirical modelling, if the analysis indicates a high degree of variability then models that can capture this variability are required. These are probabilistic or stochastic models (Murthy et al 2004). Stochastic or probabilistic models provide one or more reasonable solutions based on their probabilities. Deterministic models produce a single mathematically exact solution (Austroads 2015b). The Markov chain theory is one probabilistic approach used to predict pavement deterioration. A distinguishing point of Markov theory is that the future state of a process or condition depends on its current state, but not its past states. Markov chain modelling involves developing a starting point or an initial vector, and then one or more transition probability matrices. By applying the Markov model over a series of years, a Markov chain is developed (Hassan et al 2015) New Zealand The first significant outcome from the New Zealand LTPP sites was published in 2006 (Henning et al 2006). The HDM-adopted deterioration models for cracking, roughness, rutting and texture were calibrated using LTPP data processing by a traditional calibration coefficient of the HDM-4 model, and adjustment of all HDM-model coefficients based on maximum likelihood estimation, linear model regression and logistic model development. The crack initiation was considered to be a significant point in the behaviour of a pavement, and was often the starting point of accelerated acceleration. It was also claimed that the crack initiation model contributed to the roughness and rutting models. Three different definitions (groupings) for the climatic and geographical clusterings of regions were found, as shown in tables 2.8, 2.9 and The groupings from table 2.10 were used in this report. Table 2.2 Regional distribution of SH calibration sections (Henning et al 2004) Sensitivity area (based on climate and geology) High Moderate Low Limited Calibration sections within transit region Northland, West Waikato, Gisborne, West Coast Southland Coastal Otago, Auckland, Whanganui, Taranaki, Wellington Canterbury, Nelson, Marlborough, Napier, East Waikato 18
19 2 Literature review Table 2.3 Preliminary regional distribution of SH calibration sections (Henning 2008) Sensitivity area High Moderate Low Limited Calibration sections within SH regions Northland, West Waikato, Gisborne, West Coast Coastal Otago, Auckland, Whanganui, Taranaki, Wellington Nelson, Marlborough, Napier, East Waikato Canterbury Table 2.4 Proposed regionalisation of New Zealand for pavement deterioration modelling (Cenek et al 2003) Region No. Transit New Zealand road network region 1 Northland, Auckland, Bay of Plenty, Waikato, Gisborne, Hawke s Bay, Taranaki, Whanganui and Southland 2 Manawatu, Wellington and Nelson/Marlborough 3 Canterbury and Otago 4 West Coast Australia The ARRB commenced pavement behaviour prediction research in It was decided to develop an Australian model rather than calibrate the existing HDM-III because of a perceived difference in Australian maintenance practices compared to other countries, and the cost of acquiring the specific input information. The ARRB models were deterministic, in line with HDM-III practices, and road roughness was used as a proxy for the surface condition data required by HDM-III (Martin 1994). A decade later performance data from eight LTPPM sites and five LTPP sites, all on sealed granular pavements, was used to calibrate the default HDM-IV road deterioration model. Deterioration relationships were developed with various maintenance treatments, pavement strength, age and condition, environment and loading to enable calibration of the models for rutting, roughness and pavement strength (Martin 2004). Austroads began investigations into probabilistic road deterioration modelling in Since then a range of modelling approaches including survivor curves, Markov chain, Monte Carlo simulations and stochastic information packets (SIPs) have been explored (Austroads 2016a). The introduction of SIP provides a new data condensation technique by applying cumulative histograms (cumulative probability distributions) to the full data set. These are condensed into a SIP package stored in an HTML text string which occupies a single cell in Excel. This then allows the use of a full data set (ie a full population) rather than a mean or median value (Austroads 2015c). Austroads also has plans to improve SIP operation by bypassing Excel and performing the entire process in dtims (Austroads 2016b) United States of America The 1994 analysis of the LTPP database for SHRP purposes began with simple statistical calculations of mean, standard deviation, low value, median value high value, and range, as shown in table Correlation analyses for the significant variables were undertaken using SAS (Statistical Analysis System) which gave Pearson s correlation coefficient, R (not to be confused with the coefficient of determination R 2 ), and probability value p. 19
20 Analysis and interpretation of New Zealand long-term pavement performance data Scatter plots were drawn for selected distresses of interest, with distribution plots, box plots, probability density plots and normal quantile-quantile plots for the more significant independent variables (Killingsworth et al 1994). For HDM 4 purposes, the analysis of the LTPP dataset was accomplished using the Weibull survivor function from SAS software. According to annex 4.2 of ND Lea International (1995), a detailed description of probabilistic failure time modelling and the process followed in this analysis in HDM-III is found in appendix B of Paterson s (1987) report. Consistent with Paterson s approach, this study assumed that the failure time model followed a Weibull (Weibull 1951) distribution. More recently, in the analysis of flexible pavement sections the effectiveness of preventative maintenance treatments was statistically analysed using the Friedman test, described as a nonparametric test (distribution free) for comparison of paired observations (FHWA 2011). Paired observations were used to compare the performance of the control sections (without treatment) to the sections given preventative maintenance treatments. The Friedman test was applied to all design factors moisture, temperature, subgrade type, traffic loading, and existing condition for each distress type. The values then used were the weighted average for the distresses, normalised for the analysis period. The Friedman test determined whether statistically significant differences existed between the pairs. Table 2.11 Example of statistical values for significant variables (Killingsworth et al 1994) Variable Unit No. of Mean Standard Low Median High Range values value deviation value value value Rut depth Inches Initial roughness index (IRI) Measured roughness (IRI) Inches/ mile Inches/ mile Measured friction number % Surface thickness Inches Granular base thickness Granular subbase thickness Treated subbase thickness Inches Inches Inches Age of pavement Years Cumulative equivalent standard axle loads x 1,000 Hot-mix asphaltic concrete (HMAC) binder HMAC binder content No ,176 4, ,326 40,325 Poise 226 1, ,692 8,422 8,134 % (w/w)
21 2 Literature review Variable Unit No. of Mean Standard Low Median High Range values value deviation value value value HMAC air voids % (w/w) HMAC aggregate passing #4 Sieve Comp. of base (mod. AASHTO) Comp. of subbase (mod. AASHTO) In situ moisture in subgrade Subgrade soil passing #200 sieve % (w/w) % % % % (w/w) The Arizona Department of Transportation Research Centre undertook a distress analysis of the flexible pavement LTPP site SPS-9A within their jurisdiction (Puccinelli et al 2015). They divided distress types into two general categories as shown in table Table 2.5 Arizona Department of Transportation flexible pavement distress types (Puccinelli et al 2015) Distress type Failure mechanism Traffic/load related Climate/materials related Fatigue cracking Longitudinal wheel path cracking X X Longitudinal non-wheel path cracking Transverse cracking Block cracking Ravelling Bleeding X X X X X Rutting X X To reduce variability and to consolidate the information for analysis, the researchers presented the quantities as one composite value, being either the structural damage index S for traffic/load related mechanisms, or the environment index E for distress resulting from climatic conditions. The structural damage index is presented as a percentage of wheel path damage, and includes both fatigue cracking and longitudinal cracking. To normalise fatigue and longitudinal cracking, the structural damage index takes the form of equation 2.1. where SS = Structural damage index FF = Area of fatigue (ft 2 ) CC llllll = Length of longitudinal wheel path cracking SS = FF + 1ffff CC llllll 2WW wwww LL ss Equation
22 Analysis and interpretation of New Zealand long-term pavement performance data WW wwww = Structural damage index LL ss = Structural damage index The environmental damage index is a composite built generally from climatic effects. To normalise the environmental distress for the total area, the environmental damage index takes the form of equation 2.2. where E = Environmental damage index B = Area of block cracking (ft 2 ) EE = CC nnnnnn = Length of non-wheel path cracking (ft) CC tt = Length of transverse cracking (ft) AA tttttt = Total area of test section (ft 2 ) BB + CC nnnnnn AA ttoott LL ss + CC tt LL ss Equation 2.2 LL ss Length of test section (ft) In addition to these structural and environmental factors, it was noted that rutting, patching, potholes, bleeding, ravelling etc also affected performance. As replicate data was not collected for this project it was argued that standard statistical tests to determine significance (such as the t test) could not be conducted. Instead, graphical comparisons were made between test sections from data collected at the same points in time. 22
23 3 New Zealand LTPP site locations 3 New Zealand LTPP site locations All the New Zealand LTPP sites are listed in table 3.1 (for SHs) and table 3.2 (for TLAs). Note that the sites are classified into sterilised (CS or -S) or normal (CAL) sites. Each site is 300 m long. For the sterilised sites, only pothole patching is allowed in order to maintain a safe surface and for normal sites more extensive maintenance such as resurfacing and pavement strengthening according to local practice can be performed. Data from the sterilised sites is to allow for the investigation of pavement deterioration beyond points of normal intervention (NZ Transport Agency 2009). Table 3.1 SH LTPP sites (NZ Transport Agency 2009) Section number SH RS Start (km) End (km) Texture measurement Sterilised CS-1 1N N Y CS-2 1N N Y CS-3 1N N Y CAL N N CAL N N CAL-6 1N N N CS-7a 1N-inc N Y CS-7b 1N-inc N Y CS-8a 1N-inc N Y CS-8b 1N-inc N Y CS-11 1N Y Y CAL Y N CS-13a 1N N Y CAL-13b 1N N N CAL Y N CAL Y N CS Y Y CS-16 1N-inc N Y CAL N N CAL N N CAL N N CS Y Y CS Y Y CS Y Y CAL Y N CS Y YY CAL-25a Y N CAL-25b Y N CS Y Y CAL-27a Y N 23
24 Analysis and interpretation of New Zealand long-term pavement performance data Section number SH RS Start (km) End (km) Texture measurement Sterilised CAL-27b Y N CS-28 1N Y Y CS Y Y CAL Y N CS Y Y CAL Y N CS-31 1N Y Y CAL Y N CAL-35 1N Y N CS Y Y CAL-37a N N CS-37b N Y CAL-38 1S N N CS N Y CS N Y CAL-41 1S N N CS N Y CAL-43 1S N N CS N Y CAL-45a N N CS-45b N Y CS N Y CAL-48 1S N N CS-49 1S N Y CS-50 1S N Y CAL N N CAL-52a N N CS-52b N Y CS N Y CS N Y CS N Y CAL N N CAL N N 24
25 3 New Zealand LTPP site locations Table 3.2 Local government LTPP sites (NZ Transport Agency 2009) Network management authority Section number Road name Start (m) End (m) Sterilised Auckland CC AKL1 Tamaki Drive N Auckland CC AKL2-S Pah Road Y Auckland CC AKL3-S Neilson Street Y Western Bay of Plenty DC Western Bay of Plenty DC BOP2-S Lindemann Road Y BOP3-S Rangiura Road 10,700 11,000 Y Dunedin DUN1 David Street N Dunedin DUN2-S Marne Street Y Dunedin DUN3-S Queens Drive Y Dunedin DUN4 Highcliff Road 1,500 1,800 N Dunedin DUN5 Riselaw Road N Dunedin DUN6 Richardson Street N Hastings DC HAS1-S Ada Street Y Hastings DC HAS2 Thompson Road 1,370 1,670 N Hutt CC HUT1 Hutt Park Road N Hutt CC HUT2A-S Fenchurch Grove Y Hutt CC HUT2B-S Aldergate Grove Y Hutt CC HUT3-S Holyoake Crescent Y Marlborough DC MAR1 Redwood Street 1,850 2,150 N Marlborough DC MAR2-S Alabama Road 1,800 2,100 Y Marlborough DC MAR3-S Northbank Road Y Marlborough DC MAR4-S Old Renwick Road 5,800 6,100 Y Manukau CC MCC1-S Mahia Road Y Manukau CC MCC2 Te Rakau Drive 1,600 1,900 N Manukau CC MCC3 Prince Regent Drive N Napier CC NPE1-S Tironui Drive Y Napier CC NPE2-S Shackleton Street Y Napier CC NPE3-S Guppy Road 1,200 1,500 Y New Plymouth DC NPY1 Waitara Road 8,025 8,325 N New Plymouth DC NPY2 Waitara Road 7,575 7,875 N New Plymouth DC NPY3 Waitara Road 4,475 4,775 N New Plymouth DC NPY4-S Waitara Road 6,650 6,950 Y New Plymouth DC NPY5 Devon Street East 2,275 2,575 N New Plymouth DC NPY6 Connett Road East N Papakura CC PAP1-S Porchester Road 3,235 3,535 Y Papakura CC PAP2 Airfield Road 700 1,000 N QL DC QLD1 Centennial Avenue N 25
26 Analysis and interpretation of New Zealand long-term pavement performance data Network management authority Section number Road name Start (m) End (m) Sterilised QL DC QLD2-S Glenorchy Queenstown Road Y QL DC QLD3-S Crown Range Road 4,306 4,606 Y QL DC QLD4 Malaghans Road 2,185 2,485 N QL DC QLD6-S Wanaka Mt Aspiring Road 13,009 13,309 Y Southland DC SDC1-S Dusky Street Y Southland DC SDC2-S Queen Street ,254 Y Southland DC SDC3-S Balaklava Street Y Southland DC SDC4 Winton Substation Road 1,140 1,440 N Southland DC SDC5 Bayswater Road 7,040 7,340 N Tasman DC TAS1 Moutere Highway 21,880 22,180 N Tasman DC TAS2-S Eighty Eight Valley Road 3,962 4,262 Y Tasman DC TAS3-S Haycock Road Y Tasman DC TAS4-S Telenius Road Y Thames Coromandel DC Thames Coromandel DC Thames Coromandel DC TCDC1 Hikuai Settlement Road 1,100 1,400 N TCDC2 Morrison Road N TCDC3-S Townsend Road 1,600 1,900 Y Whanganui DC WAN1-S No. 3 line 3,800 4,100 Y Whanganui DC WAN2-S No.3 line 4,370 4,670 Y Whanganui DC WAN3-S Blueskin Road 3,260 3,460 Y Waitakere CC WCC1-S Colwill Road Y Waitakere CC WCC2 Forest Hill Road 1,550 1,850 N Waitakere CC WCC3-S Wharf Road Y Wellington CC WEL1 Adelaide Road 1,650 1,950 N Wellington CC WEL2 Duncan Street N Wellington CC WEL3 Nalanda Crescent N Wellington CC WEL4-S Palm Avenue Y Wellington CC WEL5-S Churton Drive Y Whangarei DC WHG1-S Kensington Avenue Y Whangarei DC WHG2 Kamo Road N Whangarei DC WHG3-S Bream Bay Drive 800 1,100 Y Whangarei DC WHG4-S Ngunguru Road 14,300 14,600 Y Whangarei DC WHG5-S Whangarei Heads Road 1,100 1,400 Y Waitaki WTK1-S Gibsons Road Y Waitaki WTK3 McPhersons Road 900 1,200 N Waitaki WTK4 Ferry Road 1,000 1,300 N 26
27 4 Statistical analysis of the current New Zealand LTPP data base 4 Statistical analysis of the current New Zealand LTPP database The database used in this analysis was obtained from the Transport Agency and contained information up until March Descriptive statistics The LTPP database was first processed as shown in table 4.1. Processed data was then used to prepare the descriptive figures, figures 4.1 to It may be that a small portion of this data is of questionable accuracy. However, the plots below do not attempt to address these possible minor inaccuracies and plot the raw data as it is. Table 4.1 Data sources for figures Figure title Figure Table of the database Fieldname in table Processing of field Financial year monitoring started both current and noncurrent sites included Number of sites removed/retired/ replaced from monitoring Number of current LTPP sites located on SH or local roads Number of current LTPP sites that are sterilised/un-sterilised 4.1 _300mRoughness Financial year None necessary 4.2 Calibration sections Current If (Current = TRUE then site current), if Current = FALSE then site no longer current) 4.3 Calibration sections R If (RS is blank then TLA), if (RS is not blank then SH) 4.4 Calibration sections Sterilised? If (Sterilised? = TRUE then site is sterilised), if (Sterilised? = FALSE then site is not sterilised) Average December- 4.5 CAL_SEC_RAINFALL_D SUMMER_DECPre Average of applicable February rainfall (mm) ATA vyr-fe SUMMER_DECPrevYr-FEB of current LTPP sites rainfall for all applicable years Average June-July 4.66 CAL_SEC_RAINFALL_D WINTER_JUN-JUL Average of applicable rainfall (mm) of current ATA WINTER_JUN-JUL rainfall LTPP sites for applicable all years Average annual rainfall 4.7 CAL_SEC_RAINFALL_D ANNUAL Average of applicable (mm) of current LTPP ATA ANNUAL rainfall for all sites applicable years Soil moisture sensitivity of current LTPP sites Maintenance of current LTPP sites 4.8 Calibration sections Sensitivity None necessary 4.9 n/a - (The year of rehab, year of reseal, year of patching, year of other maintenance, speed environment and comments in tabulated form for all (SH and TLA) LTPP sites) were kindly provided by Doug Brown, pers comm
28 Analysis and interpretation of New Zealand long-term pavement performance data Figure title Figure Table of the database Fieldname in table Processing of field Surface type (chipseal or bituminous mix) of current LTPP sites Speed zones of current LTPP sites 4.10 CAL_SEC_SURF_DATA ChipSize_RAMM If (ChipSize_RAMM <= 6 then assume chipseal), if (ChipSize_RAMM > 6 then assume bituminous mix) 4.11 n/a - (data kindly provided by Doug Brown, pers comm 2016) See discussion under figure 4.11) Average annual daily 4.12 CAL_SEC_TRAFFIC_DA MS_AADT Average of applicable traffic (AADT) of current TA TMS_AADT for all LTPP sites applicable years Surface ages of current LTPP sites 4.13 CAL_SEC_SURF_DATA SurfDate_RAM (DATE(2015,7,1)- SurfDate_RAMM)/ The definitions for some of the quantities plotted in figures 4.1 to 4.13 are in table 4.2: Table 4.2 Definitions of variables Item Value Definition Database used Table Field Description (Optional) recorded for field. Current TRUE LTTP site recorded in NZTA_LTT Calibration Current Is the site still NZTA_LTTP_working.m P_working. sections active? db as being current (ie mdb site is a current member of the LTPP programme and has not been retired, replaced, removed, or otherwise withdrawn) Current FALSE LTTP site recorded in NZTA_LTT Calibration Current Is the site still NZTA_LTTP_working.md P_working. sections active? b as not being current mdb (ie site is no longer a current member of the LTPP programme and has been retired, replaced, removed, or otherwise withdrawn) SH or SH State highway NZTA_LTT Calibration RS (if blank RS = Route TLA P_working. sections then TLA, if station number mdb populated of the section then SH) SH or TLA Territorial local authority NZTA_LTT Calibration RS (if blank RS = Route TLA P_working. sections then TLA, if station number mdb populated of the section then SH) 28
29 4 Statistical analysis of the current New Zealand LTPP data base Item Value Definition Database used Table Field Description (Optional) recorded for field. Sterilised TRUE Repairs permitted only NZTA_LTT Calibration Sterilised? Is the site to address a significant P_working. sections sterilised? hazard, and the repairs mdb must be the minimum amount required to remove the hazard (refer: NZ Transport Agency 2016) Sterilised FALSE Repairs permitted only if NZTA_LTT Calibration Sterilised? Is the site they are considered P_working. sections sterilised? absolutely necessary, mdb but there is no requirement that they must address a significant hazard (refer: NZ Transport Agency 2016) Most of the SH LTPP sites were first established in the 2001/02 financial year, while most of the TLA sites were first established in the 2003/2004 financial year, as shown in figure 4.1. The definitions for current are in table 4.2. Figure 4.1 Financial year monitoring started - both current and non- current sites 29
30 Analysis and interpretation of New Zealand long-term pavement performance data Figure 4.2 Number of sites removed/retired/replaced from monitoring With reference to figure 4.2: 1 The number of current TLA LTPP sites (82) exceeds the number of state highwat LTPP (65) sites slightly. 2 The ratio of LTPP sites that are no-longer-current to current is 6.2%-11.0%. 3 The percentage of TLA sites no longer current is greater than the proportion of SH sites that are no longer-current (6.2% for SHs and 11.0% for TLAs). This is due in part to the fact that four of the no longer-current TLA sites were abandoned when the Christchurch City Council (CCC) withdrew from the LTPP programme (refer table 4.3). Table 4.3 Abandoned LTPP sites CAL_SECTION_ID field entry Comments Financial year abandoned CS-50 Not surveyed in 2003/04, replaced by CS-50a in 2004/ /04 CCC4 This site has never been surveyed. Abandoned site. 2003/04 BOP1 Lost in 2006 (period /07) - Rehabilitation (refer to 2006/07 site notes). QLD5-S Lost in 2007 (period /07) - Rehabilitation (refer to 2006/07 site notes). 2006/ /07 CAL-32 CS-28 CAL-59 Not surveyed in 2006/07, replaced by CAL-61 in 2006/07. Not surveyed in 2006/07, replaced by CS-60 in 2006/07. Derek C Roux (8 May 2007): CAL-59 has been separated into 2 sites: CAL-59a for Increasing with ROAD_ID = 2500 and CAL-59b for Decreasing with ROAD_ID = / / /08 CCC1-S The council terminated participation at 2008/09 30
. The council terminated participation at end of 2008 (period 6-2008/09). The council terminated participation at end of 2008 (period 6-2008/09). 2008/09 2008/09 2008/09 Figure 4.")

31 4 Statistical analysis of the current New Zealand LTPP data base CAL_SECTION_ID field entry Comments Financial year end of 2008 (period /09). abandoned CCC2 CCC3-S CCC5-S The council terminated participation at end of 2008 (period /09). The council terminated participation at end of 2008 (period /09). The council terminated participation at end of 2008 (period /09). 2008/ / /09 Figure 4.3 Number of current LTPP sites located on SHs or local roads Figure 4.3 illustrates that the number of current LTPP sites located on SHs is 65, slightly less than the number of current LTPP sites located on TLA road networks of 82. Figure 4.4 Number of current sites LTPP that are sterilised/un- sterilised Figure 4.4 shows the percentage of un-sterilised/sterilised LTPP sites is similar for SHs at 86% and TLA roads at 91%. (Refer to table 4.2 for definitions of the terms sterilised and un-sterilised.) 31
32 Analysis and interpretation of New Zealand long-term pavement performance data Figure 4.5 Average December-February rainfall (mm) of current LTPP sites Figure 4.5 suggests that for cumulative percentage distributions of summer season rainfall (mm) below around 400 mm, there is a pattern of TLA LTPP sites experiencing less rainfall than SH LTPP sites. Reasons for this are not known, although it should be remembered the majority of SH LTPP sites were established two years prior to the majority of TLA LTPP sites (refer figure 4.1) and rainfall patterns in this initial twoyear period could have been different from the rainfall patterns in subsequent years. Figure 4.6 Average June-July rainfall (mm) of current LTPP sites Figure 4.6 suggests that the cumulative percentage distributions of per annum average winter season rainfall (mm) for SH and TLA LTPP sites are similar. Also, comparing the above figure with figure 4.5 it seems the winter season average rainfall in mm/year is approximately twice that of the summer season. 32
33 4 Statistical analysis of the current New Zealand LTPP data base Figure 4.7 Average annual rainfall (mm) of current LTPP sites Figure 4.7 suggests that the cumulative percentage distributions of per-annum average rainfall (mm) for SH and TLA LTPP sites are similar. Figure 4.8 Soil moisture sensitivity of current LTPP sites Figure 4.8 shows: 1 The number of SH and TLA sites categorised with soil moisture sensitivity as either limited or high is approximately equal. 2 It seems different terms are used for the medium / moderate categories of soil moisture sensitivity of SH and TLA LTPP sites and the low category is only used for SHs. If the second observation is accurate, the use of different terms is not helpful for analysis. Associated with this comment is the observation that the number of sites categorised as moderate is very low and there may be a valid argument for merging the moderate category with another category. 33
.")
34 Analysis and interpretation of New Zealand long-term pavement performance data Figure 4.9 Maintenance of current LTPP sites Figure 4.9 shows: 1 The most common repair applied to LTTP sites is reseal (refer height of lines for the TRUE reseal category). 2 Just under half the LTPP sites have been resealed (compare TRUE and FALSE lines for the reseal category) 3 The proportion of sites in the three non-reseal maintenance categories (ie rehab, patching and other ) having maintenance is modest and varies from (very approximately) 15%-20%. Figure 4.10 Surface type (chipseal or bituminous mix) of current LTPP sites Figure 4.10 shows: 1 A clear majority of sites are chipseals rather than bituminous mixes. 2 The ratio of chipseal: bituminous mix sites is similar for TLAs and SHs. (It is interesting to note for some LTPP sites, the chip size recorded in RAMM differs from that recorded in the LTPP database.) 34
35 4 Statistical analysis of the current New Zealand LTPP data base Figure 4.11 Speed zones of current LTPP sites Figure 4.11 suggests: 1 A very clear majority of TLA sites are in 50 or 100 km/h speed limit zones (comparatively, there is an insignificant number of sites in the 60 to 90 km/h speed limit zones) 2 The number of TLA sites in a 100 km/h speed limit zone is 38 and this slightly exceeds the number of 30 in a 50 km/h speed limit zone. Also, 59 of 59 (ie 100%) of SH sites are in the 100 km/h speed limit zone. (This seems unlikely and suggests there may be source data accuracy issues.) Figure 4.12 AADT of current LTPP sites Figure 4.12 suggests the AADT of SH LTTP sites slightly exceeds that of TLA LTPP sites. Also, the source data used indicates the AADT for an LTTP site varies from 42 to 82,260. However, the calculation procedure used to prepare the above figure involved the questionable practice of averaging AADT data for a site for all years that data was available (refer table 4.1). It is therefore suggested the source database be supplemented so there is AADT data for each site for all years that each LTPP site was/is current so averaging is not necessary. 35

36 Analysis and interpretation of New Zealand long-term pavement performance data Figure 4.13 Surface ages of current LTPP sites Figure 4.13 suggests: 1 For sites with surface ages from years, the surface age of TLA LTPP sites is approximately 80% that of SH LTPP sites. 2 The range of surface ages of LTPP sites varies from 7 26 years. 4.2 Detailed review of selected case studies Figure 4.14 Key to the cumulative distribution plots 36
37 4 Statistical analysis of the current New Zealand LTPP data base Table 4.4 Plot Key to the vertical axis on the cumulative distribution plots Vertical axis units Cracking Summation of 18 LTPP crack fields, each as a fraction 0 1 Flushing Patching Potholes Roughness Rutting Summation of three LTPP flushing fields: low, mid and high, each field as a fraction 0 1 Summation of surface patch area + structural patch, each as a fraction 0 1 Diameter or depth (mm) Lane international roughness index (IRI) Lane rut depth (mm) Three different definitions (groupings) for the climatic and geographical clustering of regions were found, and in the data analysis (attached in appendix B) the clustering shown in table 4.5 has been used. Table 4.5 Climatic and geographical clustering of regions Region no. Transit New Zealand road network region 1 Northland, Auckland, Pay of Plenty, Waikato, Gisborne, Hawke s Bay, Taranaki, Whanganui, and Southland 2 Manawatu, Wellington, and Nelson/Marlborough 3 Canterbury and Otago 4 West Coast From perusal of the cumulative distribution plots there was no clear relationship between progression of cracking and initiation of further pavement distress. Some other interesting anomalies were detected, and these were subjected to a more in-depth engineering review rather than a statistical review. The results of this review are shown in sections to Site AKL1, both directions (Tamaki Drive RP 630 to 930) This site showed severe cracking, but no impact on pavement deterioration. 37
38 Analysis and interpretation of New Zealand long-term pavement performance data 38
39 4 Statistical analysis of the current New Zealand LTPP data base RAMM data: Average daily traffic (ADT) 2015 is 32,681 with 3% heavy commercial vehicles (HCV). Only two surfaces are recorded in RAMM (G3 reseal 1983 and AC 2012) so some surfacing records are obviously missing. No pavement records recorded in RAMM for this site. No FWD recorded in RAMM for this site. No SNPs recorded in RAMM for this site. Environmental information (taken from the site photographs): The site has two lanes in each direction, is flat and has a large radius curve at the south end. The drainage is kerb and channel and appears to be adequate. From the RAMM data and the gallery of annual photographs the following observations are made as to the likely causes for the measured increase in cracking until 2012 and the decrease in roughness and rutting post The road structure appears to be a structural asphalt pavement surfaced with an asphalt wearing course. The wearing course developed extensive large block cracking which was evident by the extensive bandage crack sealing. Although extensive cracking developed, the pavement kept relatively good shape and did not appear to be pumping basecourse fines indicating a structural asphalt pavement. A new asphalt wearing course was constructed between the 2012 and 2013 inspections resetting the cracking at the site back to 0. It also corrected the minor roughness and rutting that existed prior to the resurfacing AKL3-S, both directions (Neilson St RP 815 to 1115) Cracking plus deteriorating roughness and rutting 39
40 Analysis and interpretation of New Zealand long-term pavement performance data RAMM data: ADT 2012 is approximately 25,000 to 27,000 with 11 to 16% HCV. Three surfaces recorded in RAMM prior to the 2008 pavement renewal (G3 first coat 1971, G3/5 reseal 1989 and G3/5 reseal 2001 plus some sections of AC at various times in between). In 2008 a stone mastic asphalt (SMA) was applied as the wearing course for the pavement renewal. The original 1971 pavement is recorded in RAMM as approximately 200 mm of AP65. In 2008, 240 mm of pavement and surfacing were removed and replaced with 50 mm of mix20 asphalt followed by 190 mm of mix40 asphalt. No FWD recorded in RAMM for this site. No SNPs recorded in RAMM for this site. Environmental information (taken from the site photographs): The site is two lanes in each direction with a divided carriageway. The drainage is kerb and channel and appears adequate. From the RAMM data and the gallery of annual photographs the following observations are made as to the likely causes for the measured increase in cracking, roughness and rutting until 2008 and then another increase in rutting. Prior to 2008 the chipseal surface was extensively fatigued and small block cracked with some pumping fines particularly in the wheel paths, which was likely to be the cause for the increase in roughness and rutting at the site. An area wide structural asphalt pavement renewal was completed in 2008 followed by a 35mm SMA wearing course in 2008 resetting all distress back to 0. There are two possible reasons for the increase in rutting since An isolated but large area of the SMA was flushed and required water cutting in The saturated SMA may have deformed in this location. Also a large repair was completed on the middle lane in the decreasing direction in This repair may also have contributed to the increase in rutting which has subsequently levelled off. 40
41 4 Statistical analysis of the current New Zealand LTPP data base CAL-23, decreasing direction (SH2 RP 474/ ) Rutting deterioration only RAMM data: ADT is 1,235 with 21% HCV. At least five chipseals (four recorded in RAMM: G2 second coat 1986, G5 1992, G and G2/4 2006). Original pavement unknown but estimated at an approximate depth of 220 mm with the top 150 mm reconstructed in FWD reading shows a central deflection of 767 µm with a long bowl. Has a SNP of 3.6. Environmental information (taken from the site photographs): The site has a narrow lane with a high percentage of HCVs, particularly logging traffic heading to Gisborne port, which travel in very defined wheel paths. The side slopes are quite narrow with average drainage opportunities. There are localised areas of cracking and shearing in the chipseal and basecourse that have not been repaired within an appropriate timeframe for an unsterilised site. Gisborne pavements are known for their moisture sensitive subgrades. From the RAMM data and the gallery of annual photographs the following observations are made as to the likely causes for the measured increase in wheel path rutting. The pavement has a relatively low deflection suggesting it is reasonably sound. The binder rise in the wheel paths would suggest some densification within the five chipseal layers due to the heavy trucks 41
42 Analysis and interpretation of New Zealand long-term pavement performance data travelling in very defined wheel paths but this is likely to be minimal. The most significant cause of rutting is likely to be moisture in the subgrade allowing the basecourse to settle in the loaded wheel paths CS-62, increasing direction (SH15A RP 0/ ) now (SH15 RP 111/ ). Roughness and rutting deterioration in increasing direction only RAMM data: ADT (2015 estimate) is 3,705 with 21% HCV. Three chipseals recorded (G3/5 first coat 2001?, G3/5 first coat 2005 and G3/6 2nd coat 2010). Original pavement unknown but estimated (1980?) AP40 at an approximate depth of 200 mm 6.0 m wide with the top 200 mm, 9.0 m wide, reconstructed in FWD reading shows a central deflection of 429 µm at an offset of 2.5 m with a long shallow bowl. Has a SNP of Environmental information (taken from the site photographs): The site is relatively flat and straight. The drainage systems appear adequate; however, there are photographs showing water sitting in the surface water channels and adjacent paddocks. From the RAMM data and the gallery of annual photographs the following observations are made as to the likely causes for the measured increase in roughness and rutting. 42
43 4 Statistical analysis of the current New Zealand LTPP data base RAMM pavement records show an approximately 200 mm deep 6.0 m wide pavement constructed in the 1980s, then overlaid with a 9.0 m wide 200mm deep pavement on 20 July The pavement deflection is low at 429 µm and will be measuring the total depth of pavement at an offset of 2.5 m. The bowl is long and shallow which would indicate a stiffer pavement over a weaker subgrade. However, the failures observed in the annual photographs suggest the FWD data is not representative of the additional seal widening along each side of the road which has failed and rutted along the two outer wheel paths. It could be that the seal widening has a relatively thin pavement but test pits would be required to confirm this. The photographs show a weak zone along the seal widening pavement joint causing cracking, scabbing and rutting to the extent that pavement repairs are required MCC1-S, both directions Severe cracking but no impact on pavement deterioration 43
44 Analysis and interpretation of New Zealand long-term pavement performance data These observations have been compiled using information from the LTPP database and annual photographs and do not include a review of any RAMM data. This is possibly a structural asphalt pavement with an asphalt wearing course. This site had extensive alligator and small block cracking in the asphalt surface but very little pumping of fines. There was extensive bandage crack sealing. A structural asphalt pavement, while badly cracked, does not often show significant other distress. A new asphalt wearing surface was applied between the 2011 and 2012 inspections, thus resetting the cracking, roughness and rutting distress at the site back to 0. 44
45 4 Statistical analysis of the current New Zealand LTPP data base NPY-5, increasing direction Very bad state. Is this because of poor reinstatement of trenching for underground services, rather than pavement failure? These observations have been compiled using information from the LTPP database and annual photographs and do not include a review of any RAMM data. This site appears to include sections of both chipseal and asphalt surfaces. There is some settlement in a trench but there is also other general deterioration in the surfacing and pavement, which is particularly rough around service covers. There is cracking and ravelling in the open-graded porous asphalt (OGPA), particularly the outer wheel path. Significant water cutting has been completed throughout the site. There is cracking and flushing within the chipseal surfaces at the site. Apart from water cutting of flushing very few repairs have been completed at this site as would be expected. 45
46 Analysis and interpretation of New Zealand long-term pavement performance data HUT1, increasing direction Cracking, potholing and roughness progression. These observations have been compiled using information from the LTPP database and annual photographs and do not include a review of any RAMM data. This is probably an asphalt surface over a granular pavement. The pavement and underlying trenches and patches appear too weak for the asphalt surface. The asphalt surface has become extensively cracked due to high pavement deflections and reflective cracking from the underlying repairs. The asphalt has ravelled and cracked with small pieces of surfacing falling out and needing repair. Only minor repairs have been completed (assume for safety reasons), so this is an excellent example of deterioration in a thin AC surface. 46
47 4 Statistical analysis of the current New Zealand LTPP data base TAS1, increasing direction Pothole formation in 2011, why? These observations have been compiled using information from the LTPP database and annual photographs and do not include a review of any RAMM data. This is a granular pavement with a chipseal surface. The section of road is very narrow and winding with minimal drainage opportunities either side. The photographic record shows very few potholes within the site in any of the years recorded except for one associated with a survey mark and a large edge pothole at a driveway that may have been recorded and skews the data. The question arises over what constitutes a pothole and the number required to influence the data. The new chipseal between 2011 and 2012 would remove the ongoing development of potholes for some years and reset potholes to 0. 47
48 Analysis and interpretation of New Zealand long-term pavement performance data WEL1, increasing direction Roughness and potholing increasing, some cracking. These observations have been compiled using information from the LTPP database and annual photographs and do not include a review of any RAMM data. This is a granular pavement with an asphalt surface. There is reflective cracking and depressions from underlying trenches. The pavement appears too weak for the asphalt surface particularly in the wheel paths where extensive alligator cracking pumping fines has developed. Potholes are very small and insignificant. There is settlement adjacent to a new pavement at the site of some kerb and channel replacement, deterioration around surface covers. Large asphalt repairs were completed between the 2012 and 2013 inspections. 48
49 4 Statistical analysis of the current New Zealand LTPP data base WEL5-S, decreasing direction Increasing roughness leading to cracking in one direction only. These observations have been compiled using information from the LTPP database and annual photographs and do not include a review of any RAMM data. This appears to be a polymer modified binder reseal over a variety of surfaces including chip seal and asphalt on a granular pavement. The polymer modified binder seal has scabbed quite badly and in some places is down to the underlying substrate, which would contribute to an increase in roughness. There are areas of old cracked asphalt now exposed due to seal loss. There are significant trenches within the site. Depending on how these are rated may greatly increase the cracking in one direction if the trench edge is rated as a crack. There is also some settlement cracking in the pavement just outside the trenches. 49
50 Analysis and interpretation of New Zealand long-term pavement performance data CAL-48, decreasing direction (SH1S RP 618/ ) Deterioration in rutting only. RAMM data: ADT is 4,162 with 13% HCV. Unknown number of chipseals (four recorded in RAMM: G3 reseal 1982, G5 texturising seal 1991, G3 reseal 1997 (recorded in RAMM as G5 but clearly identifiable as a G3 in photographs) and a G4/6 reseal 2009 supposedly applied to treat cracking). Original pavement unknown (1980?). M4 AP40 estimated at an approximate depth of 140 mm FWD reading shows a range of central deflection of 705 µm with a long bowl. Has a SNP of Environmental information (taken from the site photographs): The site is generally open, is straight with part of the site on an easy grade. The drainage appears adequate. From the RAMM data and the gallery of annual photographs the following observations are made as to the likely causes for the measured increase in flushing and wheel path rutting. There are four chipseals recorded, but possibly up to six or more chipseals as the first record in RAMM is recorded as a reseal. This is likely to contribute to the flushing at the site and may contribute a little toward the rutting at the site due to chip embedment from unstable seal layers. It is clear in the photographs where pavement repairs have removed the seal layers as reflective flushing is not present above these repairs. 50
51 4 Statistical analysis of the current New Zealand LTPP data base It is clear from the photographic record that significant repairs were completed in the outer wheel path prior to the 1997 grade 3 reseal. It also appears that seal widening was completed on both sides of the road at some stage although not recorded in RAMM. Both the outer wheel path repairs and seal widening could contribute to the wheel path rutting and flushing at this site CS-42, increasing direction (SH73 RP 90/ ) Deterioration in everything except patching. RAMM data: ADT is 1,549 with 15% HCV. Unknown number of chipseals (five recorded in RAMM: G6 texturising 1989, G3 single coat reseal 1993, G5 texturising 1997, G3/5 two coat 2001 and G3/5 two coat 2014). Original pavement unknown (~1964?). No pavement type or depth recorded FWD reading range between 1309 µm and 1614 µm. Other years deflections as high as 2469 µm SNP range between 2.27 and Other years readings as low as Environmental information (taken from the site photographs): The site is partially shaded, is straight with an easy grade at one end. The drainage is quite poor with relatively flat shoulders and shallow surface water channels. From the RAMM data and the gallery of annual photographs the following observations are made as to the likely causes for the measured change in flushing, potholes and cracking and the increase in rutting and roughness. 51
52 Analysis and interpretation of New Zealand long-term pavement performance data The data shows the pavement is old and weak and has a relatively weak subgrade. There is likely to be at least six or seven chipseals in the surfacing layer. In 2001 the site was showing some flushing in the wheel paths but by 2006 there was significant flushing and cracking throughout the site. Crack seals, pothole repairs and isolated asphalt rut/shear fills have been used to keep this site safe. This site has suffered genuine pavement deterioration over time without significant pavement maintenance intervention. It appears this site has been allowed to deteriorate without major repair as was intended for a sterilised site. The flushing graph shows a huge increase in flushing followed by water cutting in Two asphalt patch repairs have been completed at the site which should have shown in the patching graph CS-44, increasing direction (SH8 RP 99/ ) Transverse cracking only (Note: This statement Transverse cracking only is a good illustration of the potential errors within the LTPP data and supports the recommendation in section Crack assessment (see chapter 8). The statistical analysis used cracking codes in the data to make this statement when a review of the site photographs clearly shows the predominant crack type on this site is longitudinal cracks and particular to the probable cause of the failure at this site.) RAMM data: ADT is 3,726 with 10% HCV. Unknown number of chipseals although the distress evident in photographs would suggest a relatively thin layer of chipseals (two recorded in RAMM: G5 void fill 1985 (could be second coat), G3 single coat seal 1990). Original pavement unknown (RAMM has 50 mm of AP20 ~1961?). 52
53 4 Statistical analysis of the current New Zealand LTPP data base The latest 2012 FWD reading for the site is <350 µm with some older results a little higher but all <550 µm with longer bowls. The SNPs are general between 3.0 and 6.0. Environmental information (taken from the site photographs): The site is generally open, flat and has an easy curve. The drainage appears to be good. Looking at the RAMM data and the gallery of annual photographs the following observations are made as to the likely causes for the cracking and potholes recorded at the site. There are no genuine pavement records for this site recorded in RAMM; however, looking at the photographs it appears an earlier narrow carriageway has had seal widening constructed possibly both sides of the road. The seal layers appear quite thin, especially on the edges. There is longitudinal cracking just outside the outer wheel paths which may be along the joint of seal widening. There is also longitudinal cracking along the white edge lines which may be due to thin seal layers which is developing into edge breaks. There are a number of very small pothole repairs. However there should be an increase in patches due to the number of crack and edge break repairs. These are an example of poorly chosen and completed maintenance repairs that are failing shortly after completion CS-49, increasing direction (SH1S RP 729/ ) Cracking and rutting getting worse over time. RAMM data: ADT is 6,547 with 12% HCV. One chip seal (G3/5 two coat first coat 2011). 53
54 Analysis and interpretation of New Zealand long-term pavement performance data Original pavement unknown (~ 300 mm in 1966?) Additional lane added right-hand side in mm of AP65 followed by 150 mm of M4 AP40. Additional lane added left-hand side in 2011 with overlay across full width of pavement 200 mm of M4 AP40. The deflections prior to the 2011 overlay were all below 1500 µm and subsequent to the overlay reduced to below 755 µm and were generally shallow long bowls. Has a SNP of Environmental information (taken from the site photographs): The site is generally open, straight and flat. The drainage appears adequate. Looking at the RAMM data and the gallery of annual photographs the following observations are made as to the likely causes for the measured increase in cracking, wheel path rutting and roughness. Following the corrections of the cracking, wheel path rutting and roughness there is an increase in potholes. The deflection data suggests quite a stiff pavement with any weakness in the subgrade. The cracking is in and outside the wheel paths and appears as small block cracking suggesting the top pavement layer was bound or semi-bound. Movement of the small block cracking appears to have contributed to the increase in wheel path rutting and roughness. This was corrected with the pavement overlay in 2011 resetting the cracking, rutting and roughness. The site still has the 2011 first-coat seal which has developed small holes as seen in the increase in potholes DUN1, decreasing direction Cracking, but no other deterioration. 54
55 4 Statistical analysis of the current New Zealand LTPP data base These observations have been compiled using information from the LTPP database and annual photographs and do not include a review of any RAMM data. Appears to be a structural asphalt pavement with an asphalt wearing course. There were significantly wide block and reflective cracks but no pumping fines visible. The asphalt wearing course was milled out and replaced between the 2009 and 2010 inspections. Reflective cracking and gaps between mats have slowly increased since construction with no other distress as it is a structural asphalt pavement DUN4, decreasing direction Big jump in roughness in These observations have been compiled using information from the LTPP database and annual photographs and do not include a review of any RAMM data. This is possibly a granular pavement with asphalt wearing course. It may be a structural asphalt pavement but there are significant areas of cracked thin AC pumping fines. There are significant trenches along either side of the carriageway adjacent to the kerb and channel with a width to between the wheel paths creating three strips of pavement across the carriageway. The decreasing side trench was partially reopened and resurfaced prior to the 2008 inspection. The new trench edge is in or near the inspection line for the outer wheel path. This has created a significant increase in roughness and some increase in rutting due to pavement settlement within the trench. 55
56 Analysis and interpretation of New Zealand long-term pavement performance data QLD3-S, increasing direction Roughness and rutting improving on own accord. These observations have been compiled using information from the LTPP database and annual photographs and do not include a review of any RAMM data. This a granular pavement with a chipseal surface. There is a short area of subsidence/settlement within the site which had asphalt smoothing completed prior to This contributed to a small improvement in the rutting data. An area-wide pavement treatment (AWPT) (probably recycling) was completed between the 2008 and 2009 inspections and a second coat seal applied between the 2009 and 2010 inspections. The AWPT would have provided the greatest decrease in roughness and rutting. Significant trees shading part of the site were removed probably in conjunction with the AWPT. The second coat seal also appears to have contributed to a smaller decrease in roughness and rutting. After the second coat the improvement is very minor but hard to explain. Transverse cracks have become visible since the 2012 inspection suggesting basecourse and seal recycling with the inclusion of cement. 56
57 4 Statistical analysis of the current New Zealand LTPP data base QLD4, increasing direction Cracking and rutting appear related. These observations have been compiled using information from the LTPP database and annual photographs and do not include a review of any RAMM data. This is a granular pavement with a chipseal surface Up to 2009 the chipseal layer appears to be made up of a first and probably second coat seals but looks very lean on binder. This has resulted in scabbing of the second coat and later cracking has developed allowing water into the pavement causing rutting to increase. The AWPT in 2009 reset the cracking, roughness, potholes and rutting back to 0. In 2010 a slurry surfacing was placed on the sealed shoulders outside the white edge line and has now led to an increase in cracking (particularly from edge wear) as would be expected. 57
58 Analysis and interpretation of New Zealand long-term pavement performance data GRE3, increasing direction Roughness improving (without intervention?). These observations have been compiled using information from the LTPP database and annual photographs and do not include a review of any RAMM data. This is a granular pavement with a chipseal surface. A full width AWPT was completed between the 2009 and 2010 inspections resetting roughness and rutting to 0. The second coat seal did not have sufficient binder and is scabbing quite badly. 58
59 4 Statistical analysis of the current New Zealand LTPP data base GRE5-S, both directions Roughness & rutting improving on own accord. These observations have been compiled using information from the LTPP database and annual photographs and do not include a review of any RAMM data. 59
60 Analysis and interpretation of New Zealand long-term pavement performance data This is a granular pavement with a chipseal surface There does not appear to be any immediately obvious reason for the improvement in roughness and rutting from the photographic record at this site. A possible explanation may be that the crown is being measured as the inner wheel path for each direction. However, it appears from the photographs that this line could be on the outer edge of the wheel path. So if there is slight chip embedment/depression in the centre of the wheel paths this may show an improvement in rutting on the measured crown. 4.3 LTPP database detailed statistical analysis An experienced statistician was engaged to undertake a more detailed statistical analysis which involved the following: Calculate average annual changes using regression analysis: Identify any acceleration in the rate of change or any jump changes in the condition Determine expected useful life (calculate years it would take to reach intervention thresholds) Establish factors that have the most influence on the magnitude of the average annual change. Compare differences in average annual changes between SHs and TLA LTPP sites, and sterilised and normal sites. Carry out statistical analysis to identify or suggest factors that need to be present for accelerated condition trending to take place. Reasonably linear regions in the 50 metre data were first identified where fitting linear regression made sense, and a linear regression with respect to time was carried out. Attempts were then made to find cases of acceleration in the rate of change and jump changes in the condition, but it was challenging to present this in a useable way. The expected useful life estimation did not make sense because the slope on the regression varied significantly from site to site, and in the case of roughness it was not much different from zero. A graphical investigation of what influences the slope of the graphs was carried out on the complete data set. This investigation could not be completed for each year as there was insufficient annual data. There was no suitable data for the statistical analysis to identify or suggest what factors needed to be present for accelerated condition trending to take place, and in any case the data available was not considered sufficiently robust to identify accelerated condition trending. The following sections are a summation of the key findings set out in appendix B Histograms and identification of relevant road works and outliers Distribution skewness Plots of the raw roughness and rut depth data were skewed (as shown in appendix B, section B2.1), and thus were subsequently transformed by a log or a square root transformation as shown in table 4.6 to bring them to a normal distribution. 60
61 4 Statistical analysis of the current New Zealand LTPP data base Table 4.6 Skewness of pavement condition measure distributions Measure Transform Distribution observations (see appendix B) Lane (ie wheel path average) roughness of 50 m LTPP segments Lane (ie wheel path average) roughness of 50 m LTPP segments Lane (ie wheel path average) rut depth of 50 m LTPP segments Lane (ie wheel path average) rut depth of 50 m LTPP segments Lane (ie wheel path average) texture of 50 m LTPP segments None Log None Square root None Positively skewed = skewed to the right (ie long tail is on the positive side of the peak, and the mean is on the right of the peak value) (MathsIsFun.com 2016). Normally distributed. Positively skewed. Somewhat positively skewed. One could apply a stronger transformation such as [a] cube root or logarithm. However stronger transformations have the effect of spreading out the smaller values of the rut depth and hence giving them too much emphasis in any analysis. So it is better to stay with the square root transform (see appendix B). Normally (i.e. symmetrically) distributed with two peaks: 1 peak at around mm mean profile depth (MPD), and a secondary peak between the values of 1 and 1.5. (Presumably, this secondary lower peak corresponds to low-texture (e.g. bituminous mix) surfaces, and the other higher peak to chipseal surfaces.) Condition measures: comparison of unsterilised and sterilised LTPP sites Table 4.7 records findings when condition measure histogram distributions are compared between the two groups of sterilised and unsterilised LTPP sites. Table 4.7 Measure Performance measure comparisons: sterilised sites versus unsterilised sites Observation Lane rut depth (transformed with sqrt) Lane roughness (transformed with log) Lane texture (not (transformed) The rut depth of the group of sterilised LTPP sites tends to be a little lower than the group of unsterilised LTPP sites. The roughness of the group of sterilised LTPP sites may be slightly lower than the group of unsterilised LTPP sites. The texture of the group of sterilised sites is markedly lower than unsterilised sites. This is an expected outcome due to reduced renewals on sterilised sites. A check of AC-like surfaces found them to be spread quite evenly between sterilised and unsterilised LTPP sites but with TLA having twice the number of AC sites as SH AC sites. It is recommended for future texture analysis that surface types are broken into chipseal and asphalt surfaces and analysed separately for both sterilised and unsterilised sites. See recommendation in section Surfacing and pavement codes (chapter 8) Condition measures: comparison of SH with TLA LTPP sites Table 4.8 records the findings when condition measure histogram distributions are compared between the two groups of SH and TLA sites. 61
62 Analysis and interpretation of New Zealand long-term pavement performance data Table 4.8 Measure Performance measure comparisons: SH sites versus TLA sites Observation Lane rut depth (transformed with sqrt) Lane roughness (transformed with log) Lane texture The rut depth of the group of SH LTPP sites is greater than the group of TLA LTPP sites. The roughness of the group of SH LTPP sites is less than the group of TLA LTPP sites. [Texture is measured only on SH roads so it does not appear here.] Condition measures: comparison of SH with TLA LTPP sites The box-and-whisker plots in figures 4.15 to 4.17 show much the same information as in the two preceding tables. In these box-and-whisker plots: the upper and lower lines of the box represent the upper and lower quartiles (ie half the data lies within the box) the line through the box shows the median the whiskers show the range of the data. Figure 4.15 Lane rut depth, transformed (mm) 62
63 4 Statistical analysis of the current New Zealand LTPP data base Figure 4.16 Lane roughness, transformed (IRI m/km) Figure 4.17 Lane texture, mean profile depth (mm) Inter- year differences Count of inter-year differences: all. Figures 4.18 to 4.20 summarise the differences between a measurement of one year and the next (ie this year s measurement minus last year s). (Transformed data is used and is only included where there is data for adjacent years.) 63
64 Analysis and interpretation of New Zealand long-term pavement performance data Figure 4.18 Adjacent- year rut depth differences Count of 50m LTPP segments Adjacent-year rut depth differences (mm) Figure 4.19 Adjacent year roughness differences Count of 50m LTPP segments Adjacent-year roughness differences (IRI, m/km) 64
65 4 Statistical analysis of the current New Zealand LTPP data base Figure 4.20 Adjacent year texture differences Count of 50m LTPP segments Adjacent-year texture differences (MPD, mm) The histogram program used to prepare the above three figures automatically sets the width of the graph to run from the lowest value to the highest value. Accordingly, there is a very wide spread of upper and lower-limits for the x-axes. Interpretation of observations from figures 4.18 to 4.20 are: low values of rut and roughness differences may correspond to repair work high values for texture differences may correspond to repair work low values of texture may correspond to a chipseal surface being replaced by an AC surface. High values of rut or roughness differences and low values of texture differences may correspond to accelerated ageing, so they may be what is being looked for in this project. (Alternatively, some of these differences may simply correspond to some types of road work or bad observations.) Percentage of inter-year differences: sterilised and unsterilised In appendix B2.1 there are a series of figures (one for each of rutting, IRI and MPD) showing in separate colours: percentage histograms for measurements on sterilised LTPP sites, and measurements on unsterilised/normal LTPP sites. As these histograms for sterilised LTPP sites and unsterilised/normal LTPP sites are very similar, they are not shown here in this summary. Percentage of inter-year differences: SH and TLA As above, but for SH and TLA LTPP sites, the percentage histograms for adjacent-year rut/iri/mpd differences are not shown here as the SH and TLA plots are very similar. (Readers wishing to view these plots should consult appendix B.2.1.) Percentage of inter-year differences: roadworks separated out A set of percentage histograms has been prepared where sites that have had road works were identified and separated out. (Roadworks that were relevant for each of the measurements were identified from the raters site notes.) As expected the difference data for sites with road works is a lot more spread out (see appendix B.2.1) than in the previous three graphs. 65
66 Analysis and interpretation of New Zealand long-term pavement performance data Count of inter-year differences: roadworks separated out Identifying the point at which the rut/iri/mpd data for sites with works tend to dominate is of key interest for this research report. The histograms discussed above were then modified to graph counts rather than percentages, and the vertical scale was expanded to enable very small values to be seen, as shown in figures 4.21 to Figure 4.21 Adjacent- year rut depth differences with and without roadworks Count of 50m LTPP segments Adjacent-year rut depth differences (mm) Figure 4.22 Adjacent- year roughness differences with and without roadworks Count of 50m LTPP segments Adjacent-year roughness differences (IRI, m/km) 66
67 4 Statistical analysis of the current New Zealand LTPP data base Figure 4.23 Adjacent- year texture differences with and without roadworks Count of 50m LTPP segments Adjacent-year texture differences (MPD, mm) Difference thresholds Figures 4.21 to 4.23 were then used to judge the difference thresholds, which are given in table 4.9. Table 4.9 Judged difference thresholds Measure Judged difference thresholds (taken from figures 4.21, 4.22 and 4.23) The point at which Accelerated ageing Decay rates during a roadworks become period of linear decay dominant Lane (ie wheelpath average) Transformed rut depth Leave in outlying Want to delete outliers transformed rut depth of difference becomes positive values choose m LTPP segments less than -0.5 Lane (ie wheelpath average) Transformed Leave in outlying Want to delete outliers transformed roughness of roughness difference positive values choose m LTPP segments becomes less than Lane (ie wheelpath average) Texture difference Leave in outlying Want to delete outliers MPD texture of 50 m LTPP becomes greater than negative values choose -0.6 segments Selecting the data For the linear ageing analyses, the data analyst looked for stretches of data with at least an eight-year range (ie eight points if data was collected every year) that had no road works relevant to the particular data type and with between year differences within the ranges identified in the last column of the above table. If there was a missing year the data analyst applied the same limit to the two-year difference bridging the missing year. For focusing on accelerated ageing, the data analyst deleted from the dataset only those outliers that could be attributed to road works that is specifically identified road works of low outliers for rut depth and roughness and high outliers for texture. 67
68 Analysis and interpretation of New Zealand long-term pavement performance data Linear ageing Initial analysis A simple linear regression model was fitted to each 12 road segment at each site where there was: 1 At least an eight-year range 2 No outliers in the differences 3 No relevant road works. Detecting a change in slope in the linear regression was achieved with the change point test developed by Davies (2002). For each of the three transformed variables (ie rut depth, roughness and texture) the following graphs were prepared: histogram of the residual standard deviation histogram of the slope (trend) histogram of the results of a change point test plot of slope versus the residual standard deviation (residual SD). The residual SD shows the degree to which the transformed data follows a linear trend. The graphs show there is substantial variability in the quality of fit. The slope (trend) shows how much the variable changes, on average, each year Graphs The set of three lots of four graphs produced can be found in appendix B.2.3 they are not included in this summary. Some of the observations made in appendix B regarding the slope graphs are: For rut depth slope tends to be positive; rut depth increases over time; but there is a lot of variability in the values. For roughness the slope values seem to be symmetrically distributed around zero, with perhaps a few more very high values. With texture the slope values are almost all negative; texture is decreasing but with a very wide range of values Further analysis The purpose of this further analysis is to detect a relationship between the slopes found in the previous section and various variables available in the site data. All the analyses are graphical. As there are few strong results graphically it should not be expected there will be many more from a more formal statistical analysis. The graphs in the following sub-section attempt to find relationships between the slope or, in some cases residual standard deviation, and: site type sensitivity (soil moisture sensitivity based on climate and geology (Henning 2008)) AADT 68
69 4 Statistical analysis of the current New Zealand LTPP data base SNP average rainfall. Notes on the predictor variables: Sensitivity is given as one of five categories: limited, low, medium, moderate or high. The AADT estimate was made on different years for different sites and it is not known if any attempt was made to adjust them to allow for this. SNP the database generally gives a site value for one year. Average rainfall is an average over the period from a nearby weather station Graphs Using the edited/selected subset of data, box-and-whisker plots of year-by-year difference versus site type (ie SH/TLA sterilised/unsterilised) were prepared. These box-and-whisker plots are shown below (see figure 4.30, figure 4.37 and figure 4.44) and can be compared with the slope graphs of figure 4.25, figure 4.32 and figure In general, the graphs are first introduced below, and then the collective discussion on them is given in section Figure 4.24 Rut depth: residual SD vs site type 69
70 Analysis and interpretation of New Zealand long-term pavement performance data Figure 4.25 Rut depth: slope vs site type Figure 4.26 Rut depth: slope vs soil moisture sensitivity 70
71 4 Statistical analysis of the current New Zealand LTPP data base Figure 4.27 Rut depth: slope vs AADT (SH in blue, TLA in red) Figure 4.28 Rut depth: slope vs SNP (SH in blue, TLA in red) Figure 4.29 Rut depth: slope vs rainfall (SH in blue, TLA in red) 71
72 Analysis and interpretation of New Zealand long-term pavement performance data Figure 4.30 Rut depth: differences vs site type Figure 4.31 Roughness: residual SD vs site type 72
73 4 Statistical analysis of the current New Zealand LTPP data base Figure 4.32 Roughness: slope vs site type Figure 4.33 Roughness: slope vs soil moisture sensitivity 73
74 Analysis and interpretation of New Zealand long-term pavement performance data Figure 4.34 Roughness: slope vs AADT (SH in blue, TLA in red) Figure 4.35 Roughness: slope vs SNP (SH in blue, TLA in red) 74
75 4 Statistical analysis of the current New Zealand LTPP data base Figure 4.36 Roughness: slope vs rainfall (SH in blue, TLA in red) Figure 4.37 Roughness: differences vs site type 75
76 Analysis and interpretation of New Zealand long-term pavement performance data Figure 4.38 Texture: residual SD vs site type Figure 4.39 Texture: slope vs site type 76
77 4 Statistical analysis of the current New Zealand LTPP data base Figure 4.40 Texture: slope vs soil moisture sensitivity Figure 4.41 SH texture: slope vs AADT 77
78 Analysis and interpretation of New Zealand long-term pavement performance data Figure 4.42 SH texture: slope vs SNP Figure 4.43 SH texture: slope vs rainfall 78
79 4 Statistical analysis of the current New Zealand LTPP data base Figure 4.44 SH texture: differences vs site type Observations on the graphs Observations from figures 4.24 to 4.44 are: 1 Residual SDs are much the same for the different site types for rut depth (figure 4.24), but for roughness the TLA ones seem to be lower (figure 4.31). Given the smaller sample sizes it is difficult to gain significant meaning from the differences in the box plots for the texture data (figure 4.38). 2 With reference to figure 4.25, the trends for the rut depth data are much stronger for the SH data than for the TLA data. This may be related to the higher values of rut depth in the TLA data. 3 With reference to figure 4.32, roughness tends to be decreasing on the SH data and with little trend in the TLA data. With reference to figure 4.39, texture is decreasing and the difference between the sterilised and unsterilised/normal sites may be due to the different surface types. 4 With reference to figure 4.36, the trend in rut depth is stronger as the site sensitivity gets higher. The values for limited are fairly meaningless because of the small sample size and otherwise the trend is fairly consistent. With reference to figure 4.33, the effect of sensitivity on roughness seems inconsistent and is probably small. With reference to figure 4.40, the trend in the texture data may be stronger for the high sensitivity sites. 5 With reference to figures 4.27 to 4.29, figures 4.34 to 4.36 and figures 4.41 to 4.43, there seems to be an increasing slope in the graph of rut depth versus AADT, but there is nothing obvious in the others. 6 The graphs of differences versus site type (ie figure 4.30, figure 4.37 and figure 4.44) are included for comparison with the graphs of slope versus site type (ie figure 4.25, figure 4.32 and figure 4.39). Given that we are looking at individual differences rather than slopes, which, in effect, represent an average of differences, the two sets of graphs are fairly consistent with each other. 79
80 Analysis and interpretation of New Zealand long-term pavement performance data 5 Review of maintenance strategies As has been discussed above, the numerical data available to undertake a statistical analysis to identify factors that need to be present for accelerated condition trending was not sufficiently robust. It was not possible to find significant and useful correlations with this dataset. This chapter now describes a manual investigation undertaken to investigate in detail some of the sites highlighted by the statistical analysis, and to interpret site photographs, site notes and construction records. Manually populated tables then give engineering reasons for the anomalies highlighted by the statistical software. Improvement strategies are suggested for the future collection and management of LTPP data. 5.1 Normal and sterilised sites A review of the maintenance strategies applied to the normal and sterilised sites reveals a possible lack of understanding by regional personnel on how to manage the differing maintenance requirements of the two benchmark site classifications. In some regions it appears that both normal and sterilised sites have been treated similarly. This includes not repairing maintenance defects in a timely manner on normal sites, addressing more than just safety defects on sterilised sites and often using low-cost inappropriate maintenance repairs on both the normal and sterilised sites. This means the deterioration and maintenance repair data collected on the sites has a degree of contamination which makes pure statistical analysis of measured data and the interpretation of deterioration trends difficult. There is still the ability to use the data to compare pavement performance but this needs to be done carefully by identifying maintenance activities that may have distorted the data. Improvement strategy one To improve the quality of the data going forward there is a need for regional staff in the transport sector to be very clear about the difference between normal and sterilised sites and to apply the documented maintenance strategy that applies to each ensuring that an accurate record of maintenance activities is maintained. The maintenance approval system currently required for sterilised sites could be extended to cover normal sites also. 5.2 NZ Transport Agency LTPP database completeness It appears the NZ Transport Agency LTPP database has not always been kept up to date so the available disk containing the years of data is not complete. This has made the review of the statistical analysis more difficult as useful information has not been readily available. There does not appear to have been the level of interest and attention to detail needed by the management, surveillance and quality assurance consultants and or NZ Transport Agency LTPP data managers at some stages in the past to ensure the accuracy and completeness of the LTPP database. Improvement strategy two Approach the survey contractor to provide a replacement copy of any data missing from the current database so that a complete record of all data recorded to date is available for statistical analysis and review. 80
81 5 Review of maintenance strategies Improvement strategy three Clause 8.4 of the LTPP contract NO (NZ Transport Agency 2009) requires a minimum of four photographs that show the site in relation to the surrounding landscape are taken to correctly identify the site. However the additional photographic record of the distress at the sites recorded each year by the survey contractor are extremely valuable for research and should be specified as a requirement under the contract. The specification should detail what photographs are to be taken and how they are to be catalogued. Again an approach should be made to the survey contractor to provide a copy of the annual photographs taken to date where these are missing from the current database. The use of the high-speed video for year-on-year comparisons is very valuable but the quality of the video has shown to be lacking when reviewing detail of specific distress. 5.3 Completeness of the RAMM database Searching for pavement and surfacing history for the normal and sterilised sites has shown there are significant gaps in the pavement and surfacing records for these sites in the NZ Transport Agency RAMM database. This makes it more difficult to compare sites and to understand why some sites are performing the way they are. There appears to be real difficulty in getting correct yearly renewal data entered into RAMM and then have this information remain correct and accurate within the database going forward. Improvement strategy four It would be much easier to find and interrogate RAMM data if the normal and sterilised sites were separate treatment lengths within each network s forward work programme. It would also appear sensible that all pavement and surfacing renewals cover the total site rather than part of the site. Improvement strategy five There should be time committed for someone with the required technical skills to review the pavement and surfacing RAMM records for each site to ensure they are realistic, accurate and as complete as possible. 5.4 Timing, type and quality of maintenance repairs The timing, type and quality of maintenance repairs has caused some contamination of the pavement performance data Timing of maintenance repairs Pavement and surfacing distress has been left for too long on some normal sites before maintenance repairs have been completed. This has two impacts: The data records pavement distress for a longer period than is necessary. There is the potential for the ingress of water to extend the area of failure beyond what it would have been if repairs were completed at the right time. Conversely it appears some low-risk distress has been repaired on sterilised sites so the natural progression of distress over time has not been observable. CAL-54 (SH30 RP 147/ ) is a good example of cracking that was not programmed to be repaired in a timely manner for pavement preservation. In 2007 minor fatigue cracking and pumping of 81
82 Analysis and interpretation of New Zealand long-term pavement performance data fines had developed. This progressed into a pothole in 2008 and then further into a pavement failure that was repaired in It also shows a significant increase in cracking following water cutting. Table 5.1 records the survey contractor s visual comments about the distress evident at the site and has a reference to photographs taken annually by them. See appendix A for a copy of the photographs. Table 5.1 Visual comments by the survey contractor of distress evident at the site Visual comment Date Year Photograph (appendix A) Some cracking has developed in section 5 of the decreasing lane. The remainder of the site remained basically the same as last year. Rotorua airport site has not really changed. It is in pretty good condition but a bit flushed in places. Some cracking at the start (transverse) of the increasing lane and in section 5 of the decreasing lane. The site is quite badly flushed and has some chip loss. Two structural failures, one at loc2i and one at loc20d have formed. (Note: although the photograph shows the increasing direction the location of the photograph is actually in the decreasing direction.) A 5 m section of alligator cracking has developed in SS1 of the increasing lane, and there is some chip loss in the right wheelpath. Increased flushing and the structural failure identified previously are the only visible defects in the decreasing lane. The cracking and surface defects identified previously (Loc2I and Loc21d) look to have deteriorated further but the remainder of the site seems in reasonable condition and relatively unchanged. Note this site has a lot of heavy trucks and logging trucks. A large surface or structural failure is developing in SS6, and the failure in SS5 looks to have increased. The chip loss does not look to have changed. The large surface or structural failures previously identified in SS5 & 6 have deteriorated and increased in size, and the cracking in SS1i has been partially sealed. The chip loss does not seem to have changed. This site has been scrubbed to remove all the excess binder and this has exposed extensive cracking in the left wheel path of the decreasing lane and some minor cracking in the left wheel path of the increasing lane. The site looks clean and fresh but has a lot of cracking. The decreasing lane in particular is extensively cracked in the left wheel path including the structural patch in SS1d. (Note: this activity is described as water blasting in the RAMM Maintenance cost table which does not have any record of water blasting being completed at this calibration site. Some water blasting to address SCRIM exceptions may have been completed at the site but should have been recorded in the RAMM maintenance cost table. The photographic record appears to confirm that no water blasting was completed in the decreasing lane in SS5.) 19 January November November December November October October October /07 Figure A /08 Figure A /09 Figure A /10 Figure A.4 Figure A /12 Figure A /13 Figure A /14 Figures A.8 and A.9 82
83 5 Review of maintenance strategies Visual comment Date Year Photograph (appendix A) This site has had some major structural repairs, some of which have significant cracking. Some have been spot patched and others have small potholes. The decreasing lane is lightly flushed in SS1-3 and moderately flushed in SS4. There is chip loss along the road edge but this is in a previous seal not the current wearing course. This site had some structural repairs, some of which have significant cracking, combined with multiple spot patches and some small potholes. The decreasing lane is lightly flushed in SS1-3 and moderately flushed in SS4. There is chip loss at various locations but this is predominantly confined to the road shoulder 05 November October /15 Figure A /16 Figure A.11 Improvement strategy six Once improvement strategy one has been firmly embedded in local LTPP management, ensure the timing of maintenance repairs fits with the maintenance management strategy for each site Type of maintenance repairs It appears that often an LTPP do minimum mentality exists around the type of maintenance repairs that are appropriate to address pavement failures on both normal and sterilised sites. The repairs are often small, low cost and inappropriate for genuine pavement repair. These repairs often include: Thin in-situ cement stabilised repairs that fail again often within months of completion. Time of year, cement application rates, depth of the repair and moisture in the pavement can all contribute to early failure. This type of pavement repair failure is quite evident in the survey contractor s notes and site photographs. Thin asphalt surfaces. This repair method appears to be used without first knowing the strength of the pavement on which it is being constructed. The result is that an area of cracking larger than existed just prior to the completion of the repair often develops quite quickly and statistically shows an increase in cracking even though a maintenance repair has been completed. Again this type of pavement repair failure is quite evident in the survey contractor s notes and site photographs. 83

84 Analysis and interpretation of New Zealand long-term pavement performance data Figure 5.1 CS- 36 SH2 RP 858/ increasing direction Figure 5.1 shows an example of a pavement repair surfaced with a thin asphalt surface that has extensively cracked. The repair is not recorded in the RAMM maintenance cost table but appears to have been completed in 2005 and is showing significant cracking in the December 2007 photograph. There are a number of possible reasons for the failure of this repair: The pavement deflections at 1,502 µm are too high for a thin asphalt surfacing. The pumping of basecourse fines suggests a water proofing seal between the basecourse and the asphalt may have been left out. A review of the site notes and photographic record show there may be a link between water cutting (referred to as scrubbing in the notes) and accelerated cracking of the surface on LTPP sites. This is the note recorded for CAL : This site has been scrubbed to remove all the excess binder and this has exposed extensive cracking in the left wheel path of the decreasing lane and some minor cracking in the LWP of the increasing lane. The site looks clean and fresh but has a lot of cracking. The decreasing lane in particular is extensively cracked in the left wheel path including the structural patch in SS1d. This is the note recorded for CS : Structural A/C patches at 160 m and 280 m in the increasing lane appear to have sunk and are below the existing surface, edge cracking at the joins between the old and new seal have formed. The decreasing lane has been scrubbed and cracking in the inner wheelpath of the decreasing lane is evident particularly along the road edge from 120 m to 240 m. And in 2010: 84
85 5 Review of maintenance strategies The site has a lot of cracking especially along the edge of the left wheel path in the decreasing lane. The A/C patches in the increasing lane were sealed with a fine grade chip but most of this has been lost. Overall a slight deterioration in condition. A quick review of scrubbing in the annual LTPP site notes is given in table 5.2, which shows that six of the 10 water-cut sterilised sites and six out of seven water-cut unsterilised sites failed within the next two years. Table 5.2 Performance of water cutting LTPP sites Number of sites water cut Cracking next inspection Cracking or failures < 2 years following Sterilised 10 (2 TLA) 5 1 Unsterilised 7 (1 TLA) 5 1 Improvement strategy seven: Ensure the maintenance repairs approved at LTPP sites are appropriate for the pavement type and strength at the site. Consider alternative treatments to water cutting if there is a risk that water cutting will cause unnecessary failure in vulnerable weaker pavements Quality of maintenance repairs The quality and ride of some maintenance repairs is influencing the data over a period of years at some sites as they continue to show an increase in roughness and cracking after the completion of maintenance repairs where they should be showing a reduction in distress. There are two reasons for this: poor maintenance treatment selection poor construction practices. Treatment selection has been partially covered in section above under inappropriate repair types. Figure 5.2 is an example of a poor-quality repair completed on a calibration site. This is in fact the third repair at this exact location. The RAMM maintenance cost table records a 105 m 2 digout completed at this site on 14 March 2013, a 112 m 2 digout completed on 12 September 2013 and a 131 m 2 in-situ stabilising repair completed on 5 April This photograph was taken on 5 December (RAMM data also shows the other larger repair at this site, currently in a similar state to this, has been dug out three times and subsequently in-situ stabilised.) 85
 is a very good example of where poor maintenance repairs for whatever reason have dramatically affected the site data showing a dramatic reduction in pavement performance after spending a large")
86 Analysis and interpretation of New Zealand long-term pavement performance data Figure 5.2 CAL- 58 SH38 RP 0/ Decreasing direction This site (figure 5.2) is a very good example of where poor maintenance repairs for whatever reason have dramatically affected the site data showing a dramatic reduction in pavement performance after spending a large amount of money on maintenance repairs. A total of $42, has been spent on pavement and surfacing repairs in the decreasing direction since 2011/12. Poor designs have also contributed to the failure of chipseals on maintenance patches and also of some chipseal renewals. Incorrect seal selection to accommodate the existing texture or incorrect binder and chip application rates contribute to either flushing or chip loss. Poor repair reconstruction has led to failed rough repairs which are all too common in both calibration and sterilised sites. Extracts from the LTPP survey contractor s site notes reveal documented issues with the quality of maintenance repairs, as shown in table 5.3. It should be noted that all these sites are un-sterilised, ie normal maintenance practice should have been applied. Table 5.3 Extracts from the survey contractors site notes regarding maintenance quality Site Date Site note CAL-19 04/11/2003 decreasing lane, this lane has had a large patch repair in the decreasing lane at about 200 m, this repair has not been done very well and is deteriorating quite badly and will affect the roughness in the 50 m section. The patch at the start is also deteriorating quite badly CAL-19 16/11/2012 There is a large cement stabilised repair in the decreasing lane from m which has started to fail. CAL-32 15/01/2003 Several very large patches some new since last year which have already started to crack.. CAL-34 09/11/2011 Cracking evident prior to the reseal some two or three years ago is again visible on the new seal CAL-34 01/11/2013 The site has moderate flushing throughout, the bulk of the cracking identified last year is unchanged; however, the structural failure at 150 m has deteriorated significantly and there is now a 100 mm rut and shove along with severe cracking. This has increased the rutting in 150 and 200 m subsections. 86
87 5 Review of maintenance strategies Site Date Site note CAL-34 16/11/2014 The site is moderately flushed throughout, the bulk of the cracking identified last year is unchanged. However, the structural repair at m has failed or is failing (cracking). The repair reduced the rutting in the structural failure but increased the roughness in both SS3 and SS4. CAL-35 17/12/2014 There has been a considerable amount of work done on this site, the section from m has had an OG A/C overlay to fix the subsidence problem and the section from m has been resealed. (Note this affected the decreasing lane only). The A/C patches in the decreasing lane are badly cracked. CAL-38 21/01/2012 The structural repairs to the decreasing lane in subsections 4 and 5 last season are failing, cracking and potholes have been patched and the cracking at the beginning of the lwp increasing lane is much the same. The rest of the site remains unchanged. Improvement strategy eight Apply improvement strategy one. Also ensure the quality of maintenance repairs is improved through appropriate design and reconstruction practices, for example not just defaulting to 150 mm stabilisation repairs or thin AC surfaces. Ensure there are inspection audits of designs and completed repairs on all LTPP sites. Improvement strategy nine Consider establishing a code to mark data where the data collection contractor believes the results have been adversely impacted by poor maintenance repairs. This would provide a flag and allow the data to be individually screened during analysis. 5.5 Walking profilometer The analysis of the data has highlighted a new question on the use of the walking profilometer to measure roughness (reported in units of IRI) as it possibly leads to some confusion when completing the pure statistical analysis in Chapter 4. It is possible the walking profilometer measurements may also be influenced by macro texture change. If so, a new reseal with higher macrotexture may show an increase in roughness compared with what existed before. This roughness progressively reduces over time as the chip re-orients and the texture in the new seal reduces. Block cracking, pavement repairs and depressions should be expected to contribute to an overall increase in roughness. However the walking profilometer also showed an increase in roughness with on-going scabbing in a chipseal which is a useful indicator of surface deterioration. The set out line for the walking profilometer does not always fall in the centre of the wheel paths and in some instances is near the edge of the wheel path. It is uncertain how much this roughness profile might differ from what might be measured in the centre of the wheel path. Improvement strategy ten Review the measurement location of the walking profilometer in terms of its location within the wheel path and what impact this has on the derived IRI. 87
88 Analysis and interpretation of New Zealand long-term pavement performance data 5.6 Crack definition and identification Following a close review of the LTPP database, there appears to be differing interpretation of some crack types that adds a level of confusion in the analysis of the crack data. Correct identification and recording of cracking will help with data analysis and reviewing crack development and progression. The LTPP contract NO (NZ Transport Agency 2009) has quite clear definitions and causal factors for cracking. Table 5.4 is an extract from the contract document. Table 5.4 Definition of distress modes (NZ Transport Agency 2009) Distress mode Definition Mode of failure Alligator cracks Transverse cracks These are numerous cracks closely spaced and mostly occurring in the wheel tracks. This is often associated with secondary distress mechanisms such as shoving. As the name indicates, these are oriented perpendicular to the centreline. Many attributes exist but have the common causing factor of relative movement in the pavement layers. Load associated, therefore caused by fatigue of pavement layers. Three known causes including thermal, movement in the subgrade due to clay activity and vegetation next to road. Longitudinal cracks Cracks running parallel to the centreline. In many cases a result of construction joints or resulting from multiple lifts during construction. It would appear that early signs of fatigue cracking in some cases is being rated as longitudinal or transverse cracks where these appear as meandering cracks rather than numerous interconnected cracks. Brown et al (2015) have previously reported that single transverse or longitudinal cracks would over time develop and form an area of alligator cracking. The mode of failure in table 5.4 is clear that where the cracking is load associated and caused by fatigue of the pavement layers the crack definition should be alligator cracking. However the definition refers to numerous cracks which is somewhat misleading as the earliest signs of fatigue cracking may appear as single or meandering cracks. It would appear logical then to rate all fatigue cracking caused by pavement deflections in areas of weak pavement as alligator cracking as the reason for crack development is the same. Transverse and longitudinal cracking are more commonly a result of shrinkage in bound or semi-bound pavements or are cracks that have reflected through the surface layer from underlying pavement joints. These include adjoining pavements of differing strengths such as seal widening, trenches and repairs or failure at pavement construction joints. A document that provides some helpful direction on crack definitions is the Austroads guide to pavement technology, part 5: pavement evaluation and treatment design (Austroads 2011). It contains a photograph of each crack type, a good description of each crack type and the most likely causal reasons. This is very helpful in understanding the types of cracking that appear in various pavement types. While manually examining the LTPP database to identify the crack types recorded it appears some cracks that have a photographic record are missing from the database or have been assigned an incorrect location. This may have been a coincidence on one of the sites looked at and have little impact on the accuracy of the data as a whole, but the actual extent is unknown. (An example of missing or misplaced data is seen in photographs cs36_07_loc 3-4d cracks and cs36_07_loc 4-5d cracks taken on the 7 December 2007 but where no cracking is recorded under any crack type in records 9124 and 9125 on the 50 m rating table in the Transport Agency LTPP data.) 88
89 5 Review of maintenance strategies Improvement strategy eleven Review all crack types observed on roads in New Zealand, their description and most likely causal factors and review if changes are appropriate in the way cracking is visually assessed and recorded on LTPP sites. Improvement strategy twelve It may be appropriate to assign a code to each surfacing and pavement type as they perform and deteriorate differently. This could provide guidance to the likely distress types that may develop at each site, eg shrinkage and block cracking will most likely occur on semi bound pavements. Using a coding system could then make analysis of like pavements easy as well as comparing the performance between different pavements and surfacing types. Coding could also be useful to group SH and TLA sites based on traffic volume and speed environment. Improvement strategy thirteen Complete annual audits of the LTPP database to ensure the accuracy of entered data. 5.7 Crack progression and treatment type and timing One of the important questions concerning LTPP is trying to understand crack progression, how quickly cracks grow and how quickly the various crack types need to be repaired in order to maximise pavement life until rehabilitation. Normal site CAL-54 (SH30 RP 147/ ) was selected as a case study to examine the progression of fatigue cracking that was not programmed for repair in what most maintenance engineers would consider to be a timely manner for pavement preservation. Table 5.1 from section explains crack progression on this particular site. The photographs referred to in table 5.1 can be seen in appendix A. This site carries an AADT of 10,437 with 11% of that HCVs. The site has FWD readings between 860 and 2,075 and SNP between 1.02 and 3.06 in the decreasing lane. (The deflection and SNP at location 21 decreasing are 2,075 and 1.02.) This shows an area of weaker pavement and is the likely cause of the fatigue cracking evident at the site. There does not appear to be any test pit information available for this site and it would be interesting to know why this cracking has progressed at such a slow rate. It is likely that the pavement materials are quite free draining and have very low moisture sensitivity. This does provide an interesting example of crack progression as this was first recorded as a small patch of fatigue cracking on 19 January 2007 and repaired using a digout repair on 19 November This would suggest that although this pavement was cracked and pumping some fines it was able to remain in a safe condition for at least 6 years 10 months. Interestingly, a photograph of cracking pumping fines in the first coat of the digout is recorded on 5 November 2014 and a pothole repair completed on 21 September This case study then raises some questions regarding this specific failure: What type of repair should have been completed in this area of cracking? When should the repair have been completed? Did the years of water getting into the pavement cause the cracking and seal failure in the digout (clearly visible in the site photographs) or was it more related to poor reconstruction? 89
90 Analysis and interpretation of New Zealand long-term pavement performance data 5.8 Performance of different pavement and surfacing types As alluded to in Improvement strategy eleven, different pavement types perform differently, different surfacing types perform differently as do various combinations of the two. The long-term performance of these sites will also be influenced by the age and strength of both the pavement and the surfacing. To help with this review a simple spreadsheet was compiled, using the SH sites only, to look at the age of the pavement from RAMM, the age and type of the surfacing from RAMM, the daily traffic and percentage of heavy commercial vehicles, what and when surfacing renewals were applied and how many sites had deteriorated to the point of needing a full area-wide pavement renewal. It was felt this would provide insight into the availability and reliability of RAMM pavement and surfacing history (section 5.3) and provide an easy view of the general history of each site. It could also provide insight into the regional understanding of the two LTPP site classifications and the maintenance strategy adopted for each. This spreadsheet is shown as table

91 5 Review of maintenance strategies Table 5.5 LTPP surfacing and pavement renewals from the RAMM database 91
92 Analysis and interpretation of New Zealand long-term pavement performance data Some conclusions to be drawn from table 5.5 are: 1 A significant amount of the original pavement data is inaccurate (for dtims calibration modelling data would have had to be assumed) or does not exist in RAMM. 2 Some post-2000 pavement and surfacing data in RAMM is missing or incorrect. 3 The pavement age is not necessarily a good indicator of when a pavement renewal will be required. However this is difficult to evaluate given the amount of missing or incorrect data. 4 On sound pavements the surfacing type, available maintenance options and speed environment seem to influence the surface life more than traffic volume and loading, eg open-graded porous asphalts have only achieved short lives (six to seven years) in a 100 km/h speed environment, whereas dense mix10 asphalt in a 60 km/h speed environment may achieve 21 years. This is an example of the value of categorising sites as the onset of deterioration and type and timing of repairs can be very different for similar but different surfacing types. 5 The simple spreadsheet also shows: a b Of the 33 sterilised sites, 10 or 30.3% have been rehabilitated. Of the 31 calibration sites, 7 or 22.6% have been rehabilitated. This simple view of the sites does not account for any sites that may have been removed or replaced since the 1 March 2009 schedule of sites was compiled except to split site CAL-59 into CAL-59a Increasing direction and CAL-59b decreasing direction. This would suggest the rehabilitation rate of sterilised sites is higher than for calibration sites and is an expected result. Intuitively you would expect the gap between the rehabilitation percentages to be wider but it is likely the maintenance mismanagement has brought them closer together. 92
93 6 Discussion 6 Discussion Following a detailed analysis, it was found that numerical data available to undertake a statistical analysis to identify factors that need to be present for accelerated condition trending was not sufficiently robust. It is not possible to find useful or significant correlations with this data set as it stands. This in itself is a major outcome of this research. Expected useful life estimation was not reliable because the slope on the regression varies too much from site to site and in the case of roughness isn't much different from zero. The data was insufficiently accurate or complete to undertake a sufficiently robust statistical analysis to identify or suggest what factors need to be present for accelerated condition trending to take place. This also brings into question the data that was used to derive the dtims models It was decided that rather than pursue further automated processing of data, a manual investigation by a person with extensive experience in road engineering and maintenance was undertaken. This investigated engineering explanations for the sites highlighted by the statistical analysis, which involved interpreting site photographs, site notes and construction records. A table was then compiled manually citing the engineering reasons for the anomalies highlighted by the statistical software. This proved to be a time consuming and would be an expensive process to repeat regularly A significant amount of important data is scattered within the notes filed, photographs, which is time consuming to extract under the current data structure. With regard to cracking, accurate tracking of individual crack development over time using existing methods is expensive and time consuming to both collect and then analyses. Visual analysis also has limits of precision, and the timing of crack mapping needs to be considered, for example dry or wet, summer or winter? There is also the likelihood that once a chipseal is flushed, some cracks will self-heal. 93
94 Analysis and interpretation of New Zealand long-term pavement performance data 7 Conclusions This review was unable to identify any reliable data to show that pavements displaying cracking are at a higher risk of failure. The review does suggest, however, that the current selection of maintenance treatment type and the quality of maintenance and reconstruction practices may assist in making the level of service worse after maintenance, manifest as rutting and cracking after a very short time, compared with sterilised sites where maintenance is not undertaken. There is much scope available to improve the quality of the data in the LTPP and the RAMM databases. The data could be restructured to be more compatible with smart computing and machine learning (artificial intelligence) to make the extraction of meaningful results more affordable and hence more frequent. The maintenance practice of water cutting also needs to be carefully considered, as this may contribute to a more rapid deterioration in pavement condition. See section Type of maintenance repairs. 94
95 8 Recommendations 8 Recommendations The value of maintaining an LTPP project is fully supported. The following are recommendations on how the dataset could be restructured to provide additional benefit. Some of these recommendations can be achieved earlier than others while some may have greater impact than others. However, these recommendations as a composite are believed to useful in improving the value of the LTPP database for the benefit of future research. 8.1 Intermediate term Smart computing Analyse and reorganise the LTPP data arrangement by smart computing specialists to enable data imputation through: data cleansing image analysis (eg crack mapping, site photographs) machine learning incorporation of big data to remove the reliance on resource-consuming human analysis. 8.2 Short term Maintenance data Populate the LTPP database NZTA_LTPP_working.mdb with the maintenance data used to prepare figure 4.9. (This data was kindly provided by the survey contractor) Speed zone data Populate the LTPP database NZTA_LTPP_working.mdb with the speed zone data used to prepare figure (This data was kindly provided by the survey contractor) Linear positions Update the fields recording the positions of the LTPP sites in the RAMM LTTP table with linear positions calculated from the survey contractor s GPS coordinates AADT data Ensure the date for the AADT data in table CAL_SEC_TRAFFIC_DATA of NZTA_LTPP_working.mdb is the same for all LTPP sites. (The current situation of having a different RecordedDate for many LTPP sites makes robust analysis an issue.) Soil moisture sensitivity With reference to the five soil moisture sensitivity categories, as the number of sites classified as moderate is very small, this category should probably be amalgamated with another category. 95
96 Analysis and interpretation of New Zealand long-term pavement performance data Enforce the maintenance differences between normal and sterilised sites To improve the quality of the data going forward there is a need for regional staff (Transport Agency contract managers and maintenance contractors, including their consultants) to be very clear about the difference between normal and sterilised sites and to apply the appropriate maintenance strategy that applies to each. There will need to be a re-designation of some sterilised sites to non-sterilised where significant maintenance has changed the normal deterioration of the pavement at the site. Additional sterilised sites may be required to meet the shortfall in sterilised sites Missing data Request the survey contractor to provide a replacement copy of any data missing from the current database so a complete record of all data recorded to date is available for statistical analysis and review. A view only copy of all LTPP data should also be available on RAMM Photographs Clause 8.4 of the LTPP contract NO ( NZ Transport Agency 2009) requires that a minimum of four photographs showing the site in relation to the surrounding landscape are taken to correctly identify the site. However the additional photographic record of the distress at the sites recorded each year by the survey contractor are extremely valuable for research and should be specified as a requirement under the contract. The specification should detail what photographs are to be taken and how they are to be catalogued. Again an approach should be made to the survey contractor to provide a copy of the annual photographs taken to date where these are missing from the current database Separate treatment lengths It would be much easier to find and interrogate RAMM data if the normal and sterilised sites were separate treatment lengths within each network s forward work programme. It would also appear sensible that all pavement and surfacing renewals cover the total site rather than part of the site Technical review of RAMM records for each LTPP site There should be time committed for someone with the required technical skills to review the pavement and surfacing RAMM records for each site to ensure they are realistic, accurate and as complete as possible Timing of maintenance repairs Ensure the timing of maintenance repairs fits with the maintenance management strategy for each site Water cutting Ensure the maintenance repairs approved are appropriate for the pavement type and strength at the site. Consider the use of alternative treatments to water cutting on vulnerable weaker pavements where accelerated pavement deterioration is likely to occur if the surplus binder is removed allowing greater access for water to enter the pavement Appropriate maintenance treatments Ensure the quality of maintenance repairs is improved through appropriate design and reconstruction practices, for example not just defaulting to 150mm stabilisation repairs or thin AC surfaces. Ensure there are inspection audits of designs and completed repairs on all LTPP sites. 96
97 8 Recommendations Known poor maintenance repairs Consider establishing a code to mark data where the data collection contractor believes the results have been adversely impacted by poor maintenance repairs. This would allow easy identification of this data during analysis Walking profilometer Review the measurement location of the walking profilometer in terms of its location within the wheel path and what impact this has on the derived IRI Crack assessment Review all crack types observed on roads in New Zealand, their description and most likely causal factors and review if changes are appropriate in the way cracking is visually assessed and recorded on LTPP sites Surfacing and pavement codes It may be appropriate to assign a code to each surfacing and pavement type as they perform and deteriorate differently. This could provide guidance to the likely distress types that may develop at each site, eg shrinkage and block cracking will most likely occur on semi bound pavements. Using a coding system could then make analysis of like pavements easy as well as comparing the performance between different pavements and surfacing types. Coding could also be useful to group SH and TLA sites based on traffic volume and speed environment Accuracy audit Complete annual audits of the LTPP database to ensure the accuracy of entered data. 97
98 Analysis and interpretation of New Zealand long-term pavement performance data 9 References Austroads (2007) Guide to asset management part 5b: roughness. AGAM05B-07. Sydney NSW: Austroads. Austroads (2011) Guide to pavement technology part 5: pavement evaluation and treatment design. PT Sydney NSW: Austroads. Austroads (2014) LTPP site establishment in South Australia. Austroads technical report AP-T Austroads (2015a) Austroads LTPP/LTPPM study summary report Austroads technical report AP-T Austroads (2015b) Austroads glossary of terms (6th ed). AP-C Sydney NSW: Austroads. Austroads (2015c) Expanding information by utilising uncertain data. Austroads technical report AP-T Austroads (2016a) Austroads LTPP/LTPPM study summary report Austroads technical report AP-T Austroads (2016b) Incorporating uncertainty in pavement management system (PMS) modelling: phase 1. Austroads technical report AP-T Brown, D, T Henning, P Herrington and J Wu (2015) Chipseal cracking. NZ Transport Agency research report 579. Brown, D (2016) communication with Robert Henderson (via Peter Cenek), 30 Sept Cenek, PD (2001) Regionalisation of roading authorities for pavement deterioration modelling. Summary report as appended to Proposed methodology for the acquisition of data to improve the fit of HDM road deterioration models incorporated in RIMS-dTIMS. PD Cenek and N Locke (2003). Central Laboratories report Choummanivong, L (2015) LTPP Newsletter, no.11. Vermont South: ARRB. Clayton, B (2000) Guidelines for site establishment and data collection for new long-term pavement performance sites. Contract report RC Vermont South, Victoria: ARRB Transport Research. Davies, RB (2002) Hypothesis testing when a nuisance parameter is present only under the alternative linear model case. Biometrika 89: Federal Highway Administration (1999) Strategic plan for LTPP data analysis. Washington DC: FHWA. Federal Highway Administration (2000) LTPP product plan. FHWA-RD Washington DC: FHWA. Federal Highway Administration (2008) LTPP 2007 year in review. Washington DC: FHWA. Federal Highway Administration (2011) Results of long-term pavement performance SPS-3 analysis: preventive maintenance of flexible pavements. FHWA-HRT Washington DC: FWHA. Hassan, RA, O Lin and A Thananjeyan (2015) Markov chain modelling of pavement surfacing. Transportation Research Record: Journal of the Transportation Research Board no (Low Volume Roads). Henning, TFP (2008) The development of pavement deterioration models on the state highway network of New Zealand. PhD thesis. University of Auckland. 98
99 9 References Henning, TFP, SB Costello, RCM Dunn, C Parkman and G Hart (2004) The establishment of a long-term pavement performance study on the New Zealand state highway network. Road & Transport Research 13, no.2. Henning, TFP, SB Costello and TG Watson (2006), A review of the HDM/dTIMS pavement models based on calibration site data. Land Transport NZ research report 303. Henning, TFP, RCM Dunn, CC Parkman and J Brass (2006) Long-term pavement performance (LTPP) studies in New Zealand a progress update. Paper presented at 8th NZIHT and Transit NZ Annual Conference. Hoque, Z (2003) LTPP Newsletter, no.1. Vermont South: ARRB. Killingsworth, BM, AL Simpson, JB Rauhut, E Owusu-Antwi, R Ahmad, MI Darter and OJ Pendleton (1994) Early analyses of LTPP general pavement studies data: data processing and evaluation. SHRP-P-684, Strategic Highway Research Program (SHRP), Washington DC. Martin, T (1994) Pavement behaviour prediction for life-cycle costing. ARRB research report 255. Martin, T (2004). Data review and calibration of HDM-4 road deterioration models. ARRB research report 360. MathsIsFun.com (2014) Skewed data. Accessed 28 September Morosiuk, G, MJ Riley and JB Odoki (2001) HDM-4 modelling road deterioration and works effects. Highway development and management series 6. Murthy, DNP, M Xie and R Jiang (2004) Weibull models. Hoboken, NJ: John Wiley. National Cooperative Highway Research Program, Federal Highway Administration and American Association of State Highway and Transportation Officials (1986) Strategic highway research program: research plans. Final report. Washington, DC. ND Lea International Ltd (1995) Modelling road deterioration and maintenance effects in HDM 4. RETA 5549 REG Highway Development and Management Research. Final report prepared for the Asian Development Bank. NZ Transport Agency (2009) Data collection on long term pavement performance sites. Request for tender. Contract number: NO NZ Transport Agency (2016) Procedure to be followed prior to works being carried out on a benchmark and calibration LTPP section/site. Accessed 26 November Rail/docs/LTPP-maintenance-procedure.pdf. Paterson, WDO (1987) Road deterioration and maintenance effects: models for planning and management. A World Bank Publication. Baltimore: The Johns Hopkins University Press. Baltimore. PIARC (1987) Report of the committee on surface characteristics. Technical Committee 1 report. Pp in Proceedings of the XVIIIth World Road Congress, Brussels, Belgium. Puccinelli, J, SM Karamihas, KT Hall, J Minassian and K Senn (2015) Performance evaluation of Arizona s LTPP SPS-9 project: strategic study of flexible pavement binder factors. SPR 396 9A. Arizona Department of Transportation Research Center. Roberts, J and T Martin (1996) Recommendations for monitoring pavement performance: national strategic research project. ARRB research report 293. Vermont South, Victoria. 99
100 Analysis and interpretation of New Zealand long-term pavement performance data Rolt, J and CC Parkman (2000) Characterisation of pavement strength in HDM-III and changes adopted for HDM-4. 10th International Conference of the Road Engineering Association of Asia and Australia. Transit New Zealand (2004) Specification for sealing chip. TNZ M/6: Transportation Research Board (1984) America's highways: accelerating the search for innovation, special report 202. Washington. Turner-Fairbank Highway Research Centre (2015) LTPP 2014 and beyond what is needed and what can be done? FHWA-HRT McLean, VA: FHWA. Weibull, W (1951) A statistical distribution function of wide applicability. ASME Journal of Applied Mechanics (September 1951): pp

101 Appendix A: LTPP site maintenance Appendix A: LTPP site maintenance Figure A.1 Photograph 1, CAL- 54, 19 January 2007, loc 20-21d flushing and cracking 101

102 Analysis and interpretation of New Zealand long-term pavement performance data Figure A.2 Photograph 2, CAL- 54, 22 November 2007 loc 20-21d flushing and cracking 102

103 Appendix A: LTPP site maintenance Figure A.3 Photograph 3, CAL- 54, 21 November 2008 loc 20-21d flushing and cracking 103


104 Analysis and interpretation of New Zealand long-term pavement performance data Figure A.4 Photograph 4, CAL- 54, 6 December 2009 loc 20-21d flushing and cracking Figure A.5 Photograph 5, CAL- 54, 2 November 2010 loc 20-21d flushing and cracking 104


105 Appendix A: LTPP site maintenance Figure A.6 Photograph 6, CAL- 54, 15 October 2011 loc 20-21d flushing and cracking Figure A.7 Photograph 7, CAL- 54, 31 October 2012 surface patch loc 20d 105


106 Analysis and interpretation of New Zealand long-term pavement performance data Figure A.8 Photograph 8, CAL- 54, 7 October 2013 loc 20-21d flushing and cracking Figure A.9 Photograph 9, CAL- 54, 17 October 2013 loc 20-21d flushing and cracking 106


107 Appendix A: LTPP site maintenance Figure A.10 Photograph 10, CAL- 54, 5 November 2014 loc 20-21d cracking in the 2014 maintenance repair Figure A.11 Photograph 11, CAL- 54, 29 October 2015 loc 20-21d cracking and patching in the 2014 maintenance repair 107
108 Analysis and interpretation of New Zealand long-term pavement performance data Appendix B: Preliminary report on LTPP data analysis B1 The data The data has been taken from NZTA_LTPP_work.mdb. There is some documentation in Data CD Users Manual.pdf. All the data has been analysed as there is a probability all of it may be unreliable. Consistency checks have been relied on to identify incorrect data. The main datasets are for roughness, rutting, texture and rating. These are available in 10 m, 50 m and 300 m sections rating is on 50 m sections only. The texture data is available only on SH roads. Other relevant data is Calibration sections: locations, where to find in RAMM, whether sterilised, sensitivity, comments on site SiteNotes: Log-on state of sites, any changes in location, observations on any work on site CAL_SEC_PAVE_DATA: structure of pavement CAL_SEC_PAVE_WIDTH: pavement width, number of lanes CAL_SEC_RAINFALL_DATA: rainfall data CAL_SEC_SNP_DATA: SNP data just one year but varies from site to site CAL_SEC_SURF_DATA: surface data CAL_SEC_TRAFFIC_DATA: AADT etc year varies from site to site GPS: GPS locations tmaintenancedetail: maintenance dates; important columns are Det_CompletionDate and Det_ActivityCode. Activity codes are explained in table IActivity. As this does not include major work such as resurfacing, the data has not been used. Because the rating is on 50 m sections, the 50 m data has been used. This helps to reduce correlation between adjacent sections. Rating does not distinguish between wheel paths so the lane values have been used for roughness, rut depth and texture (average of left and right wheel paths). There are a small number of duplicate entries in the other files. In most cases they are straight duplicates or the differences are negligible so only averaging is required (as was probably done in the first place). In 2011/12 on two sites the 10 m texture data appears to be repeat measurements with noticeable differences. In 2014/5, CAL35 there were some entries in SUBSECTION_IDs 7 and 8 rather than 1 and 2 in the 50 m data. It seemed best to ignore these and delete them from the combined record. (They changed the section in 2004/5 and this might reflect the change. What happened to the numbering in preceding years?) SUBSECTION_END is given for rating and roughness. For rating it is always 50 above SUBSECTION_START but for roughness there is one section where it is zero. This is probably an error and it seems best to ignore SUBSECTION_END. There are some values of SUBSECTION_START that differ from the usual values 108
109 Appendix B: Preliminary report on LTPP data analysis (0, 50, 100, ). These may be an error or measurements may have started at a different point in these sections. The differences have been ignored in this analysis. Calibration sections table: assume SECTION_ID labelled as h should really be CAL-59b. In the 50 m roughness data the value for 2002/03, CS-8b, I, 6, left wheel path, run 1 is obviously an error and has been deleted. The average value and lane values are also wrong and have been recalculated. Looking at the 10 m data one can see the preceding records are also affected so record 2002/03, CS-8b, I, 5 has been deleted. The 300 m dataset has presumably also been affected. In the 50 m texture data records 2014/15, CAL-34, D, 6, RWP and 2014/15, CAL-34, I, 2, LWP are obviously wrong due to 99s being entered in the 10 m data. These and the LANE values have been deleted. The 300 m data has presumably also been affected. The 10 m data has not been included. B2 Analysis B2.1 Histograms and identification of relevant road works and outliers This section studies the 50 m data and the lane values (average of left and right wheel paths) of rut depth, IRI roughness and texture. There are 160 sites, each with up to six 50 m sections in each of two directions. The following three graphs are of the untransformed values of the data. 109
 and B/S (chipseals) and possibly similar surfaces.")
110 Analysis and interpretation of New Zealand long-term pavement performance data Rutting and roughness show a skewness with a longer tail to the right. Texture is approximately symmetrical with an extra peak between the values of 1 and 1.5. This corresponds to VFILL (voidfill) and B/S (chipseals) and possibly similar surfaces. Only the SH sites have the texture measurements and none of them are densemix asphalt concrete (AC) or opengrade porus asphalt (OGPA). In the past, the square root transform for the rut depth and log transform for the roughness have proved useful for making the data closer to normally distributed. The following two histograms are of the transformed variables. 110
111 Appendix B: Preliminary report on LTPP data analysis The roughness is reasonably normal but the rut depth is still somewhat skewed. One could apply a stronger transformation such as cube root or logarithm. However stronger transformations have the effect of spreading out the smaller values of the rut depth and hence giving them too much emphasis in an analysis. It is therefore better to stay with the square root transformation. The next three graphs show the histograms giving the percentages of the points but with the histograms of the sterilised (blue) and normal (red) shown separately. 111
112 Analysis and interpretation of New Zealand long-term pavement performance data Rut depth in the sterilised sites tends to be a little lower and roughness may be slightly lower. The texture data looks quite different and this, presumably, is because there are a lot more VFILL and B/S surfaces in the sterilised group. Any analysis comparing surfaces in the two groups needs to take account of this. 112
113 Appendix B: Preliminary report on LTPP data analysis The next two histograms compare SH (blue) with TLA (red) roads. Since texture is measured only on SH roads it does not appear here. TLA roads tend to have lower rut depth and higher roughness. The following three graphs show box plots of the data divided into four groups: SH; sterilised; SH normal; TLA sterilised; and TLA normal. 113
114 Analysis and interpretation of New Zealand long-term pavement performance data The box shows the upper and lower quartiles, the line through the box shows the medians and the whiskers show the range of the data. Half the data lies within the box. 114
115 Appendix B: Preliminary report on LTPP data analysis These show roughly the same information as the histograms. You can see higher rut depths in the SH data, and slightly higher and more spread out roughness in the TLA data. The sterilised and normal data is much the same for rut depth and roughness. The texture data is available only available for the SH sites and wider spread for the sterilised sited is due to the extra VFILL and B/S surfaces. The following three graphs are for the differences between a measurement of one year and the next (ie this year s measurement minus last year s). Only the transformed data and data for adjacent years is included here. 115
116 Analysis and interpretation of New Zealand long-term pavement performance data The histogram program sets the width of the graph to run from the lowest value to the highest value, giving a very wide spread. Low values of rut and roughness differences or high values for texture differences may correspond to repair work. Low values of texture may correspond to a chipseal surface being replaced by a low texture surface as well as loss of texture due to wear. High values of rut or roughness differences and low values of texture differences may correspond to accelerated ageing, so they may be what we are looking for. But they may also correspond to specific types of road work or bad observations. The following graphs show the percentage histograms with sterilised (blue) and normal (red) shown separately. 116
117 Appendix B: Preliminary report on LTPP data analysis 117
118 Analysis and interpretation of New Zealand long-term pavement performance data The histograms for sterilised and normal sites are very similar but without much detail. The next two graphs are for SHs (blue) and TLA (red). 118
119 Appendix B: Preliminary report on LTPP data analysis They are quite similar. Box plots for this data do not work well because the bulk of the data occupies only a very small part of the overall range, and therefore are not shown. In the next three percentage histograms, sites (blue) that have had road works are separated out. Roadworks that are relevant for each of the measurements were identified from the raters site notes. 119
120 Analysis and interpretation of New Zealand long-term pavement performance data As one might expect the data for sites with road works is a lot more spread out. To identify the point at which the data for sites with works tends to dominate, the next three histograms show the count data rather than the percentage data, and the vertical scale is expanded so we see the very small values. 120
121 Appendix B: Preliminary report on LTPP data analysis 121
122 Analysis and interpretation of New Zealand long-term pavement performance data The data for sites with road works becomes dominant for rut depth when the transformed rut depth difference is less than -0.5; for rutting is less than -0.1 and for texture is greater than 0.4. If we are looking for accelerated ageing, we want to leave in outlying positive values for rut depth and roughness and the negative values for texture. But if we are interested in the decay rates during a period of linear decay then we also want to delete these outliers. The following values have been chosen: 0.8 for rut depth, 0.1 for roughness and -0.6 for texture. The following two graphs for rutting and roughness show the histograms where blue indicates sites with roadworks that have been judged relevant to texture but not to rutting or roughness that is, essentially reseals. The graphs with a substantial number of high positives of the differences are associated with reseals. Apparently reseals cause a temporary increase in rutting and roughness. 122
123 Appendix B: Preliminary report on LTPP data analysis We cannot tell for sure the direction of causality. Possibly, when the road is beginning to fail, but before an increase in rutting and roughness is apparent, a reseal is scheduled. Then the rutting and roughness become apparent at the same time the reseal is carried out. For these analyses, it is assumed the reseal causes the increase in rutting and roughness. Since these high values are not of interest in the present study it seems best to regard reseals as affecting all three of the variables not just texture. To simplify the analyses, rather than assuming some kinds of road work affect only one or two of rutting, roughness and texture, no distinction was made between types of road work and it was supposed all might be affected. B2.2 Selecting the data In the linear ageing data analyses the focus was on stretches of data with at least an eight-year range (ie eight points if data was collected every year) with no road works and with between year differences within the ranges identified in section B2.1. The same limit was also applied to the two-year difference. This was primarily to handle missing years but the analysis seemed to give slightly better results if the procedure was applied to all two-year differences. But when looking for accelerated ageing, only the observations that could be attributed to road works were deleted that is where we know there are road works or there are low outliers for rut depth and roughness and high outliers for texture. B2.3 Linear ageing A simple linear regression model was fitted to each of the 12 road segments at each site where we had at least an eight-year range and where there were no outliers in the differences and no relevant road works. For each of the three transformed variables graphs are provided of a: histogram of the residual standard deviation histogram of the slope (trend) histogram of the results of a change point test plot of slope versus the residual standard deviation. Correlation between successive observations (ie from one year to the next) has not been allowed for. Doing so is outside the scope of this study, at least in the present timeframe. Confidence intervals are not provided and results of the change point test need to be treated with care. The commentary follows the 12 graphs. 123

124 Analysis and interpretation of New Zealand long-term pavement performance data 124

125 Appendix B: Preliminary report on LTPP data analysis 125

126 Analysis and interpretation of New Zealand long-term pavement performance data 126
127 Appendix B: Preliminary report on LTPP data analysis The residual standard deviation shows the degree to which the transformed data follows a linear trend. The graphs show there is a lot of variability in the quality of the fit. The slope (trend) shows how much the variable changes, on average, each year. For rut depth the slope tends to be positive. Rut depth increases over time, but there is a lot of variability in the values. For roughness the values seem to be symmetrically distributed around zero, with perhaps a few more very high values. With texture the values are almost all negative. Texture is decreasing but with a very wide range of values. The change point test is from Davies (2002). This is used for detecting a change in slope in a linear regression. The graph is of -log 10 of the significance probability. If the test is just statistically significant at the 1% level this will return a value 2; if it is just statistically significant at the 0.1% level the value will be 3. Because correlation in the series has not been allowed for, the values are inflated. However, it will be worth looking at the series with the very large values in this graph to see if they show evidence of accelerated ageing. All the variables show some very large values. 127
128 Analysis and interpretation of New Zealand long-term pavement performance data The final graph in each sequence is a scatterplot of slope versus standard deviation. This is to see if the sequences with lower residual standard deviation have more consistent slopes. If they do, the points will tend to have an arrow head formation with the arrow pointing left. They do, but the effect is not strong. There is further analysis of the slopes in the next section. In an attempt to reduce the effect of sites when the trend is not well defined, sequences with the highest residual standard deviations have been removed. Rut depth sequences with standard deviations greater than 0.15 have been removed from the analyses in the next section. For roughness the value is 0.05 and for texture the value is 0.1. These values have been chosen where the points seem to be thinning out in the slope versus residual standard deviation scatterplots. B2.4 Linear ageing further analysis This section explores whether a relationship can be detected between the slopes found in the previous section and various variables available in the site data. All the analyses are graphical. It should be possible to do a formal statistical analysis, but since few strong results have been found here we should not expect much more from the formal analysis. The following graphs attempt to find relationships between the slope or, in some cases residual standard deviation, and site type sensitivity AADT SNP average rainfall. There is also a box plot of year-by-year difference versus site type using the edited data for comparison with the slope results. Notes on the predictor variables: Sensitivity: this is given as one of five categories: lim, low, medium, mod or high. The number of sites classified in each of these categories is given in the following table: Sensitivity Number of sites lim 22 low 45 medium 35 mod 4 high 45 The number of sites classified as mod is very small, and lim quite small and some of these categories should probably be amalgamated. AADT: The estimate was made on different years for different sites and it is not known if any attempt was made to adjust the AADTs to allow for this. SNP: The database generally gives a site value for one year. Average rainfall: This is an average over the period from a nearby weather station. 128
129 Appendix B: Preliminary report on LTPP data analysis The commentary comes after the following 21 graphs. 129
130 Analysis and interpretation of New Zealand long-term pavement performance data 130
131 Appendix B: Preliminary report on LTPP data analysis 131
132 Analysis and interpretation of New Zealand long-term pavement performance data 132
133 Appendix B: Preliminary report on LTPP data analysis 133
134 Analysis and interpretation of New Zealand long-term pavement performance data 134
135 Appendix B: Preliminary report on LTPP data analysis 135
136 Analysis and interpretation of New Zealand long-term pavement performance data Residual standard deviations are much the same for the different site types for rut depth but for roughness the TLA ones seem to be lower. Given the smaller sample sizes one probably cannot make too much meaning from the differences in the box plots for the texture data. The trends for the rut depth data are much stronger for the SH data than for the TLA data. This may be related to the previously noted higher values of rut depth in the TLA data. Roughness tends to be decreasing on the SH data and shows little trend in the TLA data. Texture is decreasing and the difference between the sterilised and normal sites may be due to the different surface types. The trend in rut depth is stronger as the site sensitivity gets higher. The values for lim are fairly meaningless because of the small sample size, but otherwise the trend is fairly consistent. The effect of sensitivity on roughness seems inconsistent and is probably small. The trend in the texture data may be stronger for the high sensitivity sites. In the three scatter plots of slope versus AADT, SNP and rainfall the SH points are the blue ones and the TLA points the red ones. Note that the AADT graphs have a log scale for AADT. There seems to be an increasing slope the graph of rut depth versus AADT, but there is nothing obvious in the others. The graphs of differences versus site type are for comparison with the graphs of slope versus site type. Given that we are looking at individual differences rather than slopes, which, in effect, represent an average of differences, the two sets of graphs are fairly consistent with each other. B3 Sites showing signs of accelerated ageing The results of three computer programs are described in this section. These look for different aspects of accelerated ageing. Graphs of data from the sites where accelerated ageing was detected are then presented. The actual 50 m section where accelerated ageing was detected is shown in colour (red for increasing direction, blue for decreasing) and the lines for other 50 m sections are greyed out. Note that the scales on both axes vary from graph to graph. Some of the greyed-out graphs also show jumps but these were not large enough to trigger the program. The shape of the points on the lines shows which 50 m segment is being plotted. Sequence number Shape 1 plus 2 times 3 asterisk 4 hollow square 5 filled square 6 hollow circle The program LTPP14 looks for sudden increases in the case of rutting and roughness and sudden decreases in texture. The jump sizes are the same as those described in section B2.1B2.2: 0.8 for rut depth, 0.1 for roughness and -0.6 for texture over one or two years. The program LTPP12 looks for sudden changes in trend the continuous two phase problem. It is more sensitive than the test for a sudden jump but is also more easily fooled. The sudden jump points found in 136
137 Appendix B: Preliminary report on LTPP data analysis the previous section should have been deleted from the data used here. As in the previous section we are picking up a lot of jumps in 2014 which may be bogus. The program LTPP11 fits slopes to all the lines and then selects sites where these slopes are inconsistent. Inconsistency may be because one or two lines are maverick or because there are lots of little differences. The interesting cases are where one or two lines are maverick. The program just says there are differences, it does not say which sites are different so there is no greying out of lines in the graphs. In all cases the choice of the critical points for deciding whether accelerated ageing is present is rather arbitrary since we have not been able to investigate a suitable statistical model. B3.1 Rutting LTPP14 looking for sudden increases in rutting. CAL-27B should possibly not be here the jump may to be due to a bad reading in Maybe another bogus jump due to a bad reading? 137
138 Analysis and interpretation of New Zealand long-term pavement performance data Not sure if these two jumps are real effects or due to realignment of the wheel tracks. There was no cracking reported. Maybe another bogus jump due to a bad reading? 138
139 Appendix B: Preliminary report on LTPP data analysis The raters do not provide any explanation for the jump in 2012/3. There was longitudinal or transverse cracking but not corresponding to the segment showing the strongest jump. Rutting program LTPP12 looking for sudden changes in trend. 139
140 Analysis and interpretation of New Zealand long-term pavement performance data Decreasing trend turning into increasing probably just settling down after earlier work not of interest. You cannot pinpoint when a change occurs but there does seem to be an increasing upward trend beyond about 2007 in the two blue lines and 2012 in the red line. There was longitudinal or transverse cracking towards the end of the period but not corresponding to the highlighted graphs. 140
141 Appendix B: Preliminary report on LTPP data analysis The raters reported the site in bad condition in 2014 and Here are the graphs of the cracking. 141
142 Analysis and interpretation of New Zealand long-term pavement performance data There is longitudinal or transverse cracking in most of the segments including the ones showing the change in slope. The raters reported the site in poor condition in 2013 and beyond. 142
143 Appendix B: Preliminary report on LTPP data analysis The highlighted lines do not stand out amongst the others. This looks like a site with increasing deterioration towards the end of the period. Here are the cracking graphs. 143
144 Analysis and interpretation of New Zealand long-term pavement performance data Here, the highlighted graphs do stand out; cracking seems to precede the increase in rutting. 144
145 Appendix B: Preliminary report on LTPP data analysis The raters report poor condition towards the end of the period graphed. There was a full rehabilitation in 2014/5 beyond the point where the data is being graphed. There is not much cracking between 2007 and 2010, when the accelerated ageing seems to be starting. Rutting program LTPP11 look for inconsistent slopes. The program does not pick out which slopes are inconsistent so none of the lines are greyed out. The cracking graphs are indicated where they look interesting. 145

146 Analysis and interpretation of New Zealand long-term pavement performance data Sequence 2 (times symbol) in the decreasing direction is ageing more rapidly and appears in the longitudinal/transverse cracking diagram. 146
147 Appendix B: Preliminary report on LTPP data analysis Several in the increasing lane show faster ageing one of them has longitudinal/transverse cracking. 147
148 Analysis and interpretation of New Zealand long-term pavement performance data Two segments in the increasing lane and one in the decreasing lane show faster ageing and these appear in the cracking diagrams. 148

149 Appendix B: Preliminary report on LTPP data analysis There is considerable cracking but it is difficult to see any relationship between it and the rutting. 149

150 Analysis and interpretation of New Zealand long-term pavement performance data It is not known why this one was selected. There was only slight cracking towards the end of the period. 150

151 Appendix B: Preliminary report on LTPP data analysis There is strong cracking but it is difficult to see any relationship. 151

152 Analysis and interpretation of New Zealand long-term pavement performance data The rapid increase in rutting is in the increasing lanes but the cracking is in the decreasing ones. 152
.")
153 Appendix B: Preliminary report on LTPP data analysis There is a lot of cracking but it is hard to see any relationship with the ageing. The fasted ageing segment (segment 6, open circle in the increasing direction shows the most alligator cracking). 153

154 Analysis and interpretation of New Zealand long-term pavement performance data The cracking is very light and does not seem to be related to the ageing. There is only light alligator cracking and moderate longitudinal/transverse cracking that is difficult to relate to the ageing. 154
155 Appendix B: Preliminary report on LTPP data analysis The cracking does not seem to have much relationship to the ageing. 155

156 Analysis and interpretation of New Zealand long-term pavement performance data The segment showing the most ageing also has the most longitudinal/transverse cracking. 156

157 Appendix B: Preliminary report on LTPP data analysis There was no cracking reported. The increasing lanes seem to be ageing more and they have more cracking. 157

158 Analysis and interpretation of New Zealand long-term pavement performance data 158
159 Appendix B: Preliminary report on LTPP data analysis The segment that is ageing fastest is cracking more. B3.2 Roughness Roughness LTPP14 looking for sudden jumps. 159
160 Analysis and interpretation of New Zealand long-term pavement performance data We do not know how much these two jumps are due to maintenance and to what extent they are associated with the cracking. 160
161 Appendix B: Preliminary report on LTPP data analysis The alligator cracking seems to be associated with the ageing 161
162 Analysis and interpretation of New Zealand long-term pavement performance data There is little comment to make on the relationships. 162
163 Appendix B: Preliminary report on LTPP data analysis The blue asterisk line probably should not be highlighted, but it is the most prominent one in the longitudinal/transverse line. 163
164 Analysis and interpretation of New Zealand long-term pavement performance data There is not much relationship with cracking here. 164
165 Appendix B: Preliminary report on LTPP data analysis Hard to say if there is a relationship here. 165
166 Analysis and interpretation of New Zealand long-term pavement performance data There may be a relationship with cracking here. 166
167 Appendix B: Preliminary report on LTPP data analysis There seems to be a relationship with alligator cracking. 167
168 Analysis and interpretation of New Zealand long-term pavement performance data Seems to be a relationship here. 168
169 Appendix B: Preliminary report on LTPP data analysis Seems to be a relationship here. 169
170 Analysis and interpretation of New Zealand long-term pavement performance data Minimal relationship here. 170
171 Appendix B: Preliminary report on LTPP data analysis Seems to be a relationship here. 171
172 Analysis and interpretation of New Zealand long-term pavement performance data Seems to be a relationship here. 172
173 Appendix B: Preliminary report on LTPP data analysis No relationship here and that jump at the beginning may be bogus anyway 173
174 Analysis and interpretation of New Zealand long-term pavement performance data There is a somewhat ambiguous relationship here. 174
175 Appendix B: Preliminary report on LTPP data analysis There is a possible relationship here. The blue asterisk line stops in the IRI graph probably because of a sudden drop indicating road work, but the graph still shows the cracking data which might be a little confusing. 175
176 Analysis and interpretation of New Zealand long-term pavement performance data There is a possible relationship with the cracking in the increasing lanes. 176
177 Appendix B: Preliminary report on LTPP data analysis 177
178 Analysis and interpretation of New Zealand long-term pavement performance data No cracking. 178
179 Appendix B: Preliminary report on LTPP data analysis No alligator cracking. 179
180 Analysis and interpretation of New Zealand long-term pavement performance data 180
181 Appendix B: Preliminary report on LTPP data analysis 181
182 Analysis and interpretation of New Zealand long-term pavement performance data 182
183 Appendix B: Preliminary report on LTPP data analysis 183
184 Analysis and interpretation of New Zealand long-term pavement performance data 184
185 Appendix B: Preliminary report on LTPP data analysis No alligator cracking. 185
186 Analysis and interpretation of New Zealand long-term pavement performance data 186
187 Appendix B: Preliminary report on LTPP data analysis No alligator cracking. 187
188 Analysis and interpretation of New Zealand long-term pavement performance data 188
189 Appendix B: Preliminary report on LTPP data analysis 189
190 Analysis and interpretation of New Zealand long-term pavement performance data 190
191 Appendix B: Preliminary report on LTPP data analysis No alligator cracking. 191
192 Analysis and interpretation of New Zealand long-term pavement performance data 192
193 Appendix B: Preliminary report on LTPP data analysis 193
194 Analysis and interpretation of New Zealand long-term pavement performance data 194
195 Appendix B: Preliminary report on LTPP data analysis 195
196 Analysis and interpretation of New Zealand long-term pavement performance data 196
197 Appendix B: Preliminary report on LTPP data analysis 197
198 Analysis and interpretation of New Zealand long-term pavement performance data 198
199 Appendix B: Preliminary report on LTPP data analysis 199
200 Analysis and interpretation of New Zealand long-term pavement performance data 200
201 Appendix B: Preliminary report on LTPP data analysis 201
202 Analysis and interpretation of New Zealand long-term pavement performance data Roughness LTPP12 202
203 Appendix B: Preliminary report on LTPP data analysis 203
204 Analysis and interpretation of New Zealand long-term pavement performance data 204
205 Appendix B: Preliminary report on LTPP data analysis 205
206 Analysis and interpretation of New Zealand long-term pavement performance data 206
207 Appendix B: Preliminary report on LTPP data analysis No cracking was reported. 207
208 Analysis and interpretation of New Zealand long-term pavement performance data 208
209 Appendix B: Preliminary report on LTPP data analysis 209
210 Analysis and interpretation of New Zealand long-term pavement performance data 210
211 Appendix B: Preliminary report on LTPP data analysis 211
212 Analysis and interpretation of New Zealand long-term pavement performance data 212
213 Appendix B: Preliminary report on LTPP data analysis Roughness LTPP11 213
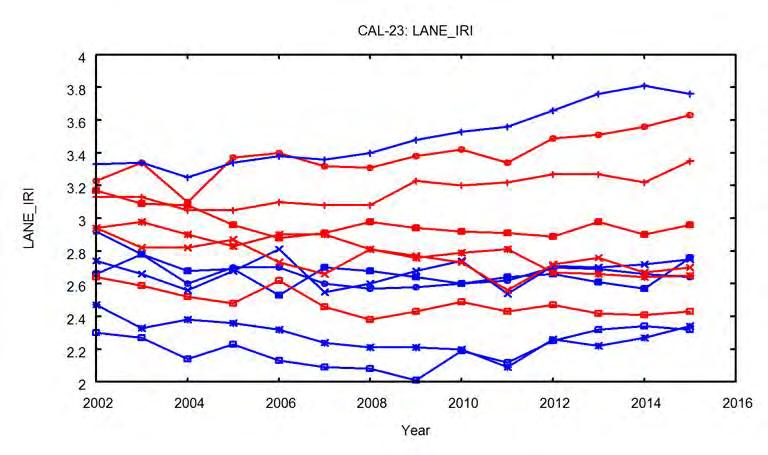

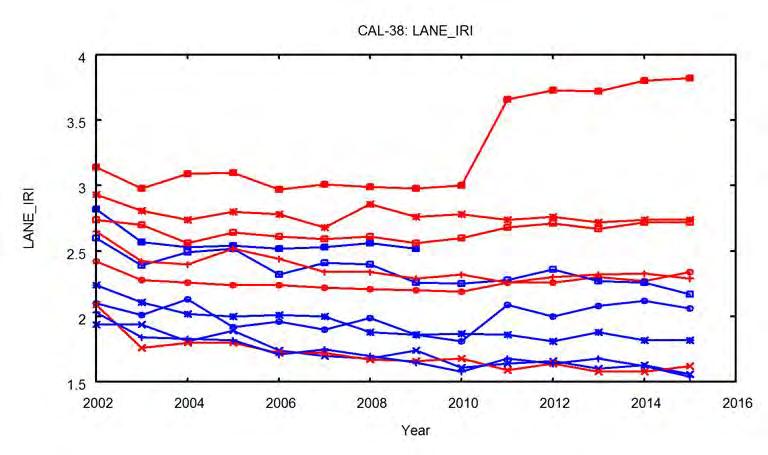
214 Analysis and interpretation of New Zealand long-term pavement performance data 214


215 Appendix B: Preliminary report on LTPP data analysis 215


216 Analysis and interpretation of New Zealand long-term pavement performance data 216

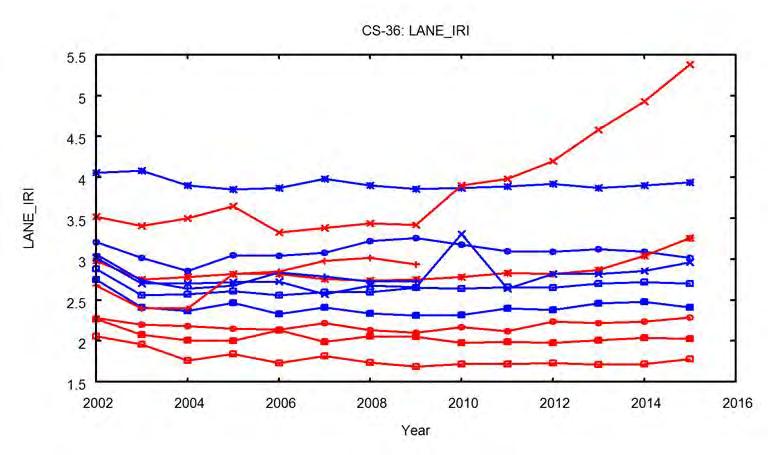
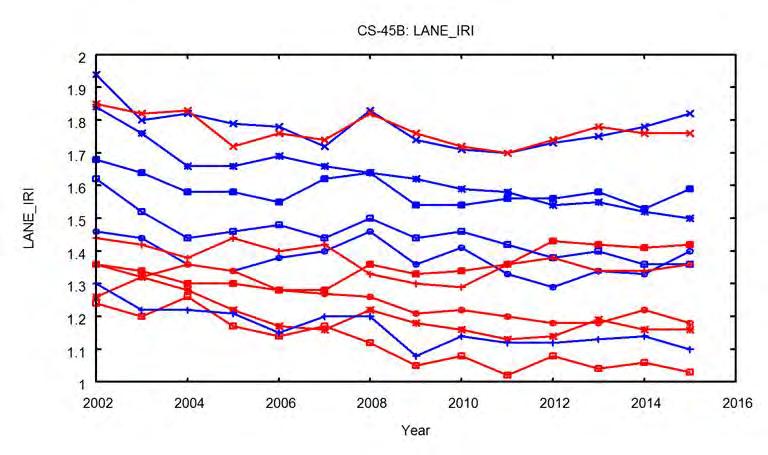
217 Appendix B: Preliminary report on LTPP data analysis 217
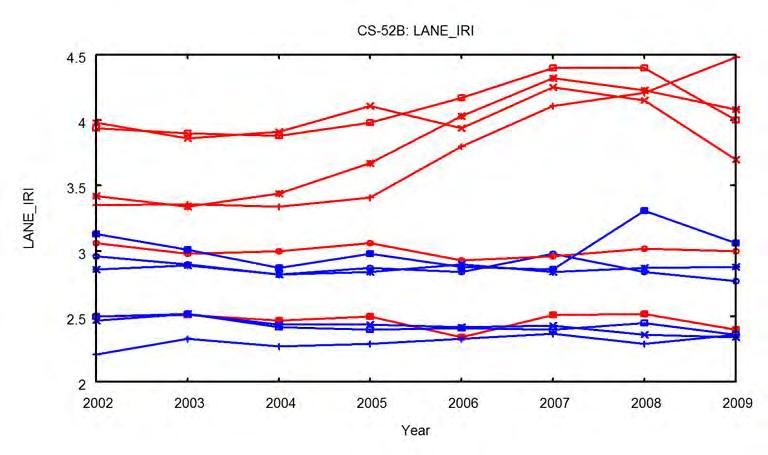
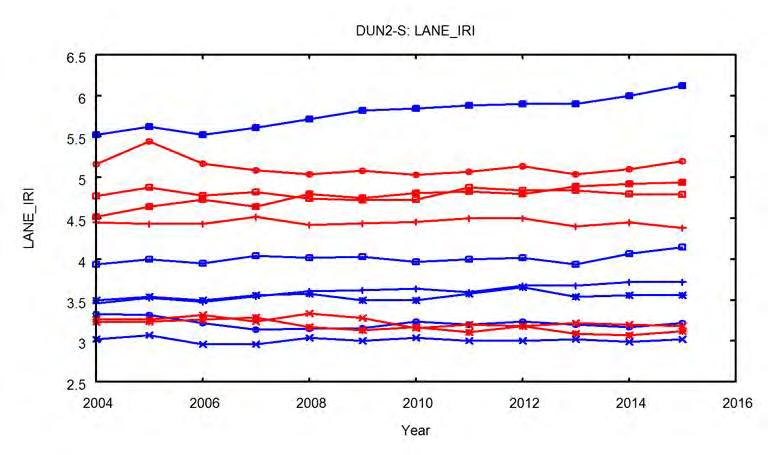
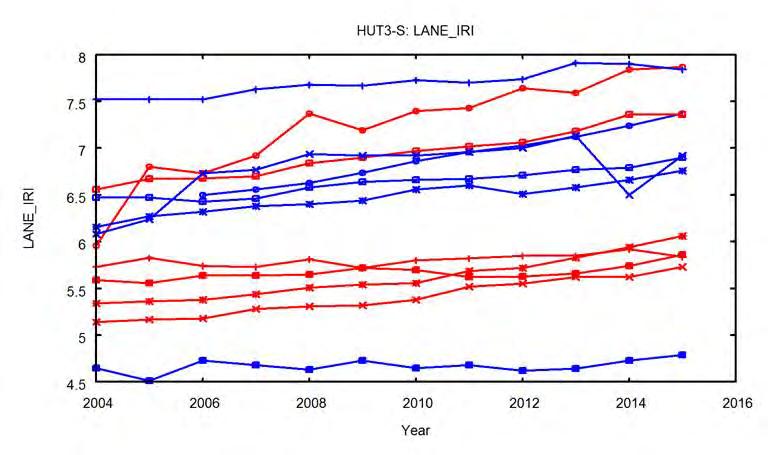
218 Analysis and interpretation of New Zealand long-term pavement performance data 218
219 Appendix B: Preliminary report on LTPP data analysis 219
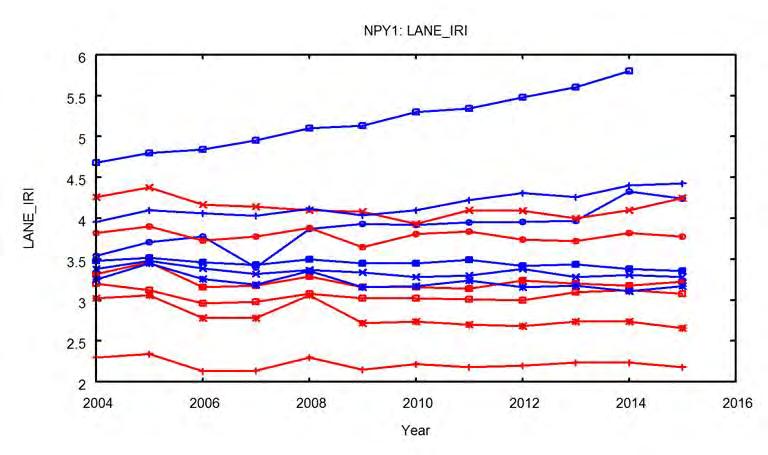
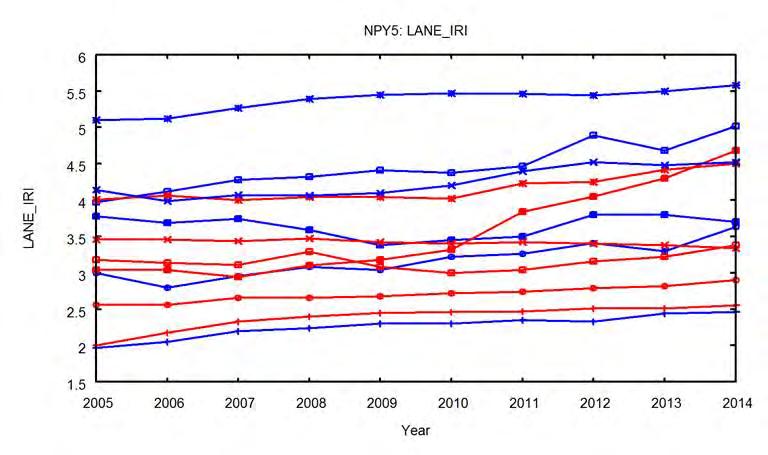
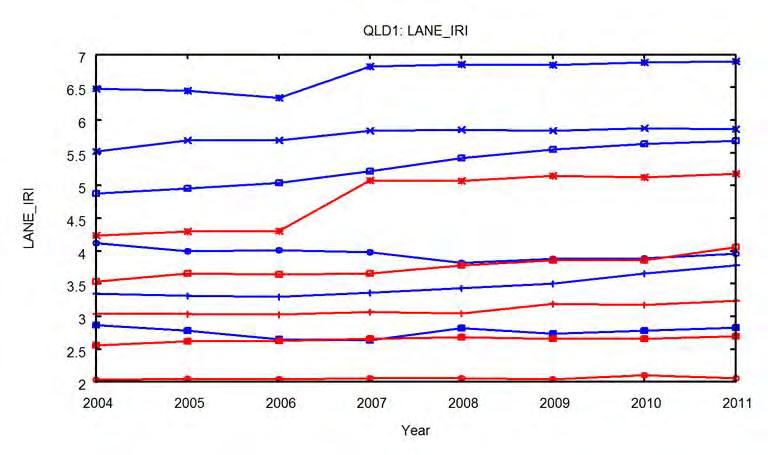
220 Analysis and interpretation of New Zealand long-term pavement performance data 220


221 Appendix B: Preliminary report on LTPP data analysis 221
222 Analysis and interpretation of New Zealand long-term pavement performance data 222


223 Appendix B: Preliminary report on LTPP data analysis 223
Impact of Existing Pavement on Jointed Plain Concrete Overlay Design and Performance
 Impact of Existing Pavement on Jointed Plain Concrete Overlay Design and Performance Michael I. Darter, Jag Mallela, and Leslie Titus-Glover 1 ABSTRACT Concrete overlays are increasingly being constructed
APPENDIX B DISTRESSES
 144 APPENDIX B DISTRESSES 145 INTRODUCTION The purpose of this appendix is not to provide a detailed discussion of the various descriptions and causes of distresses that may occur in any given pavement
Guide for Mechanistic-Empirical Design
 Copy No. Guide for Mechanistic-Empirical Design OF NEW AND REHABILITATED PAVEMENT STRUCTURES FINAL DOCUMENT APPENDIX BB: DESIGN RELIABILITY NCHRP Prepared for National Cooperative Highway Research Program
2002 Design Guide Preparing for Implementation
 2002 Preparing for Implementation By Monte Symons 2003 NCUAPG Annual Meeting Excerpts from the 2002 Guide Implementation Package 2002 Presentation Overview Need for NCHRP 1-37A - Status Guide Basics Asphalt
New Zealand Climate Update No 222, November 2017 Current climate November 2017
 New Zealand Climate Update No 222, November 2017 Current climate November 2017 November 2017 was characterised by higher than normal sea level pressure over New Zealand and the surrounding seas, particularly
TECHNICAL PAPER INVESTIGATION INTO THE VALIDATION OF THE SHELL FATIGUE TRANSFER FUNCTION
 Authors: TECHNICAL PAPER INVESTIGATION INTO THE VALIDATION OF THE SHELL FATIGUE TRANSFER FUNCTION Anthony Stubbs (Presenter), BE(Hons), Masters student, University of Canterbury. aps49@student.canterbury.ac.nz.
New Zealand Climate Update No 221, October 2017 Current climate October 2017
 New Zealand Climate Update No 221, October 2017 Current climate October 2017 October 2017 was characterised by higher than normal sea level pressure over New Zealand and the surrounding seas. This consistent
Flexible Pavement Design
 Flexible Pavement Design The Mechanistic-Empirical Way Presented by: Keith D. Herbold, P.E. 1 Presentation Outline What s new in flexible design Example of new design Differences Capabilities Tests and
Identifying pavement deterioration by enhancing the definition of road roughness December 2010
 Identifying pavement deterioration by enhancing the definition of road roughness December 2010 Doug Brown, Wei Liu and Theunis F P Henning NZ Transport Agency research report 430 ISBN 978-0-478-37142-0
MECHANISTIC-EMPIRICAL LOAD EQUIVALENCIES USING WEIGH IN MOTION
 MECHANISTIC-EMPIRICAL LOAD EQUIVALENCIES USING WEIGH IN MOTION Prepared By: Curtis Berthelot Ph.D., P.Eng. Dept. of Civil Engineering University of Saskatchewan Tanya Loewen Dept. of Civil Engineering
Implementation of M-E PDG in Kansas
 Implementation of M-E PDG in Kansas Mustaque Hossain, Ph.D.,P.E. Kansas State University 1 Projects related to the M-E Guide Implementation and Calibration Kansas HMA Fatigue and Stiffness Study Pool Fund
INTRODUCTION TO PAVEMENT STRUCTURES
 INTRODUCTION TO PAVEMENT STRUCTURES A pavement is a structure composed of structural elements, whose function is to protect the natural subgrade and to carry the traffic safety and economically. As a wheel
NIWA Outlook: April June 2019
 April June 2019 Issued: 28 March 2019 Hold mouse over links and press ctrl + left click to jump to the information you require: Outlook Summary Regional predictions for the next three months Northland,
LTPP InfoPave TM Extracting Information out of LTPP Data
 LTPP InfoPave TM Extracting Information out of LTPP Data Jane Jiang PE, LTPP Database Manager, FHWA Riaz Ahmad, President, iengineering Jerome Daleiden PE, Director Pavement Engineering, Fugro Jonathan
Rural Crash Prediction Models - The Next Generation
 Rural Crash Prediction Models - The Next Generation Dr Shane Turner, Technical Director (Transport), Beca Infrastructure Ltd BE (Hons), PhD, MIPENZ, CPEng, IntPE, shane.turner@beca.com Dr Alistair Smith,
Mechanistic Investigation of Granular Base and Subbase Materials A Saskatchewan Case Study
 Mechanistic Investigation of Granular Base and Subbase Materials A Saskatchewan Case Study Curtis Berthelot, P. Eng. Department of Civil and Geological Engineering University of Saskatchewan 57 Campus
Comparison of Ontario Pavement Designs Using the AASHTO 1993 Empirical Method and the Mechanistic-Empirical Pavement Design Guide Method
 Comparison of Ontario Pavement Designs Using the AASHTO 1993 Empirical Method and the Mechanistic-Empirical Pavement Design Guide Method by Jonathan Nathan Boone A thesis presented to the University of
TECHNICAL NOTE PREDICTION OF PAVEMENT SURFACE SKID RESISTANCE AND THE EFFECT OF SMALLER CHIP SIZE
 TECHNICAL NOTE PREDICTION OF PAVEMENT SURFACE SKID RESISTANCE AND THE EFFECT OF SMALLER CHIP SIZE Authors: Birendra Kumar, MEngSt(Transportation), Bachelor(Civil), GIPENZ Senior Transportation Engineer
Pavement Preservation Strategy Selection
 Pavement Preservation Strategy Selection By R. Gary Hicks and Ding Cheng California Pavement Preservation (CP2) Center California State University, Chico Prepared for NCPP Nashville TN August 2012 CP2C
City of Phoenix Pavement Management System. Ryan Stevens Civil Engineer III Street Transportation Department November 15, 2017
 City of Phoenix Pavement Management System Ryan Stevens Civil Engineer III Street Transportation Department November 15, 2017 Outline City of Phoenix Street Network Automated data collection Distresses
C-LTPP Surface Distress Variability Analysis
 Canadian Strategic Highway Research Program Programme stratégique de recherche routière du Canada C-LTPP Surface Distress Variability Analysis Prepared by: Stephen Goodman, B.A.Sc. C-SHRP Technology Transfer
ACKNOWLEDGMENT OF SPONSORSHIP
 ACKNOWLEDGMENT OF SPONSORSHIP This work was sponsored by the American Association of State Highway and Transportation Officials, in cooperation with the Federal Highway Administration, and was conducted
NIWA Outlook: March-May 2015
 March May 2015 Issued: 27 February 2015 Hold mouse over links and press ctrl + left click to jump to the information you require: Overview Regional predictions for the next three months: Northland, Auckland,
NIWA Outlook: October - December 2015
 October December 2015 Issued: 1 October 2015 Hold mouse over links and press ctrl + left click to jump to the information you require: Overview Regional predictions for the next three months: Northland,
Coastal Hazard and Climate-Change Risk Exposure in New Zealand: Comparing Regions and Urban Areas
 Presented at the FIG Working Week 2016, May 2-6, 2016 in Christchurch, New Zealand Coastal Hazard and Climate-Change Risk Exposure in New Zealand: Comparing Regions and Urban Areas Rob Bell, Ryan Paulik
NIWA Outlook: September October November 2013
 September-November 2013 Issued: 30 August 2013 Hold mouse over links and press ctrl + left click to jump to the information you require: Overview Regional predictions for the next three months: Northland,
Hydrological forecasting and decision making in Australia
 Hydrological forecasting and decision making in Australia Justin Robinson, Jeff Perkins and Bruce Quig Bureau of Meteorology, Australia The Bureau's Hydrological Forecasting Services Seasonal Forecasts
New Zealand Climate Update No 226, April 2018 Current climate March 2018
 New Zealand Climate Update No 226, April 2018 Current climate March 2018 March 2018 was characterised by significantly higher pressure than normal to the east of New Zealand. This pressure pattern, in
Submitted for Presentation at the 2006 TRB Annual Meeting of the Transportation Research Board
 Investigation of Hot Mix Asphalt Surfaced Pavements Skid Resistance in Maryland State Highway Network System By Wenbing Song, Xin Chen, Timothy Smith, and Adel Hedfi Wenbing Song MDSHA, Office of Material
METHODS FOR EVALUATING RESILIENT MODULI OF PAVING MATERIALS
 Project Number ST 2019-7 Summary Report METHODS FOR EVALUATING RESILIENT MODULI OF PAVING MATERIALS sponsored by The State of Alabama Highway Department Montgomery, Alabama Frazier Parker, Jr. David J.
Development and Validation of Mechanistic-Empirical Design Method for Permeable Interlocking Concrete Pavement
 Development and Validation of Mechanistic-Empirical Design Method for Permeable Interlocking Concrete Pavement Hui Li, David Jones, Rongzong Wu, and John Harvey University of California Pavement Research
Guide for Mechanistic-Empirical Design
 Copy No. Guide for Mechanistic-Empirical Design OF NEW AND REHABILITATED PAVEMENT STRUCTURES FINAL DOCUMENT APPENDIX EE-1: INPUT DATA FOR THE CALIBRATION AND VALIDATION OF THE DESIGN GUIDE FOR NEW CONSTRUCTED
Flexural Life of Unbound Granular Pavements with Chip Seal Surfacings
 Flexural Life of Unbound Granular Pavements with Chip Seal Surfacings Austroads Design Checks vertical strains at top of subgrade, ie primary function is to limit rutting BUT - trigger for rehabilitation
What is on the Horizon in HMA. John D AngeloD Federal Highway Administration
 What is on the Horizon in HMA John D AngeloD Federal Highway Administration Are they all the same? Internal Angle of Gyration Internal Angle of Gyration Development of the Dynamic Angle Validator (DAV)
Revised Test Plan for Seasonal Monitoring Program using HWD Testing
 April 2005 Revised Test Plan for Seasonal Monitoring Program using HWD Testing Partnered Pavement Research Prepared for: California Department of Transportation Prepared by: University of California Berkeley
Percentage of normal rainfall for April 2018 Departure from average air temperature for April 2018
 New Zealand Climate Update No 227, May 2018 Current climate April 2018 Overall, April 2018 was characterised by lower pressure than normal over and to the southeast of New Zealand. Unlike the first three
ALACPA-ICAO Seminar on PMS. Lima Peru, November 2003
 ALACPA-ICAO Seminar on PMS Lima Peru, 19-22 November 2003 Airport Pavements FWD/HWD Testing and Evaluation By: Frank B. Holt Vice President Dynatest International A/S Dynamic Testing The method of FWD/HWD
Effect of Climate Environmental Conditions on Pavement Overlay Thickness
 Proceedings of the International Conference on Civil, Structural and Transportation Engineering Ottawa, Ontario, Canada, May 4 5, 215 Paper No. 327 Effect of Climate Environmental Conditions on Pavement
Analysis of Rutting and Roughness Distresses in PCC Pavements Overlaid with Asphalt Concrete
 Analysis of Rutting and Roughness Distresses in PCC Pavements Overlaid with Asphalt Concrete Kavussi, A. Associate Professor, Tarbiat Modares University, Tehran, Iran SYNOPSIS Concrete slab pavements overlaid
Evaluation of Rutting Depth in Flexible Pavements by Using Finite Element Analysis and Local Empirical Model
 American Journal of Engineering and Applied Sciences, 2012, 5 (2), 163-169 ISSN: 1941-7020 2014 Abed and Al-Azzawi, This open access article is distributed under a Creative Commons Attribution (CC-BY)
NATIONAL IRRIGATED LAND SPATIAL DATASET Summary of methodology, assumptions and results.
 NATIONAL IRRIGATED LAND SPATIAL DATASET Summary of methodology, assumptions and results. PREPARED FOR Ministry for the Environment C17042 28/07/2017 PREPARED BY Andrew Dark Birendra K.C. Ayaka Kashima
Mechanistic-Empirical Pavement Design Guide: A User s Perspective. Brian D. Prowell, Ph.D., P.E.
 Mechanistic-Empirical Pavement Design Guide: A User s Perspective Brian D. Prowell, Ph.D., P.E. Empirical Approach Based on results of experiments or experience Scientific basis not established AASHTO
ENHANCING ROAD SAFETY MANAGEMENT WITH GIS MAPPING AND GEOSPATIAL DATABASE
 Abstract ENHANCING ROAD SAFETY MANAGEMENT WITH GIS MAPPING AND GEOSPATIAL DATABASE Dr Wei Liu GHD Reliable and accurate data are needed in each stage of road safety management in order to correctly identify
Accelerated Loading Evaluation of Base & Sub-base Layers
 Accelerated Loading Evaluation of Base & Sub-base Layers Zhong Wu, Ph.D., P.E. Louisiana Transportation Research Center (LTRC) April 2006 What is Accelerated Loading? Accelerated loading refers to Accelerated
Waterside Place, South Gate, Tyger Waterfront, Carl Cronje Drive, Bellville, 7530 South Africa
 1 THE USE OF MEASURED PAVEMENT PERFORMANCE INDICATORS AND TRAFFIC IN DETERMINING OPTIMUM MAINTENANCE ACTIONS FOR A TOLL ROAD IN SOUTH AFRICA AND COMPARISON WITH HDM-4 PERFORMANCE PREDICTIONS Jurgens Weidemann
Geospatial Big Data Analytics for Road Network Safety Management
 Proceedings of the 2018 World Transport Convention Beijing, China, June 18-21, 2018 Geospatial Big Data Analytics for Road Network Safety Management ABSTRACT Wei Liu GHD Level 1, 103 Tristram Street, Hamilton,
Mechanistic Pavement Design
 Seminar on Pavement Design System and Pavement Performance Models Reykjavik, 22. 23. March, 2007 Mechanistic Pavement Design A Road to Enhanced Understanding of Pavement Performance Sigurdur Erlingsson
Increased Liquefaction Vulnerability (ILV) Engineering Assessment
 Engineering Assessment") Increased Liquefaction Vulnerability (ILV) Engineering Assessment Increased Liquefaction Vulnerability (ILV) Engineering Assessment 2 Property details Property address 17 SAMPLE STREET, SAMPLEVILLE, CHRISTCHURCH,
Increased Liquefaction Vulnerability (ILV) Engineering Assessment Increased Liquefaction Vulnerability (ILV) Engineering Assessment 2 Property details Property address 17 SAMPLE STREET, SAMPLEVILLE, CHRISTCHURCH,
2015 North Dakota Asphalt Conference
 2015 North Dakota Asphalt Conference NDDOT Implementation of AASHTO Flexible Pavement Design Part I ADT & ESALs Nickie Reis, P&AM Part II Structural Numbers Tom Bold, M&R March 31 - April 1, 2015 Part
Mechanistic-Empirical Pavement Design Guide Distress Models
 Mechanistic-Empirical Pavement Design Guide Distress Models By: Mohamed El-Basyouny Arizona State University Pavement Performance Models Symposium Laramie - Wyoming June 23, 2006 Outline Analysis Methodology
THE BEHAVIOUR OF FLEXIBLE PAVEMENT BY NONLINEAR FINITE ELEMENT METHOD
 International Journal of Latest Research in Science and Technology Volume 3, Issue 1: Page No.537,January-February 214 http://www.mnkjournals.com/ijlrst.htm ISSN (Online):2278299 THE BEHAVIOUR OF FLEXIBLE
The purpose of this report is to recommend a Geographic Information System (GIS) Strategy for the Town of Richmond Hill.
 Strategy for the Town of Richmond Hill.") Staff Report for Committee of the Whole Meeting Department: Division: Subject: Office of the Chief Administrative Officer Strategic Initiatives SRCAO.18.12 GIS Strategy Purpose: The purpose of this report
Staff Report for Committee of the Whole Meeting Department: Division: Subject: Office of the Chief Administrative Officer Strategic Initiatives SRCAO.18.12 GIS Strategy Purpose: The purpose of this report
Modulus of Rubblized Concrete from Surface Wave Testing
 from Surface Wave Testing Nenad Gucunski Center for Advanced Infrastructure and Transportation (CAIT) Infrastructure Condition Monitoring Program (ICMP) 84 th Annual NESMEA Conference October 8, 2008 Route
SENSITIVITY ANALYSIS OF THE VESYS PROGRAM TO PREDICT CRITICAL PAVEMENT RESPONSES FOR RUTTING AND FATIGUE PERFORMANCES OF PAVEMENT INFRASTRUCTURES
 SENSITIVITY ANALYSIS OF THE VESYS PROGRAM TO PREDICT CRITICAL PAVEMENT RESPONSES FOR RUTTING AND FATIGUE PERFORMANCES OF PAVEMENT INFRASTRUCTURES Ghazi G. Al-Khateeb 1, Raghu Satyanarayana 2, and Katherine
New Zealand s Next Top Model: integrating tsunami modelling into land use planning
 New Zealand s Next Top Model: integrating tsunami modelling into land use planning Wendy Saunders (MZNZPI), Gegar Prasetya, Graham Leonard GNS Science, Lower Hutt, w.saunders@gns.cri.nz In April 2011 a
Prediction of average annual surface temperature for both flexible and rigid pavements
 JOURNAL OF MATERIALS AND ENGINEERING STRUCTURES 4 (2017) 259 267 259 Research Paper Prediction of average annual surface temperature for both flexible and rigid pavements Karthikeyan Loganathan, Mena I
Analysis of Unbound Granular Pavement Deterioration for Use in Asset Management Modelling A Literature Review
 Analysis of Unbound Granular Pavement Deterioration for Use in Asset Management Modelling A Literature Review Author : Co-Author : Phil Hunt (Department of Main Roads) Dr Jonathan Bunker (Queensland University
GeoShanghai 2010 International Conference Paving Materials and Pavement Analysis
 Particle Shape, Type and Amount of Fines, and Moisture Affecting Resilient Modulus Behavior of Unbound Aggregates Debakanta Mishra 1, Erol Tutumluer 2, M. ASCE, Yuanjie Xiao 3 1 Graduate Research Assistant,
Evaluating Structural Performance of Base/Subbase Materials at the Louisiana Accelerated Pavement Research Facility
 Evaluating Structural Performance of Base/Subbase Materials at the Louisiana Accelerated Pavement Research Facility Zhong Wu, Ph.D., P.E. Louisiana Transportation Research Center 2007 Transportation Engineering
Large Scale Mapping Policy for the Province of Nova Scotia
 Large Scale Mapping Policy for the Province of Nova Scotia December, 2005 Version 1.0 TABLE OF CONTENTS PAGE BACKGROUND...3 POLICY...5 Policy 1.0 Large Scale Mapping Program...5 Policy 2.0 Service Offering...5
7.34 Spartina (Spartina anglica)
") 7.34 Spartina (Spartina anglica) Why is it a threat? Spartina is a sward forming grass that originates from the United Kingdom. It grows from underground rhizomes. The rhizomes break off and establish
7.34 Spartina (Spartina anglica) Why is it a threat? Spartina is a sward forming grass that originates from the United Kingdom. It grows from underground rhizomes. The rhizomes break off and establish
ICSM delivering benefits through collaboration
 ICSM delivering benefits through collaboration Russell Priebbenow Chair and Queensland Member Australia and New Zealand s Intergovernmental Committee on Surveying and Mapping Overview Who is ICSM & why
The Governance of Land Use
 The planning system Levels of government and their responsibilities The Governance of Land Use Country fact sheet Germany Germany is a federal country with four levels of government. Below the national
Jordan's Strategic Research Agenda in cultural heritage
 Jordan's Strategic Research Agenda in cultural heritage Analysis of main results Alessandra Gandini Amman, Jordan 3 rd November 2013 Main objectives The work performed had the main objective of giving
Topographic Strategy National Topographic Office March 2015
 www.linz.govt.nz Topographic Strategy National Topographic Office March 2015 >> Foreword Topographic information is vital to understanding our country and its assets, and for supporting economic development.
SURFACE MODULI DETERMINED WITH THE FALLING WEIGHT DEFLECTOMETER USED AS BENCHMARKING TOOL
 SURFACE MODULI DETERMINED WITH THE FALLING WEIGHT DEFLECTOMETER USED AS BENCHMARKING TOOL E Horak* Professor and Head of Department of Civil and Biosystems Engineering, University of Pretoria, e-mail:
Permeable Pavement Overview
 Permeable Pavement Overview Meeting of CCPIC City of Berkeley City of Davis City of Martinez 6 April 2018 Permeable Pavement Team and Sponsors Contributors to published work presented: David Jones, Hui
Nevels, et al 1 KAY COUNTY SHALE SUBGRADE STABILIZATION REVISITED
 Nevels, et al 1 Title: KAY COUNTY SHALE SUBGRADE STABILIZATION REVISITED Submitted: 15 November 2012 (revised) Word Count: 3581 + 7 figures = 5331 Name: Affiliation: Email: Joakim G. Laguros, Ph.D., P.E.
Impact of Water on the Structural Performance of Pavements
 Impact of Water on the Structural Performance of Pavements S. Erlingsson Highway Engineering, VTI The Swedish National Road and Transport Research Institute, Linköping, Sweden & Faculty of Civil and Environmental
Floods 2014 a wake up call to natural hazards
 Floods 2014 a wake up call to natural hazards Floods affected 119 municipalities (out of 165) 22% of total population affected by floods More than 30 municipalities sustained extensive damage 57 lives
Scotland s centre of expertise for waters. Dynamic Coast - National Coastal Change Assessment: Defence Asset Database
 Scotland s centre of expertise for waters Dynamic Coast - National Coastal Change Assessment: Defence Asset Database Scotland s centre of expertise for waters Published by CREW Scotland s Centre of Expertise
Analysis of Non-Linear Dynamic Behaviours in Asphalt Concrete Pavements Under Temperature Variations
 ENOC 2017, June 25 30, 2017, Budapest, Hungary Analysis of Non-Linear Dynamic Behaviours in Asphalt Concrete Pavements Under Temperature Variations Amal Abdelaziz *, Chun-Hsing Ho *, and Junyi Shan * *
Adaptability of AASHTO Provisional Standards for Condition Surveys for Roughness and Faulting in Kansas
 Adaptability of AASHTO Provisional Standards for Condition Surveys for Roughness and Faulting in Kansas Kamesh Vedula Department of Civil Engineering Kansas State University Manhattan, KS 66506 kamesh@ksu.edu
Network Level Analysis. Validation of Performance Models
 2 Network Level Analysis Validation of Performance Models Report title: Nordic Cooperation Program Validation of Performance Models Project: Pavement Performance Models 2 (NordFoU - PPM2) Participating
Key Indicators for Territorial Cohesion & Spatial Planning Stakeholder Workshop - Project Update. 13 th December 2012 San Sebastián, Basque Country
 Key Indicators for Territorial Cohesion & Spatial Planning Stakeholder Workshop - Project Update 13 th December 2012 San Sebastián, Basque Country Key Aims Explore the use of territorial data in developing
2002 Pavement Design
 2002 Pavement Design Federal Highway Administration June 2001 Thomas P. Harman Asphalt Team Leader Predicting Pavement Performance Pavements are designed to fail But how do they perform? Defining Performance
THE SEVILLE STRATEGY ON BIOSPHERE RESERVES
 THE SEVILLE STRATEGY ON BIOSPHERE RESERVES 1 VISION FOR BIOSPHERE RESERVES IN THE 21 ST CENTURY The international Seville Conference on Biosphere Reserves, organised by UNESCO, adopted a two-pronged approach,
ACET 406 Mid-Term Exam B
 ACET 406 Mid-Term Exam B SUBJECT: ACET 406, INSTRUCTOR: Dr Antonis Michael, DATE: 24/11/09 INSTRUCTIONS You are required to answer all of the following questions within the specified time (90 minutes).you
Sensitivity Analysis Of Aashto's 2002 Flexible And Rigid Pavement Design Methods
 University of Central Florida Electronic Theses and Dissertations Masters Thesis (Open Access) Sensitivity Analysis Of Aashto's 2002 Flexible And Rigid Pavement Design Methods 2006 Sanjay Shahji University
5.2. Historic heritage. Photo: Vaughan Homestead, Long Bay Regional Park, Auckland. (Source: ARC). Historic heritage
. Historic heritage") Photo: Vaughan Homestead, Long Bay Regional Park, Auckland. (Source: ARC). 274 Hazards and heritage Contents 5.2 Introduction 276 monitoring programmes 276 The state of historic heritage 277 Heritage items
Photo: Vaughan Homestead, Long Bay Regional Park, Auckland. (Source: ARC). 274 Hazards and heritage Contents 5.2 Introduction 276 monitoring programmes 276 The state of historic heritage 277 Heritage items
Accident benefits of sealing unsealed roads February Land Transport New Zealand Research Report 314
 Accident benefits of sealing unsealed roads February 2007 Land Transport New Zealand Research Report 314 Accident benefits of sealing unsealed roads J. Minchington and P. Bradshaw Beca Infrastructure
AASHTO Rigid Pavement Design
 AASHTO Rigid Pavement Design Dr. Antonis Michael Frederick University Notes Courtesy of Dr. Christos Drakos University of Florida 1. Introduction Empirical design based on the AASHO road test: Over 200
Council Roadside Reserves Environmental Grants
 Roadside Reserves Environmental Grants The Roadside Reserves (CRR) project is a three year project funded by the NSW Environmental Trust and managed by Local Government NSW to help councils towards best
Coefficient of Thermal Expansion of Concrete Pavements
 Coefficient of Thermal Expansion of Concrete Pavements Erwin Kohler Ramon Alvarado David Jones University of California Pavement Research Center TRB Annual Meeting, Washington D.C. January 24 th, 2007
2008 SEAUPG CONFERENCE-BIRMINGHAM, ALABAMA
 Introduction Overview M E E Design Inputs MEPDG Where are we now MEPDG Inputs, Outputs, and Sensitivity Southeast Asphalt User Producer Group Bill Vavrik 19 November 2008 2 Implementation Timeframe DARWin
Indicator: Proportion of the rural population who live within 2 km of an all-season road
 Goal: 9 Build resilient infrastructure, promote inclusive and sustainable industrialization and foster innovation Target: 9.1 Develop quality, reliable, sustainable and resilient infrastructure, including
The National Spatial Strategy
 Purpose of this Consultation Paper This paper seeks the views of a wide range of bodies, interests and members of the public on the issues which the National Spatial Strategy should address. These views
Evaluating Structural Performance of Base/Subbase Materials at the Louisiana Accelerated Pavement Research Facility
 Evaluating Structural Performance of Base/Subbase Materials at the Louisiana Accelerated Pavement Research Facility Zhong Wu, Ph.D., P.E. Zhongjie Zhang, Bill King Louay Mohammad Outline Background Objectives
Base Design Considerations for Jointed Concrete. Dan G. Zollinger, Ph.D., P.E. Texas A&M University, College Station, TX, USA
 Base Design Considerations for Jointed Concrete Dan G. Zollinger, Ph.D., P.E. Texas A&M University, College Station, TX, USA Discussion What is Erosion Effects on Performance Erosion Testing Use of Erosion
Non-Destructive Pavement Evaluation to Assess Flood Damage in The City of Calgary
 Non-Destructive Pavement Evaluation to Assess Flood Damage in The City of Calgary Venkat Lakkavalli P. Eng., M. Sc. The City of Calgary Alberta, Canada Presented at TAC 2014, Montreal (Karim, M et al.
NEW ZEALAND WEATHER. BRIEF REVIEW OF THE WEATHER WINTER 1991 (Fig. 1) CONTRASTING RAINFALL, COLD IN THE SOUTH-WEST OF THE SOUTH ISLAND
 CONTRASTING RAINFALL, COLD IN THE SOUTH-WEST OF THE SOUTH ISLAND") Weather and Climate (1992) 12: 47-52 47 NEW ZEALAND WEATHER BRIEF REVIEW OF THE WEATHER (Fig. 1) CONTRASTING RAINFALL, COLD IN THE SOUTH-WEST OF THE SOUTH ISLAND An El Nino event (negative phase of the
Weather and Climate (1992) 12: 47-52 47 NEW ZEALAND WEATHER BRIEF REVIEW OF THE WEATHER (Fig. 1) CONTRASTING RAINFALL, COLD IN THE SOUTH-WEST OF THE SOUTH ISLAND An El Nino event (negative phase of the
15 March 2010 Re: Draft Native Vegetation of the Sydney Metropolitan Catchment Management Authority Area GIS layers and explanatory reports
 SYDNEY COASTAL COUNCILS GROUP Inc. C/- City of Sydney Council Level 14, 456 Kent Street GPO Box 1591, SYDNEY NSW 2001 Phone: (02) 9246 7791 Facsimile: (02) 9265 9660 Email: info@sydneycoastalcouncils.com.au
Oregon Department of Transportation. Geographic Information Systems Strategic Plan
 Oregon Department of Transportation Geographic Information Systems Strategic Plan Adopted May, 2000 By the GIS Steering Committee Last printed 10/2/2012 4:20:00 PM Page Geographic Information Systems Strategic
Tourism. April State Planning Policy state interest guideline. Department of Infrastructure, Local Government and Planning
 Department of Infrastructure, Local Government and Planning State Planning Policy state interest guideline Tourism April 2016 Great state. Great opportunity. Preface Using this state interest guideline
Falling Weight Deflectometer vs Laboratory Determined Resilient Modulus (Slab Curling Study)
") FWD-RU6701 Falling Weight Deflectometer vs Laboratory Determined Resilient Modulus (Slab Curling Study) FINAL REPORT December 2005 Submitted by Dr. Sameh Zaghloul, P.E., P.Eng.* Managing Senior Principal
FWD-RU6701 Falling Weight Deflectometer vs Laboratory Determined Resilient Modulus (Slab Curling Study) FINAL REPORT December 2005 Submitted by Dr. Sameh Zaghloul, P.E., P.Eng.* Managing Senior Principal
Puerto Rico Transportation Asset Management Plan
 Puerto Rico Transportation Asset Management Plan PR-TAMP April 12, 2018 April 12, 2018 The Project Team Gordon Proctor Shobna Varma Jose Carro, P.E. Zaida Rico, P.E., Ph.D. gordon@proctorassociates.com
The Role of Subbase Support in Concrete Pavement Sustainability
 The Role of Subbase Support in Concrete Pavement Sustainability TxDOT Project 6037 - Alternatives to Asphalt Concrete Pavement Subbases for Concrete Pavement Youn su Jung Dan Zollinger Andrew Wimsatt Wednesday,
Pavement Design Where are We? By Dr. Mofreh F. Saleh
 Pavement Design Where are We? By Dr. Mofreh F. Saleh Pavement Design Where are We?? State-of-Practice State-of-the-Art Empirical Mechanistic- Empirical Mechanistic Actual Current Practice?? Inputs Structure
NCHRP. Project No. NCHRP 9-44 A. Validating an Endurance Limit for Hot-Mix Asphalt (HMA) Pavements: Laboratory Experiment and Algorithm Development
 Pavements: Laboratory Experiment and Algorithm Development") NCHRP Project No. NCHRP 9-44 A Validating an Endurance Limit for Hot-Mix Asphalt (HMA) Pavements: Laboratory Experiment and Algorithm Development Appendix 1 Integrated Predictive Model for Healing and
NCHRP Project No. NCHRP 9-44 A Validating an Endurance Limit for Hot-Mix Asphalt (HMA) Pavements: Laboratory Experiment and Algorithm Development Appendix 1 Integrated Predictive Model for Healing and
Lecture 3: Stresses in Rigid Pavements
 Lecture 3: Stresses in Rigid Pavements Nature of Responses under Flexible and Rigid Plates Flexible plate: Uniform Contact Pressure Variable Deflection Profile Flexible Plate Rigid Plate plate: Non-Uniform