Predicting the frequency of dangerously warm epilimnion temperatures of Stoney Creek s Off-Channel Pond.
|
|
|
- Samson Webster
- 6 years ago
- Views:
Transcription
1 Predicting the frequency of dangerously warm epilimnion temperatures of Stoney Creek s Off-Channel Pond. An ecological restoration post project appraisal of the Stoney Creek off-channel habitat improvement project. Melvin Pan Environmental Science 205 Methods in Environmental Science Professor Thomas Rodengen Teaching Assistant Catherine Parsons Abstract Among the many water quality indices which influence fish distribution, water temperature is one of the most important parameter (Richter and Kolmes, 2005). In lake and coastal ecosystems, diurnal temperature cycles are regularly disturbed by seasonal and anthropogenic changes in the environment (Konecki et. al, 1995). Seasonal changes such as strong summer solar radiation can cause lakes, streams, and ponds to heat up; anthropogenic changes such as deforestation of streamside vegetation can as well increase radiation incident on surface waters (Konecki et. al, 1995). One of the many concerns associated with hotter summer weather is thermal stratification, a phenomenon which is known to negatively affect species assemblages at the population level (Carter, 2005). In order to protect native fish species from thermal stratification in Stoney Creek s pond, this appraisal s purpose is to predict summer epilimnion temperatures so that mitigative actions may be taken beforehand. From 6 hours of semi-continuous air-water temperature monitoring in the off-channel pond, three linear equations representing the air-water interface were derived from simple regression. The three models were based off of three individual sites along the pond, each varying in shade and depth. Results indicated that shade and depth are negligible variables when considering surface water temperatures, thus two of the three models were disregarded. Model 1 found that air temperatures of 27.3 o C or higher above the off-channel pond correlate with dangerously warm pond temperatures (in respect to salmonids). 7 years of climate records were then sifted through to find the proportion of summer days exceeding the predicted critical air temperatures. Climate records expect 2.6 days in June, 6.1 days in July, and 6.3 days in August to have dangerously warm water temperatures (Glenayre Climate Station ).
2 Introduction During the hotter months of the year when solar irradiance is strongest lakes and ponds are prone to thermal stratification (Konecki et. al, 1995). At peak daytime temperatures, the occurrence of this phenomenon can cause a collection of adverse effects to fish, including weight loss, disease, and competitive displacement by other species (Richter and Kolmes, 1995; Carter 2005). Water temperature as well serves to affect species assemblages at the population level: severely limited fish distribution and mass mortality are common symptoms of seasonal and anthropogenic changes in water temperature (Richter and Kolmes 2005; Mathews and Berg 1992). In extreme cases, pond night-time temperatures can fail to drop below the temperature threshold, and thermal stratification can occur throughout the night (Nickelson et. a, 1992). The lentic ecosystem of this appraisal s concern is an off-channel pond located in Stoney Creek, Burnaby, British Columbia. From field inspections, two sites along Stoney Creek s pond were observed to be abundantly populated with fries. Because it has been shown that Coho fry have a strong affinity for off-channel habitats during the spring, it was presumed that the observed fish were mainly Coho (Lestelle, 2007). There have as well been many other studies documenting the significant benefits which Coho salmons gain from inhabiting off-channel habitats. Swales and Levings (1989) compared population densities and growth rates between Coho salmons living in ponds and in rivers; they discovered a considerably larger population of Cohos with higher growth rates in ponds relative to the river-cohos. Research in Coho body morphology as well presents evidence of adaptations to slow water velocity habitats (Lestelle 2007). The off-channel pond located in Stoney Creek holds an ecological importance to the native salmonids; predicting and maintaining temperature levels will be a crucial task.

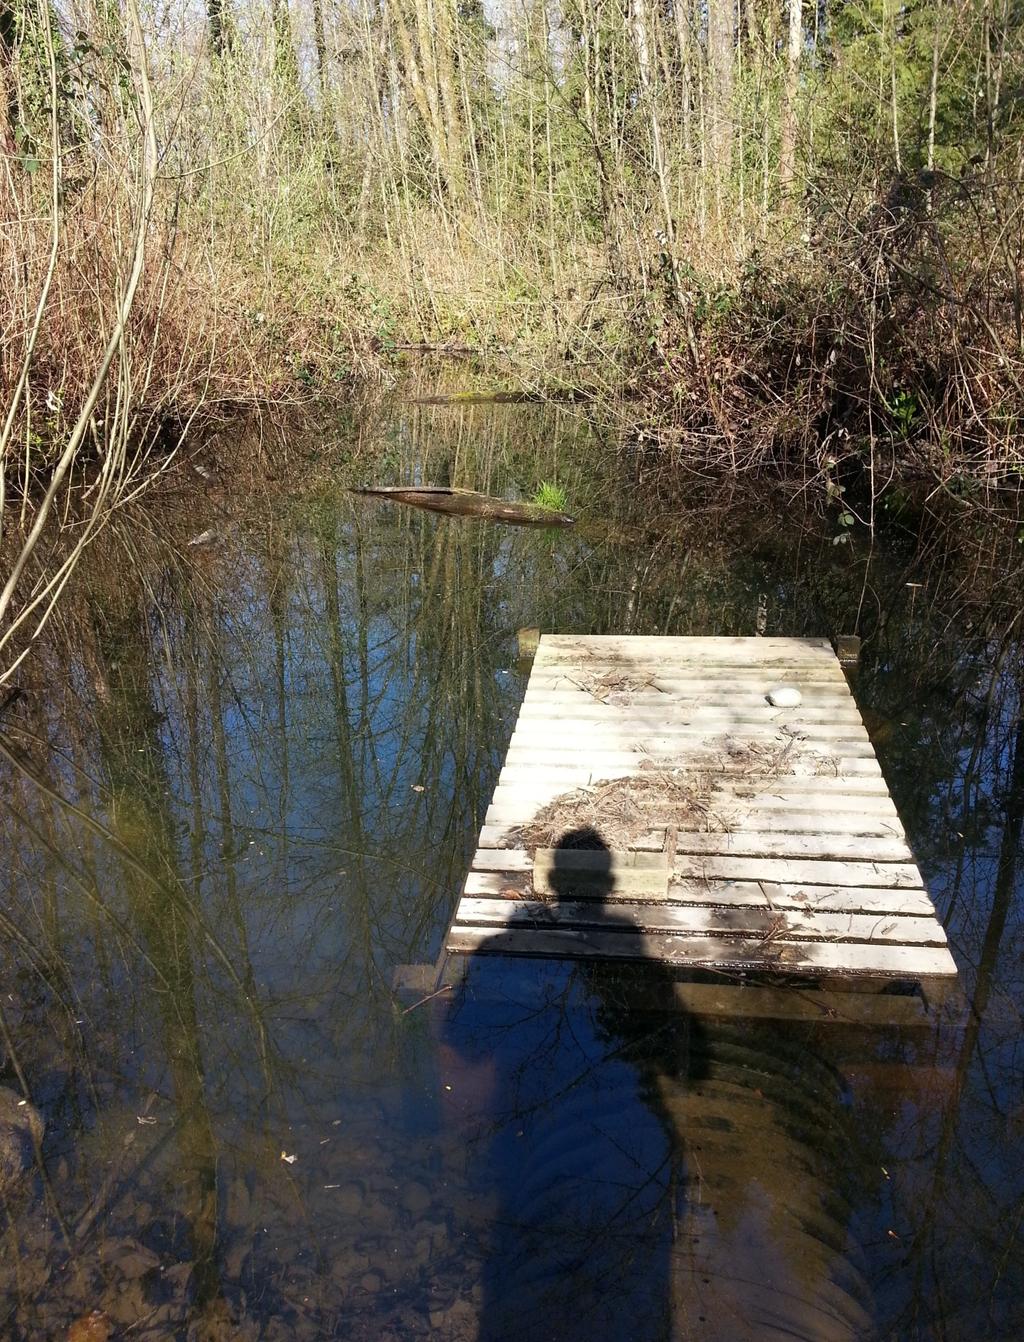
3 Methods With the presumption that surface water temperature may be dependent on shade and depth, the heterogeneous spatial distribution of these two variables along the pond presented an issue. The original plan was to create only one equation, derived from only one set of air-water temperature values, collected at an arbitrary site along the pond. But because the water temperature may be affected by the site s shade and depth, the full applicability of the model came into question. For example (as seen in figure 1), if data was collected at a site with deep waters and plentiful shade, would it be applicable to regions of the pond which are shallow and void of shade? To counter this problem, three equations based off of data from three different sites (each varying in depth and shade) were created. Figure 1: Rhetorical question: If the water temperature collected at site B was used in a simple regression, creating equation C, would this equation be able to predict the air-water interface over site A? Note that both site A and B differs in shade and depth, two variables which may possible affect the water temperature data.
4 On March 31 st, 42 water temperature readings were collected at sites A, B, and C, with 15 near-simultaneous air temperatures taken at Site A. The approximate locations of the three sites can be seen in figure 1. The peak air temperature was 22 o C at 4pm, the sky had no cloud cover, and the wind was calm. Temperature was taken with a Fisherbrand Red-Spirit No-Roll Laboratory thermometer: every reading was purposely shaded from solar radiation. Any abrupt changes in temperature were double and triple checked for possible mistakes. After data compilation, temperature change over time graphs and scatter plots with trend lines were created for each site. Because water temperature rises and falls in a cyclic fashion, falling data points were not used in the scatter plots. A regression was then performed on Microsoft Excel on the data collected from each of the three sites. This led to the creation of three individual linear equation models. All work done can be seen on Appendix A. Site A is shallow and largely void of shade (10am-4pm), site B is deep and moderately shaded (12:30-1:45pm), and site C is shallow, but enjoys a lot of shade (from 12:30-3:00pm). Each of the three sites varies in depth and shade. Here, another assumption was taken: if equation 1 is based off of data collected from site A with features X, Y, Z, then the same equation can be applied to all regions of the pond with similar X, Y, Z characteristics, thus improving the model s applicability. By this assumption, Model 1 represents shallow regions of the pond with no shade, model 2 represents deeper regions of the pond with moderate shade, and model 3 represents shallow regions of the pond with plentiful shade. But as we will see in the conclusion, model 2 and 3 will be disregarded. The photos for the three sites are in Appendix A; it will be helpful to look at sites B and C.

5 Figure 2: rough locations of the three sites. The yellow lines are the outline of the off-channel pond; the blue line is the outline of the stream s location.
6 Site A: Change in Air and Water temperature Temperature (degrees Celsius) Air Water 0 10:00 11:00 12:00 13:00 14:00 15:00 16:00 Time Figure 3: Change in air and water temperature in the pond from 10am to 4pm in Site A. Note the strange anomaly at 2:30pm and onwards, where water temperature decreases despite rising air temperatures. The data points behind this anomaly will be eliminated due to being falling points. Site A: Air and Water Temperature Air Temperature (Celsius) y = x R² = Water Temperature (Celsius) Figure 4: Scatter plot between water temperature and air temperature for site A. 9 data sets were used.
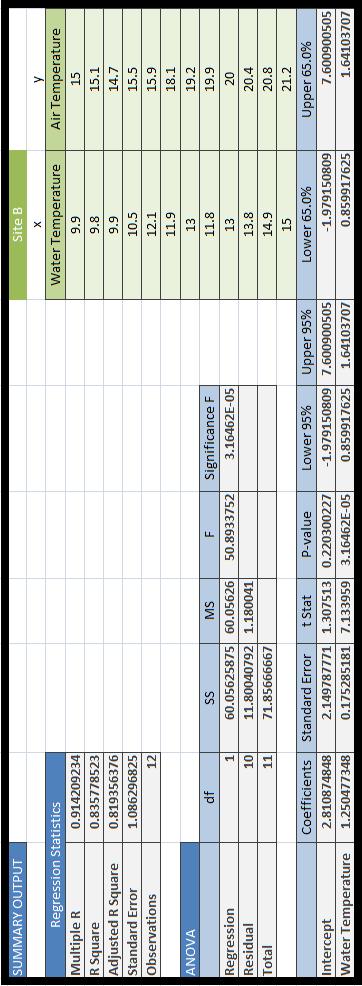
7 Site B: Change in Air and Water temperature Temperature (degrees Celsius) Air Water 0 10:00 11:00 12:00 13:00 14:00 15:00 16:00 Time Figure 5: Change in air and water temperature in the pond from 10am to 4pm in Site B. Note the fall points after 3:15pm. These 3 data points will be eliminated. Site B: Air and Water Temperature Air Temperature (Celsius) y = x R² = Water Temperature (Celsius) Figure 6: Scatter plot between water temperature and air temperature for site B. 9 data sets were used.
8 Site C: Change in Air and Water temperature Temperature (degrees Celsius) Air Water 0 11:30 12:30 13:30 14:30 15:30 Time Figure 7: Change in air and water temperature in the pond from 11:30am to 4pm in Site C. A total of 12 water temperature observations, and all will be used (including the spike seen at 3:30pm). Site C: Air and Water Temperature Air Temperature (Celsius) y = x R² = Water Temperature (Celsius) Figure 8: Scatter plot between water temperature and air temperature for site C. 12 observations were used.
9 Results and Discussion Three regression models have each been derived from the three sites: Site A: T air = 1.26 *T water (standard error.78 o C) (1) Site B: T air = 1.25*T water (standard error 1.1 o C) (2) Site C: T air = 1.76*T water (standard error 1.4 o C) (3) On Microsoft excel, these three models were derived from performing a regression on the collected air-water temperature data. The work done can be seen in appendix A; each site s linear equation as well coincides with their respective scatter plot s trendline. Each of the equations work by inputting an arbitrary water temperature (T water ), and the output would be the corresponding pond s air temperature (T air ). For example, if the temperature of water is 10 o C at any time of the day, the air temperature over site A would be 1.26* =14.2 o C.Although problems such as thermal stratification cannot be neglected, this appraisal s ultimate concern is the native salmonids which inhabit the pond. From exhaustive studies in both laboratory and field conditions, the Washington Department of Ecology (2002) concluded that temperatures of o C present detrimental harm to Coho growth (as cited in Carter, 2005). Inserting T water as 21.0 o C in the equations yields three predicted daily critical maximum air temperatures (table 1). To account for standard error, each critical air temperature will then be adjusted to the lower value. It should also be noted that the U.S. Environmental Protection Agency cited in 1999 that temperatures from o C completely eliminates salmonids from a location (as cited in Carter 2005). Hence, T water as 21.0 o C is a reasonable input for both Coho and other salmonids. Site A ( o C) Site B ( o C) Site C ( o C) T water = 21.0 o C
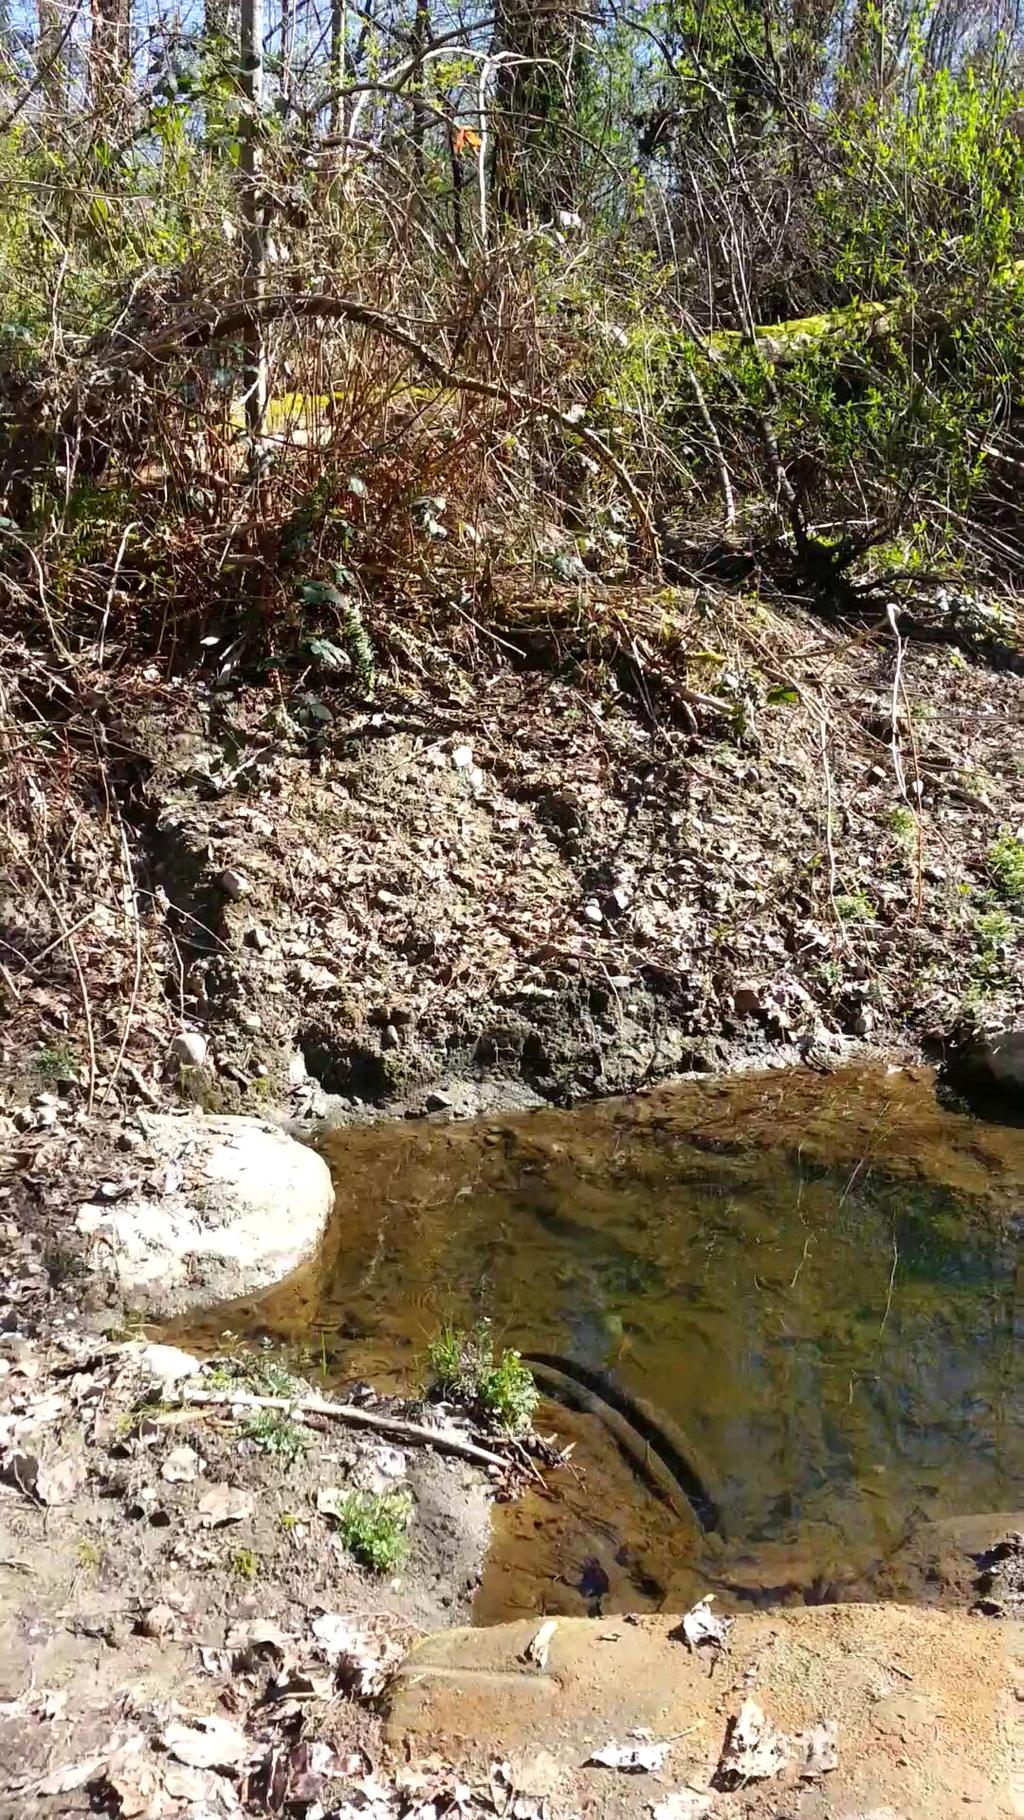
10 Adjustment for Std. Error Table 1. Predicted daily maximum air temperatures which are expected to cause acute effects to Coho salmons. Prior to performing fieldwork, it was presumed that surface water temperature was dependent on shade and depth. And because of this, 3 different models - each based off of data retrieved from sites varying in these 2 attributes - were created. But despite the initial presumption, equations 1 and 2 calculated very similar outputs ( = -0.7 o C difference). Because the equations were each based off of sites vastly differing in depth and shade but still gave similar outputs, these two variables are negligible. Upon this finding, the peculiar 8.8 o C difference in predicted critical air temperatures between equation 1 and 3 may not be due to depth or shade. Because site C requires a much higher critical air temperature, this implies that it can remain colder than sites A and B. Site C s strong resilience to increases in temperature may be due to pond structure and not shade/depth. Referring to figure 8, the onset of shade starts at 12:30pm in site C, however, prior to the onset, site C already shows much colder temperatures than sites A and B. Furthermore, because site C is connected to a miniature tributary (which acts to transport water from the pond to the stream), water that flows through site C has to first flow through the beaver box. As seen from figure 8, a cross-sectional view of sites B, C, and the beaver box, there is a tube which may act as a cooling mechanism. Since solar radiation cannot penetrate the tube, the tube s water is most likely much cooler than sites B and C s water. And because the miniature stream transports very little water, site C should have a relatively long residence time; this implies that water flowing through the cooling tube may also have a long residence time. This extended length of time spent inside the tube may mean a longer

11 cooling period for the water inside the tube, and a stronger cooling effect. (Note that this is just speculation, and there is no direct evidence of this process). Upon this finding, it can be said that equation 1 represents most of the pond s surface waters, regardless of depth and shade; and equation 3 represents only site C. Figure 9: contrasting the different temperatures between site C to sites A and B. As seen from the square box above 12:00pm, site C is already much cooler than site B and C prior to the onset of shade. Note that the Y axis does not start from 0, and has been altered to underline the difference between the three data sets. Figure 10: cross sectional view of sites B, C, and the beaver box. The arrow indicates the direction of water. The water in the cooling tube is protected from solar radiation, and stays cold. When this cold water moves from the tube to site C, it acts to cool down site C s water as well.
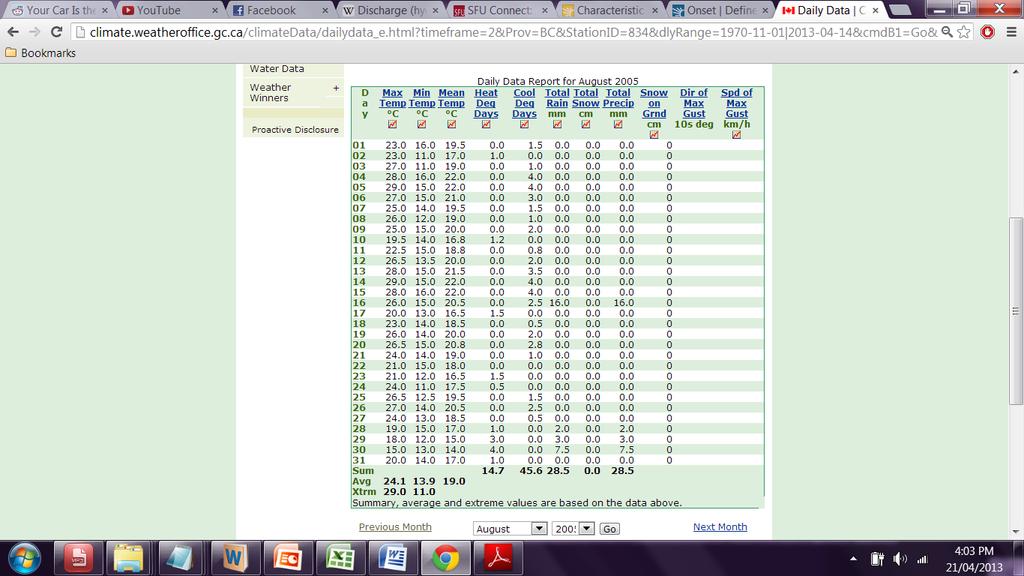
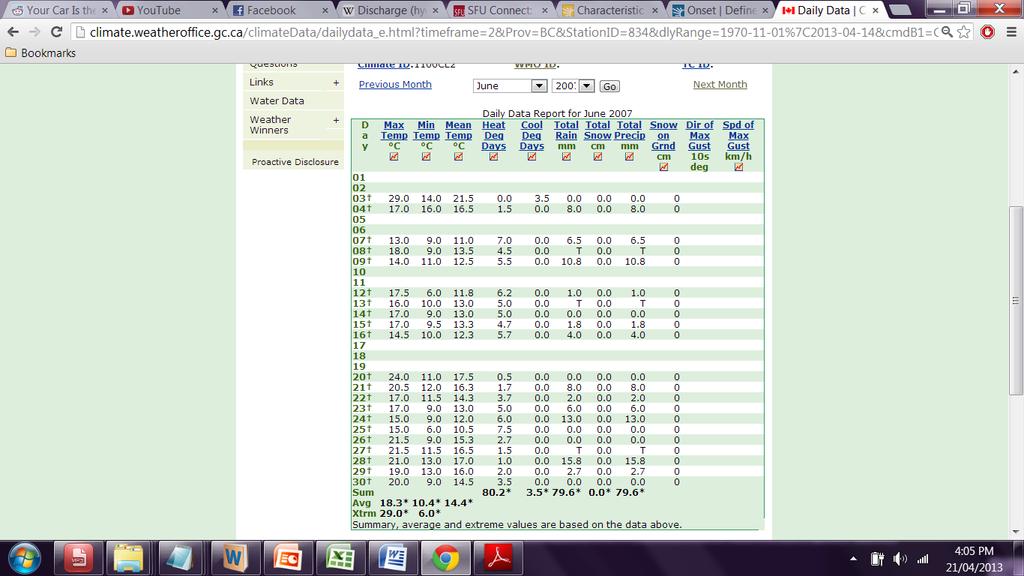
12 Using equation 1 as the official model of the off-channel pond, 7 years of climate records ( ) were then sifted through to find the average proportion of days exceeding its predicted critical air temperature. June July August Site A and B: Days with T air 27.0 o C 2.6 days/month 6.1 days/month 6.3 days/month Table 2: (Adapted from Glenayre Climate station ). The proportion of days in which maximum daily T air Note that 27.0 was used instead of 27.3 for simplicity. Lowering Sites A and B s temperature threshold also accounts for days with maximum temperatures near the critical value. Work shown in Appendix C, and climate records in appendix D. Therefore, the critical air temperature of Stoney Creek s off-channel pond is 27.3 o C, and 2.6 days in June, 6.1 days in July, and 6.3 days in August are expected to have water temperatures near or exceeding sub-lethal (21.0 o C) levels in respect to salmonids. Conclusion Due to Site C s relative location to the beaver box and cooling tube, equation 3 may only represent site C, and not any other region of the pond. Despite the narrow applicability of this model, it is still extremely useful. In figure 8, it can be shown that the beaver box s tube is the reason for site C s resilience to temperature increases. Since results have established that depth and shade are negligible factors when considering surface water temperatures, mitigative actions should not focus on increasing depth or pond-side vegetation/canopy cover. Instead, equation 3 proves the usefulness of tubes as cooling mechanisms; and placing more tubes in the pond to act as thermal refuges may work very well. In fact, fish species are known to regulate their body temperature via behavioural means (Richter and Kolmes, 2005). Although this appraisal has found issues with the pond s summer temperature levels,
13 some assumptions and counter arguments should be taken into consideration before carrying out any mitigative actions: Model Assumption / Counter Arguments This regression model assumes that the ratio and difference between the air-water interface remains constant between spring and summer. Justification Although it may be hard to justify this assumption, factors which influence the airwater interface were taken into consideration. Temperature relies primarily on solar radiation, cloud cover, and wind speed (Ahrens, 2012). Environments which encourage solar radiation are clear skies and calm winds (Ahrens, 2012). To assume this constant ratio of the air-water interface, data was collected on a day resembling a hot summer day. On March 31 st, the day of data collection: the maximum temperature reached was a hot 22.0 o C, the sky was completely clear of any clouds, and the wind was calm (throughout the day). The only possible difference is the increased solar elevation of the sun (Ahrens, 2012). Because data collection was carried out on a day with an environment resembling a hot summer day, this assumption is reasonable. As mentioned in the results, equation 1 can be used to represent the entire pond, but only 9 data sets were used. Furthermore, data collection only reached up to a maximum air temperature of 22.0 o C, yet the predicted critical air temperature value is 27.0 o C. This 5 o C difference may be crucial. Although the data size is small, figure 2 (a scatter plot for equation 1) shows a high R 2 value of.89, and low spread across the trendline. The small data size is partially offset by the low variance and high R 2 value. For the 5.0 o C difference, there will always be confounding factors. It would have been better to have more data sets, but cold weather did not permit. The goal in mind when collecting data was to have a day as similar as possible to a hot summer day where thermal stratification may occur; data coming from cold cloudy days may taint data from hot warm days.
14 Although the abstract and introduction talks about thermal stratification, this model cannot quantitatively measure the thermal vertical profile of the pond s water column. The hypolimnion may still be capable of acting as a cool thermal refuge from the hot epilimnion temperatures. Furthermore, intraspecific competition for these refuges may not be a big deal, since salmonids are able to group up in schools (Observations from fieldwork). From observations, the pond s depth ranges at a mean of metres. This shallow depth may not be enough to allow a cool hypolimnion. The best solution to this counter argument would be to test for hypolimnion temperatures in a deep region of the pond (easily done so with competent equipment, and the beaver box allows one to not disrupt the vertical profile) Regarding this method of predicting temperatures (simple linear regression method), has it been done before? Past investigations concerning the air-water interface in inland streams have already been pioneered (Mohensi et al. 1998, 1999, 2002) 3. In fact, as a response to climate change, researchers such as Pilgrim et al (1995) and Stefan and Preud homme (1993) have already delved into the world of air-water temperature relationships using the linear equation : T water (t) = A*T air (t) + B This equation was originally proposed by Smith in 1981 (as cited in Pilgrim et. al, 1995). There are still many contrasts between this paper and Pilgrim s et. al s (1995). Data input size, variables, and methods are exceptionally different. But the idea of using linear regression with air and water temperatures is not new.
15 References Cited C. D. Ahrens, Meteorology Today, An Introduction to Weather, Climate, and The Environment. Brooks/Cole, Cengage Learning. 67 pp. A. Richter and S. A. Kolmes, Maximum temperature limits for Chinook, Coho, and Chum Salmon, and Steelhead trout in the Pacific Northwest. Reviews in Fisheries Science 13: J. T. Konecki, C. A. Woody, and T. P. Quinn, Critical thermal maxima of Coho salmon (Oncorhynchus kisutch) fry under field and laboratory acclimation regimes. Canadian Journal of Zoology 73: L. C. Lestelle, Coho salmon (Oncorhynchus kisutch) Life History Patterns in the Pacific Northwest and California. U.S. Bureau of Reclamation. K. Carter, The effects of temperature on Steelhead trout, Coho salmon, and Chinook salmon biology and function by life stage. California Regional Water Quality Control Board. K.R. Mathews and N. H. Berg, Rainbow trout responses to water temperature and dissolved oxygen stress in two southern California stream pools. Journal of Fish Biology 50: 50- J. M. Pilgrim, X. Fang, and H. G. Stefan, Correlations of Minnesota Stream Water Temperatures with Air Temperatures. National Agricultural Water Quality Laboratory. S. Swales and C.D. Levings, Role of off-channel ponds in the life cycle of coho salmon (Oncorhynchus kisutch) and other juvenile salmonids in the Coldwater River, British Columbia. Can.). Canadian Journal of Fish Aquatic Science 46: T. E. Nickelson, B. Rodgers, S.L. Johnson, and M.F. Solamzi, Seasonal changes in habitat use by juvenile coho salmon (Oncorhynchus kisutch) in Oregon coastal streams. Canadian Journal of Fish Aquatic Science 49:

16 Appendix A: Site A
17 Site B
18 Site C

19 Appendix B: Site A Site B

20 Site C (EXPLANATION BELOW)

21 For each data set, the x values were water temperature, and y values air temperature. The resulting equation from each of the three sites resulted in: Air temperature = Water temperature*coefficient_watertempreature+intercept Conversely, this equation can be seen as the trendlines in each of the scatterplots presented in the Methods section. Appendix C: Site A & B: total number of days which equate or exceed 27.0 o C were summed, divided by total daily temperature readings. The bottom row represents the mean amount of days per month which exceed 27.0 o C. For Site C, no days were found with temperatures exceeding 36.0 o C in records from and
22 Appendix D: climate records from Glenayre weather station, Burnaby, BC.
23
24
25
26
27
28
29
30
31
32
33
34
35
36
37
38
39
40
41
42
Lower South Fork McKenzie River Floodplain Enhancement Project
 Lower South Fork McKenzie River Floodplain Enhancement Project McKenzie River Ranger District Willamette National Forest Project Location The project is located in the South Fork McKenzie River Watershed,
Mobrand to Jones and Stokes. Sustainable Fisheries Management Use of EDT
 Sustainable Fisheries Management Use of EDT Ecosystem Diagnosis and Treatment EDT EDT designed to provide a practical, science-based approach for developing and implementing watershed plans. Provides decision
Impact of Climate Change on Chinook Salmon
 Region: Western Coastlines Grade Level(s): 5-8 Impact of Climate Change on Chinook Salmon Time Required: 2-3 class periods Focus Question(s): How will long term climate changes impact northwest Pacific
The Effects of Geomorphology and Watershed Land Use on Spawning Habitat
 The Effects of Geomorphology and Watershed Land Use on Spawning Habitat By Evan Buckland INTRODUCTION The distribution and frequency of large geomorphic features in a watershed govern where suitable spawning
Thermal / Solar. When air is warmed it... Rises. Solar Energy. Evaporation. Condensation Forms Clouds
 Thermal / Solar Light from the Sun is transformed into what type of energy when it hits Earth's surface? Rises When air is warmed it... Solar Energy Water moves through the water cycle using what type
2015: A YEAR IN REVIEW F.S. ANSLOW
 2015: A YEAR IN REVIEW F.S. ANSLOW 1 INTRODUCTION Recently, three of the major centres for global climate monitoring determined with high confidence that 2015 was the warmest year on record, globally.
2nd Grade. Earth's Water. Slide 1 / 111 Slide 2 / 111. Slide 3 / 111. Slide 4 / 111. Slide 5 (Answer) / 111. Slide 5 / 111. Role of Water on Earth
 / 111. Slide 5 / 111. Role of Water on Earth") Slide 1 / 111 Slide 2 / 111 2nd Grade Role of Water on Earth 2015-11-20 www.njctl.org Slide 3 / 111 Slide 4 / 111 Table of Contents: The Role of Water on Earth Earth's Water The Use of Maps Click on the
Slide 1 / 111 Slide 2 / 111 2nd Grade Role of Water on Earth 2015-11-20 www.njctl.org Slide 3 / 111 Slide 4 / 111 Table of Contents: The Role of Water on Earth Earth's Water The Use of Maps Click on the
Canada s Natural Systems. Canadian Geography 1202 September/October 2014
 Canada s Natural Systems Canadian Geography 1202 September/October 2014 Canada s Natural Systems Natural System: A system found in nature Here are the four natural systems that we will explore in the next
Energy Systems, Structures and Processes Essential Standard: Analyze patterns of global climate change over time Learning Objective: Differentiate
 Energy Systems, Structures and Processes Essential Standard: Analyze patterns of global climate change over time Learning Objective: Differentiate between weather and climate Global Climate Focus Question
PHYSICAL PROPERTIES TAHOE.UCDAVIS.EDU 8
 PHYSICAL PROPERTIES 8 Lake surface level Daily since 1900 Lake surface level varies throughout the year. Lake level rises due to high stream inflow, groundwater inflow, and precipitation directly onto
Energy: Warming the earth and Atmosphere. air temperature. Overview of the Earth s Atmosphere 9/10/2012. Composition. Chapter 3.
 Overview of the Earth s Atmosphere Composition 99% of the atmosphere is within 30km of the Earth s surface. N 2 78% and O 2 21% The percentages represent a constant amount of gas but cycles of destruction
Using Temperature and Dew Point to Aid Forecasting Springtime Radiational Frost and/or Freezing Temperatures in the NWS La Crosse Service Area
 Using Temperature and Dew Point to Aid Forecasting Springtime Radiational Frost and/or Freezing Temperatures in the NWS La Crosse Service Area WFO La Crosse Climatology Series #21 The formation of radiational
Hannah Moore CEE Juvenile Bull Trout Distribution in the South Fork Walla Walla River, Oregon
 Hannah Moore CEE 6440 Juvenile Bull Trout Distribution in the South Fork Walla Walla River, Oregon Introduction Bull trout (Salvelinus confluentus) are an endangered species historically found throughout
PH YSIC A L PROPERT IE S TERC.UCDAVIS.EDU
 PH YSIC A L PROPERT IE S 8 Lake surface level Daily since 1900 Lake surface level varies throughout the year. Lake level rises due to high stream inflow, groundwater inflow and precipitation directly onto
Probabilistic Decision-Making and Weather Assessment
 5 Student Packet Probabilistic Decision-Making and Weather Assessment Use contents of this packet as you feel appropriate. You are free to copy and use any of the material in this lesson plan. Packet Contents
Biosphere Biome Ecosystem Community Population Organism
 Ecology ecology - The study of living things and how they relate to their environment Levels of Organization in Ecology organism lowest level one living thing population collection of organisms of the
3) What is the difference between latitude and longitude and what is their affect on local and world weather and climate?
 What is the difference between latitude and longitude and what is their affect on local and world weather and climate?") www.discoveryeducation.com 1) Describe the difference between climate and weather citing an example of each. Describe how water (ocean, lake, river) has a local effect on weather and climate and provide
www.discoveryeducation.com 1) Describe the difference between climate and weather citing an example of each. Describe how water (ocean, lake, river) has a local effect on weather and climate and provide
Average Weather For Coeur d'alene, Idaho, USA
 Average Weather For Coeur d'alene, Idaho, USA Information courtesy of weatherspark.com Location This report describes the typical weather at the Coeur d'alene Air Terminal (Coeur d'alene, Idaho, United
ATMOSPHERIC CIRCULATION AND WIND
 ATMOSPHERIC CIRCULATION AND WIND The source of water for precipitation is the moisture laden air masses that circulate through the atmosphere. Atmospheric circulation is affected by the location on the
Columbia Estuary Province
 Rolling Provincial Review: Implementation 2001-2004 Province 73 Columbia Basin Fish & Wildlife Authority Province FY 2001-2004 Spending Summaries NPCC Recommendations and BPA Spending by Project Category,
Case Study 2: Twenty-mile Creek Rock Fords
 Case Study : Twenty-mile Creek Rock Fords Location Crossing Description Washington. Okanagan National Forest. Methow Valley Ranger District. Chewuch river basin, East Chewuch Road. The Twenty-mile Creek
A summary of the weather year based on data from the Zumwalt weather station
 ZUMWALT PRAIRIE WEATHER 2016 A summary of the weather year based on data from the Zumwalt weather station Figure 1. An unusual summer storm on July 10, 2016 brought the second-largest precipitation day
CSO Climate Data Rescue Project Formal Statistics Liaison Group June 12th, 2018
 CSO Climate Data Rescue Project Formal Statistics Liaison Group June 12th, 2018 Dimitri Cernize and Paul McElvaney Environment Statistics and Accounts Presentation Structure Background to Data Rescue Project
Average Weather In March For Fukuoka, Japan
 Average Weather In March For Fukuoka, Japan Location This report describes the typical weather at the Fukuoka Airport (Fukuoka, Japan) weather station over the course of an average March. It is based on
Conceptual Model of Stream Flow Processes for the Russian River Watershed. Chris Farrar
 Conceptual Model of Stream Flow Processes for the Russian River Watershed Chris Farrar Several features of creeks affect the interactions between surface and groundwater. This conceptual model uses the
Natural Causes of Climate. 3B Day 2
 Natural Causes of Climate 3B Day 2 Critical Content 3B: Investigate how daily weather over time determines climate patterns in a given region 2C: Recall the difference between weather and climate Describe
Solar-induced Thermal Activity and Stratification in Pond Water
 Solar-induced Thermal Activity and Stratification in Pond Water James D. Brownridge Department of Physics, Applied Physics, and Astronomy, State University of New York at Binghamton, P.O. Box 6000 Binghamton,
Weather and Climate of the Rogue Valley By Gregory V. Jones, Ph.D., Southern Oregon University
 Weather and Climate of the Rogue Valley By Gregory V. Jones, Ph.D., Southern Oregon University The Rogue Valley region is one of many intermountain valley areas along the west coast of the United States.
Seasonal variations of vertical structure in the deep waters of the Southern Caspian Sea
 278 Research in Marine Sciences Volume 3, Issue 1, 2018 Pages 278-286 Seasonal variations of vertical structure in the deep waters of the Southern Caspian Sea Somayeh Nahavandian 1,*, and Alireza Vasel
Assignment 1. Measuring River Characteristics- Vernon Creek. Applied Fluvial Geomorphology Field Techniques EESc 435
 Assignment 1 Measuring River Characteristics- Vernon Creek Applied Fluvial Geomorphology Field Techniques EESc 435 Amanda Jardine 30100093 Jaime McDonald 14177083 Erica Massey 50870088 April 28, 2012 Introduction
OPTIMISING THE TEMPORAL AVERAGING PERIOD OF POINT SURFACE SOLAR RESOURCE MEASUREMENTS FOR CORRELATION WITH AREAL SATELLITE ESTIMATES
 OPTIMISING THE TEMPORAL AVERAGING PERIOD OF POINT SURFACE SOLAR RESOURCE MEASUREMENTS FOR CORRELATION WITH AREAL SATELLITE ESTIMATES Ian Grant Anja Schubert Australian Bureau of Meteorology GPO Box 1289
Project 2. Introduction: 10/23/2016. Josh Rodriguez and Becca Behrens
 Project 2 Josh Rodriguez and Becca Behrens Introduction: Section I of the site Dry, hot Arizona climate Linen supply and cleaning facility Occupied 4am-10pm with two shifts of employees PHOENIX, ARIZONA
Lecture 2: Individual-based Modelling
 Lecture 2: Individual-based Modelling Part I Steve Railsback Humboldt State University Department of Mathematics & Lang, Railsback & Associates Arcata, California USA www.langrailsback.com 1 Outline 1.
according to and water. High atmospheric pressure - Cold dry air is other air so it remains close to the earth, giving weather.
 EARTH'S ATMOSPHERE Composition of the atmosphere - Earth's atmosphere consists of nitrogen ( %), oxygen ( %), small amounts of carbon dioxide, methane, argon, krypton, ozone, neon and other gases such
Climate Outlook through 2100 South Florida Ecological Services Office Vero Beach, FL September 9, 2014
 Climate Outlook through 2100 South Florida Ecological Services Office Vero Beach, FL September 9, 2014 Short Term Drought Map: Short-term (
Start of Presentation: No notes (Introductory Slide 1) 1) Salmonid Habitat Intrinsic Potential (IP) models are a type of habitat potential
 1) Salmonid Habitat Intrinsic Potential (IP) models are a type of habitat potential") The What and How of Salmonid Habitat Intrinsic Potential Modeling Start of Presentation: No notes (Introductory Slide 1) 1) Salmonid Habitat Intrinsic Potential (IP) models are a type of habitat potential
The What and How of Salmonid Habitat Intrinsic Potential Modeling Start of Presentation: No notes (Introductory Slide 1) 1) Salmonid Habitat Intrinsic Potential (IP) models are a type of habitat potential
A) usually less B) dark colored and rough D) light colored with a smooth surface A) transparency of the atmosphere D) rough, black surface
 usually less B) dark colored and rough D) light colored with a smooth surface A) transparency of the atmosphere D) rough, black surface") 1. Base your answer to the following question on the diagram below which shows two identical houses, A and B, in a city in North Carolina. One house was built on the east side of a factory, and the other
1. Base your answer to the following question on the diagram below which shows two identical houses, A and B, in a city in North Carolina. One house was built on the east side of a factory, and the other
BIOMES. Copyright Cmassengale
 BIOMES Biogeography - study of where organisms live Continental drift - slow motion of continents Dispersal of organisms Movement of organisms from 1 place to another Dispersal is usually caused by wind,
Chapter 8. Biogeographic Processes. Upon completion of this chapter the student will be able to:
 Chapter 8 Biogeographic Processes Chapter Objectives Upon completion of this chapter the student will be able to: 1. Define the terms ecosystem, habitat, ecological niche, and community. 2. Outline how
Meteorology. Circle the letter that corresponds to the correct answer
 Chapter 3 Worksheet 1 Meteorology Name: Circle the letter that corresponds to the correct answer 1) If the maximum temperature for a particular day is 26 C and the minimum temperature is 14 C, the daily
Assessment. Assessment
 2001 SPRINGBROOK CREEK RESTORATION - THREE YEAR POST-CONSTRUCTION REVIEW - Presented by Bruce Henderson and Andy Harris 2005 River Restoration Northwest Symposium Skamania Lodge, Washington www.hendersonlandservices.com
Code Proposed Standards Code Current Standards ESS1A The Universe and Its Stars Describe the presence of the Sun, Moon, and stars in the sky over time
 Kindergarten Earth Science Code Proposed Standards Code Current Standards ESS1A The Universe and Its Stars Describe the presence of the Sun, Moon, and stars in the sky over time 6.1.A.K.a. Observe and
Case Study Las Vegas, Nevada By: Susan Farkas Chika Nakazawa Simona Tamutyte Zhi-ya Wu AAE/AAL 330 Design with Climate
 Case Study Las Vegas, Nevada By: Susan Farkas Chika Nakazawa Simona Tamutyte Zhi-ya Wu AAE/AAL 330 Design with Climate Professor Alfredo Fernandez-Gonzalez School of Architecture University of Nevada,
1990 Intergovernmental Panel on Climate Change Impacts Assessment
 1990 Intergovernmental Panel on Climate Change Impacts Assessment Although the variability of weather and associated shifts in the frequency and magnitude of climate events were not available from the
An ENSO-Neutral Winter
 An ENSO-Neutral Winter This issue of the Blue Water Outlook newsletter is devoted towards my thoughts on the long range outlook for winter. You will see that I take a comprehensive approach to this outlook
Flux Tower Data Quality Analysis in the North American Monsoon Region
 Flux Tower Data Quality Analysis in the North American Monsoon Region 1. Motivation The area of focus in this study is mainly Arizona, due to data richness and availability. Monsoon rains in Arizona usually
Comparison of cloud statistics from Meteosat with regional climate model data
 Comparison of cloud statistics from Meteosat with regional climate model data R. Huckle, F. Olesen, G. Schädler Institut für Meteorologie und Klimaforschung, Forschungszentrum Karlsruhe, Germany (roger.huckle@imk.fzk.de
Temperature Changes OBJECTIVES PREPARATION SCHEDULE MATERIALS. The students. For each student. For each team of two. For the class
 activity 3 Temperature Changes OBJECTIVES Students observe changes in air temperature and discover the role of the Sun in heating Earth. The students measure and record outdoor air temperature at three
L.O Students will learn about factors that influences the environment
 Name L.O Students will learn about factors that influences the environment Date 1. At the present time, glaciers occur mostly in areas of A) high latitude or high altitude B) low latitude or low altitude
3. Which color of the visible light has the shortest wavelength? A) violet B) green C) yellow D) red
 violet B) green C) yellow D) red") Name: Topic 6 Test 1. Which process is responsible for the greatest loss of energy from Earth's surface into space on a clear night? A) condensation B) conduction C) radiation D) convection 2. Base your
Name: Topic 6 Test 1. Which process is responsible for the greatest loss of energy from Earth's surface into space on a clear night? A) condensation B) conduction C) radiation D) convection 2. Base your
AT350 EXAM #1 September 23, 2003
 AT350 EXAM #1 September 23, 2003 Name and ID: Enter your name and student ID number on the answer sheet and on this exam. Record your answers to the questions by using a No. 2 pencil to completely fill
Ecosystem response during the removal of the Elwha River Dams
 Ecosystem response during the removal of the Elwha River Dams Presentation Prepared by George Pess - NOAA Photo by John McMillan December 2015 Elwha The Elwha River Basin Olympic Natl. Park > 90% of habitat
Weather and Climate Summary and Forecast October 2017 Report
 Weather and Climate Summary and Forecast October 2017 Report Gregory V. Jones Linfield College October 4, 2017 Summary: Typical variability in September temperatures with the onset of fall conditions evident
ATMOSPHERIC ENERGY and GLOBAL TEMPERATURES. Physical Geography (Geog. 300) Prof. Hugh Howard American River College
 Prof. Hugh Howard American River College") ATMOSPHERIC ENERGY and GLOBAL TEMPERATURES Physical Geography (Geog. 300) Prof. Hugh Howard American River College RADIATION FROM the SUN SOLAR RADIATION Primarily shortwave (UV-SIR) Insolation Incoming
ATMOSPHERIC ENERGY and GLOBAL TEMPERATURES Physical Geography (Geog. 300) Prof. Hugh Howard American River College RADIATION FROM the SUN SOLAR RADIATION Primarily shortwave (UV-SIR) Insolation Incoming
Climate Change: Global Warming Claims
 Climate Change: Global Warming Claims Background information (from Intergovernmental Panel on Climate Change): The climate system is a complex, interactive system consisting of the atmosphere, land surface,
2010 Pearson Education, Inc.
 Chapter 10 Planetary Atmospheres: Mars, Venus, Earth What is an atmosphere? An atmosphere is a (usually very thin) layer of gas that surrounds a world. How does the greenhouse effect warm a planet? No
The Sun and Planets Lecture Notes 6.
 The Sun and Planets Lecture Notes 6. Lecture 6 Venus 1 Spring Semester 2017 Prof Dr Ravit Helled Cover photo: Venus in true color (Courtesy of NASA) Venus Properties Venus is the second brightest natural
Northwest Outlook September 2017
 Northwest Outlook September 2017 Hot and dry August August 2017 continued with the pattern established in June and July that featured a large, semipermanent ridge in the flow of the jet stream. Temperatures
Climate Outlook through 2100 South Florida Ecological Services Office Vero Beach, FL January 13, 2015
 Climate Outlook through 2100 South Florida Ecological Services Office Vero Beach, FL January 13, 2015 Short Term Drought Map: Short-term (
Final Exam: Monday March 17 3:00-6:00 pm (here in Center 113) Slides from Review Sessions are posted on course website:
 Slides from Review Sessions are posted on course website:") Final Exam: Monday March 17 3:00-6:00 pm (here in Center 113) 35% of total grade Format will be all multiple choice (~70 questions) Final exam will cover entire course - material since 2 nd midterm weighted
Final Exam: Monday March 17 3:00-6:00 pm (here in Center 113) 35% of total grade Format will be all multiple choice (~70 questions) Final exam will cover entire course - material since 2 nd midterm weighted
Unregulated Diversions Water Outlook for Melbourne Water Licence Holders
 Unregulated Diversions Water Outlook for Melbourne Water Licence Holders November 2017 Melbourne Water is owned by the Victorian Government. We manage Melbourne s water supply catchments, remove and treat
DEPARTMENT OF EARTH & CLIMATE SCIENCES Name SAN FRANCISCO STATE UNIVERSITY Nov 29, ERTH 360 Test #2 200 pts
 DEPARTMENT OF EARTH & CLIMATE SCIENCES Name SAN FRANCISCO STATE UNIVERSITY Nov 29, 2018 ERTH 360 Test #2 200 pts Each question is worth 4 points. Indicate your BEST CHOICE for each question on the Scantron
Lecture 8. The Holocene and Recent Climate Change
 Lecture 8 The Holocene and Recent Climate Change Recovery from the last ice age About 15,000 years ago, the earth began to warm and the huge ice sheets covering much of North America and Eurasia began
Summary and Conclusions
 241 Chapter 10 Summary and Conclusions Kerala is situated in the southern tip of India between 8 15 N and 12 50 N latitude and 74 50 E and 77 30 E longitude. It is popularly known as Gods own country.
The Cosmic Perspective Planetary Atmospheres: Earth and the Other Terrestrial Worlds
 Chapter 10 Lecture The Cosmic Perspective Seventh Edition Planetary Atmospheres: Earth and the Other Terrestrial Worlds Planetary Atmospheres: Earth and the Other Terrestrial Worlds 10.1 Atmospheric Basics
2006 Drought in the Netherlands (20 July 2006)
") 2006 Drought in the Netherlands (20 July 2006) Henny A.J. van Lanen, Wageningen University, the Netherlands (henny.vanlanen@wur.nl) The Netherlands is suffering from tropical heat and it is facing a meteorological
2006 Drought in the Netherlands (20 July 2006) Henny A.J. van Lanen, Wageningen University, the Netherlands (henny.vanlanen@wur.nl) The Netherlands is suffering from tropical heat and it is facing a meteorological
Alouette Project Water Use Plan
 Alouette Project Water Use Plan Alouette Water Temperature Implementation Year 6 Reference: ALUMON-5 Alouette Water Temperature 2013 Study Period: 2013 Greenbank Environmental Inc. July 15, 2014 Alouette
Chapter 10 Planetary Atmospheres Earth and the Other Terrestrial Worlds
 Chapter 10 Planetary Atmospheres Earth and the Other Terrestrial Worlds What is an atmosphere? 10.1 Atmospheric Basics Our goals for learning:! What is an atmosphere?! How does the greenhouse effect warm
What is insect forecasting, and why do it
 Insect Forecasting Programs: Objectives, and How to Properly Interpret the Data John Gavloski, Extension Entomologist, Manitoba Agriculture, Food and Rural Initiatives Carman, MB R0G 0J0 Email: jgavloski@gov.mb.ca
13 SHADOW FLICKER Introduction Methodology
 Table of contents 13 SHADOW FLICKER... 13-1 13.1 Introduction... 13-1 13.2 Methodology... 13-1 13.2.1 Factors Influencing Shadow Flicker Occurrence... 13-2 13.2.2 Shadow Flicker Analysis Methodology...
UNIT 5: ECOLOGY Chapter 15: The Biosphere
 CORNELL NOTES Directions: You must create a minimum of 5 questions in this column per page (average). Use these to study your notes and prepare for tests and quizzes. Notes will be stamped after each assigned
Jim Witt Long Range Calendar
 Jim Witt Long Range Calendar 2012-2013 November 2012 Toll Free 1-0-287-03 Studio Line (207) 9- Generally 20 40 50 60 70 0 Generally Cloudy, Cool Change Of Rain Or Wet Snow (Heavy) Changing To Rain 1 120
CLIMATOLOGY OF POSITIVE POLARITY FLASHES AND MULTIPLICITY AND THEIR RELATION TO NATURAL WILDFIRE IGNITIONS
 2006 19th International Lightning Detection Conference 24-25 April Tucson, Arizona, USA 1st International Lightning Meteorology Conference 26-27 April Tucson, Arizona, USA CLIMATOLOGY OF POSITIVE POLARITY
A System View of Water Level Processes in the Lower Columbia River
 A System View of Water Level Processes in the Lower Columbia River David Jay Department of Civil & Environmental Engineering Portland State University, Portland, OR Amy Borde and Heida Diefenderfer Pacific
Will it be a Good Ski Season? Correlation between El Niño and U.S. Weather
 Will it be a Good Ski Season? Correlation between El Niño and U.S. Weather Lillian Petersen 1 Abstract This study investigates the correlation between El Niño and the weather across the U.S. El Niño is
Fire Weather Drivers, Seasonal Outlook and Climate Change. Steven McGibbony, Severe Weather Manager Victoria Region Friday 9 October 2015
 Fire Weather Drivers, Seasonal Outlook and Climate Change Steven McGibbony, Severe Weather Manager Victoria Region Friday 9 October 2015 Outline Weather and Fire Risk Environmental conditions leading to
Weather and Climate Summary and Forecast March 2019 Report
 Weather and Climate Summary and Forecast March 2019 Report Gregory V. Jones Linfield College March 2, 2019 Summary: Dramatic flip from a mild winter to a top five coldest February on record in many locations
SEASONAL AND DAILY TEMPERATURES
 1 2 3 4 5 6 7 8 9 10 11 12 SEASONAL AND DAILY TEMPERATURES Chapter 3 Earth revolves in elliptical path around sun every 365 days. Earth rotates counterclockwise or eastward every 24 hours. Earth closest
Biological Response to the Gold King Mine Release in the Animas and San Juan Rivers
 Biological Response to the Gold King Mine Release in the and San Juan Rivers Lareina Guenzel 1, Richard Mitchell, PhD 1, Kate Sullivan, PhD 2, and Michael Cyterski, PhD 2 1 U.S. Environmental Protection
Impacts of Climate on the Corn Belt
 Impacts of Climate on the Corn Belt Great Lakes Crop Summit 2015 2015 Evelyn Browning Garriss Conclusions Climate change is not linear. It ebbs and flows. Recent polar volcano eruptions created a cool
Ocean s Influence on Weather and Climate
 Earth is often called the Blue Planet because so much of its surface (about 71%) is covered by water. Of all the water on Earth, about 96.5%, is held in the world s oceans. As you can imagine, these oceans
We are interconnected, we are resilient As air temperatures warm forests change, fires increase glaciers retreat, snowpack diminishes sediment
 We are interconnected, we are resilient As air temperatures warm forests change, fires increase glaciers retreat, snowpack diminishes sediment increases rivers change, salmon respond base sea level rises
Folsom Dam Water Control Manual Update Joint Federal Project, Folsom Dam
 Folsom Dam Water Control Manual Update Joint Federal Project, Folsom Dam Public Workshop May 25, 2016 Sacramento Library Galleria 828 I Street, Sacramento, CA US Army Corps of Engineers BUILDING STRONG
UC Berkeley Technical Completion Reports
 UC Berkeley Technical Completion Reports Title Hydrodynamics of shallow water habitats in the Sacramento-San Joaquin Delta Permalink https://escholarship.org/uc/item/3j77h7t6 Author Stacey, Mark T Publication
Why the Earth has seasons. Why the Earth has seasons 1/20/11
 Chapter 3 Earth revolves in elliptical path around sun every 365 days. Earth rotates counterclockwise or eastward every 24 hours. Earth closest to Sun (147 million km) in January, farthest from Sun (152
Chapter 10 Planetary Atmospheres Earth and the Other Terrestrial Worlds
 Chapter 10 Planetary Atmospheres Earth and the Other Terrestrial Worlds 10.1 Atmospheric Basics Our goals for learning: What is an atmosphere? How does the greenhouse effect warm a planet? Why do atmospheric
Lecture 2: Global Energy Cycle
 Lecture 2: Global Energy Cycle Planetary energy balance Greenhouse Effect Vertical energy balance Solar Flux and Flux Density Solar Luminosity (L) the constant flux of energy put out by the sun L = 3.9
CHAPTER 3. The sun and the seasons. Locating the position of the sun
 zenith 90 observer summer solstice 75 altitude angles equinox 52 winter solstice 29 Figure 3.1: Solar noon altitude angles for Melbourne SOUTH winter midday shadow WEST summer midday shadow summer EAST
Validation Results of a Spatially Fine-Scale Air Temperature Statistical Model in New York City
 Validation Results of a Spatially Fine-Scale Air Temperature Statistical Model in New York City Brian Vant-Hull, Maryam Karimi, Awalou Sossa, Louis Waxman, Estatio Guiterrez, Sarah Johnson*, Rouzbeh Nazari
WHEN CAN YOU SEED FALLOW GROUND IN THE FALL? AN HISTORICAL PERSPECTIVE ON FALL RAIN
 WHEN CAN YOU SEED FALLOW GROUND IN THE FALL? AN HISTORICAL PERSPECTIVE ON FALL RAIN Steve Petrie and Karl Rhinhart Abstract Seeding at the optimum time is one key to producing the greatest yield of any
Clouds and Rain Unit (3 pts)
") Name: Section: Clouds and Rain Unit (Topic 8A-2) page 1 Clouds and Rain Unit (3 pts) As air rises, it cools due to the reduction in atmospheric pressure Air mainly consists of oxygen molecules and nitrogen
Name: Section: Clouds and Rain Unit (Topic 8A-2) page 1 Clouds and Rain Unit (3 pts) As air rises, it cools due to the reduction in atmospheric pressure Air mainly consists of oxygen molecules and nitrogen
NIDIS Intermountain West Drought Early Warning System October 17, 2017
 NIDIS Drought and Water Assessment NIDIS Intermountain West Drought Early Warning System October 17, 2017 Precipitation The images above use daily precipitation statistics from NWS COOP, CoCoRaHS, and
Global Warming is a Fact of Life
 RECENT HISTORICAL TEMPERATURE AND TRADE-WIND INVERSION VARIATIONS IN HAWAI I Global Warming is a Fact of Life Tom Giambelluca Geography UH Manoa 1976-2005: 0.177 o C per decade 1906-2005: 0.074 o C per
RV Investigator Scientific Highlights
 RV Investigator Scientific Highlights Voyage #: IN2016_V02 Voyage title: SOTS+CAPRICORN+Eddy Mobilisation: Hobart, Friday-Sun, 11-13 March 2016 Depart: Hobart, 1000 Monday, 14 March 2016 Return: Hobart,
1 What Is Climate? TAKE A LOOK 2. Explain Why do areas near the equator tend to have high temperatures?
 CHAPTER 17 1 What Is Climate? SECTION Climate BEFORE YOU READ After you read this section, you should be able to answer these questions: What is climate? What factors affect climate? How do climates differ
WEATHER AND CLIMATE (K.ES.NGSS)
") TM WEATHER AND CLIMATE (K.ES.NGSS) UNIT AT A GLANCE ACTIVITY 1 - Weather Watchers: Making Observations QUESTIONS: What do we need to know about the weather, and what do we need to find out? Preparation:
TM WEATHER AND CLIMATE (K.ES.NGSS) UNIT AT A GLANCE ACTIVITY 1 - Weather Watchers: Making Observations QUESTIONS: What do we need to know about the weather, and what do we need to find out? Preparation:
Inflow and Outflow through the Sea-to-Sky Corridor in February 2010: Lessons Learned from SNOW-V10 *
 Inflow and Outflow through the Sea-to-Sky Corridor in February 2010: Lessons Learned from SNOW-V10 * Ruping Mo National Laboratory for Coastal and Mountain Meteorology, Environment Canada, Vancouver, BC,
A. Identification of Temperature as the Cause of Non-Attainment
 VIII. DETERMINATION OF ATTAINMENT IN WATER BODIES The following section presents a procedure for determining whether a particular stream segment is attaining a site-specific temperature standard. Identification
6. State two factors and explain how each influences the weather in Ohio. Respond in the space provided in your Answer Document.
 6. State two factors and explain how each influences the weather in Ohio. Respond in the space provided in your Answer Document. (4 points) Sample Response for Item 6 (Extended Response): Other Correct
NAME: EXPLORATION GUIDE. CTScienceCenter.org. 250 Columbus Blvd. Hartford, CT 06103
 NAME: EXPLORATION GUIDE CTScienceCenter.org 250 Columbus Blvd. Hartford, CT 06103 WEATHER: WILD & WACKY Objectives Students will investigate some extreme weather patterns, such as hurricanes and tornadoes.