Aquatic Vegetation Density Mapping BioBase 2015 Report
|
|
|
- David Brett Thornton
- 6 years ago
- Views:
Transcription


1 Aquatic Vegetation Density Mapping BioBase 2015 Report Written by: Sarah Mielke PLSLWD Monitoring Assistant Edited by: Jaime Rockney, Water Resources Specialist June 2016
2 Contents Introduction... 1 Objectives... 2 Collect Baseline Data... 2 Detect Changes... 2 Aquatic Vegetation Management... 3 Map Bottom Hardness... 4 Create Bathymetric Maps... 6 Plant Area Coverage Calculations... 6 Structure Scan... 6 Analysis... 7 Lower Prior... 8 Upper Prior... 9 Spring Lake Fish Lake Arctic Lake Buck Lake Developments Conclusion Sponsors and Volunteers Appendix A Vegetation Maps... I Lower Prior Lake Vegetation Maps... I Upper Prior Lake Vegetation Maps... V Spring Lake Vegetation Maps... VIII Fish Lake Vegetation Maps... XI Buck Lake Vegetation Maps... XII Arctic Lake Vegetation Maps... XIII Appendix B Plant Surveys for Upper and Lower Prior Lake... XIV Appendix C Bottom Hardness Maps... XVI Appendix D Bathymetric Maps... XIX Works Cited... XXII


 that is filled with plants.")
3 Introduction In 2013 Prior Lake Spring Lake Watershed District began mapping aquatic vegetation density in local lakes using a software program by Contour Innovations, called BioBase. One of the goals of this program was to locate and determine the trends and quantity of vegetation growth. Some lakes have too little vegetation, some have too many invasive species, and some have very little vegetation data and need baseline data. By locating and monitoring the vegetation, a more holistic approach can be used to analyze a lakes overall health and ecosystem. BioBase uses sonar to detect and record aquatic vegetation density, lake bottom hardness, and bathymetry (contours of lake bottom). Vegetation density is determined by the percent of the water column (the vertical space between the lake bottom and the water surface) that is filled with plants. An area that has plant growth from the lake bottom to the lake surface has 100% vegetation density, while an area of the lake with no vegetation has 0% density. Figure 1 BioBase equipment being used by volunteers The relationship between water depth and aquatic plant life is called the Littoral Zone. As described by the DNR the shallow transition zone between dry land and the open water area of the lake. In Minnesota waters, the littoral zone extends from the shore to a depth of about 15 feet, depending on water clarity. The width of the littoral zone will vary... places where the slope of the lake bottom is steep, the littoral area may be narrow... if the lake is shallow and the bottom slopes gradually, the littoral area may extend hundreds of feet into the lake (Where Aquatic Plants Grow). See Figure 2. Figure 2 Shows the different areas and plants of the littoral zone. 1

4 Data is stored on a memory stick using a depth finder and sonar equipment. The data is then uploaded to the BioBase cloud storage and mapping software system. Contour Innovations, the creators of the BioBase software, processes the collected data/trips and maps are created to illustrate conditions. The equipment used consists of a Lowrance depth finder, a transducer (sonar), and structure scan (structure scan is optional but used to aid in vegetation identification). When collecting data on the lakes, the staff member drives a boat less than 5mph in order for the sonar to record data. The sonar collects data from about 150ft out from either side of the boat, so driving near the ends of the docks is generally close enough to map the vegetation all the way up to the shoreline. Laps or tracks are then made moving farther and farther into deeper water. Objectives Figure 3 Tracks recorded by Biobase Software Collect Baseline Data There are many uses for data like this depending on what information is needed and for what reason. To begin with, a baseline is needed to simply have data to compare to. In order to have truly valuable data, information over at least a couple years time is needed. For example, if there is an unusual occurrence, like the 2014 flood, the vegetation may look different compared to other years when the lake level is at an average height. Detect Changes Flooding, drought, algae growth, rough fish abundance, or countless other circumstances may change when and where plants grow. It is important to have numerous years of data in order to determine normal, or baseline, conditions. Once a baseline is collected, one can more easily notice changes which may indicate something has changed. Comparing data from year to year could inform what trends exist or if there are sudden changes (whether due to natural or human interference). It may also help determine how well projects are working, or can be used to justify needs for grant funding. For example; if carp were to be managed and their population numbers decreased, there could be corresponding evidence that more vegetation may be found. Documenting a project as not successful can result in a review of alternatives. 2


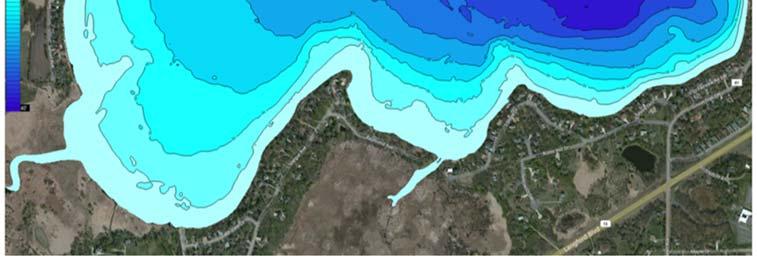
5 Water quality can also be affected by the amount of vegetation. Spring Lake was treated with Aluminum Sulfate in October 2013, which increased the clarity of the lake. After a few more years of monitoring vegetation density, we should be able to determine if better clarity will lead to more plant growth. Historically, Spring Lake vegetation did not grow in depths greater than approximately 8 feet. A typical lake with good water clarity could have plant growth as deep as 16 feet. It will be interesting to see how the Alum Treatment affects vegetation growth, if at all. Figure 4 Spring Lake before the Alum treatment on the left (taken 6/24/13) and after the treatment (taken on 6/15/14) on the right Aquatic Vegetation Management Comparing vegetation density from each season may help determine what kinds of plants are growing in the lakes, since certain plants have different growing seasons. For instance, if a lake has Curlyleaf pondweed (CLP), it is typically the first aquatic plant to grow and dies off naturally after the 4 th of July. By documenting high density in spring and then less density after July, it may be a sign that there is Curlyleaf pondweed present Monitoring the invasive curly-leaf pondweed treatment effectiveness is another valuable objective. Knowing where it has shown up in the past, finding out where it is growing in the spring, and where it is densest helps in deciding where to focus treatment. Afterward, staff can map the treatment locations to see how effective the treatments were and where to best continue treating. Figure 5 Blue Water Science recording plant surveys and checking curly-leaf treatments. 3


 and after treatment (5/21/15 - right).")

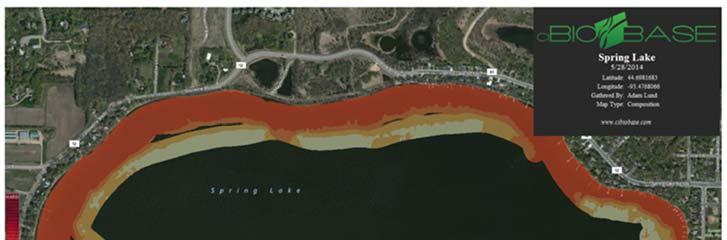
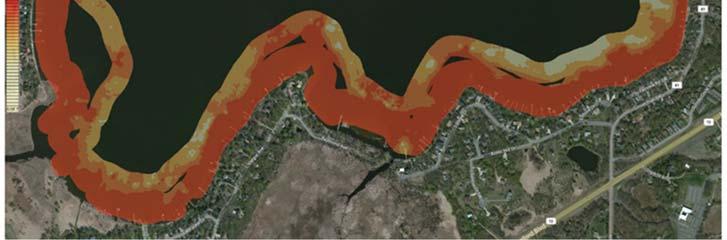
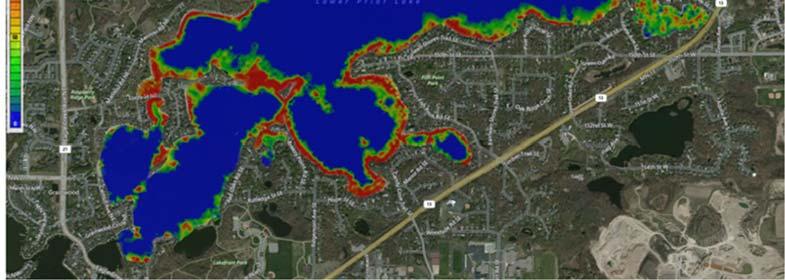
6 In the example in Figure 6, the areas showing presence of vegetation were dominated by CLP. This was confirmed by vegetation surveys conducted by Blue Water Science. CLP was treated in all three areas, however, treatment success varied, as is seen in the maps. The bay (Crystal Bay) in the top of the map was very effective while the two locations on the south central and southwest part of the lake were less effective and CLP flourished. Based upon the evidence created by these maps, the PLSLWD was able to receive a credit from the contractor for inadequate Curlyleaf pondweed treatment in 2015, which was used for 2016 treatments. Figure 6 Curlyleaf presence before (4/29/15 - left) and after treatment (5/21/15 - right). Map Bottom Hardness Mapping bottom hardness or substrate composition of a lake is also potentially useful as it may help explain part of the water clarity issues in our local lakes. When looking at the bottom hardness of this close up view of a bay in Lower Prior Lake in Figure 7, it is noticeable that where the lake bottom is harder, there is less vegetation. All bottom hardness maps are located in Appendix C Note: bottom hardness is measured light dark corresponding as soft hard, and vegetation is blue red corresponds as 0 100% density. Figure 7 Where there is a lack of vegetation (blue) the bottom of the lake is harder (dark orange/red). 4
. Data values range from 0.0 (soft) to 0.5 (very hard).")


7 According to Ray Valley s article Composition Algorithm Improved, bottom hardness is determined as the sonar send signals out that bounce back to the sonar. The density is dependent on how fast the signal comes back (Valley). Data values range from 0.0 (soft) to 0.5 (very hard). The table below is an example from Valley s article of the soil composition compared to the values recorded by the sonar. Table 1 Agreement between visually estimated substrate hardness while collecting Lowrance/BioBase composition data. Plants have a difficult time growing in lakes with hard bottoms (sandy or rocky). An example of this is found in Mr. Valley s article Composition Algorithm Improved, in Figure 8. The bottom hardness is a 0.4 in the data recorded, but an underwater photo was taken at that point during the monitoring to see what the bottom looks like at that point. As can be seen, there is some vegetation there but it is sparse and small due to the lack of soft substrate to grow in. Figure 8 The lake bottom in the photo has a high hardness value (0.4) and little vegetation. 5


8 Create Bathymetric Maps Another feature of BioBase is the ability to create extremely accurate bathymetric maps. Bathymetric maps show the elevation contours (depth) of the lake bottom. This gives a complete map of the depths in the lake available in 1, 3 and 5 foot contours. On page XIX in Appendix D there are bathymetric maps of each lake. This can be useful for detecting sediment deposition over time. Plant Area Coverage Calculations According to Canfield, a lake needs 40% plant area cover (PAC) for optimal water clarity. If a lake has healthy vegetation to filter the water and compete with algae, the clarity will increase along with more plant life, since sunlight will be able to penetrate farther into deeper water levels. However, if there are little favorable conditions for vegetation, this may be difficult to achieve. Lower Prior has achieved the optimal PAC at approximately 44%, Spring Lake is approximately 12.0% and Upper Prior is approximately 10% (these percentages are highly influenced by time of year, but these numbers are averages for summer). More details of PAC in the Analysis section below. Structure Scan In addition to the sonar transducer, the structure scan equipment takes ultra-sound-like pictures of vegetation that allows for better visual clarity when looking at vegetation images. This can be helpful when determining plant type. See Figure 9. Figure 9 Eurasian Water Milfoil and a school of fish using the regular transducer image (above) and the structure scan image (below). Images courtesy of Ray Valley. 6
9 Analysis PLSLWD staff and volunteers have been mapping Spring Lake, Upper Prior and Lower Prior Lakes since In 2015, Fish, Buck, and Arctic Lake were added. Maps of all the mapped lakes can be found in Appendix A. Table 2 Comparison of Plant Area Coverage (PAC) to lake size. Lake Year- Month Lake Size (ac) Littoral Zone (ac) Littoral Zone (% of Lake Size) Plant Area Coverage (Ac) Plant Area Coverage (% of lake size) Spring Spring* Spring* Upper Prior N/A N/A Upper Prior Upper Prior Lower Prior Lower Prior /22-8/ /8-8/ Lower Prior Fish Arctic Buck / N/A N/A *Asterisk or N/A indicates that not enough data was collected to give an accurate analysis. 7
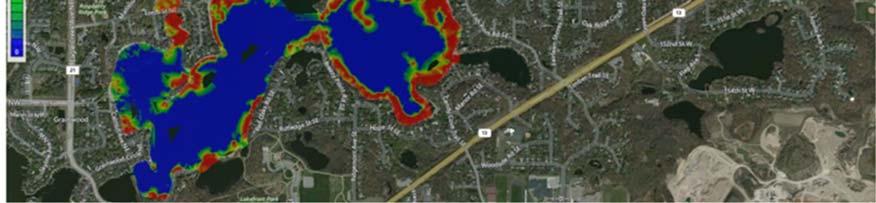
10 Lower Prior Surface Area: 940 acres Average Depth: 13 feet Maximum Depth: 56 feet Ordinary High Water Level: feet above sea level Watershed Area: 18,904 acres Figure 10 Lower Prior Lake Summer 2013 Lower Prior is a good example of having a consistent baseline. Looking at the year-to-year data, there is roughly the same amount of vegetation during each season each year (keeping in mind that nature draws outside of the lines and is never precisely the same each year). This consistency will make it easier to catch any significant changes in the future. In any given year, the trend is that the density and location of vegetation is less developed in early spring and grows and spreads as the year goes on, remaining well established through late September. It is still possible the species of plants are changing at this time, but the presence of vegetation is longstanding. One of the likely reasons Lower Prior is healthier may be due to the fact that water runs through Spring Lake and Upper Prior Lakes first, becoming cleaner and nutrients are filtered out along the way. However, retaining a PAC of 43% may have a big effect on water quality and clarity as well. 8

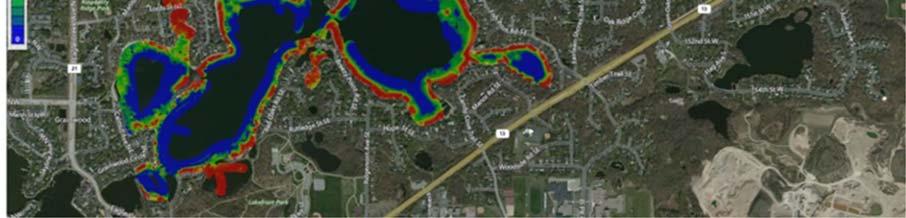
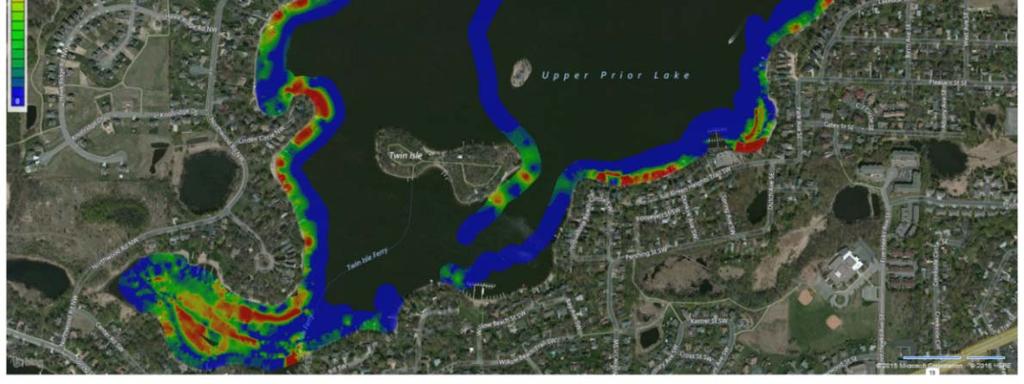
11 Upper Prior Surface Area: 416 acres Average Depth: 10 feet Maximum Depth: 43 feet Ordinary High Water Level: feet above sea level Watershed Area: 16,038 acres Figure 11 Upper Prior Lake Summer 2015 By comparison to Lower Prior, Upper Prior s vegetation is not nearly as abundant. Out of Upper Prior s 416 acres, 352 acres (85%) are within the littoral zone. Looking at maps from 2015, only 12-19% PAC was observed in the entire lake, when the whole lake was mapped (summer map did miss the island shoreline). Based upon Blue Water Science vegetation surveys (McComas Upper & Lower Prior Lake, located in Appendix B), Upper Prior lake is dominated by Curlyleaf Pondweed in the Spring. After Curlyleaf pondweed dies-off midsummer, coontail and milfoil were the dominant species in August, however in relatively low abundance. The most dramatic mapping for Upper Prior was summer of 2014 when nearly the whole lake was devoid of vegetation (see Figure 30). Vegetation was only observed in Crystal Bay after that and almost nothing in Upper Prior itself was a flood year, so that could have a lot to do with it. More mapping will determine if this was an anomaly, or common for this lake. 9
12 Spring Lake Surface Area: 587 acres Average Depth: 18 feet Maximum Depth: 34 feet Ordinary High Water Level: feet above sea level Watershed Area: 12,430 acres Figure 12 Spring Lake Summer 2013 Spring Lake appears to have a much more consistent presence of vegetation throughout the monitoring season and each year the areas are mostly the same (See Appendix A). The interesting thing about Spring Lake is that it does not have a lot of vegetation as compared to how much littoral zone or shallow area it possesses. Looking at the bathymetric map of Spring Lake (Figure 13, contours in 5ft.), it would appear there is potential for plants to inhabit more shallow areas. The bottom hardness in Figure 14 shows that the littoral zone consists of a hard lake bottom. Combined with poor water clarity, this most likely contributes to the lack of vegetation in the lake. 10

13 Figure 13 - Bathymetric Map Figure 14 Bottom Hardness 11


14 Projects like the Alum treatment conducted in October 2013 could possibly give plants a chance to grow in deeper areas if sunlight can now penetrate farther into the water. By comparing the summer season between 2013 and 2015, Figure 15, it is easy to see that the vegetation has started growing in deeper water and showing up in places it was absent before. PLSLWD will continue to observe how deep the vegetation grows, with hopes that it will continue to grow deeper. The Alum treatment may help kick-start the process of vegetation growing in enough density to restore the natural process of plants filtering out nutrients in the water for better clarity. Figure 15 Summer 2013 on the left and summer 2015 on the right. 12

15 Fish Lake Surface Area: 171 acres Average Depth: 14 feet Maximum Depth: 28 feet Ordinary High Water Level: feet above sea level Watershed Area: 699 acres Figure 16 Fish Lake Fall 2015 PLSLWD completed summer and fall maps of Fish Lake with help from a volunteer. Arctic Lake Surface Area: 33 acres Average Depth: 9.5 feet Maximum Depth: 30 feet Watershed Area: 507 acres Figure 17 Artic Lake Summer 2015 Artic lake was accomplished with the help of Shakopee Mdewakanton Sioux Community to create summer and fall maps. 13


.")
16 Buck Lake Surface Area: 23 acres Average Depth: shallow Maximum Depth: 9 feet Watershed Area: 3350 acres Figure 18 Buck Lake - Fall 2015 Buck Lake was challenging to map as there was no public access or motorized boats allowed on the lake. Lakeshore owners supplied a canoe and the sonar equipment was attached to the canoe in order to complete this task, making the first attempt at mapping by canoe in The strategy proved fairly successful and will be used again in the future (see Figure 19). As more data is collected, PLSLWD will be able to better interpret the health of Buck Lake. Figure 19 Canoe set up 14
17 Developments Now that a couple years of data have been collected, PLSLWD staff has recognized ways to improve the quality and quantity of data collected for the District s lakes. In order to have very accurate comparisons for each season, a time frame has been established for preferred mapping dates during each season. This will create better quality control. Spring First day possible (depending on ice-out) until May 31 st. (this timeframe helps in identifying Curlyleaf pondweed locations) Summer July 15th to August 15th (peak of native growing season). Fall September 1 st to October 1st. To take a closer look at the lake vegetation demographics, PLSLWD will add more plant surveys to help analyze theories on what is happening below the surface of the lakes. One of the questions that staff hopes to examine is whether or not the reason Upper Prior experiences such a lack in vegetation is due to the type of plants growing there poor water clarity, or other variables. Conclusion Overall, this project has already given the PLSLWD some insight as to what is happening in the lakes as well as how to improve procedure to be more effective and accurate. Given the data from Upper Prior and Spring Lake, it can be significantly supported that there is valuable information to be gathered that may assist with addressing concerns in the lakes. BioBase also gives the ability to monitor the progress of other projects which would help evaluate their effectiveness. With steady baselines created, it could be possible to catch minor problems before they become larger ones in the future. In conclusion, this is a worthwhile program to continue to be supported by the Watershed District and local community. Sponsors and Volunteers PLSLWD is very grateful for all the help and support it has received from the local area. Its sponsors include: Your Boat Club: providing boats for staff to map on Upper and Lower Prior City of Prior Lake: providing their boat for staff to use on Spring Lake Shakopee Mdewakanton Sioux Community: providing a boat and staff to help map Arctic Lake Our many volunteers: those who have shown enough care and concern to take it upon themselves to donate their time and boats for mapping Spring, Fish and Buck Lake 15


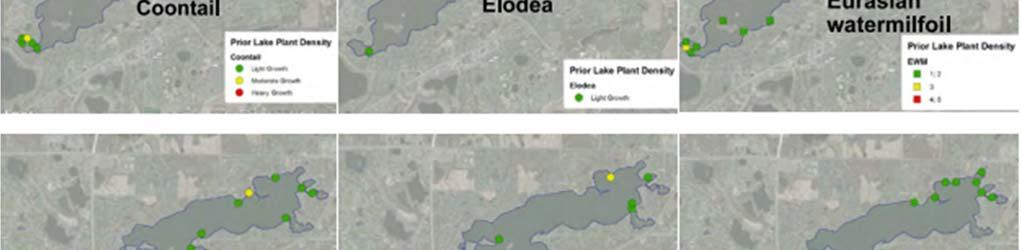
18 Appendix A Vegetation Maps Lower Prior Lake Vegetation Maps Figure 20 Lower Prior Lake Spring 2013 Figure 21 Lower Prior Lak e Summer 2013 I


19 Figure 22 Lower Prior Lake Spring 2014 Figure 23 Lower Prior Lake Summer 2014 II


20 Figure 24 Lower Prior Lake Fall 2014 Figure 25 Lower Prior Lake Spring 2015 III


21 Figure 26 Lower Prior Lake Summer 2015 Figure 27 Lower Prior Lake Summer/Fall 2015 IV


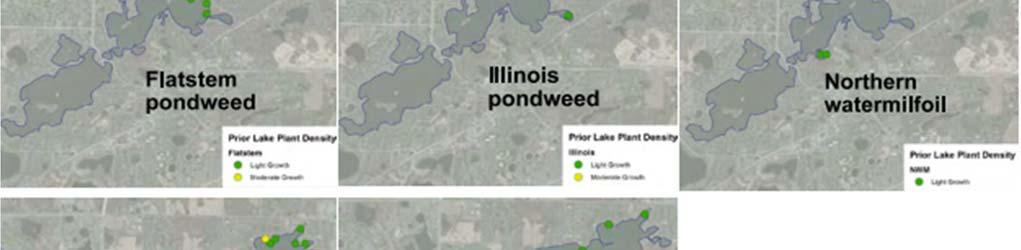
22 Upper Prior Lake Vegetation Maps Figure 28 Upper Prior Lake 2013 Figure 29 Upper Prior Lake Spring 2014 V


23 Figure 30 Upper Prior Lake Summer 2014 Figure 31 Upper Prior Lake Fall 2014 VI


24 Figure 32 Upper Prior Lake Spring 2015 Figure 33 Upper Prior Lake Summer 2015 VII


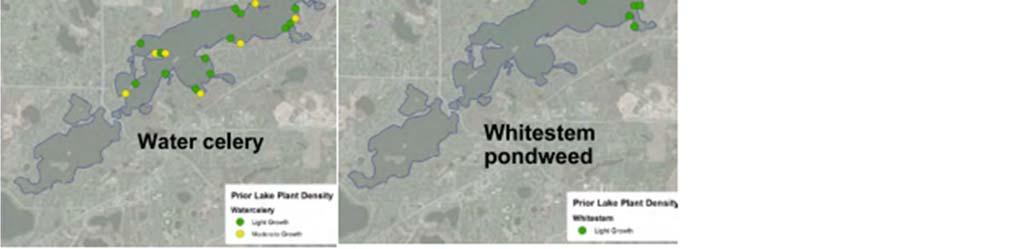
25 Spring Lake Vegetation Maps Figure 34 Upper Prior Lake Fall 2015 Figure 35 Spring Lake Summer 2013 VIII


26 Figure 36 Spring Lake Spring 2014 Figure 37 Spring Lake Summer 2014 IX


27 Figure 38 Spring Lake Fall 2014 Figure 39 Spring Lake Summer 2015 X


28 Figure 40 Spring Lake Fall 2015 Fish Lake Vegetation Maps Figure 41 Fish Lake Summer 2015 XI


29 Figure 42 Fish Lake Fall 2015 Buck Lake Vegetation Maps Figure 43 Buck Lake Fall 2015 XII


30 Arctic Lake Vegetation Maps Figure 44 Artic Lake Summer 2015 Figure 45 Artic Lake Fall 2015 XIII


31 Appendix B Plant Surveys for Upper and Lower Prior Lake Figure 46 Plant coverage/density at each survey site. Figure 47 Number of species found at each survey site. XIV

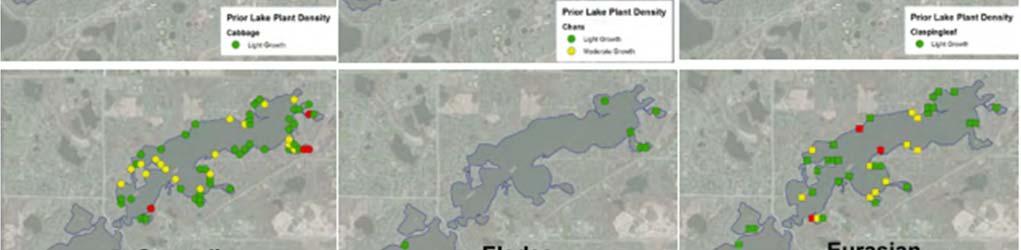
32 Figure 48 Location of individual species XV


33 Appendix C Bottom Hardness Maps * Note: sonar for Bottom Hardness is very sensitive and may not always be accurate. Figure 49 Lower Prior Lake Figure 50 Upper Prior Lake XVI


34 Figure 51 Spring Lake Figure 52 Fish Lake XVII

35 Figure 53 Buck Lake Figure 54 Artic Lake XVIII


36 Appendix D Bathymetric Maps *Contour lines change every 3ft. Figure 55 Lower Prior Lake Figure 56 Upper Prior Lake XIX


37 Figure 57 Spring Lake Figure 58 Fish Lake XX

38 Figure 59 Artic Lake Buck N/A XXI
39 Works Cited Canfield DE Jr. Hoyer MV Aquatic macrophytes and their relation to the limnology of Florida Lakes. Bureau of Aquatic Plant Management, Florida Department of Natural Resources, Tallahassee, Florida, McComas, Steve. Curlyleaf Pondweed Delineation and Assessment Surveys and a Summer Point-Intercept Survey for Upper and Lower Prior Lake, Scott County, St. Paul: n.p Valley, Ray. Composition Algorithm Improved! Web blog post. BioBase Mapping Aquatic Vegetation. Navico, Inc, 25 Mar Web. 4 Nov Where Aquatic Plants Grow. MN Dept. of Natural Resources. n.p. 27 Oct XXII
Flowering Rush Hand Removal. Lake Minnetonka Pilot Program
 Flowering Rush Hand Lake Minnetonka Pilot Program Spring 2012 Survey Report Provided For the Minnehaha Creek Watershed District By Waterfront Restoration LLC & Blue Water Science May 31, Waterfront Restoration,
Briggs Lake Water Quality Report 2014
 Briggs Lake Water Quality Report 2014 Seasonal Report for Briggs Lake Green Oak Township, Livingston Co. T1N, R6E, Sec. 3,4 74 Surface Acres 414 Hadley Street Holly, MI 48442 Main Phone: 248-634-8388 Northern
SURVEY OF SUBMERGED NOXIOUS WEED SPECIES IN LAKE CHELAN WASHINGTON
 SURVEY OF SUBMERGED NOXOUS WEED SPECES N LAKE CHELAN WASHNGTON 1/26/215 Produced by AquaTechnex Lake Chelan was surveyed by air and by boat in the fall of 214 to locate noxious weeds and assess their overall
Determining Treatment Areas For Curlyleaf Pondweed and Eurasian Watermilfoil
 Determining Treatment Areas For Curlyleaf Pondweed and Eurasian Watermilfoil (and includes a review of 2 whole lake CLP treatment projects) Steve McComas and Jo Stuckert Blue Water Science November 2010
Highland Lake Bathymetric Survey
 Highland Lake Bathymetric Survey Final Report, Prepared For: The Town of Highland Lake 612 Lakeshore Drive Oneonta, AL 35121 Prepared By: Tetra Tech 2110 Powers Ferry Road SE Suite 202 Atlanta, GA 30339
LAKE SURVEY REPORT. Fisheries Management. DOW Number: Survey ID Date: 07/31/2017. Lake Identification. Lake Location. Legal Descriptions
 Fisheries Management LAKE SURVEY REPORT Lake Name: Kroon Survey Type: Targeted Survey DOW Number: 13-0013-00 Survey ID Date: 07/31/2017 Lake Identification Alternate Lake Name: N/A Primary Lake Class ID:
Northeast Aquatic Research
 Northeast Aquatic Research 74 Higgins Highway Mansfield Center, CT 06250 860-456 - 3179 Crystal Lake Association Ellington, CT 06029 March 6, 2013 RE: Aquatic Plant Mapping at Crystal Lake in 2012. Dear
Citizen Science Actions AIS Shoreline Survey Blocking Zebra Mussels Ice in, Ice off. Janet Andersen
 Citizen Science Actions AIS Shoreline Survey Blocking Zebra Mussels Ice in, Ice off Janet Andersen Shoreline search for new Aquatic Invasive Plants NYS DEC NYSFOLA Janet Andersen Shoreline Search Topics
2012 Rainfall, Runoff, Water Level & Temperature Beebe Lake Wright County, MN (# )
") www.fixmylake.com 18029 83 rd Avenue North Maple Grove, MN 55311 mail@freshwatersci.com (651) 336-8696 2012 Rainfall, Runoff, Water Level & Temperature Beebe Lake Wright County, MN (#86-0023) Prepared
www.fixmylake.com 18029 83 rd Avenue North Maple Grove, MN 55311 mail@freshwatersci.com (651) 336-8696 2012 Rainfall, Runoff, Water Level & Temperature Beebe Lake Wright County, MN (#86-0023) Prepared
3.0 TECHNICAL FEASIBILITY
 3.0 TECHNICAL FEASIBILITY 3.1 INTRODUCTION To enable seasonal storage and release of water from Lake Wenatchee, an impoundment structure would need to be constructed on the lake outlet channel. The structure
Natural Shoreline Landscapes on Michigan Inland Lakes
 Natural Shoreline Landscapes on Michigan Inland Lakes Excerpts from Chapters 2 and 3 Photo Photo by Jane by Jane Herbert Herbert Did you know? Twenty-four species of amphibians, 25 species of reptiles,
Lake Sedimentation Survey of Siloam Springs State Park Lake, Adams County, Illinois
 Contract Report 567 Lake Sedimentation Survey of Siloam Springs State Park Lake, Adams County, Illinois by Richard L. Allgire Office of Sediment & Wetland Studies Prepared for the Illinois Department of
Aquatic Plants of Eastman Pond, Eastman
 Aquatic Plants of Eastman Pond, Eastman State Contact: Amy P. Smagula Limnologist/Exotic Aquatic Plant Program Coordinator 603-271 271-22482248 or asmagula@des.state.nh.us Current status of exotic plant
Hydroacoustic survey and bathymetric map creation for Brant Lake, New York
 Hydroacoustic survey and bathymetric map creation for Brant Lake, New York Holly A. Waterfield CLM 1 INTRODUCTION Brant Lake is located in Warren County, New York, within the bounds of the Adirondack Park.
Inversion Oxygenation and Bio augmentation Reduces Invasive Eurasian Watermilfoil Growth in Four Michigan Inland Lakes
 Inversion Oxygenation and Bio augmentation Reduces Invasive Eurasian Watermilfoil Growth in Four Michigan Inland Lakes Jennifer L. Jermalowicz-Jones Restorative Lake Sciences Restorative Lake Sciences
Assessing Large-Scale Spatial Distribution of Seagrasses in the Loxahatchee River
 Assessing Large-Scale Spatial Distribution of Seagrasses in the Loxahatchee River David Sabin & Albrey Arrington Wildpine Ecological Laboratory Loxahatchee River District Why Assess Seagrass? Seagrass
2017 Aquatic Plant Survey: Silver Lake (WBIC# )
") Aquatic Plants in Silver Lake; Hennepin County, MN August 07 577 Creekside Lane Osseo, MN 5569 james@freshwatersci.com (65) 6-8696 07 Aquatic Plant Survey: Silver Lake (WBIC# 7-06-00) Surveyed August,
Aquatic Plants in Silver Lake; Hennepin County, MN August 07 577 Creekside Lane Osseo, MN 5569 james@freshwatersci.com (65) 6-8696 07 Aquatic Plant Survey: Silver Lake (WBIC# 7-06-00) Surveyed August,
Tenmile Lakes Delta Building Study
 Tenmile Lakes Delta Building Study Since the late 1940 s, Tenmile Lakes has seen a sharp increase in sediment accumulation at the mouths of the tributaries that feed the lake. To monitor this sediment
By Richard L. Kiesling. Open-File Report 2016-XXX
 By Richard L. Kiesling Open-File Report 216-XXX U.S. Department of the Interior SALLY JEWELL, Secretary U.S. Geological Survey Suzette M. Kimball, Director U.S. Geological Survey, Reston, Virginia: 21X
1. 4 2y 1 2 = x = x 1 2 x + 1 = x x + 1 = x = 6. w = 2. 5 x
 .... VII x + x + = x x x 8 x x = x + a = a + x x = x + x x Solve the absolute value equations.. z = 8. x + 7 =. x =. x =. y = 7 + y VIII Solve the exponential equations.. 0 x = 000. 0 x+ = 00. x+ = 8.
Sedimentation Rate Change in the Winooski River Delta
 Sedimentation Rate Change in the Winooski River Delta Chris Ricker and Brian Connelly Abstract Historical air photographs, from 1937 show the Winooski River Delta extended much farther into Lake Champlain
TSEGI WASH 50% DESIGN REPORT
 TSEGI WASH 50% DESIGN REPORT 2/28/2014 Daniel Larson, Leticia Delgado, Jessica Carnes I Table of Contents Acknowledgements... IV 1.0 Project Description... 1 1.1 Purpose... 1 Figure 1. Erosion of a Headcut...
Learning Objectives: I can identify and interpret river flows and directions.
 Learning Objectives: I can identify and interpret river flows and directions. Bellringer Review: Check for Understanding Questions: 1 2 What Are The Key Parts Of A River s Anatomy? In your data notebooks
LIGHT PENETRATION INTO FRESH WATER.
 LIGHT PENETRATION INTO FRESH WATER. III. SEASONAL VARIATIONS IN THE LIGHT CONDITIONS IN WINDERMERE IN RELATION TO VEGETATION. BY W. H. PEARS ALL AND PHILIP ULLYOTT. {Received 29th May, 1933.) (With Three
Habitat Monitoring Update Hudson River CAG November 16, 2017
 Habitat Monitoring Update Hudson River CAG November 16, 2017 Habitat Reconstruction Overview: Habitats A habitat replacement program is being implemented in an Adaptive Management context to reconstruct
Relationships between Littoral Zone Habitats and lake water level fluctuation at Bear Lake,UT
 CEE 6440: GIS in Water Resources Term Paper: Fall 2015 Relationships between Littoral Zone Habitats and lake water level fluctuation at Bear Lake,UT Using ArcGIS and Python techniques Student: Matthew
Third Annual Monitoring Report Tidal Wetland Restoration 159 Long Neck Point Road, Darien, CT NAE
 1) Project Overview Third Annual Monitoring Report Tidal Wetland Restoration 159 Long Neck Point Road, Darien, CT NAE-2007-1130 December 15, 2014 This is the third year of a five year monitoring program
Natural Shoreline Landscapes on Michigan Inland Lakes
 Natural Shoreline Landscapes on Michigan Inland Lakes Excerpts from Chapters 2 and 3 Photo Photo by Jane by Jane Herbert Herbert Session topics Characteristics of natural and altered shorelines Lakes,
Adaptive Bathymetric System Mapping of Champagne Reef and Scott s Head
 Adaptive Bathymetric System Mapping of Champagne Reef and Scott s Head TRAVIS ROOF¹ ABSRACT Bathymetric maps are crucial not only for navigational purposes but also for conservation of marine environments.
Aquatic Plant Community of Crooked Lake: 2017 Anoka County, MN (# )
") Aquatic Plant Survey Crooked Lake (Anoka County, MN) August 07 577 Creekside Lane Osseo, MN 5569 james@freshwatersci.com (65) 6-8696 Aquatic Plant Community of Crooked Lake: 07 Anoka County, MN (#0-008)
Aquatic Plant Survey Crooked Lake (Anoka County, MN) August 07 577 Creekside Lane Osseo, MN 5569 james@freshwatersci.com (65) 6-8696 Aquatic Plant Community of Crooked Lake: 07 Anoka County, MN (#0-008)
Sediment and Carp Dynamics in Lake Mendota s Yahara River Estuary
 Sediment and Carp Dynamics in Lake Mendota s Yahara River Estuary Final project report for DNR Lake Planning Grant to Dane County with subcontract to UW Madison; Submitted April 4, 2013 Prof. Chin Wu (Project
MaxDepth Aquatics, Inc.
 MaxDepth Aquatics, Inc. Bathymetry of Mirror Pond From Newport Bridge to Galveston Bridge Prepared for the City of Bend By Joseph Eilers & Benn Eilers MaxDepth Aquatics, Inc. Bend, OR June 2005 INTRODUCTION
Aquatic Plant Community in Rice Lake: 2014 Hennepin County, MN (# )
") www.fixmylake.com 809 8 rd Avenue orth Maple Grove, M 55 mail@freshwatersci.com (65) 6-8696 Aquatic Plant Community in Rice Lake: 0 Hennepin County, M (#7-06) Surveyed July 5, 0 Surveying, Analysis, and
www.fixmylake.com 809 8 rd Avenue orth Maple Grove, M 55 mail@freshwatersci.com (65) 6-8696 Aquatic Plant Community in Rice Lake: 0 Hennepin County, M (#7-06) Surveyed July 5, 0 Surveying, Analysis, and
Second Annual Monitoring Report Tidal Wetland Restoration 159 Long Neck Point Road, Darien, CT NAE
 1) Project Overview Second Annual Monitoring Report Tidal Wetland Restoration 159 Long Neck Point Road, Darien, CT NAE-2007-1130 December 13, 2013 This is the second year of a five year monitoring program
Table 1: 2012 Aquatic Plant Community Statistics, Fish Lake, Dane County, WI Aquatic Plant Community Statistics 2012
 APPENDIX A FISH LAKE PLANT STATISTICS (2012) Table 1: 2012 Aquatic Plant Community Statistics, Fish Lake, Dane County, WI Aquatic Plant Community Statistics 2012 Number of sites sampled 474 Number of sites
PRELIMINARY DRAFT FOR DISCUSSION PURPOSES
 Memorandum To: David Thompson From: John Haapala CC: Dan McDonald Bob Montgomery Date: February 24, 2003 File #: 1003551 Re: Lake Wenatchee Historic Water Levels, Operation Model, and Flood Operation This
FINMARINET: Inventories and Planning for the Marine Natura 2000 Network in Finland. A.2 Geological inventories of the seafloor Final Report
 LIFE07 NAT/FIN/000151 FINMARINET: Inventories and Planning for the Marine Natura 2000 Network in Finland A.2 Geological inventories of the seafloor Final Report Geological Survey of Finland, GTK 1. Introduction
UNIT 1: WATER SYSTEMS ON EARTH CHAPTER 2: OCEANS CONTROL THE WATER CYCLE
 UNIT 1: WATER SYSTEMS ON EARTH CHAPTER 2: OCEANS CONTROL THE WATER CYCLE ORIGINS OF OCEAN WATER OCEANS HAVE FILLED OVER HUNDREDS OF MILLIONS OF YEARS SCIENTISTS BELIEVE THE OCEANS ARE MORE THAN 3 BILLION
The response of native Australian seedlings to heat and water stress. Mallory T. R. Owen
 The response of native Australian seedlings to heat and water stress Mallory T. R. Owen Bachelor of Environmental Science Institute of Applied Ecology University of Canberra, ACT 2601, Australia A thesis
Wednesday, November 15, 2017
 Wednesday, November 15, 2017 Northern Europe: Physical Geography Objective: Locate and describe the various traditional regions of Western Europe. Outline how the physical geography varies from region
The Appleton Wetland; Its Decline, Cause and Recommended Action. Appendix I: Rock Ridge Levels
 The Appleton Wetland; Its Decline, Cause and Recommended Action Appendix I: Rock Ridge Levels Report prepared by Appleton Wetland Research Group of the Mississippi Valley Field Naturalists Research Group
Ground-Water Exploration in the Worthington Area of Nobles County: Summary of Seismic Data and Recent Test Drilling Results
 Ground-Water Exploration in the Worthington Area of Nobles County: Summary of Seismic Data and Recent Test Drilling Results Jim Berg and Todd Petersen Geophysicists, DNR Waters January 2000 Table of Contents
Seagrass Transplantation & Environmental & Marine Consulting Services, Inc. Drew Campbell, Vice President & Lead Scientst.
 Indian River Lagoon Symposium Seagrass Transplantation & Project Considerations Environmental & Marine Consulting Services, Inc. Drew Campbell, Vice President & Lead Scientst March 26 th, 2013 Regulatory
RESULTS OF SEDIMENT CORE TAKEN FROM POTATO LAKE, WASHBURN COUNTY, WISCONSIN
 RESULTS OF SEDIMENT CORE TAKEN FROM POTATO LAKE, WASHBURN COUNTY, WISCONSIN Paul Garrison and Gina LaLiberte, Wisconsin Department of Natural Resources January 2011 Aquatic organisms are good indicators
Environmental Science
 Environmental Science A Study of Interrelationships Cui Jiansheng Hebei University of Science and Technology CH06 Kinds of Ecosystems and Communities Chapter Objectives After reading this chapter, you
Lab 2 The reinvasion of flowering plants into aquatic habitats
 Lab 2 The reinvasion of flowering plants into aquatic habitats BIOL 3601: PLANT DIVERSITY Lab Goals: To learn about adaptations of aquatic plants in different aquatic zones To learn common aquatic plants
January 25, Summary
 January 25, 2013 Summary Precipitation since the December 17, 2012, Drought Update has been slightly below average in parts of central and northern Illinois and above average in southern Illinois. Soil
Workshops funded by the Minnesota Environment and Natural Resources Trust Fund
 Workshops funded by the Minnesota Environment and Natural Resources Trust Fund Conservation Applications of LiDAR Data Workshops funded by: Minnesota Environment and Natural Resources Trust Fund Presented
EAGLES NEST AND PIASA ISLANDS
 EAGLES NEST AND PIASA ISLANDS HABITAT REHABILITATION AND ENHANCEMENT PROJECT MADISON AND JERSEY COUNTIES, ILLINOIS ENVIRONMENTAL MANAGEMENT PROGRAM ST. LOUIS DISTRICT FACT SHEET I. LOCATION The proposed
TABLE -I RAINFALL RECORDED AT PORT BLAIR (MM) FROM 1949 TO 2009
 FROM 1949 TO 2009") A. RAINFALL TABLE -I RAINFALL RECORDED AT PORT BLAIR (MM) FROM 1949 TO 2009 MONTH/YEAR 1949 1950 1951 1952 1953 1954 1955 1956 1957 1958 JANUARY 0.0 0.8 82.5 0.0 26.9 37.3 71.4 46.2 10.2 28.7 FEBRUARY
A. RAINFALL TABLE -I RAINFALL RECORDED AT PORT BLAIR (MM) FROM 1949 TO 2009 MONTH/YEAR 1949 1950 1951 1952 1953 1954 1955 1956 1957 1958 JANUARY 0.0 0.8 82.5 0.0 26.9 37.3 71.4 46.2 10.2 28.7 FEBRUARY
Project No India Basin Shadow Study San Francisco, California, USA
 Project No. 432301 India Basin Shadow Study San Francisco, California, USA Numerical Modelling Studies 04 th June 2018 For Build Inc. Report Title: India Basin Shadow Study San Francisco, California, USA
Bishopville Prong Study
 Bathymetric and Sediment Assessment in the Bishopville Prong of St. Martin River Darlene V. Wells, Richard A. Ortt, Jr., and Stephen Van Ryswick Funded by MCBP 2011-2012 Implementation Grant Objectives
Island Design. UMRS EMP Regional Workshop. Presentation for the
 Island Design Presentation for the UMRS EMP Regional Workshop by Jon Hendrickson Hydraulic Engineer Regional Technical Specialist, Water Quality and Habitat Restoration August 17 19, 2005 Project Delivery
Native Buffer Cost Share - Ramsey (SWCD)
") - Native Buffer Cost Share - Ramsey (SWCD) Fund Report Ramsey Fund Information Fund Name Fund Year Budgeted Spent Date Last Spent - Native Buffer Cost Share - Ramsey (SWCD) $274,874.39 $197,984.50 03/21/2012
- Native Buffer Cost Share - Ramsey (SWCD) Fund Report Ramsey Fund Information Fund Name Fund Year Budgeted Spent Date Last Spent - Native Buffer Cost Share - Ramsey (SWCD) $274,874.39 $197,984.50 03/21/2012
Illinois Drought Update, December 1, 2005 DROUGHT RESPONSE TASK FORCE Illinois State Water Survey, Department of Natural Resources
 Illinois Drought Update, December 1, 2005 DROUGHT RESPONSE TASK FORCE Illinois State Water Survey, Department of Natural Resources For more drought information please go to http://www.sws.uiuc.edu/. SUMMARY.
Lake Vermilion ( ) Aquatic Vegetation Survey
 Aquatic Vegetation Survey") Lake Vermilion (69-0378 - 00) Aquatic Vegetation Survey 22796 County Highway 6 Detroit Lakes, MN 56501 (218) 846-1465 www.rmbel.info Table of Contents Executive Summary... 3 Introduction... 4 Methods...
Lake Vermilion (69-0378 - 00) Aquatic Vegetation Survey 22796 County Highway 6 Detroit Lakes, MN 56501 (218) 846-1465 www.rmbel.info Table of Contents Executive Summary... 3 Introduction... 4 Methods...
Geoduck Floating Nursery Monitoring Plan, Quarterly Reporting
 December 23, 2014 Mason County Department of Community Development Attn: Grace Miller, Senior Planner 411 N. Fifth Street PO Box 279 Shelton, WA 98584 Re: Geoduck Floating Nursery Monitoring Plan, Quarterly
The Earth s Ecosystems
 CHAPTER 17 DIRECTED READING WORKSHEET The Earth s Ecosystems As you read Chapter 17, which begins on page 414 of your textbook, answer the following questions. Would You Believe...? (p. 414) 1. How does
MARINE GEOLOGY & GEOGRAPHY
 MARINE GEOLOGY & GEOGRAPHY Bathymetry BATHYMETRY BATHYMETRY THE UNDERWATER EQUIVALENT TO TOPOGRAPHY THE STUDY OF WATER DEPTH A BATHYMETRIC MAP SHOWS FLOOR RELIEF OR TERRAIN AS CONTOUR LINES Bathymetry
How Do Human Impacts and Geomorphological Responses Vary with Spatial Scale in the Streams and Rivers of the Illinois Basin?
 How Do Human Impacts and Geomorphological Responses Vary with Spatial Scale in the Streams and Rivers of the Illinois Basin? Bruce Rhoads Department of Geography University of Illinois at Urbana-Champaign
Lesson 3 Latitude is Everything
 Latitude is Everything Essential Question: How does latitude affect the Amount of Solar Energy an Area Receives and that Area s Climate? Objective: Students will be able to explain how the sun s energy
CHAPTER 6 & 7 VOCABULARY
 CHAPTER 6 & 7 VOCABULARY 1. Biome 2. Climate 3. Latitude 4. Altitude 5. Emergent layer 6. Epiphyte 7. Understory 8. Permafrost 9. Wetland 10.Plankton 11.Nekton 12.Benthos 13.Littoral zone 14.Benthic zone
TECHNICAL PUBLICATION SJ WATER SUPPLY ASSESSMENT 2003 ST. JOHNS RIVER WATER MANAGEMENT DISTRICT
 TECHNICAL PUBLICATION SJ2006-1 WATER SUPPLY ASSESSMENT 2003 ST. JOHNS RIVER WATER MANAGEMENT DISTRICT Technical Publication SJ2006-1 Water Supply Assessment 2003 Palatka, Florida 2006 Northwest Florida
Notes and Summary pages:
 Topographic Mapping 8.9C Interpret topographical maps and satellite views to identify land and erosional features and predict how these shapes may be reshaped by weathering ATL Skills: Communication taking
Activity 2.2: Recognizing Change (Observation vs. Inference)
") Activity 2.2: Recognizing Change (Observation vs. Inference) Teacher Notes: Evidence for Climate Change PowerPoint Slide 1 Slide 2 Introduction Image 1 (Namib Desert, Namibia) The sun is on the horizon
Activity 2.2: Recognizing Change (Observation vs. Inference) Teacher Notes: Evidence for Climate Change PowerPoint Slide 1 Slide 2 Introduction Image 1 (Namib Desert, Namibia) The sun is on the horizon
Southington High School 720 Pleasant Street Southington, CT 06489
 BLUE KNIGHTS Southington High School 720 Pleasant Street Southington, CT 06489 Phone: (860) 628-3229 Fax: (860) 628-3397 Home Page: www.southingtonschools.org Principal Brian Stranieri Assistant Principals
Doing Things Differently: Tracking Invasive Exotic Plants in the Florida Park Service
 Florida Park Service Doing Things Differently: Tracking Invasive Exotic Plants in the Florida Park Service 21 May 2013 The Big Picture 171 State Parks and Trails across 5 Districts ~785,000 Acres Almost
Taunton River Salt Marsh Assessment Results from 2014 season
 Taunton River Salt Marsh Assessment Results from 2014 season December, 2014 During the late summer and fall of 2014, Save The Bay evaluated salt marshes in Assonet Bay, Freetown and Broad Cove in Dighton
Your web browser (Safari 7) is out of date. For more security, comfort and the best experience on this site: Update your browser Ignore
 is out of date. For more security, comfort and the best experience on this site: Update your browser Ignore") Your web browser (Safari 7) is out of date. For more security, comfort and the best experience on this site: Update your browser Ignore CO NTINENTAL SHEL F For the complete encyclopedic entry with media
Your web browser (Safari 7) is out of date. For more security, comfort and the best experience on this site: Update your browser Ignore CO NTINENTAL SHEL F For the complete encyclopedic entry with media
Chapter 7 Part III: Biomes
 Chapter 7 Part III: Biomes Biomes Biome: the major types of terrestrial ecosystems determined primarily by climate 2 main factors: Temperature and precipitation Depends on latitude or altitude; proximity
Illinois State Water Survey Division
 Illinois State Water Survey Division SURFACE WATER SECTION SWS Contract Report 413 AT THE UNIVERSITY OF ILLINOIS SEDIMENTATION SURVEY OF DAWSON LAKE, MORAINE VIEW STATE PARK, MC LEAN COUNTY, ILLINOIS by
How Will Melting Ice Sheets Affect Us?
 PASSAGE 4 How Will Melting Ice Sheets Affect Us? Variation is normal. During the last ice age, for example, ice sheets also covered much of North America and Scandinavia. Why is what s happening now different
Biosphere. All living things, plants, animals, (even you!) are part of the zone of the earth called the biosphere.
 are part of the zone of the earth called the biosphere.") Unit 1 Study Guide Earth s Spheres Biosphere All living things, plants, animals, (even you!) are part of the zone of the earth called the biosphere. Hydrosphere Water covers ¾ of the earth, made up mostly
Unit 1 Study Guide Earth s Spheres Biosphere All living things, plants, animals, (even you!) are part of the zone of the earth called the biosphere. Hydrosphere Water covers ¾ of the earth, made up mostly
Appendix J Vegetation Change Analysis Methodology
 Appendix J Vegetation Change Analysis Methodology Regional Groundwater Storage and Recovery Project Draft EIR Appendix-J April 2013 APPENDIX J- LAKE MERCED VEGETATION CHANGE ANALYSIS METHODOLOGY Building
Current Climate Trends and Implications
 Current Climate Trends and Implications Dr. Mark Seeley Professor emeritus Department of Soil, Water, and Climate University of Minnesota St Paul, MN 55108 Crop Insurance Conference September 12, 2018
REDWOOD VALLEY SUBAREA
 Independent Science Review Panel Conceptual Model of Watershed Hydrology, Surface Water and Groundwater Interactions and Stream Ecology for the Russian River Watershed Appendices A-1 APPENDIX A A-2 REDWOOD
TUNDRA. Column 1 biome name Column 2 biome description Column 3 examples of plant adaptations
 Biome Cards (pp. 1 of 7) Cut out each biome card and divide each card into three sections. Place all sections in a plastic storage bag. Have one bag for every two students. Column 1 biome name Column 2
Accuplacer College Level Math Study Guide
 Testing Center Student Success Center Accuplacer Study Guide The following sample questions are similar to the format and content of questions on the Accuplacer College Level Math test. Reviewing these
DETAILED DESCRIPTION OF STREAM CONDITIONS AND HABITAT TYPES IN REACH 4, REACH 5 AND REACH 6.
 DETAILED DESCRIPTION OF STREAM CONDITIONS AND HABITAT TYPES IN REACH 4, REACH 5 AND REACH 6. The Eklutna River was divided into study reaches (figure 1) prior to this site visit. Prominent geologic or
Most natural ecosystems are in a state of equilibrium. This means that their biotic and abiotic features remain relatively constant over time.
 Most natural ecosystems are in a state of equilibrium. This means that their biotic and abiotic features remain relatively constant over time. The major biomes, for example, usually maintain a characteristic
A Community Member s Guide to Aquatic Plants. Emelia Hauck Jacobs Field Lead Plant Taxonomist RMB Environmental Laboratories, Inc.
 A Community Member s Guide to Aquatic Plants Emelia Hauck Jacobs Field Lead Plant Taxonomist RMB Environmental Laboratories, Inc. Agenda Importance of aquatic plants How to identify common native aquatic
Ecological Succession
 Ecological Succession Most natural ecosystems are in a state of equilibrium. This means that their biotic and abiotic features remain relatively constant over time. The major biomes, for example, usually
U.S. ARMY CORPS OF ENGINEERS
 CORPS FACTS Regulating Mississippi River Navigation Pools U.S. ARMY CORPS OF ENGINEERS BUILDING STRONG Historical Background Federal improvements in the interest of navigation on the Mississippi River
Science 8 Unit 1 Test Review Analyze factors that affect productivity and species distribution in marine and fresh water environments.
 Science 8 Unit 1 Test Review How does water shape our world? 1. Define a water system in your own words 2. What is water important for? (3 things at least) 3. What is water made of? Water in our world
Aquatic Plants of Canaan Street Lake, Canaan
 Aquatic Plants of Canaan Street Lake, Canaan State Contact: Amy P. Smagula Limnologist/Exotic Aquatic Plant Program Coordinator 603-271-2248 or Amy.Smagula@des.nh.gov Current status of exotic plant infestations
Lakeway s first 300 homes / Old Lakeway Neighborhood Project
 Lakeway s first 300 homes / Old Lakeway Neighborhood Project Preserving Lakeway s history through its homes and forming a neighborhood known as Old Lakeway Today Brief backgrounder on the Project Updates:
Distribution of Hydrilla and Giant Salvinia in Mississippi in 2005
 An Annual Report to the Mississippi Bureau of Plant Industry for 2005 John D. Madsen, Ryan M. Wersal, and Wilfredo Robles GeoResources Institute and Department of Plant and Soil Science Mississippi State
Wild Rice Seed Enumeration Report: Upper Clam Lake, Lower Clam Lake, Long Lake, and Clam River Flowage
 www.fixmylake.com 18029 83 rd Avenue North Maple Grove, MN 55311 mail@freshwatersci.com (651) 336-8696 Wild Rice Seed Enumeration Report: 2009-2010 Upper Clam Lake, Lower Clam Lake, Long Lake, and Clam
Lower 8.3 Miles of the Lower Passaic River Operable Unit 2 Presentation to The Passaic River Community Advisory Group. September 14, 2017
 Lower 8.3 Miles of the Lower Passaic River Operable Unit 2 Presentation to The Passaic River Community Advisory Group September 14, 2017 Agenda Pre-Design Investigation (PDI) Status Geophysical, Bathymetric,
Midwest and Great Plains Climate and Drought Update
 Midwest and Great Plains Climate and Drought Update June 20,2013 Laura Edwards Climate Field Specialist Laura.edwards@sdstate.edu 605-626-2870 2012 Board of Regents, South Dakota State University General
Ecological Succession
 Ecological Succession Primary succession will ALWAYS be on areas where there is NO SOIL a) bare rock from a retreating glacier, b) newly cooled lava; c) abandoned lot with an impervious surface (parking
ZUMWALT WEATHER AND CLIMATE ANNUAL REPORT ( )
") ZUMWALT WEATHER AND CLIMATE ANNUAL REPORT (26-29) FINAL DRAFT (9 AUGUST 21) J.D. HANSEN 1, R.V. TAYLOR 2, AND V.S. JANSEN 3 INTRODUCTION The Zumwalt Prairie in northeastern Oregon is a unique grassland
ZUMWALT WEATHER AND CLIMATE ANNUAL REPORT (26-29) FINAL DRAFT (9 AUGUST 21) J.D. HANSEN 1, R.V. TAYLOR 2, AND V.S. JANSEN 3 INTRODUCTION The Zumwalt Prairie in northeastern Oregon is a unique grassland
Lesson 2. Antarctic Oceanography: Component I - Ice/Glaciers Component II - Marine Snow
 Lesson 2. Antarctic Oceanography: Component I - Ice/Glaciers Component II - Marine Snow Lesson Objectives: Introduces students to the different kinds of ice found in Antarctica, Students will become familiar
Chapter 6. Field Trip to Sandia Mountains.
 University of New Mexico Biology 310L Principles of Ecology Lab Manual Page -40 Chapter 6. Field Trip to Sandia Mountains. Outline of activities: 1. Travel to Sandia Mountains 2. Collect forest community
RAINFALL AVERAGES AND SELECTED EXTREMES FOR CENTRAL AND SOUTH FLORIDA. Thomas K. MacVicar
 TECHNICAL PUBLICATION #83-2 March 1983 RAINFALL AVERAGES AND SELECTED EXTREMES FOR CENTRAL AND SOUTH FLORIDA by Thomas K. MacVicar "This public document was promulgated at an annual cost of $136.74, or
Summer Review Packet. for students entering. IB Math SL
 Summer Review Packet for students entering IB Math SL The problems in this packet are designed to help you review topics that are important to your success in IB Math SL. Please attempt the problems on
Earth s Major Terrerstrial Biomes. *Wetlands (found all over Earth)
") Biomes Biome: the major types of terrestrial ecosystems determined primarily by climate 2 main factors: Depends on ; proximity to ocean; and air and ocean circulation patterns Similar traits of plants
Biomes Biome: the major types of terrestrial ecosystems determined primarily by climate 2 main factors: Depends on ; proximity to ocean; and air and ocean circulation patterns Similar traits of plants
consulting engineers and scientists Natural Shorelines And Ice Brian Majka, Restoration Ecologist 04/28/2016
 consulting engineers and scientists Natural Shorelines And Ice Brian Majka, Restoration Ecologist 04/28/2016 Forces acting on shorelines Ice forces Difficulty in working with ice Techniques that do and
APPENDIX E. GEOMORPHOLOGICAL MONTORING REPORT Prepared by Steve Vrooman, Keystone Restoration Ecology September 2013
 APPENDIX E GEOMORPHOLOGICAL MONTORING REPORT Prepared by Steve Vrooman, Keystone Restoration Ecology September 2 Introduction Keystone Restoration Ecology (KRE) conducted geomorphological monitoring in
Three main areas of work:
 Task 2: Climate Information 1 Task 2: Climate Information Three main areas of work: Collect historical and projected weather and climate data Conduct storm surge and wave modeling, sea-level rise (SLR)