Flow Monitoring in the Collection System September 11, 2014
|
|
|
- Stephanie Perkins
- 6 years ago
- Views:
Transcription
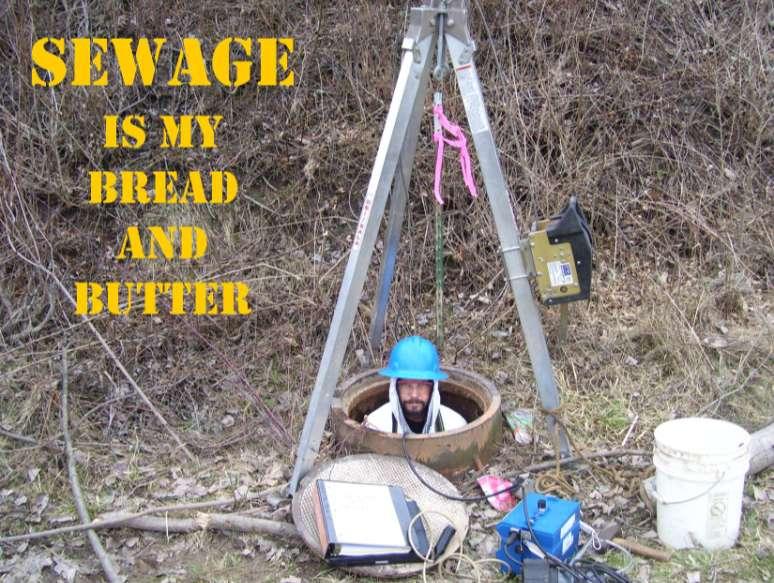
1 Flow Monitoring in the Collection System September 11, 2014 FISHBECK, THOMPSON, CARR, & HUBER INC. Lori Lloyd, PE, LEED AP BD+C
2

3 Definitions Why Flow Monitor? Flow Monitoring Applications Site Selection Lessons Learned Agenda
4 Flow (gpm) DWF Typical daily flow from the system 140 City of Niles Meter 3 18-inch DWF :00 AM 6:00 AM 12:00 PM 6:00 PM 12:00 AM Weekday DWF Weekend DWF Dry Weather Flow

5 DWI groundwater entering the sanitary sewer system through indirect paths like at pipe joints and lateral connections Dry Weather Infiltration
6 Flow (gpm) Rainfall (inches) WWF sewer flows in addition to DWF that occur during a precipitation event City of Ecorse Meter 10-7/27 Event 0 7/27/12 7/28/12 7/29/12 Wet Weather Flow Dry Weather Flow Rainfall Wet Weather Flow


7 RDII stormwater entering the sanitary sewer system through direct and indirect connections like catch basins, down spouts, and pipe joints Rainfall Dependent Inflow/Infiltration

8 Measure discharge for billing purposes Establish dry weather flow patterns Quantify and isolate wet weather flow Reasons to Flow Monitor

9 Credit: Alan Cressler Why Flow Monitor?

10 Sewage overflows Basements back ups Capacity assurance/ MDEQ compliance Transport and treatment costs Why Flow Monitor?
11 5/2 5/9 5/16 5/23 5/30 6/6 6/13 6/20 6/27 Flow (MGD) Flow (Gallons per day) Average Monthly Flow (gpd) Rainfall (In) Rainfall (Inches) I/I problem? MORs/WWTP data and lift station data 100 6,000, Meridian Lift Station Township Daily Flow City of Flint Monthly Flow WWTP Flows ,000,000 4,000, ,000, ,000, ,000, /1/11 12:00 AM 7/29/11 12:00 AM 8/26/11 12:00 AM 9/23/11 12:00 AM 10/21/11 12:00 AM 11/18/11 12:00 AM 12/16/11 12:00 AM 9.0 Feb Mar Apr May Jun Jul Aug Sep Oct Nov WWTP Raw Data Rainfall Main Flow 2009 Central 2010 Flow Total 2011 Flow 2012 Rainfall Who Needs to Flow Monitor?
 One Step in the Process")
12 I/I study Flow monitoring Modeling Sewer System evaluation study (SSES) One Step in the Process

13 Flow monitoring a decision-making tool Collect data used to model collection system Establish DWF patterns Identifying areas with high WWF Flow Monitoring Applications
14 Flow (gpm) Establish diurnal or seasonal flow patterns 150 Meter 7 12-inch DWF :00 AM 6:00 AM 12:00 PM 6:00 PM 12:00 AM Weekday DWF Weekend DWF Dry Weather Flow Patterns Diurnal Curve
15 Flow (gpm) 400 Saginaw Chippewa Indian Tribe Meter 2 15-inch DWF Weekday Weekend Dry Weather Flow Patterns Casino
16 Flow (gpm) 2500 City of Flint Meter 9 48-inch DWF :00 AM 6:00 AM 12:00 PM 6:00 PM 12:00 AM Weekday Weekend Dry Weather Flow Patterns Industrial
17 DWF Patterns Seasonal Variations
18 Flow (gpm) Rainfall (inches) 4, City Village of Lincoln of Baldwin Park Meter /14 5/9 Event 0.0 3, , , , , , /13/12 5/9/14 8/14/12 8/15/12 8/16/12 5/10/14 Wet Weather Wet Weather Flow Flow Dry Weather Dry Weather Flow Flow Rainfall Rainfall Wet Weather Flow Patterns

19 Flow monitoring process Installation Things to consider Ideal site Site Selection


20 Area Velocity Measurements Q = A x V V ISCO 2150 d Sigma 910 ISCO LaserFlow Marsh-McBirney Flo Dar Types of Flow Monitors


21 Monitoring program development Site selection and installation Data collection and handling Data analysis Flow Monitoring Process


22 Confined space certified personnel needed for installation Proper installation provides for accurate measurements and can prevent malfunctions and data loss Air Monitoring Installation

23 Program objectives Physical criteria Accessibility Security Budget Site Selection Considerations
24 Flow (gpm) Rainfall (inches) Meter 6 - Flow Chart 12, , ,000 1 FM MH 6, ,000 Ideal 2 2, /1/12 7/6/12 7/11/12 7/16/12 7/21/12 7/26/12 7/31/12 3 Raw Data Rainfall Ideal Site

25 Ideal Site
26 Flow (gpm) Rainfall (inches) 400 CSO #003 (24-inch) - Flow Chart MH FM Less Ideal 7/5/14 7/6/14 7/7/14 7/8/14 7/9/14 7/10/14 7/11/14 7/12/14 7/13/14 7/14/14 7/15/ Raw Data Rainfall Less Ideal Site

27 Less Ideal Site

28 Where to install flow monitors? Monitor all areas contributing to the WWTP or pump station Monitor areas of suspected high I/I Site Selection

29 Straight through manhole No other incoming sewers or laterals Adequate depth and velocity Not within the influence of a lift station No surcharging Easily accessible Free of excess grease or debris Ideal Site

30 Site Selection Lessons Learned

31 Site hydraulics Lift station Site access Grease/debris Site Selection Lessons Learned
32 Flow (gpm) Rainfall (inches) 1,600 Meter 8 - Flow Chart 0 1, ,200 1, Sensor 0 7/8/12 7/10/12 7/12/12 7/14/12 7/16/12 7/18/12 7/20/ Raw Data Rainfall Multiple Incoming pipes

33 Ideal Site?

34 Flow (gpm) Rainfall (inches) Meter 4 - Flow Chart Sensor /11/14 4/12/14 4/13/14 4/14/14 4/15/14 4/16/14 4/17/14 4/18/14 4/19/14 4/20/14 4/21/14 Raw Data Rainfall Low Depth
35 Flow (gpm) Rainfall (inches) Meter 1 WWTP 2, , , , Sensor /6/14 5/11/14 5/16/14 5/21/14 5/26/14 5/31/14 6/5/14 6/10/14 6/15/14 6/20/14 Raw Data 2 Rainfall Low Velocity
36 Flow (gpm) Rainfall (inches) 400 Meter 11 - Flow Chart /20/12 7/21/12 7/22/12 7/23/12 7/24/12 7/25/12 7/26/12 7/27/12 7/28/12 7/29/12 7/30/12 Raw Data Rainfall Lift Station Influence
37 Flow (gpm) Rainfall (inches) 5,000 Meter 4-4/15 Event 0.0 4, , , , , , , , /14/12 4/15/12 4/16/12 4/17/12 4/18/12 4/19/12 4/20/12 4/21/12 Wet Weather Flow Rainfall Lift Station Influence
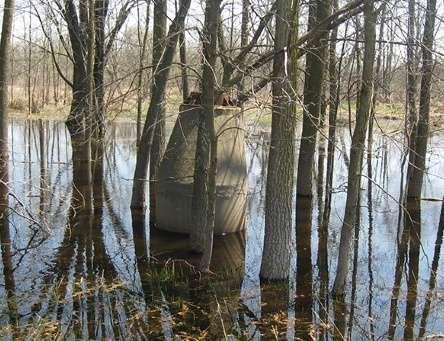
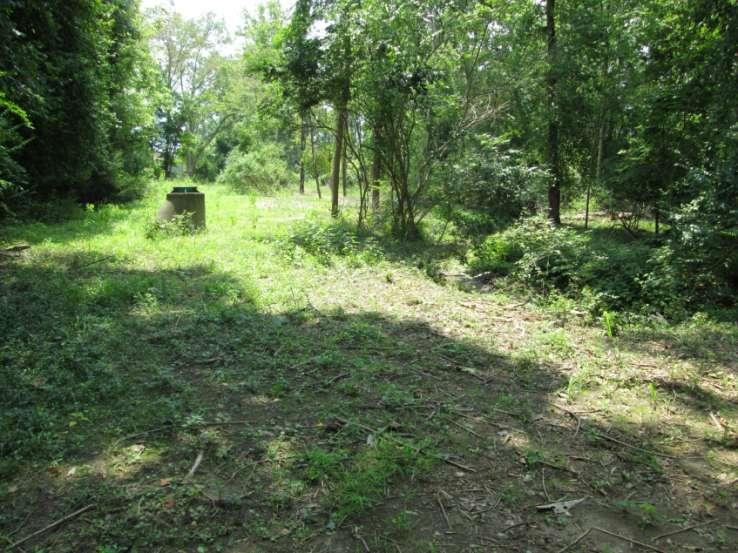
38 Accessibility


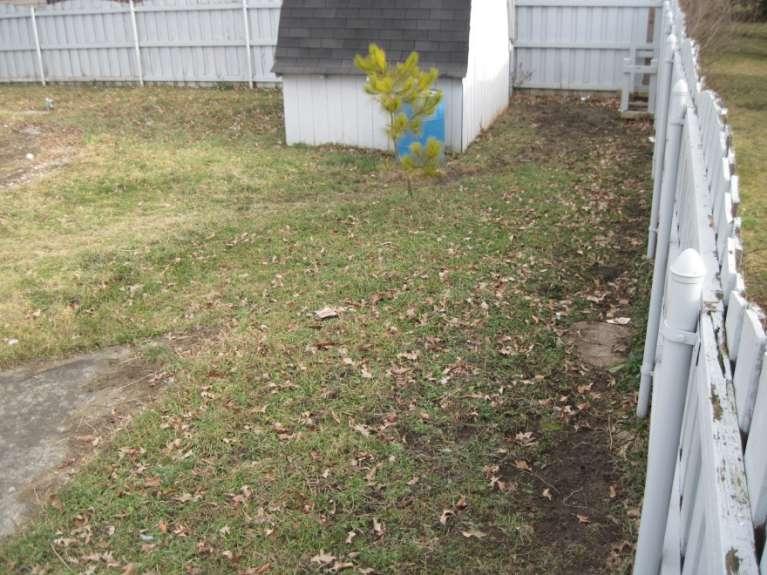
39 Accessibility
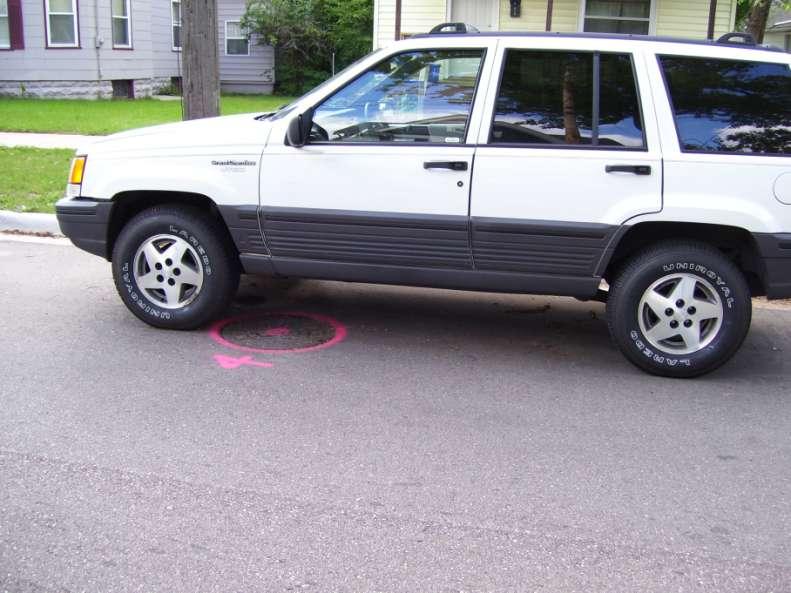
40 Accessibility
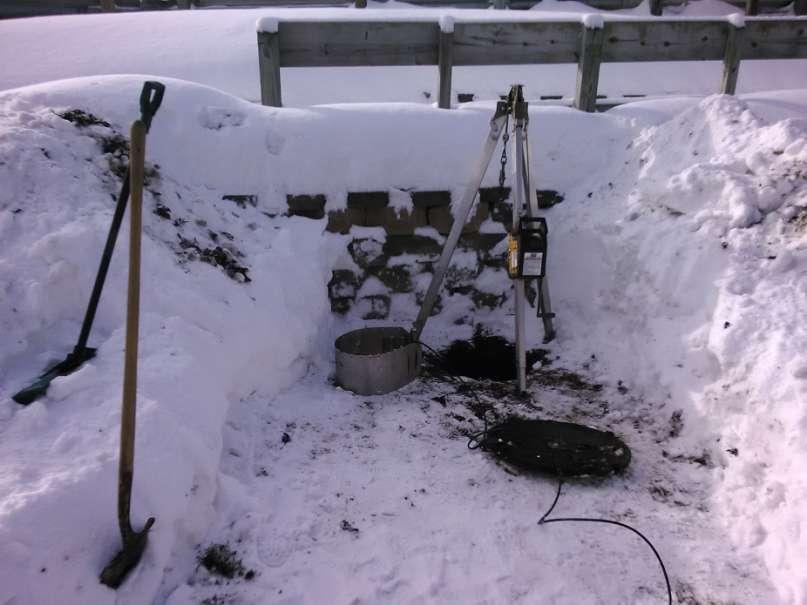
41 Accessibility
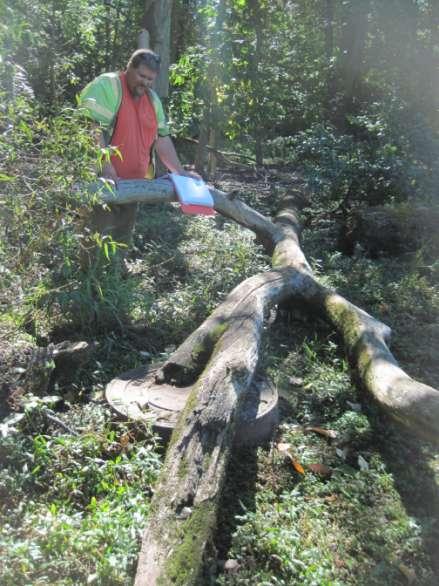
42 Accessibility
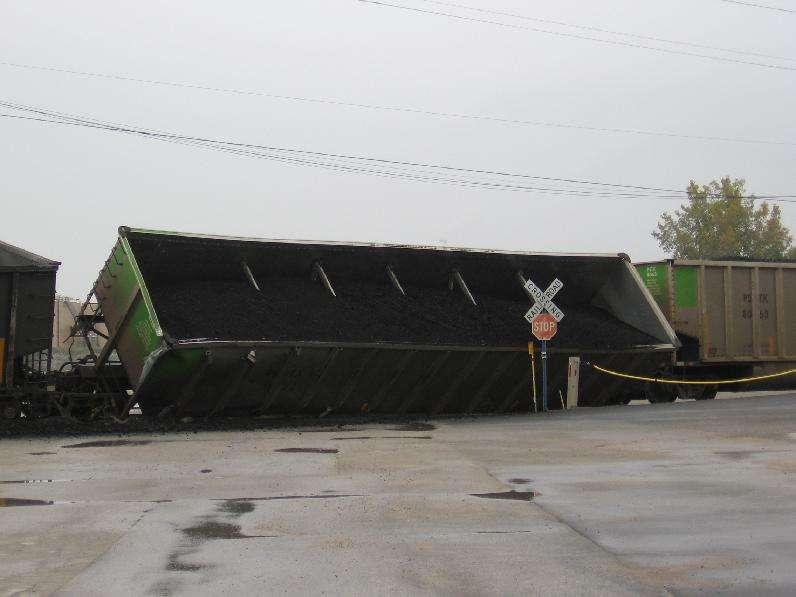
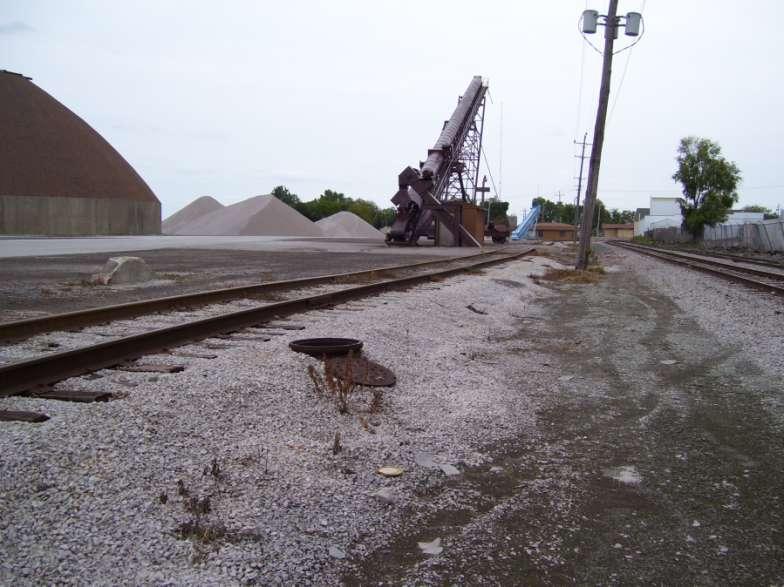
43 Accessibility
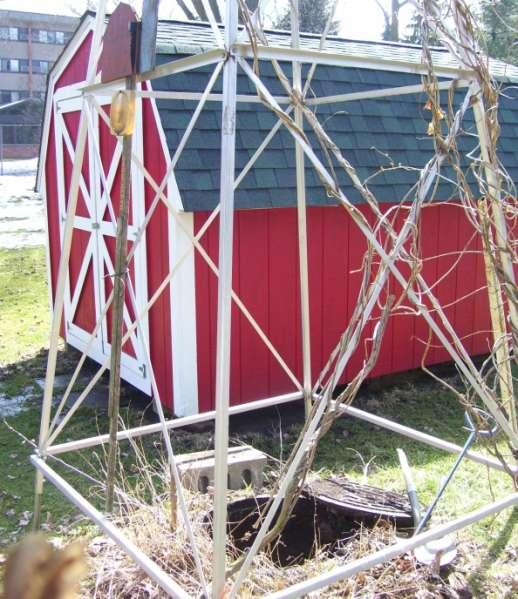
44 Accessibility
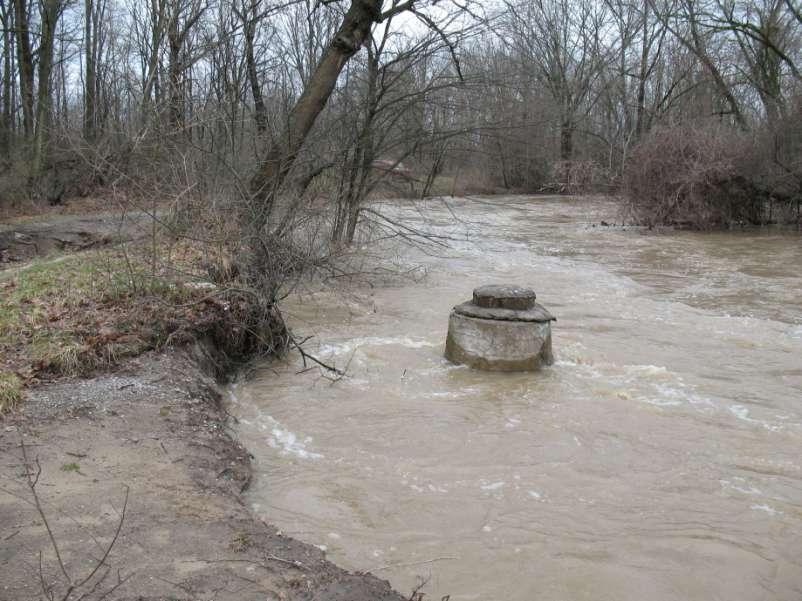
45 Accessibility
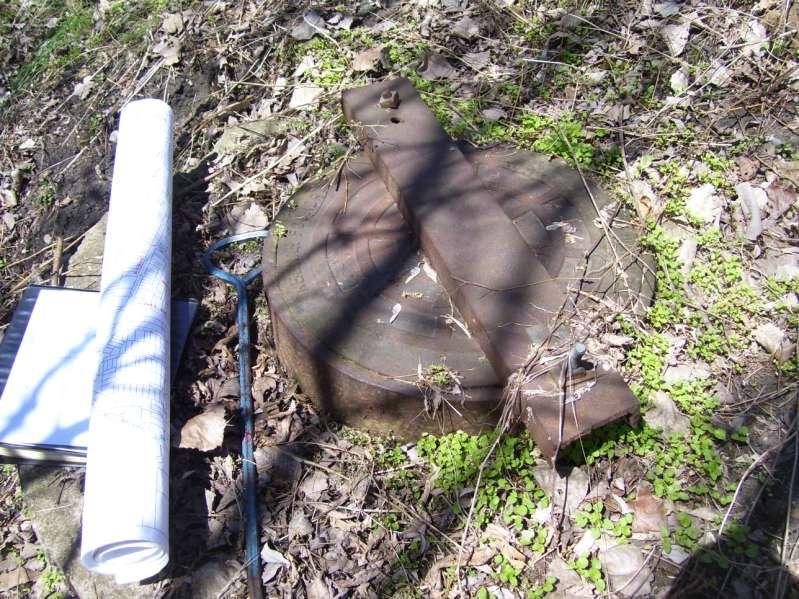
46 Accessibility/Security
47 Flow (gpm) Rainfall (inches) Meter 11 - Flow Chart 2, , , , /7/12 12/12/12 12/17/12 12/22/12 12/27/12 1/1/13 1/6/ Raw Data Rainfall Silt Covering Sensor

48 Silt and Seasonal Variation

49 Flow (gpm) Rainfall (inches) Meter 7 - Flow Chart /1/12 2/3/12 2/5/12 2/7/12 2/9/12 2/11/12 2/13/12 2/15/12 2/17/12 1 Grease on Sensor

50 Credit: Bill Lackey Ideal Site?
51 Know the objectives of your flow monitoring program Allow enough budget and time to collect necessary data Work closely with field staff when picking sites Flow vary greatly between systems and seasons Careful site selection can save time and money Conclusions
52 Thank You Questions? FISHBECK, THOMPSON, CARR, & HUBER INC.
Inflow and Infiltration. John Sorrell, P.E. City of Raleigh Public Utilities Department
 Inflow and Infiltration John Sorrell, P.E. City of Raleigh Public Utilities Department 1 Raleigh s History with I&I Our initial system was designed in 1888. Treatment began in the 1950 s What is I & I?
WASTEWATER FLOW COMPONENTS
 Chapter 3 WASTEWATER FLOW COMPONENTS 3.1 INTRODUCTION A sanitary sewer collection system receives two flow components: dry weather flow (DWF) and wet weather flow (WWF). The Base Wastewater Flow (BWF)
Sanitary Sewer Flow Monitoring and Inflow/Infiltration Study
 Sanitary Sewer Flow Monitoring and Inflow/Infiltration Study 2016/2017 Results & 2017/2018 Plan May 2, 2018 Angel Mejia, P.E., Project Manager Oliver Pohl, P.E., Sr. Project Engineer Nicole Kwan, P.E.,
Estimating Sewage System Flows
 9 Estimating Sewage System Flows DWSD Wholesale Sewer Rates 201 In this module, you will learn the sources of dry and wet weather flows and how these flows are estimated. Three different tools are used
Appendix A. City of Colusa Sanitary Sewer Flow Monitoring and Inflow/Infiltration Study
 Appendix A City of Colusa Sanitary Sewer Flow Monitoring and Inflow/Infiltration Study Site 3 Site 4 Site 5 Site 2 Site 1 SANITARY SEWER FLOW MONITORING AND INFLOW / INFILTRATION STUDY City of Colusa April
PRELIMINARY ENGINEERING REPORT FOR SANITARY SEWER COLLECTION SYSTEM OSKALOOSA, IOWA 2017
 PRELIMINARY ENGINEERING REPORT FOR SANITARY SEWER COLLECTION SYSTEM OSKALOOSA, IOWA 2017 PRELIMINARY ENGINEERING REPORT FOR SANITARY SEWER COLLECTION SYSTEM OSKALOOSA, IOWA 2017 I hereby certify that this
Clark Regional Wastewater District
 2016 Clark Regional Wastewater District Infiltration and Inflow Report For Salmon Creek Treatment Plant February 13, 2017 In Compliance with the NPDES Waste Discharge Permit No. WA-002363-9 Special Condition
Regression Analysis of the Variation in Rainfall Derived Inflow and Infiltration
 3 Regression Analysis of the Variation in Rainfall Derived Inflow and Infiltration Li Zhang, Fang Cheng, Gregory Barden, Hunter Kelly, Timothy Fallara and Edward Burgess Rainfall derived inflow and infiltration
Clark Regional Wastewater District
 2017 Clark Regional Wastewater District Infiltration and Inflow Report For Salmon Creek Treatment Plant February 12, 2018 In Compliance with the NPDES Waste Discharge Permit No. WA-002363-9 Special Condition
Application of Real-Time Rainfall Information System to CSO control. 2 October 2011 Naruhito Funatsu METAWATER Co., Ltd.
 Application of Real-Time Rainfall Information System to CSO control 2 October 2011 Naruhito Funatsu METAWATER Co., Ltd. Presentation Points Objectives To verify the applicability of the real-time rainfall
GAMINGRE 8/1/ of 7
 FYE 09/30/92 JULY 92 0.00 254,550.00 0.00 0 0 0 0 0 0 0 0 0 254,550.00 0.00 0.00 0.00 0.00 254,550.00 AUG 10,616,710.31 5,299.95 845,656.83 84,565.68 61,084.86 23,480.82 339,734.73 135,893.89 67,946.95
The City of Clearwater (City) collection
 collection") FWRJ A Matrix Approach to Prioritizing a Sewer Collection System Capital Improvement Plan Amanda Savage, Tara Kivett, Steven Cook, Eric Harold, and Ifetayo Venner The City of Clearwater (City) collection
FWRJ A Matrix Approach to Prioritizing a Sewer Collection System Capital Improvement Plan Amanda Savage, Tara Kivett, Steven Cook, Eric Harold, and Ifetayo Venner The City of Clearwater (City) collection
Impact of Inflow and Infiltration on Wastewater Assets
 Impact of Inflow and Infiltration on Wastewater Assets Nicole van Rooyen Matt Hardin School of Mechanical and Chemical Engineering Richard Forrest, Geoff Hughes and Cheryl Delport CEED Client: Water Corporation
January 22, Coronado National Forest 300 West Congress Street Tucson, AZ Jim Upchurch, Forest Supervisor. Dear Mr.
 January 22, 2015 Coronado National Forest 300 West Congress Street Tucson, AZ 85701 Attn: Jim Upchurch, Forest Supervisor Dear Mr. Upchurch: In your letter dated January 16, 2015, you requested that Hudbay
The University of Akron. William Troyer The Dr. Gary B. and Pamela S. Williams Honors College
 The University of Akron IdeaExchange@UAkron Honors Research Projects The Dr. Gary B. and Pamela S. Williams Honors College Spring 2018 Applying Control Logic to the End of the Ohio Canal Interceptor Tunnel
Integrating Weather Forecasts into Folsom Reservoir Operations
 Integrating Weather Forecasts into Folsom Reservoir Operations California Extreme Precipitation Symposium September 6, 2016 Brad Moore, PE US Army Corps of Engineers Biography Brad Moore is a Lead Civil
Stream Discharge and the Water Budget
 Regents Earth Science Unit 6: Water Cycle & Climate Name: Lab # Stream Discharge and the Water Budget Introduction: The United States Geological Survey (USGS) measures and publishes values for the daily
Mountain View Community Shuttle Monthly Operations Report
 Mountain View Community Shuttle Monthly Operations Report December 6, 2018 Contents Passengers per Day, Table...- 3 - Passengers per Day, Chart...- 3 - Ridership Year-To-Date...- 4 - Average Daily Ridership
Climate Adaptation Challenges for Boston s Water and Sewer Systems
 National Association of Flood & Stormwater Management Agencies Climate Adaptation Challenges for Boston s Water and Sewer Systems John P Sullivan P.E. October 15,2014 Boston 1630 Boston 1630-2012 Boston
Climatography of the United States No
 Climate Division: AK 5 NWS Call Sign: ANC Month (1) Min (2) Month(1) Extremes Lowest (2) Temperature ( F) Lowest Month(1) Degree s (1) Base Temp 65 Heating Cooling 90 Number of s (3) Jan 22.2 9.3 15.8
WHEN IS IT EVER GOING TO RAIN? Table of Average Annual Rainfall and Rainfall For Selected Arizona Cities
 WHEN IS IT EVER GOING TO RAIN? Table of Average Annual Rainfall and 2001-2002 Rainfall For Selected Arizona Cities Phoenix Tucson Flagstaff Avg. 2001-2002 Avg. 2001-2002 Avg. 2001-2002 October 0.7 0.0
WEST NORRITON TOWNSHIP
 WEST NORRITON TOWNSHIP SANITARY SEWER SYSTEM INFLOW AND INFILTRATION STUDY November 2013 Rettew Associates, Inc. 3020 Columbia Avenue Lancaster, PA 17603 RECOMMENDATIONS The top four priorities for inflow
SANITARY SEWER EVALUATION OF INFLOW/INFILTRATION REDUCTION TECHNIQUES. Geoffrey Trent VanAllen. A Thesis Submitted to the Faculty of
 SANITARY SEWER EVALUATION OF INFLOW/INFILTRATION REDUCTION TECHNIQUES by Geoffrey Trent VanAllen A Thesis Submitted to the Faculty of The College of Engineering and Computer Science in Partial Fulfillment
Nine Minimum Controls No. 2
 Nine Minimum Controls No. 2 2.0 MAXIMIZATION OF STORAGE IN THE COLLECTION SYSTEM 2.1 OVERVIEW The 2 nd NMC is titled Maximization of Storage in the Collection system. EPA s NMC Guidance explains that this
Disentangling Impacts of Climate & Land Use Changes on the Quantity & Quality of River Flows in Southern Ontario
 Disentangling Impacts of Climate & Land Use Changes on the Quantity & Quality of River Flows in Southern Ontario by Trevor Dickinson & Ramesh Rudra, Water Resources Engineering University of Guelph Acknowledgements
Memo. I. Executive Summary. II. ALERT Data Source. III. General System-Wide Reporting Summary. Date: January 26, 2009 To: From: Subject:
 Memo Date: January 26, 2009 To: From: Subject: Kevin Stewart Markus Ritsch 2010 Annual Legacy ALERT Data Analysis Summary Report I. Executive Summary The Urban Drainage and Flood Control District (District)
Sanitary Sewer Flow Monitoring Study City of Grandville
 Sanitary Sewer Flow Monitoring Study City of Grandville Prepared for: City of Grandville Kent County, Michigan Report by: Moore & Bruggink Consulting Engineers Grand Rapids, Michigan 13169.1 March 214
Jackson County 2013 Weather Data
 Jackson County 2013 Weather Data 61 Years of Weather Data Recorded at the UF/IFAS Marianna North Florida Research and Education Center Doug Mayo Jackson County Extension Director 1952-2008 Rainfall Data
Sewer, pressurization, differential pressure monitoring, fully dynamic hydraulic modeling, air displacement modeling.
 Using Dynamic Hydraulic Modeling to Understand Sewer Headspace Dynamics A Case Study of Metro Vancouver s Highbury Interceptor Yuko Suda, P.Eng. Kerr Wood Leidal Associates Ltd. 200-4185A Still Creek Drive
Leveraging GIS data and tools for maintaining hydraulic sewer models
 Leveraging GIS data and tools for maintaining hydraulic sewer models Ben Gamble & Joseph Koran Metropolitan Sewer District of Greater Cincinnati Carl C. Chan & Michael York CDM Smith Ben Gamble Senior
2003 Water Year Wrap-Up and Look Ahead
 2003 Water Year Wrap-Up and Look Ahead Nolan Doesken Colorado Climate Center Prepared by Odie Bliss http://ccc.atmos.colostate.edu Colorado Average Annual Precipitation Map South Platte Average Precipitation
2018 FINAL TOWN OF WAXHAW WASTEWATER SYSTEM PLANNING. Master Plan Addendum. Union County B&V PROJECT NO PREPARED FOR
 Black & Veatch Holding Company 2017. All rights reserved. 2018 FINAL TOWN OF WAXHAW WASTEWATER SYSTEM PLANNING Master Plan Addendum B&V PROJECT NO. 195982 PREPARED FOR Union County 7 MARCH 2018 Table of
Proposal to limit Namakan Lake to 1970 Upper Rule Curve for remainder of summer
 July 7, 214 Subject: Proposal to limit Namakan Lake to 197 Upper Rule Curve for remainder of summer Background: Flooding in 214 has resulted in the highest water levels on Namakan Lake since 1968, and
Taking the garbage out of energy modeling through calibration
 Taking the garbage out of energy modeling through calibration Presented to the Madison Chapter of ASHRAE February 8, 2016 Presented by Benjamin Skelton P.E. BEMP President, Cyclone Energy Group Acknowledgments
CSO Post-Construction Monitoring and Performance Assessment
 Massachusetts Water Resources Authority CSO Post-Construction Monitoring and Performance Assessment Jeremy R. Hall, Project Manager Operations/Engineering & Construction Wastewater Advisory Committee December
Impacts of climate change on flooding in the river Meuse
 Impacts of climate change on flooding in the river Meuse Martijn Booij University of Twente,, The Netherlands m.j.booij booij@utwente.nlnl 2003 in the Meuse basin Model appropriateness Appropriate model
THE STATE OF SURFACE WATER GAUGING IN THE NAVAJO NATION
 THE STATE OF SURFACE WATER GAUGING IN THE NAVAJO NATION Aregai Tecle Professor of Hydrology Northern Arizona University Flagstaff, AZ Acknowledgement Many thanks to my research team mates and Elisabeth
Low-flow Estimates for Cedar Creek at Galesburg, Illinois
 ISWS CR 587 ntract Report 587 Low-flow Estimates for Cedar Creek at Galesburg, Illinois by Krishan P. Singh and Robert S. Larson Office of Surface Water Resources: Systems, Information & GIS Prepared for
Communicating Climate Change Consequences for Land Use
 Communicating Climate Change Consequences for Land Use Site: Prabost, Skye. Event: Kyle of Lochalsh, 28 th February 28 Further information: http://www.macaulay.ac.uk/ladss/comm_cc_consequences.html Who
Climate Change Impact Assessment on Indian Water Resources. Ashvin Gosain, Sandhya Rao, Debajit Basu Ray
 Climate Change Impact Assessment on Indian Water Resources Ashvin Gosain, Sandhya Rao, Debajit Basu Ray Objectives of the Study To quantify the impact of the climate change on the water resources of the
PRELIMINARY DRAFT FOR DISCUSSION PURPOSES
 Memorandum To: David Thompson From: John Haapala CC: Dan McDonald Bob Montgomery Date: February 24, 2003 File #: 1003551 Re: Lake Wenatchee Historic Water Levels, Operation Model, and Flood Operation This
*Corresponding author,
 Monitoring the performance of a storm water separating manifold with DTS J.G. Langeveld 1,3*, C. de Haan 1,3, M. Klootwijk 2 and R.P.S. Schilperoort, 1,3 1 Royal Haskoning, Barbarossastraat 35, P.O. Box
You Call That Good Data? How to Survive a Consent Decree Flow Monitoring Program
 Hampton Roads Sanitation District You Call That Good Data? How to Survive a Consent Decree Flow Monitoring Program September 2011 You Call That Good Data? How to Survive a Consent Decree Flow Monitoring
Chiang Rai Province CC Threat overview AAS1109 Mekong ARCC
 Chiang Rai Province CC Threat overview AAS1109 Mekong ARCC This threat overview relies on projections of future climate change in the Mekong Basin for the period 2045-2069 compared to a baseline of 1980-2005.
Appendix BAL Baltimore, Maryland 2003 Annual Report on Freeway Mobility and Reliability
 (http://mobility.tamu.edu/mmp) Office of Operations, Federal Highway Administration Appendix BAL Baltimore, Maryland 2003 Annual Report on Freeway Mobility and Reliability This report is a supplement to:
Missouri River Basin Water Management Monthly Update
 Missouri River Basin Water Management Monthly Update Participating Agencies 255 255 255 237 237 237 0 0 0 217 217 217 163 163 163 200 200 200 131 132 122 239 65 53 80 119 27 National Oceanic and Atmospheric
Science Standard 1: Students analyze monthly precipitation and temperature records, displayed in bar charts, collected in metric units (mm).
.") Title: Precipitation Patterns across the Globe NSF GK-12 Fellow: Terry Legg Type of Lesson: STEM Grade Level(s): 4 th - 7 th grade This activity can be tailored to older, more advanced students by having
Title: Precipitation Patterns across the Globe NSF GK-12 Fellow: Terry Legg Type of Lesson: STEM Grade Level(s): 4 th - 7 th grade This activity can be tailored to older, more advanced students by having
REGULATORY, TECHNICAL AND MODELING CHALLENGES TO DEVELOPING A FREQUENCY BASED SSO CONTROL PROJECT IN WAYNE COUNTY, MICHIGAN
 REGULATORY, TECHNICAL AND MODELING CHALLENGES TO DEVELOPING A FREQUENCY BASED SSO CONTROL PROJECT IN WAYNE COUNTY, MICHIGAN Robert Czachorski, P.E., P.H., Orchard, Hiltz & McCliment, Inc. * John Baratta.
Typical Hydrologic Period Report (Final)
") (DELCORA) (Final) November 2015 (Updated April 2016) CSO Long-Term Control Plant Update REVISION CONTROL REV. NO. DATE ISSUED PREPARED BY DESCRIPTION OF CHANGES 1 4/26/16 Greeley and Hansen Pg. 1-3,
(DELCORA) (Final) November 2015 (Updated April 2016) CSO Long-Term Control Plant Update REVISION CONTROL REV. NO. DATE ISSUED PREPARED BY DESCRIPTION OF CHANGES 1 4/26/16 Greeley and Hansen Pg. 1-3,
YACT (Yet Another Climate Tool)? The SPI Explorer
? The SPI Explorer") YACT (Yet Another Climate Tool)? The SPI Explorer Mike Crimmins Assoc. Professor/Extension Specialist Dept. of Soil, Water, & Environmental Science The University of Arizona Yes, another climate tool for
YACT (Yet Another Climate Tool)? The SPI Explorer Mike Crimmins Assoc. Professor/Extension Specialist Dept. of Soil, Water, & Environmental Science The University of Arizona Yes, another climate tool for
Section A: National Data System Coding
 UNITED STATES ENVIRONMENTAL PROTECTION AGENCY Washington, D.C. 20460 NPDES Compliance Inspection Report Section A: National Data System Coding Form Approved OMB No. 2040-0003 Approval Expires 7-31-85 Transaction
Lessons Learned From Labs 21. Retrofitting of Chemistry Laboratories University of Toronto
 Lessons Learned From Labs 21 Retrofitting of Chemistry Laboratories University of Toronto Presented by: Mike Dymarski, PhD Technical and Administrative Manager Department of Chemistry University of Toronto.
Seasonal Hydrometeorological Ensemble Prediction System: Forecast of Irrigation Potentials in Denmark
 Seasonal Hydrometeorological Ensemble Prediction System: Forecast of Irrigation Potentials in Denmark Diana Lucatero 1*, Henrik Madsen 2, Karsten H. Jensen 1, Jens C. Refsgaard 3, Jacob Kidmose 3 1 University
PREDICTING SOIL SUCTION PROFILES USING PREVAILING WEATHER
 PREDICTING SOIL SUCTION PROFILES USING PREVAILING WEATHER Ronald F. Reed, P.E. Member, ASCE rreed@reed-engineering.com Reed Engineering Group, Ltd. 2424 Stutz, Suite 4 Dallas, Texas 723 214-3-6 Abstract
Technical Note: Hydrology of the Lukanga Swamp, Zambia
 Technical Note: Hydrology of the Lukanga Swamp, Zambia Matthew McCartney July 7 Description The Lukanga swamp is located approximately 5km west of the city of Kabwe, in the Central province of Zambia,
FEB DASHBOARD FEB JAN FEB MAR APR MAY JUN JUL AUG SEP OCT NOV DEC
 Positive Response Compliance 215 Compliant 215 Non-Compliant 216 Compliant 216 Non-Compliant 1% 87% 96% 86% 96% 88% 89% 89% 88% 86% 92% 93% 94% 96% 94% 8% 6% 4% 2% 13% 4% 14% 4% 12% 11% 11% 12% JAN MAR
Storm Sewer Design [2]
![Storm Sewer Design [2]](/thumbs/82/86956590.jpg "Storm Sewer Design [2]") Class 5 [1] Storm Sewer Design 9. Check Q < Qf and Vmax > vf > Vmin. Vmin is normally specified to avoid sedimentation. This will normally be 1.0 m/s at pipe full condition. (BS EN 752 suggests that for
Class 5 [1] Storm Sewer Design 9. Check Q < Qf and Vmax > vf > Vmin. Vmin is normally specified to avoid sedimentation. This will normally be 1.0 m/s at pipe full condition. (BS EN 752 suggests that for
Variability of Reference Evapotranspiration Across Nebraska
 Know how. Know now. EC733 Variability of Reference Evapotranspiration Across Nebraska Suat Irmak, Extension Soil and Water Resources and Irrigation Specialist Kari E. Skaggs, Research Associate, Biological
Attachment B to Technical Memorandum No.2. Operations Plan of Ross Valley Detention Basins
 Attachment B to Technical Memorandum No.2 Operations Plan of Ross Valley Detention Basins Operations Plan of Ross Valley Detention Basins Stetson Engineers Inc. January 26, 2011 1.0 Introduction Achieving
VILLAGE COUNCIL STORMWATER REPORT JULY 23, 2016 STORM EVENT
 VILLAGE COUNCIL STORMWATER REPORT JULY 23, 2016 STORM EVENT STORM RAINFALL AND RADAR IMAGERY Total rainfall 4.99 inches 2.74 inches between 5:40 and 7:10, then a lull until 9:30 2.04 inches between 9:30
ACCA Interactive Timetable
 ACCA Interactive Timetable 2018 Professional Version 3.1 Information last updated 1st May 2018 Please note: Information and dates in this timetable are subject to change. A better way of learning that
Missouri River Basin Water Management Monthly Update
 Missouri River Basin Water Management Monthly Update Participating Agencies 255 255 255 237 237 237 0 0 0 217 217 217 163 163 163 200 200 200 131 132 122 239 65 53 80 119 27 National Oceanic and Atmospheric
Jackson County 2018 Weather Data 67 Years of Weather Data Recorded at the UF/IFAS Marianna North Florida Research and Education Center
 Jackson County 2018 Weather Data 67 Years of Weather Data Recorded at the UF/IFAS Marianna North Florida Research and Education Center Doug Mayo Jackson County Extension Director 1952-2008 Rainfall Data
3301 East 120 th Avenue Assited Living & Memory Care
 UTILITY REPORT FOR 3301 East 120 th Avenue Assited Living & Memory Care 1 st Submittal January 23, 2016 2 nd Submittal March 04, 2016 Prepared for: 3301 E. 120 th Ave, LLC. 8200 E. Maplewood Ave., Suite
SYSTEM BRIEF DAILY SUMMARY
 SYSTEM BRIEF DAILY SUMMARY * ANNUAL MaxTemp NEL (MWH) Hr Ending Hr Ending LOAD (PEAK HOURS 7:00 AM TO 10:00 PM MON-SAT) ENERGY (MWH) INCREMENTAL COST DAY DATE Civic TOTAL MAXIMUM @Max MINIMUM @Min FACTOR
Missouri River Basin Water Management
 Missouri River Basin Water Management US Army Corps of Engineers Missouri River Navigator s Meeting February 12, 2014 Bill Doan, P.E. Missouri River Basin Water Management US Army Corps of Engineers BUILDING
Lessons Learned and Shared
 Lessons Learned and Shared Plan for the worst. Hope for the best. Remember that hope is not a strategy. Agnes 8 Lessons 1. Identify Susceptible Communities 2. Develop a Plan 3. Threat Recognition 4. Review
Changing Climate. An Engineering challenge for today and the future. Milwaukee School of Engineering December 2, 2015
 Changing Climate An Engineering challenge for today and the future David S. Liebl UW- Madison, EPD; UW-Extension; Wisconsin Initiative on Climate change Impacts Milwaukee School of Engineering December
Climatography of the United States No
 Month (1) Min (2) Month(1) Extremes Lowest (2) Temperature ( F) Lowest Month(1) Degree s (1) Base Temp 65 Heating Cooling 100 Number of s (3) 42.6 24.2 33.4 79 1950 25 44.2 1974-16 1994 19 18.8 1977 977
Process Behavior Analysis Understanding Variation
 Process Behavior Analysis Understanding Variation Steven J Mazzuca ASQ 2015-11-11 Why Process Behavior Analysis? Every day we waste valuable resources because we misunderstand or misinterpret what our
Jackson County 2014 Weather Data
 Jackson County 2014 Weather Data 62 Years of Weather Data Recorded at the UF/IFAS Marianna North Florida Research and Education Center Doug Mayo Jackson County Extension Director 1952-2008 Rainfall Data
STATISTICAL FORECASTING and SEASONALITY (M. E. Ippolito; )
") STATISTICAL FORECASTING and SEASONALITY (M. E. Ippolito; 10-6-13) PART I OVERVIEW The following discussion expands upon exponential smoothing and seasonality as presented in Chapter 11, Forecasting, in
STATISTICAL FORECASTING and SEASONALITY (M. E. Ippolito; 10-6-13) PART I OVERVIEW The following discussion expands upon exponential smoothing and seasonality as presented in Chapter 11, Forecasting, in
Eastlake Assited Living & Memory Care
 UTILITY REPORT FOR Eastlake Assited Living & Memory Care 1 st Submittal January 23, 2016 2 nd Submittal March 04, 2016 June 7, 2016 Final Submittal August 08, 2016 Prepared for: 3301 E. 120 th Ave, LLC.
2 Groundwater Basin Monitoring
 Zone 7 Water Agency 2 Groundwater Basin Monitoring Programs 2.1 Climatological Monitoring 2 Groundwater Basin Monitoring Programs This section describes Zone 7's Climatological Monitoring Program which
Climatography of the United States No
 Month (1) Min (2) Month(1) Extremes Lowest (2) Temperature ( F) Lowest Month(1) Degree s (1) Base Temp 65 Heating Cooling 100 Number of s (3) Jan 63.9 39.3 51.6 86 1976 16 56.6 1986 20 1976 2 47.5 1973
Climatography of the United States No
 Temperature ( F) Month (1) Min (2) Month(1) Extremes Lowest (2) Lowest Month(1) Degree s (1) Base Temp 65 Heating Cooling 100 Number of s (3) Jan 32.8 21.7 27.3 62 1918 1 35.8 1983-24 1950 29 10.5 1979
UWM Field Station meteorological data
 University of Wisconsin Milwaukee UWM Digital Commons Field Station Bulletins UWM Field Station Spring 992 UWM Field Station meteorological data James W. Popp University of Wisconsin - Milwaukee Follow
February 10, Mr. Jeff Smith, Chairman Imperial Valley Water Authority E County Road 1000 N Easton, IL Dear Chairman Smith:
 February 1, 1 Mr. Jeff Smith, Chairman Imperial Valley Water Authority 8 E County Road 1 N Easton, IL Dear Chairman Smith: The Illinois State Water Survey (ISWS), under contract to the Imperial Valley
How are adding integers and subtracting integers related? Work with a partner. Use integer counters to find 4 2. Remove 2 positive counters.
 . How are adding integers and subtracting integers related? ACTIVITY: Work with a partner. Use integer counters to find 4. Start with 4 positive counters. Remove positive counters. What is the total number
Global Climates. Name Date
 Global Climates Name Date No investigation of the atmosphere is complete without examining the global distribution of the major atmospheric elements and the impact that humans have on weather and climate.
San Francisco Public Utilities Commission Hydrological Conditions Report For March 2016
 San Francisco Public Utilities Commission Hydrological Conditions Report For March 2016 J. Chester, C. Graham, A. Mazurkiewicz, & M. Tsang, April 7, 2016 Snow Surveyor Chris Graham crossing Huckleberry
CHAPTER 2 SOLUTIONS. Given: 333 houses; AWWA household average demand. a. The AWWA average household water use is 1,320 L/d
 CHAPTER 2 SOLUTIONS 2-1 Subdivision Demand Given: 333 houses; AWWA household average demand a. The AWWA average household water use is 1,320 L/d b. For the average day (333 houses)(1,320 L/d) = 439, 560
In Centre, Online Classroom Live and Online Classroom Programme Prices
 In Centre, and Online Classroom Programme Prices In Centre Online Classroom Foundation Certificate Bookkeeping Transactions 430 325 300 Bookkeeping Controls 320 245 225 Elements of Costing 320 245 225
Computing & Telecommunications Services
 Computing & Telecommunications Services Monthly Report September 214 CaTS Help Desk (937) 775-4827 1-888-775-4827 25 Library Annex helpdesk@wright.edu www.wright.edu/cats/ Table of Contents HEAT Ticket
Water Management for Environmental Restoration Flows In the Big Bend reach, Rio Grande Rio Bravo
 University of California, Davis Department of Land, Air and Water Resources Water Management for Environmental Restoration Flows In the Big Bend reach, Rio Grande Rio Bravo 46 th Annual Meeting 8 9 March,
Three main areas of work:
 Task 2: Climate Information 1 Task 2: Climate Information Three main areas of work: Collect historical and projected weather and climate data Conduct storm surge and wave modeling, sea-level rise (SLR)
Climatography of the United States No
 Climate Division: CA 1 NWS Call Sign: Month (1) Min (2) Month(1) Extremes Lowest (2) Temperature ( F) Lowest Month(1) Degree s (1) Base Temp 65 Heating Cooling 100 Number of s (3) Jan 52.4 35.4 43.9 69
SYSTEM BRIEF DAILY SUMMARY
 SYSTEM BRIEF DAILY SUMMARY * ANNUAL MaxTemp NEL (MWH) Hr Ending Hr Ending LOAD (PEAK HOURS 7:00 AM TO 10:00 PM MON-SAT) ENERGY (MWH) INCREMENTAL COST DAY DATE Civic TOTAL MAXIMUM @Max MINIMUM @Min FACTOR
Climatography of the United States No
 Climate Division: CA 7 NWS Call Sign: Month (1) Min (2) Month(1) Extremes Lowest (2) Temperature ( F) Lowest Month(1) Degree s (1) Base Temp 65 Heating Cooling 100 Number of s (3) 44.5 29.3 36.9 69 1951
Climatography of the United States No
 Climate Division: CA 4 NWS Call Sign: Month (1) Min (2) Month(1) Extremes Lowest (2) Temperature ( F) Lowest Month(1) Degree s (1) Base Temp 65 Heating Cooling 100 Number of s (3) Jan 61.9 42.0 52.0 89
The Huong River the nature, climate, hydro-meteorological issues and the AWCI demonstration project
 The Huong River the nature, climate, hydro-meteorological issues and the AWCI demonstration project 7th GEOSS AP Symposium, the AWCI parallel session May 27, 214, Tokyo National Centre for Hydro-Meteorological
Climatography of the United States No
 Climate Division: CA 6 NWS Call Sign: Month (1) Min (2) Month(1) Extremes Lowest (2) Temperature ( F) Lowest Month(1) Degree s (1) Base Temp 65 Heating Cooling 100 Number of s (3) Jan 66.1 38.3 52.2 91
Climatography of the United States No
 Climate Division: CA 6 NWS Call Sign: Month (1) Min (2) Month(1) Extremes Lowest (2) Temperature ( F) Lowest Month(1) Degree s (1) Base Temp 65 Heating Cooling 100 Number of s (3) 68.5 45.7 57.1 90 1971
Climatography of the United States No
 Climate Division: CA 1 NWS Call Sign: Month (1) Min (2) Month(1) Extremes Lowest (2) Temperature ( F) Lowest Month(1) Degree s (1) Base Temp 65 Heating Cooling 1 Number of s (3) Jan 56.2 4.7 48.5 79 1962
Climatography of the United States No
 Climate Division: CA 2 NWS Call Sign: Month (1) Min (2) Month(1) Extremes Lowest (2) Temperature ( F) Lowest Month(1) Degree s (1) Base Temp 65 Heating Cooling 100 Number of s (3) Jan 55.6 38.8 47.2 81
Climatography of the United States No
 Climate Division: CA 5 NWS Call Sign: Month (1) Min (2) Month(1) Extremes Lowest (2) Temperature ( F) Lowest Month(1) Degree s (1) Base Temp 65 Heating Cooling 100 Number of s (3) 59.3 31.5 45.4 80 1976
Climatography of the United States No
 Climate Division: CA 2 NWS Call Sign: Month (1) Min (2) Month(1) Extremes Lowest (2) Temperature ( F) Lowest Month(1) Degree s (1) Base Temp 65 Heating Cooling 100 Number of s (3) 53.3 37.1 45.2 77 1962
Climatography of the United States No
 Climate Division: CA 2 NWS Call Sign: Month (1) Min (2) Month(1) Extremes Lowest (2) Temperature ( F) Lowest Month(1) Degree s (1) Base Temp 65 Heating Cooling 100 Number of s (3) Jan 53.5 37.6 45.6 78
Climatography of the United States No
 Climate Division: CA 2 NWS Call Sign: Month (1) Min (2) Month(1) Extremes Lowest (2) Temperature ( F) Lowest Month(1) Degree s (1) Base Temp 65 Heating Cooling 100 Number of s (3) 53.3 31.8 42.6 74+ 1975
Climatography of the United States No
 Climate Division: CA 4 NWS Call Sign: Month (1) Min (2) Month(1) Extremes Lowest (2) Temperature ( F) Lowest Month(1) Degree s (1) Base Temp 65 Heating Cooling 100 Number of s (3) Jan 61.4 33.1 47.3 82+