Nowcasting US GDP: The role of ISM Business Surveys
|
|
|
- Lynne Bradley
- 6 years ago
- Views:
Transcription
1 Nowcasting US GDP: The role of ISM Business Surveys Kajal Lahiri George Monokroussos Preliminary - Comments are welcome Department of Economics - University at Albany, SUNY y December 2010 Abstract We study the role of the well-known monthly di usion indices produced by the Institute for Supply Management in nowcasts (current-quarter forecasts) of US GDP growth. We investigate their marginal impact on these nowcasts when large unbalanced (jagged edge) macroeconomic data sets are used to generate them. We nd some evidence that these ISM indices can be helpful in improving the nowcasts in the beginning of the month (which is the point when new ISM information becomes available every month). JEL Classi cation: C33, C53. KEYWORDS: Nowcasting, Forecasting, ISM, PMI, factor models, Kalman lter. The authors thank Domenico Giannone and David Small for making available the data and code that were used in Giannone, Reichlin, and Small (2008) and in Giannone, Modugno, Reichlin, and Small (2010). George Monokroussos would like to thank the Research Department of the Federal Reserve Bank of Boston for its hospitality. y Lahiri: Department of Economics, University at Albany, SUNY, Business Administration Building, Room 110, 1400 Washington Avenue, Albany, NY klahiri@albany.edu. Monokroussos: Department of Economics, University at Albany, SUNY, Business Administration Building, Room 110, 1400 Washington Avenue, Albany, NY gmonokroussos@albany.edu 1
2 1 Introduction: ISM variables and their role in nowcasting The Institute for Supply Management (ISM) produces a well known monthly report on business conditions based on rms responses to a questionnaire it sends out every month. Business executives are asked about their rms s production, employment, inventory levels, etc., and their responses are then used to construct di usion, or summary indices of business activity. These diffusion indices can be useful tools in assessing the current state of various sectors and of the economy in general. Most prominently, their combination index, the Purchasing Managers Index (PMI) for manufacturing sectors, and, to a lesser extent, their new Non-Manufacturing Index (NMI), is a very well known economic indicator that always receives publicity and is closely watched by those aiming to get a head start in forecasting the economy s movements in real time. As Koenig (2002) discusses, the PMI, and by extension the ISM di usion indices in general, have two main advantages: First, and most importantly, it s timeliness: New ISM manufacturing information comes out on the rst business day of every month (and the ISM non-manufacturing variables shortly afterwards) and it contains the reports based on the previous month s questionnaires. No other economic variable of such importance becomes available rst thing every month, on a consistent basis 1. Second, ISM data are typically subject to at most small revisions, presumably because of their nature as survey responses. As such, they preserve most of the real-time nature that is crucial in many estimation and forecasting exercises (see, inter alia, Orphanides (2002), Koenig et al (2003), etc.) Furthermore, ISM variables and the PMI in particular have been shown to have forecasting power for GDP and the business cycle. For instance, Dasgupta and Lahiri (1993) have shown that the PMI can be useful in forecasting GDP changes; similar results on the performance of the PMI as a leading indicator include Klein and Moor (1991), Dasgupta and Lahiri (1992), Kau man (1999), Koenig (2002) and Lindsey and Pavur (2005). While this literature has had a long and interesting history, there has been intense interest over the last few years and an increasing number of important contributions in nowcasting, which is the task of predicting the present, the very recent past, or the very near future of GDP, and some other macro variables as well. Such important contributions are, inter alia, Evans (2005), Banbura 1 Payroll information is released by the Labor Department on the rst Friday of every month. 2
3 et al (2010), Giannone et al (2008, 2010), Kuzin et al (forthcoming), Barhoumi et al (2010). This nowcasting literature takes advantage of recent advances in factor models and related techniques that allow researchers to extract useful information from large data sets with many variables and thus deliver forecasting gains. While we do not want to discard any variables that could be potentially useful in forecasting GDP, directly employing a large model with many variables would require estimating a large number of parameters, which of course would compromise the estimated model s forecasting performance. Factor models, that the nowcasting literature employ, manage to deal successfully with that issue. An additional challenge that comes with this task of extracting the maximum amount of useful information from these large data sets in real time is that as new data releases arrive throughout the quarter they are incorporated at various times into these panels, which are thus unbalanced panels, or have jagged edges. The nowcasting literature typically employs standard Kalman ltering techniques to deal with this issue of di erent variables having di erent endpoints at any given point in time. This paper s goal is to bring together the older literature on ISM and PMI with the new literature on nowcasting. In particular, and while the PMI has been studied as a potential nowcasting tool largely in isolation in the past, this paper revisits the PMI and other ISM variables within the context of the large jagged data sets employed in nowcasting. For that purpose, we adopt the approach of the seminal paper of Giannone, Reichlin, and Small (2008) - henceforth GRS. GRS employ a dynamic factor model and the Kalman smoother to nowcast US GDP. We revisit some of their work, while paying closer attention to individual ISM variables and their role in nowcasting GDP. The rest of this paper is organized as follows: Section 2 provides some historical background and more details on the ISM and the di usion indices it produces. Section 3 summarizes the econometric approach of GRS that we employ in the paper. Section 4 presents results from our nowcasting exercises with various ISM variables. Finally, Section 5 o ers some concluding remarks. 3
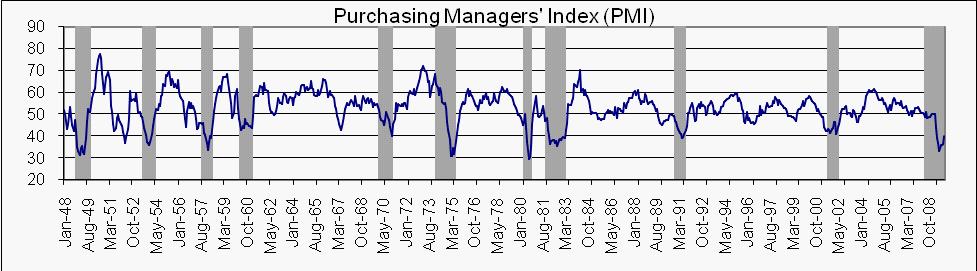
4 2 ISM data: A closer look Starting in 1948, the ISM (formerly known as NAPM, the National Association of Purchasing Management) has been sending every month a national survey to a sample of purchasing and supply executives of more than 400 companies in 20 manufacturing industries across the U.S. The resulting report containing the data compiled from the survey responses is the Manufacturing ISM Report on Business (ROB). These survey responses re ect the change in the current month over the previous one for 10 indicators which are new orders, production, employment, supplier deliveries, inventories, customers inventories, prices, backlog of orders, exports, and imports. Di usion indexes are then created based on the responses to these survey questions. For instance, for production, the possible responses to the question What is the trend for production? are positive, neutral or negative (compared to the preceding month). The resulting di usion index is created by adding the percentage of positive responses to half the percentage of the neutral responses. This number varies between 0 and 100 and it represents the percent of companies that increased their production during the month. Basically, a level above 50 indicates that more executives are reporting increase for that variable than are reporting decrease. Di usion indices are then seasonally adjusted 2. The Purchasing Managers Index (PMI) is the equally weighted (0.20 each) 3 composite index of ve of these seasonally adjusted di usion indexes: New Orders, Production, Employment, Supplier Deliveries and Inventories. These indexes are given in gure 1 4. The composite index PMI again ranges from 0 to 100, with 50 again being the critical reference. ISM speci es a reading above 2 The details of this seasonal adjustment are available in: 3 When the PMI was rst introduced in 1980 by Thedore Torda, a senior economist of the US Department of Commerce, it was constructed as an equally weighted composite index of ve of the ten seasonally adjusted di usion indexes which are the results of the ISM manufacturing survey: new orders, production, employment, supplier deliveries and inventories. The PMI was back-calculated prior to 1980, and is available starting in In 1982, the US Department of Commerce changed the weights of these ve di usion indexes in order to maximize the relationship between the PMI and the GDP. The new weights were 0.30 for New Orders, 0.25 for production, 0.20 for Employment, 0.15 for Supplier deliveries and 0.10 for Inventories (Torda 1985). Several studies have discussed the plausibility of using fewer components and di erent weights which can improve the PMI. Pelaez (2003a) proposed an alternative to PMI, which is based on regressions of the growth rate of GDP and industrial production index on current and lagged values of PMI components. The weights were allowed to evolve over time in one version and remained xed in another. Pelaez (2003b) used an index composed of three of the PMI components (new orders, employment and supplier deliveries). Cho and Ogwang (2006) used only the employment component of PMI. Cho and Ogwang (2007) applied principal component analysis using six of the ten non-manufacturing di usion indexes to compose a non-manufacturing PMI. In 2008, ISM eventually returned to equal weights. 4 The shaded areas in the 5 panels of the gure are the National Bureau of Economic Research (NBER) de ned economic recessions. 4
5 (below) 50 as indicating that the manufacturing sector is in expansion (contraction). Similarly, a PMI above 41.2 indicates an expansion of the overall economy. Therefore, the PMI below 41.2 indicates contraction in both the overall economy and the manufacturing sector. Some studies even de ne the critical reference as 47 for expansion of the manufacturing sector and 42 for expansion of the economy (Koenig 2002). The index is released at 10:00 a.m. EST on the rst business day of each month, requires little revision, and is widely recognized by many economists and business practitioners as a reliable short-term barometer of economic activity ( Dasgupta and Lahiri 1993). While, and as discussed earlier, these are clearly desirable features, there are disadvantages to the PMI as well: One such drawback is simply a result of the PMI being a di usion index: Its increases or decreases do not capture the intensity with which business conditions are changing. Furthermore, the PMI doesn t account for size di erences across rms: As such, it may miss important shifts in business conditions if, for instance, such shifts are primarily concentrated in a few large rms. For our purposes the ultimate criterion is to what extent the PMI helps nowcast GDP, especially in the context of the many other variables that can be used for that purpose. Figure 2 plots the PMI and we can clearly see there that there is a strong, yet far from perfect relationship between the PMI and the business cycle. In what follows we investigate more explicitly the importance of the PMI and of the other ISM manufacturing indices in nowcasting GDP. In addition to these manufacturing indices, the ISM has begun composing non-manufacturing indices as well. While services isn t nearly as cyclical as the manufacturing sector is, it is well known that the share of manufacturing in the economy has dropped dramatically over the last half century. In that context, non-manufacturing di usion indices seem central to achieving better coverage of the economy. The non-manufacturing Report on Business becomes available at the beginning of each month soon after the manufacturing ROB, and it is again based on survey questions (asked of 375 executives in 16 non-manufacturing industries across the country). There are 10 non-manufacturing seasonally adjusted ISM di usion indices: business activity, new orders, employment, supplier deliveries, backlog of orders, new export orders, inventory change, inventory sentiment, imports and prices. There is also a composite Non-Manufacturing Index (NMI) which is available only since 2008, however. This NMI is based on business activity, new orders, em- 5
6 ployment, and supplies deliveries. Figure 3, which plots these 4 time series, con rms that their relationship with the business cycle is not as strong; nevertheless in what follows we pay some attention to these indices as well. 3 Nowcasting GDP using the framework of Giannone, Reichlin, and Small The approach of GRS that we employ combines a dynamic factor framework with the Kalman smoother. It thus deals with both central challenges associated with nowcasting, (as discussed in the introduction, namely the large number of variables with a potential proliferation of parameters, and the jagged edges of the data set). Furthermore, it has the potential to capture essential dynamics in the various time series of the panel. The rest of this section summarizes the GRS approach, keeping their notation intact. The reader is referred to their paper for more detailed information. It is assumed that the information included in the large number of explanatory variables is captured by a few common factors: x tjj = + F t + tjj (1) where x tjj is an n 1 vector of observed explanatory variables 5 available in vintage j (j = 1; :::; J), in month. In practice GRS create 15 vintages per month (so 45 in a quarter) based on their analysis of the pattern of data releases every month (this pattern is about the same across months, which justi es this approach). F t is an r 1 vector of the common factors and is an n r matrix of factor loadings. The dynamics of the common factors are modeled as follows: F t = AF t 1 + Bu t (2) where u t is a q 1 white noise vector of shocks to the common factors and B is an r q matrix of rank q. A is an r r matrix with all roots of det(i r Az) lying outside the unit circle. GRS 5 These variables have been transformed to induce stationarity. We keep GRS s transformations intact, and thus refer the reader to (the appendix to) GRS for the details. 6
7 parameterize (and make a robustness case for) their benchmark speci cation with r = q = 2 and we keep the same parameterization in what follows. Note that the idiosyncratic error terms tjj are assumed to be cross-sectional orthogonal white noises and also orthogonal to shocks u t. Note that with equations (1) and (2) we have a state space framework and we can thus apply standard Kalman ltering techniques to estimate the common factors, given parameter estimates. GRS proceed with the estimation as follows: First, they apply principal components to a balancedpanel subset of the original jagged-edge data set 6 and estimate the parameters above by OLS regressions on these principal components. Then the common factors are estimated by running the Kalman smoother using the entire (thus unbalanced) data set, where parameter estimates replace true parameter values in the state space speci cation above. Given such estimates of the common factors, GDP nowcasts emerge simply as the tted values from OLS regressions of the quarterly GDP series on these quarterly estimated factors 7. The jagged edge data set that GRS have put together consists of close to 200 macro variables for the US economy starting in January of These variables, most of which are at the monthly frequency, and which include real and monetary quantities, prices, surveys, are grouped into blocks, or vintages, 15 per month, on the basis of a stylized calendar of monthly data releases that remains (mostly) unchanged across months. The data set is updated every Friday with any and all releases that are available at that point. Therefore we essentially have a series of overlapping, real-time sets with any later data set di ering from previous ones for one or both of two possible reasons: updated gures for a given observation(s) of one or more variables in the data set, and/or more recent observations for one or more variables in the data set. The data that we use in what follows is this GRS data 8, which includes the ISM manufacturing variables discussed earlier, but not the ISM non-manufacturing series. We include several nonmanufacturing ISM di usion indices 9 into some of our exercises below. 6 This balanced panel is created by discarding observations that are not available for all the variables. 7 Unlike the GDP series, most of the observables in the GRS data set come at the monthly frequency; GRS thus transform them by applying a lter that converts the monthly series to an (approximately) quarterly quantity when observed at the end of a quarter. Thus the OLS regressions are run at the quarterly frequency for both the dependent variable and the regressors. This is GRS s approach to the more simplistic bridge regressions of standard nowcasting practice. 8 The data, which were kindly provided to us by David Small, are the series used in Giannone et al (2010), minus a few proprietary series. 9 Namely inventories, new orders, deliveries, employment, business activity. As discussed earlier, the composite non-manufacturing NMI index is too short to include in our data. 7
8 4 Assessing the Nowcasting Performance of ISM variables Our goal in this section is to evaluate the ISM variables (both when considered in isolation and when bundled together) performance in nowcasting GDP, always in the context of an environment where many macro variables are part of our information set at any point in time within any quarter. Other recent work (for instance, and in addition to GRS, see Banbura et al (2010) ) has stressed the importance of the timeliness issue when it comes to survey data s impact on nowcasts. Timeliness must certainly be a central factor when it comes to the ISM data in particular; as discussed earlier, the ISM manufacturing indices become available rst thing every month and their non-manufacturing counterparts come out soon after that. In this section we dig deeper into this issue of the signi cance of ISM variables because of their timeliness, and speci cally, we ask the following 3 questions: You re right at the end of month 1 or the beginning of month, and your task is to nowcast (or forecast, if month 1 is the last month of the previous quarter) GDP for the quarter in which month belongs. First, do ISM data help in this task? Second, which (any or all) ISM variables do help and what s the role of PMI in this task? Third, what s the added value, if any, of non-manufacturing ISM data? Our rst take in attempting to answer these questions is by looking at various quarters in isolation; for each of these quarters we consider di erent scenarios where we nowcast using information available in real time at the very beginning of a month, and then add one or more ISM indices to our information set and see how this a ects the nowcasts in relation to the revised quantities for quarterly GDP growth rates. In our rst exercise we look at quarters right before and during the Great Recession, and we turn to the details of this next. 4.1 Nowcasting with ISM during the Great Recession We consider 6 quarters starting in 2007 Q4 and ending in 2009 Q1. For each of these quarters, we do the following exercises: First, we produce a forecast for quarterly GDP growth rate for the rst month of the quarter, say month, on the basis of the information set that would have been available in real time at the very end of month 1, or early in the morning of the rst business day of month ; that is, 8
9 right before month s ISM manufacturing release becomes available 10. Then we produce similar nowcasts for months + 1 and + 2. Second, we generate an additional 5 nowcasts by augmenting the information set just described with each of the 5 di usion indices (one at a time) that are part of the PMI: New Orders, Production, Employment, Supplier Deliveries and Inventories. Third, we repeat this exercise introducing all 5 indices at the same time, the PMI on its own, and all 5 indices together with the PMI. We thus have 9 nowcasts in total, which are to be assessed in terms of how far they are from the revised GDP series 11. The results for the 6 quarters are summarized in Figures 4-9, which contain a straight solid line (the revised GDP gure) and three additional lines for the three months of the quarter. Looking at these gures, we can reach some tentative conclusions 12 : In every case there s helpful information in ISM indices for nowcasting; but it s not always all the indices that help. Furthermore, and on the basis of these 6 quarters, it s not possible to securely identify any individual indices that consistently overperform or underperform. ISM indices taken together however (either with free weights or the PMI) do tend to improve nowcasts most of the time. As we progress to later months within a quarter, nowcasts tend to move closer to the target number (revised GDP growth estimate), but it also tends to get harder for ISM information - the 5 indices taken together - to have a signi cant marginal impact on the nowcasts (obtained with no ISM information). In times of high volatility however (consider quarters 2 and 3 in 2008, where revised GDP growth drops from 1.5% to -2.7%) we see the model producing poor nowcasts 13, which deteriorate or fail to improve as we progress in the quarter, and ISM indices fail to substantially alter that picture. We investigate the role of non-manufacturing ISM indices in a similar manner: We generate nowcasts using information at the beginning of the month with no ISM data, and then we see how 10 As discussed earlier, we have a sequence of sets that contain real-time data as they are available on Fridays. We do some manual adjustments to these Friday data sets on a case by case basis and according to the calendar of data releases to create the information sets we need for our purposes. 11 We use gures available on Friday April Realizing of course that they are based on information obtained from a small number of quarters only. 13 Presumably because of biased or noisy data revisions 9
10 these nowcasts change when we introduce non-manufacturing ISM indices - either on their own or together with the PMI. Results of one such exercise for 2009 Q1 are provided in Figure 10. We can see from there that the role of non-manufacturing ISM information is not as helpful as its manufacturing counterpart in improving the nowcasts 14. We re currently working on extensions and additional exercises, including investigating the role of ISM manufacturing indices during more quarters, looking more deeply into the role of non-manufacturing indices, and assessing nowcast uncertainty. 5 Concluding remarks to be added References Barhoumi, K., G. Runstler, R. Cristadoro, A. Den Reijer, A. Jakaitiene, P. Jelonek, A. Rua, K., Ruth, S. Benk and C. Van Nieuwenhuyze (2008): "Short-Term Forecasting of GDP Using Large Monthly Datasets: A Pseudo Real-Time Forecast Evaluation Exercise", NER - E #215, Banque De France. Banbura, M., D. Giannone, and L. Reichlin (2010): "Nowcasting", in Michael P. Clements and David F. Hendry, editors, Oxford Handbook on Economic Forecasting, forthcoming. Cho, D.I., Ogwang, T., 2006, Conceptual Perspectives on Selecting the Principal Variables in the Purchasing Managers Index, The Journal of Supply Chain Management, vol. 42, no. 2, pp (9). Cho, D.I., Ogwang, T., 2007, A Conceptual Framework for Computing U.S. Non-manufacturing PMI Indexes, The Journal of Supply Chain Management, vol. 43, no.3, pp Dasgupta, S., and K. Lahiri (1992): "A Comparative Study of Alternative Methods of Quantifying Qualitative Survey Responses Using NAPM Data," Journal of Business and Economic Statistics 10(4), Perhaps this comes as no surprise given the relatively weaker relationship between the non-manufacturing indices and the business cycle, (Figure 3). However, more experiments with more quarters under currently under way. 10
11 Dasgupta, S., and K. Lahiri (1993): "On the Use of Dispersion Measures from NAPM Surveys in Business Cycle Forecasting," Journal of Forecasting 12(3&4), Evans, M.D.D. (2005): "Where are we now? Real-time estimates of the macro economy", International Journal of Central Banking 1(2) Giannone, D., M. Modugno, L. Reichlin, and D. Small (2010): "Nowcasting in Real-Time", mimeo. Giannone, D., L. Reichlin, and D. Small (2008): "Nowcasting: The real-time informational content of macroeconomic data", Journal of Monetary Economics (55), Kau man, Ralph (1999): "Indicator Qualities of the NAPM Report on Business", The Journal of Supply Chain Management 35(2), Klein, P.A. and G.H. Moore (1991): "Purchasing Management Survey Data: Their Value as Leading Indicators", in Lahiri, K., and G.H. Moore (Eds.) Leading Economic Indicators: New Approach and Forecasting Records, Cambridge University Press, Koenig, Evan (2002): "Using the Purchasing Managers Index to Assess the Economy s Strength and the Likely Direction of Monetary Policy", Economic and Financial Policy Review, Federal Reserve Bank of Dallas 1(6). Koenig, E.F., S. Dolmas, and J. Piger (2003): "The use and abuse of real-time data in economic forecasting", The Review of Economics and Statistics 85(3) Kuzin, V., M. Marcellino, and C. Schumaker (forthcoming) MIDAS vs Mixed-Frequency VAR for Nowcasting GDP in the Euro Area, International Journal of Forecasting (forthcoming). Lindsey, M.D., and R. Pavur (2005): "As the PMI turns: A Tool for Supply Chain Managers", The Journal of Supply Chain Management 41(3), Orphanides, Athanasios (2002): "Monetary-Policy Rules and the Great In ation", American Economic Review 92(2), Pelaez, R.F., 2003a, A New Index Outperforms the Purchasing Managers Index, Quarterly Journal of Business and Economics, vol. 42, no.1, pp
12 Pelaez, R.F., 2003b, A Reassessment of the Purchasing Managers Index, The Journal of National Association for Business Economics, vol. 38, no. 4, pp Torda, T.S., 1985, Purchasing Management Index Provides Early Clue on Turning Points, Business America, U.S. Department of Commerce, pp


13 Figure 1: components of the Purchasing Managers Index (PMI) Source: Institute for Supply Management Figure 2: Purchasing Managers Index (PMI) 13
")

14 Figure 3: The Non Manufacturing Index (NMI) and its four components Source: Institute for Supply Management 14
15 Figure 4: 2007 Q No ISM Prod. only Empl. only Inv/ries only New Or. only Supl Del. only All 5 PMI only All October November December GDP growth Figure 5: 2008 Q No ISM Prod. only Empl. only Inv/ries only New Or. only Supl Del. only All 5 PMI only All January February March GDP growth 15
16 Figure 6: 2008 Q No ISM Prod. only Empl. only Inv/ries only New Or. only Supl Del. only All 5 PMI only All April May June GDP growth Figure 7: 2008 Q No ISM Prod. only Empl. only Inv/ries only New Or. only Supl Del. only All 5 PMI only All 2 3 July August September GDP growth 16
17 Figure 8: 2008 Q No ISM Prod. only Empl. only Inv/ries only New Or. only Supl Del. only All 5 PMI only All October November December GDP growth Figure 9: 2009 Q1 0 1 No ISM Prod. only Empl. only Inv/ries only New Or. only Supl Del. only All 5 PMI only All January February March GDP growth 17
18 Figure 10: Manufacturing vs. Non Manufacturing, 2009Q1 0 No ISM Mnf only Non Mnf only Non Mnf & PMI January February March GDP growth 18
Nowcasting US GDP: The role of ISM Business Surveys
 Nowcasting US GDP: The role of ISM Business Surveys Kajal Lahiri George Monokroussos Department of Economics - University at Albany, SUNY y March 11 Abstract We study the role of the well-known monthly
NOWCASTING REPORT. Updated: September 23, 2016
 NOWCASTING REPORT Updated: September 23, 216 The FRBNY Staff Nowcast stands at 2.3% and 1.2% for 216:Q3 and 216:Q4, respectively. Negative news since the report was last published two weeks ago pushed
NOWCASTING REPORT. Updated: October 21, 2016
 NOWCASTING REPORT Updated: October 21, 216 The FRBNY Staff Nowcast stands at 2.2% for 216:Q3 and 1.4% for 216:Q4. Overall this week s news had a negative effect on the nowcast. The most notable developments
NOWCASTING REPORT. Updated: April 15, 2016
 NOWCASTING REPORT Updated: April 15, 2016 GDP growth prospects remain moderate for the rst half of the year: the nowcasts stand at 0.8% for 2016:Q1 and 1.2% for 2016:Q2. News from this week's data releases
e Yield Spread Puzzle and the Information Content of SPF forecasts
 Economics Letters, Volume 118, Issue 1, January 2013, Pages 219 221 e Yield Spread Puzzle and the Information Content of SPF forecasts Kajal Lahiri, George Monokroussos, Yongchen Zhao Department of Economics,
ESRI Research Note Nowcasting and the Need for Timely Estimates of Movements in Irish Output
 ESRI Research Note Nowcasting and the Need for Timely Estimates of Movements in Irish Output David Byrne, Kieran McQuinn and Ciara Morley Research Notes are short papers on focused research issues. Nowcasting
Volume 38, Issue 2. Nowcasting the New Turkish GDP
 Volume 38, Issue 2 Nowcasting the New Turkish GDP Barış Soybilgen İstanbul Bilgi University Ege Yazgan İstanbul Bilgi University Abstract In this study, we predict year-on-year and quarter-on-quarter Turkish
NOWCASTING REPORT. Updated: May 5, 2017
 NOWCASTING REPORT Updated: May 5, 217 The FRBNY Staff Nowcast stands at 1.8% for 217:Q2. News from this week s data releases reduced the nowcast for Q2 by percentage point. Negative surprises from the
NOWCASTING REPORT. Updated: May 20, 2016
 NOWCASTING REPORT Updated: May 20, 2016 The FRBNY Staff Nowcast for GDP growth in 2016:Q2 is 1.7%, half a percentage point higher than last week. Positive news came from manufacturing and housing data
NOWCASTING REPORT. Updated: July 20, 2018
 NOWCASTING REPORT Updated: July 20, 2018 The New York Fed Staff Nowcast stands at 2.7% for 2018:Q2 and 2.4% for 2018:Q3. News from this week s data releases decreased the nowcast for 2018:Q2 by 0.1 percentage
NOWCASTING REPORT. Updated: September 7, 2018
 NOWCASTING REPORT Updated: September 7, 2018 The New York Fed Staff Nowcast stands at 2.2% for 2018:Q3 and 2.8% for 2018:Q4. News from this week s data releases increased the nowcast for 2018:Q3 by 0.2
Is the Purchasing Managers Index a Reliable Indicator of GDP Growth?
 Is the Purchasing Managers Index a Reliable Indicator of GDP Growth? Some Evidence from Indian Data i c r a b u l l e t i n Suchismita Bose Abstract Purchasing Managers Index (PMI) surveys have been developed
NOWCASTING REPORT. Updated: January 4, 2019
 NOWCASTING REPORT Updated: January 4, 2019 The New York Fed Staff Nowcast stands at 2.5% for 2018:Q4 and 2.1% for 2019:Q1. News from this week s data releases left the nowcast for both quarters broadly
NOWCASTING REPORT. Updated: August 17, 2018
 NOWCASTING REPORT Updated: August 17, 2018 The New York Fed Staff Nowcast for 2018:Q3 stands at 2.4%. News from this week s data releases decreased the nowcast for 2018:Q3 by 0.2 percentage point. Negative
Nowcasting Norwegian GDP
 Nowcasting Norwegian GDP Knut Are Aastveit and Tørres Trovik May 13, 2007 Introduction Motivation The last decades of advances in information technology has made it possible to access a huge amount of
NOWCASTING REPORT. Updated: September 14, 2018
 NOWCASTING REPORT Updated: September 14, 2018 The New York Fed Staff Nowcast stands at 2.2% for 2018:Q3 and 2.8% for 2018:Q4. This week s data releases left the nowcast for both quarters broadly unchanged.
NOWCASTING REPORT. Updated: February 22, 2019
 NOWCASTING REPORT Updated: February 22, 2019 The New York Fed Staff Nowcast stands at 2.3% for 2018:Q4 and 1.2% for 2019:Q1. News from this week s data releases increased the nowcast for both 2018:Q4 and
NOWCASTING REPORT. Updated: November 30, 2018
 NOWCASTING REPORT Updated: November 30, 2018 The New York Fed Staff Nowcast for 2018:Q4 stands at 2.5%. News from this week s data releases left the nowcast for 2018:Q4 broadly unchanged. A negative surprise
NOWCASTING THE NEW TURKISH GDP
 CEFIS WORKING PAPER SERIES First Version: August 2017 NOWCASTING THE NEW TURKISH GDP Barış Soybilgen, İstanbul Bilgi University Ege Yazgan, İstanbul Bilgi University Nowcasting the New Turkish GDP Barış
Nowcasting and Short-Term Forecasting of Russia GDP
 Nowcasting and Short-Term Forecasting of Russia GDP Elena Deryugina Alexey Ponomarenko Aleksey Porshakov Andrey Sinyakov Bank of Russia 12 th ESCB Emerging Markets Workshop, Saariselka December 11, 2014
NOWCASTING GDP IN GREECE: A NOTE ON FORECASTING IMPROVEMENTS FROM THE USE OF BRIDGE MODELS
 South-Eastern Europe Journal of Economics 1 (2015) 85-100 NOWCASTING GDP IN GREECE: A NOTE ON FORECASTING IMPROVEMENTS FROM THE USE OF BRIDGE MODELS DIMITRA LAMPROU * University of Peloponnese, Tripoli,
A Comparison of Business Cycle Regime Nowcasting Performance between Real-time and Revised Data. By Arabinda Basistha (West Virginia University)
") A Comparison of Business Cycle Regime Nowcasting Performance between Real-time and Revised Data By Arabinda Basistha (West Virginia University) This version: 2.7.8 Markov-switching models used for nowcasting
A Comparison of Business Cycle Regime Nowcasting Performance between Real-time and Revised Data By Arabinda Basistha (West Virginia University) This version: 2.7.8 Markov-switching models used for nowcasting
Short Term Forecasts of Euro Area GDP Growth
 Short Term Forecasts of Euro Area GDP Growth Elena Angelini European Central Bank Gonzalo Camba Mendez European Central Bank Domenico Giannone European Central Bank, ECARES and CEPR Lucrezia Reichlin London
The Superiority of Greenbook Forecasts and the Role of Recessions
 The Superiority of Greenbook Forecasts and the Role of Recessions N. Kundan Kishor University of Wisconsin-Milwaukee Abstract In this paper, we examine the role of recessions on the relative forecasting
Markov-Switching Models with Endogenous Explanatory Variables. Chang-Jin Kim 1
 Markov-Switching Models with Endogenous Explanatory Variables by Chang-Jin Kim 1 Dept. of Economics, Korea University and Dept. of Economics, University of Washington First draft: August, 2002 This version:
Nowcasting GDP with Real-time Datasets: An ECM-MIDAS Approach
 Nowcasting GDP with Real-time Datasets: An ECM-MIDAS Approach, Thomas Goetz, J-P. Urbain Maastricht University October 2011 lain Hecq (Maastricht University) Nowcasting GDP with MIDAS October 2011 1 /
Nowcasting: The Real-Time Informational Content of Macroeconomic Data
 Nowcasting: The Real-Time Informational Content of Macroeconomic Data Domenico Giannone*; European Central Bank, ECARES and CEPR Lucrezia Reichlin, European Central Bank and CEPR David Small, Board of
The Case of Japan. ESRI CEPREMAP Joint Workshop November 13, Bank of Japan
 New Monthly Estimation Approach for Nowcasting GDP Growth: The Case of Japan ESRI CEPREMAP Joint Workshop November 13, 2014 Naoko Hara Bank of Japan * Views expressed in this paper are those of the authors,
Panel on Macroeconomic Forecasting and Nowcasting
 Panel on Macroeconomic Forecasting and Nowcasting Domenico Giannone, Federal Reserve Bank of New York 2018 CARE Conference Firm-level Information and the Macroeconomy Disclaimer: The views expressed herein
Discussion of Juillard and Maih Estimating DSGE Models with Observed Real-Time Expectation Data
 Estimating DSGE Models with Observed Real-Time Expectation Data Jesper Lindé Federal Reserve Board Workshop on Central Bank Forecasting Kansas City Fed October 14-15, 2010 Summary of paper This interesting
4- Current Method of Explaining Business Cycles: DSGE Models. Basic Economic Models
 4- Current Method of Explaining Business Cycles: DSGE Models Basic Economic Models In Economics, we use theoretical models to explain the economic processes in the real world. These models de ne a relation
A multi-country approach to forecasting output growth using PMIs
 A multi-country approach to forecasting output growth using PMIs Alexander Chudik Federal Reserve Bank of Dallas, CAFE and CIMF Valerie Grossman Federal Reserve Bank of Dallas Hashem Pesaran University
Lucrezia Reichlin London Business School & Now-Casting Economics Ltd and Silvia Miranda Agrippino, Now-Casting Economics Ltd
 NOW-CASTING AND THE REAL TIME DATA FLOW Lucrezia Reichlin London Business School & Now-Casting Economics Ltd and Silvia Miranda Agrippino, Now-Casting Economics Ltd PRESENTATION AT BIS, HONG KONG 22 ND
The Econometric Analysis of Mixed Frequency Data with Macro/Finance Applications
 The Econometric Analysis of Mixed Frequency Data with Macro/Finance Applications Instructor: Eric Ghysels Structure of Course It is easy to collect and store large data sets, particularly of financial
Euro-indicators Working Group
 Euro-indicators Working Group Luxembourg, 9 th & 10 th June 2011 Item 9.4 of the Agenda New developments in EuroMIND estimates Rosa Ruggeri Cannata Doc 309/11 What is EuroMIND? EuroMIND is a Monthly INDicator
Matteo Luciani. Lorenzo Ricci
 Nowcasting Norway Matteo Luciani SBS EM, ECARES, Université Libre de Bruxelless and FNRS Lorenzo Ricci SBS EM, ECARES,, Université Libre de Bruxelles ECARES working paper 203 0 ECARES ULB - CP 4/ /04 50,
Euro-indicators Working Group
 Euro-indicators Working Group Luxembourg, 9 th & 10 th June 2011 Item 9.3 of the Agenda Towards an early warning system for the Euro area By Gian Luigi Mazzi Doc 308/11 Introduction Clear picture of economic
Program. The. provide the. coefficientss. (b) References. y Watson. probability (1991), "A. Stock. Arouba, Diebold conditions" based on monthly
 References. y Watson. probability (1991), A. Stock. Arouba, Diebold conditions based on monthly") Macroeconomic Forecasting Topics October 6 th to 10 th, 2014 Banco Central de Venezuela Caracas, Venezuela Program Professor: Pablo Lavado The aim of this course is to provide the basis for short term
Macroeconomic Forecasting Topics October 6 th to 10 th, 2014 Banco Central de Venezuela Caracas, Venezuela Program Professor: Pablo Lavado The aim of this course is to provide the basis for short term
Chapter 1. GMM: Basic Concepts
 Chapter 1. GMM: Basic Concepts Contents 1 Motivating Examples 1 1.1 Instrumental variable estimator....................... 1 1.2 Estimating parameters in monetary policy rules.............. 2 1.3 Estimating
A Nonparametric Approach to Identifying a Subset of Forecasters that Outperforms the Simple Average
 A Nonparametric Approach to Identifying a Subset of Forecasters that Outperforms the Simple Average Constantin Bürgi The George Washington University cburgi@gwu.edu Tara M. Sinclair The George Washington
Where Are We Now? Real-Time Estimates of the Macro Economy
 Where Are We Now? Real-Time Estimates of the Macro Economy Martin D. D. Evans Georgetown University and the NBER March 2005 Forthcoming in The International Journal of Central Banking Abstract This paper
Business Cycle Dating Committee of the Centre for Economic Policy Research. 1. The CEPR Business Cycle Dating Committee
 Business Cycle Dating Committee of the Centre for Economic Policy Research Michael Artis Fabio Canova Jordi Gali Francesco Giavazzi Richard Portes (President, CEPR) Lucrezia Reichlin (Chair) Harald Uhlig
Revisiting Initial Jobless Claims as a Labor Market Indicator. John Carter Braxton May 2013; Revised March 2014 RWP 13-03
 Revisiting Initial Jobless Claims as a Labor Market Indicator John Carter Braxton May 2013; Revised March 2014 RWP 13-03 Revisiting Initial Jobless Claims as a Labor Market Indicator John Carter Braxton
Package nowcasting. April 25, Type Package
 Type Package Package nowcasting April 25, 2018 Title Nowcast Analysis and Create Real-Time Data Basis Version 0.1.3 Depends R (>= 3.4.0) Date 2018-04-25 Maintainer Daiane Marcolino de Mattos
Assessing the Real-Time Informational Content of Macroeconomic Data Releases for Now-/Forecasting GDP: Evidence for Switzerland
 Assessing the Real-Time Informational Content of Macroeconomic Data Releases for Now-/Forecasting GDP: Evidence for Switzerland Boriss Siliverstovs Konstantin A. Kholodilin December 5, 2009 Abstract This
Nowcasting the Finnish economy with a large Bayesian vector autoregressive model
 Nowcasting the Finnish economy with a large Bayesian vector autoregressive model Itkonen,J. & Juvonen,P. Suomen Pankki Conference on Real-Time Data Analysis, Methods and Applications 19.10.2017 Introduction
Quarterly Bulletin 2018 Q3. Topical article Gauging the globe: the Bank s approach to nowcasting world GDP. Bank of England 2018 ISSN
 Quarterly Bulletin 2018 Q3 Topical article Gauging the globe: the Bank s approach to nowcasting world GDP Bank of England 2018 ISSN 2399-4568 Topical articles The Bank s approach to nowcasting world GDP
NBER WORKING PAPER SERIES WHERE ARE WE NOW? REAL-TIME ESTIMATES OF THE MACRO ECONOMY. Martin D.D. Evans
 NBER WORKING PAPER SERIES WHERE ARE WE NOW? REAL-TIME ESTIMATES OF THE MACRO ECONOMY Martin D.D. Evans Working Paper 11064 http://www.nber.org/papers/w11064 NATIONAL BUREAU OF ECONOMIC RESEARCH 1050 Massachusetts
D Agostino, Antonello; McQuinn, Kieran and O Brien, Derry European Central Bank, Central Bank of Ireland, Central Bank of Ireland
 MPRA Munich Personal RePEc Archive Nowcasting Irish GDP D Agostino, Antonello; McQuinn, Kieran and O Brien, Derry European Central Bank, Central Bank of Ireland, Central Bank of Ireland 2011 Online at
Methods for Pastcasting, Nowcasting and Forecasting Using Factor-MIDAS*
 Methods for Pastcasting, Nowcasting and Forecasting Using Factor-MIDAS* Hyun Hak Kim 1 and Norman R. Swanson 2 1 Kookmin University 2 Rutgers University August 2016 Abstract We provide a synthesis of methods
1 A Non-technical Introduction to Regression
 1 A Non-technical Introduction to Regression Chapters 1 and Chapter 2 of the textbook are reviews of material you should know from your previous study (e.g. in your second year course). They cover, in
Factor-MIDAS for now- and forecasting with ragged-edge data: A model comparison for German GDP 1
 Factor-MIDAS for now- and forecasting with ragged-edge data: A model comparison for German GDP 1 Massimiliano Marcellino Università Bocconi, IGIER and CEPR massimiliano.marcellino@uni-bocconi.it Christian
Indicator Models for Private Consumption
 93 Indicator Models for Private Consumption Jonas Sørensen, Economics INTRODUCTION AND SUMMARY Private consumption accounts for around half of Denmark's gross domestic product, GDP, and is therefore an
Surprise indexes and nowcasting: why do markets react to macroeconomic news?
 Introduction: surprise indexes Surprise indexes and nowcasting: why do markets react to macroeconomic news? Alberto Caruso Confindustria and Université libre de Bruxelles Conference on Real-Time Data Analysis,
UPPSALA UNIVERSITY - DEPARTMENT OF STATISTICS MIDAS. Forecasting quarterly GDP using higherfrequency
 UPPSALA UNIVERSITY - DEPARTMENT OF STATISTICS MIDAS Forecasting quarterly GDP using higherfrequency data Authors: Hanna Lindgren and Victor Nilsson Supervisor: Lars Forsberg January 12, 2015 We forecast
Warwick Business School Forecasting System. Summary. Ana Galvao, Anthony Garratt and James Mitchell November, 2014
 Warwick Business School Forecasting System Summary Ana Galvao, Anthony Garratt and James Mitchell November, 21 The main objective of the Warwick Business School Forecasting System is to provide competitive
Short-term forecasts of euro area real GDP growth: an assessment of real-time performance based on vintage data Marie Diron European Central Bank*
 Short-term forecasts of euro area real GDP growth: an assessment of real-time performance based on vintage data Marie Diron European Central Bank* This draft: April 2005 Abstract Economic policy makers,
Charting Employment Loss in North Carolina Textiles 1
 P. Conway 14 January 2004 Charting Employment Loss in North Carolina Textiles 1 The job losses in North Carolina manufacturing, and the textiles industry in particular, are most often attributed to the
Incorporating Conjunctural Analysis in Structural Models
 Incorporating Conjunctural Analysis in Structural Models Domenico Giannone, European Central Bank, ECARES and CEPR Francesca Monti, ECARES, Université Libre de Bruxelles Lucrezia Reichlin, London Business
WORKING PAPER SERIES SURVEY-BASED NOWCASTING OF US GROWTH A REAL-TIME FORECAST COMPARISON OVER MORE THAN 40 YEARS NO 1455 / AUGUST 2012
 WORKING PAPER SERIES NO 1455 / AUGUST 2012 SURVEY-BASED NOWCASTING OF US GROWTH A REAL-TIME FORECAST COMPARISON OVER MORE THAN 40 YEARS by Antonello D Agostino and Bernd Schnatz In 2012 all ECB publications
A bottom-up approach for forecasting GDP in a data rich environment. António Rua. Banco de Portugal. July 2016
 A bottom-up approach for forecasting GDP in a data rich environment Francisco Dias Banco de Portugal António Rua Banco de Portugal Maximiano Pinheiro Banco de Portugal July 2016 Abstract In an increasingly
03/RT/11 Real-Time Nowcasting of GDP: Factor Model versus Professional Forecasters
 03/RT/11 Real-Time Nowcasting of GDP: Factor Model versus Professional Forecasters Joëlle Liebermann Real-Time Nowcasting of GDP: Factor Model versus Professional Forecasters Joëlle Liebermann Central
Nowcasting. Domenico Giannone Université Libre de Bruxelles and CEPR
 Nowcasting Domenico Giannone Université Libre de Bruxelles and CEPR 3rd VALE-EPGE Global Economic Conference Business Cycles Rio de Janeiro, May 2013 Nowcasting Contraction of the terms Now and Forecasting
Short-term forecasting for empirical economists. A survey of the recently proposed algorithms
 Short-term forecasting for empirical economists. A survey of the recently proposed algorithms Maximo Camacho Universidad de Murcia mcamacho@um.es Gabriel Perez-Quiros Banco de España and CEPR gabriel.perez@bde.es
WORKING PAPER NO THE CONTINUING POWER OF THE YIELD SPREAD IN FORECASTING RECESSIONS
 WORKING PAPER NO. 14-5 THE CONTINUING POWER OF THE YIELD SPREAD IN FORECASTING RECESSIONS Dean Croushore Professor of Economics and Rigsby Fellow, University of Richmond and Visiting Scholar, Federal Reserve
A Global Trade Model for the Euro Area
 A Global Trade Model for the Euro Area Antonello D Agostino, a Michele Modugno, b and Chiara Osbat c a Rokos Capital Management b Federal Reserve Board c European Central Bank We propose a model for analyzing
Economics Discussion Paper Series EDP Measuring monetary policy deviations from the Taylor rule
 Economics Discussion Paper Series EDP-1803 Measuring monetary policy deviations from the Taylor rule João Madeira Nuno Palma February 2018 Economics School of Social Sciences The University of Manchester
Real-Time Nowcasting Nominal GDP Under Structural Break
 Real-Time Nowcasting Nominal GDP Under Structural Break William A. Barnett y University of Kansas and Center for Financial Stability Marcelle Chauvet z University of California Riverside Danilo Leiva-Leon
NOWCASTING THE OBAMA VOTE: PROXY MODELS FOR 2012
 JANUARY 4, 2012 NOWCASTING THE OBAMA VOTE: PROXY MODELS FOR 2012 Michael S. Lewis-Beck University of Iowa Charles Tien Hunter College, CUNY IF THE US PRESIDENTIAL ELECTION WERE HELD NOW, OBAMA WOULD WIN.
Seasonality in macroeconomic prediction errors. An examination of private forecasters in Chile
 Seasonality in macroeconomic prediction errors. An examination of private forecasters in Chile Michael Pedersen * Central Bank of Chile Abstract It is argued that the errors of the Chilean private forecasters
Industrial Engineering Prof. Inderdeep Singh Department of Mechanical & Industrial Engineering Indian Institute of Technology, Roorkee
 Industrial Engineering Prof. Inderdeep Singh Department of Mechanical & Industrial Engineering Indian Institute of Technology, Roorkee Module - 04 Lecture - 05 Sales Forecasting - II A very warm welcome
FEDERAL RESERVE BANK of ATLANTA
 FEDERAL RESERVE BANK of ATLANTA On the Solution of the Growth Model with Investment-Specific Technological Change Jesús Fernández-Villaverde and Juan Francisco Rubio-Ramírez Working Paper 2004-39 December
Solow Growth Model. Michael Bar. February 28, Introduction Some facts about modern growth Questions... 4
 Solow Growth Model Michael Bar February 28, 208 Contents Introduction 2. Some facts about modern growth........................ 3.2 Questions..................................... 4 2 The Solow Model 5
The Central Bank of Iceland forecasting record
 Forecasting errors are inevitable. Some stem from errors in the models used for forecasting, others are due to inaccurate information on the economic variables on which the models are based measurement
Short-term forecasts of GDP from dynamic factor models
 Short-term forecasts of GDP from dynamic factor models Gerhard Rünstler gerhard.ruenstler@wifo.ac.at Austrian Institute for Economic Research November 16, 2011 1 Introduction Forecasting GDP from large
Assessing recent external forecasts
 Assessing recent external forecasts Felipe Labbé and Hamish Pepper This article compares the performance between external forecasts and Reserve Bank of New Zealand published projections for real GDP growth,
On the Use of Web Data in Macroeconomic Forecasting
 On the Use of Web Data in Macroeconomic Forecasting Monokroussos G. 2015 EUR 28104 EN This publication is a Science for Policy report by the Joint Research Centre (JRC), the European Commission s science
Advances in Nowcasting Economic Activity
 Advances in Nowcasting Economic Activity Juan Antoĺın-Díaz 1 Thomas Drechsel 2 Ivan Petrella 3 2nd Forecasting at Central Banks Conference Bank of England November 15, 218 1 London Business School 2 London
LOADS, CUSTOMERS AND REVENUE
 EB-00-0 Exhibit K Tab Schedule Page of 0 0 LOADS, CUSTOMERS AND REVENUE The purpose of this evidence is to present the Company s load, customer and distribution revenue forecast for the test year. The
Addendum to: International Trade, Technology, and the Skill Premium
 Addendum to: International Trade, Technology, and the Skill remium Ariel Burstein UCLA and NBER Jonathan Vogel Columbia and NBER April 22 Abstract In this Addendum we set up a perfectly competitive version
SHORT TERM FORECASTING SYSTEM OF PRIVATE DEMAND COMPONENTS IN ARMENIA
 Vol. 1 (2015) ARMENIAN JOURNAL OF ECONOMICS 21 SHORT TERM FORECASTING SYSTEM OF PRIVATE DEMAND COMPONENTS IN ARMENIA Narek Ghazaryan 1 Abstract This paper describes the system for the short term forecasting
THE DATA ON MOST ECONOMIC VARIABLES ARE ESTIMATES. THESE ESTIMATES ARE REVISED, Data Vintages and Measuring Forecast Model Performance
 Data Vintages and Measuring Forecast Model Performance JOHN C. ROBERTSON AND ELLIS W. TALLMAN Robertson is a visiting scholar and Tallman is a senior economist in the macropolicy section of the Atlanta
Finnancial Development and Growth
 Finnancial Development and Growth Econometrics Prof. Menelaos Karanasos Brunel University December 4, 2012 (Institute Annual historical data for Brazil December 4, 2012 1 / 34 Finnancial Development and
Great Recession and Monetary Policy Transmission
 Great Recession and Monetary Policy Transmission German Lopez Buenache University of Alicante November 19, 2014 Abstract This paper studies the existence of changes in the transmission mechanism of monetary
FORECAST ERRORS IN PRICES AND WAGES: THE EXPERIENCE WITH THREE PROGRAMME COUNTRIES
 Escola de Economia e Gestão Universidade do Minho e NIPE fjveiga@eeg.uminho.pt FORECAST ERRORS IN PRICES AND WAGES: THE EXPERIENCE WITH THREE PROGRAMME COUNTRIES ABSTRACT This paper evaluates the accuracy
Volume 29, Issue 3. Properties of Market-Based and Survey Macroeconomic Forecasts for Different Data Releases
 Volume 29, Issue 3 Properties of Market-Based and Survey Macroeconomic Forecasts for Different Data Releases Markku Lanne University of Helsinki and HECER Abstract We compare the accuracy of the survey
DNB W O R K ING P A P E R. Nowcasting and forecasting economic growth in the euro area using principal components. No. 415 / February 2014
 DNB Working Paper No. 415 / February 2014 Irma Hindrayanto, Siem Jan Koopman and Jasper de Winter DNB W O R K ING P A P E R Nowcasting and forecasting economic growth in the euro area using principal components
Short-Term Forecasting of Czech Quarterly GDP Using Monthly Indicators *
 JEL Classification: C22, C32, C38, C52, C53, E23, E27 Keywords: GDP forecasting, bridge models, principal components, dynamic factor models, real-time evaluation Short-Term Forecasting of Czech uarterly
Estimation of Dynamic Nonlinear Random E ects Models with Unbalanced Panels.
 Estimation of Dynamic Nonlinear Random E ects Models with Unbalanced Panels. Pedro Albarran y Raquel Carrasco z Jesus M. Carro x June 2014 Preliminary and Incomplete Abstract This paper presents and evaluates
TIGER: Tracking Indexes for the Global Economic Recovery By Eswar Prasad and Karim Foda
 TIGER: Tracking Indexes for the Global Economic Recovery By Eswar Prasad and Karim Foda Technical Appendix Methodology In our analysis, we employ a statistical procedure called Principal Compon Analysis
Identifying Aggregate Liquidity Shocks with Monetary Policy Shocks: An Application using UK Data
 Identifying Aggregate Liquidity Shocks with Monetary Policy Shocks: An Application using UK Data Michael Ellington and Costas Milas Financial Services, Liquidity and Economic Activity Bank of England May
Nowcasting gross domestic product in Japan using professional forecasters information
 Kanagawa University Economic Society Discussion Paper No. 2017-4 Nowcasting gross domestic product in Japan using professional forecasters information Nobuo Iizuka March 9, 2018 Nowcasting gross domestic
A look into the factor model black box Publication lags and the role of hard and soft data in forecasting GDP
 A look into the factor model black box Publication lags and the role of hard and soft data in forecasting GDP Marta Bańbura and Gerhard Rünstler Directorate General Research European Central Bank November
SHORT-TERM FORECASTING OF REAL GDP USING MONTHLY DATA
 SHORT-TERM FORECASTING OF REAL GDP USING MONTHLY DATA JURAJ HUČEK, ALEXANDER KARŠAY, MARIÁN VÁVRA OCCASIONAL PAPER National Bank of Slovakia www.nbs.sk Imricha Karvaša 1 813 25 Bratislva research@nbs.sk
FaMIDAS: A Mixed Frequency Factor Model with MIDAS structure
 FaMIDAS: A Mixed Frequency Factor Model with MIDAS structure Frale C., Monteforte L. Computational and Financial Econometrics Limassol, October 2009 Introduction After the recent financial and economic
Predictability of output growth and in ation: A multi-horizon survey approach
 Predictability of output growth and in ation: A multi-horizon survey approach Andrew J. Patton, University of Oxford Allan Timmermann, University of California, San Diego December 6, 008 Abstract We develop
S ince 1980, there has been a substantial
 FOMC Forecasts: Is All the Information in the Central Tendency? William T. Gavin S ince 1980, there has been a substantial improvement in the performance of monetary policy among most of the industrialized
Identifying SVARs with Sign Restrictions and Heteroskedasticity
 Identifying SVARs with Sign Restrictions and Heteroskedasticity Srečko Zimic VERY PRELIMINARY AND INCOMPLETE NOT FOR DISTRIBUTION February 13, 217 Abstract This paper introduces a new method to identify
A Horse-Race Contest of Selected Economic Indicators & Their Potential Prediction Abilities on GDP
 A Horse-Race Contest of Selected Economic Indicators & Their Potential Prediction Abilities on GDP Tahmoures Afshar, Woodbury University, USA ABSTRACT This paper empirically investigates, in the context
Inflation Dynamics in the Euro Area Jensen, Henrik
 university of copenhagen Inflation Dynamics in the Euro Area Jensen, Henrik Publication date: 2010 Document Version Publisher's PDF, also known as Version of record Citation for published version (APA):