Assessment of Catch Basin Inserts
|
|
|
- Cornelia Miller
- 6 years ago
- Views:
Transcription

1 WATERSHED PROTECTION DIVISION DEPARTMENT OF PUBLIC WORKS BUREAU OF SANITATION CITY OF LOS ANGELES Technical Report: Assessment of Catch Basin Inserts JUNE 2006 REVISED 02/21/07
2 WATERSHED PROTECTION DIVISION / CITY OF LOS ANGELES Technical Report: Assessment of Catch Basin Inserts JUNE 2006 TABLE OF CONTENTS List of Tables List of Figures ii ii Executive Summary Introduction Pilot Study Conclusion ES-1 ES-1 ES-2 CHAPTER 1 Pilot Study Background 1-1 Description of Study Area 1-2 Catch Basin and CDS Details 1-2 Catch Basin Insert Details 1-3 CHAPTER 2 Pilot Study Test Protocol Goal 2-1 Test Protocol 2-1 General 2-1 Evaluation of Capture Effectiveness 2-2 CHAPTER 3 Pilot Study Results CHAPTER 4 Pilot Study Analysis and Recommendations Data Analysis 4-1 Recommendations 4-5
3 List of Tables Table 1.1 Pilot Study Catch Basin Parameters 1-6 Table 3.1 CB Insert Capture Effectiveness Per Rain Event (Wet Season Only) 3-1 Table 4.1 CB Insert Capture Effectiveness Comparison by Storm Flow Rates 4-1 (Wet Season Only) List of Figures Figure 1.1 Study Area: Catch Basin Locations 1-4 Figure 1.2 Study Area: Landuse 1-5 Figure 1.3 Typical Insert Installation 1-7 Figure 2.1 WCSD Data Collection form 2-4 Figure 3.1 Typical CB insert with trash in catchment area 3-2 Figure 3.2 Typical CB insert with vegetation in catchment area 3-2 Figure 3.3 Typical CB insert with sediment in catchment area 3-2 Figure 3.4 Typical CDS unit contents after storm event 3-3 Figure 3.5 WCSD crews cleaning the CDS unit after a storm event 3-3 Figure 3.6 Typical debris in CB after rain event No Figure 3.7 Typical debris in CB after rain event No Figure 3.8 Typical debris in CB after rain event No Figure 3.9 Typical debris in CB after rain event No Attachment 1 thru 4 ES - 1
4 Executive Summary Introduction The intent of this report is to present the results obtained by the City of Los Angeles through a pilot study to determine the trash capture effectiveness of the insert during the wet season. The inserts were sized to accommodate the existing 10-year storm design of City-owned catch basins. In compliance with the Federal Clean Water Act (CWA) and existing consent decree between the U.S. EPA and the environmental groups, the Los Angeles Regional Water Quality Control Board (RWQCB) approved the Trash Total Maximum Daily Loads (TMDLs) for the Los Angeles River and Ballona Creek and Wetlands on September 19, This Trash TMDL requires a reduction of 10% of trash per year for a ten-year period starting from the year The RWQCB has based compliance on a three-year rolling average, with the first milestone in September 2006 when the City must achieve a 20% trash reduction. Pilot Study The inserts being used in this pilot study are made of galvanized steel plates with 5 mm openings. They have been confirmed to meeting the requirements of the RWQCB for a full capture device, i.e., the ability to treat the storm flow of a 1-year, 1-hour storm. This was determined by calculating the surface area of an insert and translating it into effective pipe diameter and comparing it to the existing size of the outlet pipe for a catch basin. All catch basins in the City have been designed to intercept runoff from a ten-year storm with outlet pipes designed to be a minimum of 18 inches (Source: City of Los Angeles, Bureau of Engineering, Storm Drain Manual, Part G, Section G222 and Section G353, June 1969). If the effective pipe diameter of the insert is greater than 18 inches, then the insert can pass more flow than the existing outlet pipe, thus it will pass flow from a ten-year storm, above and beyond the 1-year, 1-hour storm criterion for a full capture device. Supplementary analysis further showed that if the insert area progressively becomes blocked, only a small percentage of that area will be required to remain open to pass the 1-year, 1-hour storm. ES - 1
5 The sole purpose of the pilot study was to determine the trash capture effectiveness of catch basin (CB) inserts during a typical calendar year. The pilot study location is adjacent to the Coliseum/Exposition Park area in the City of Los Angeles and has a drainage area of approximately 138 acres. Stormwater runoff from this area is captured by a total of 50 catch basins and a CDS unit located at the base of this drainage area. All 50 catch basins were retrofitted with inserts having a mesh opening of 5 millimeters (0.197 inch) that capture trash mobilized by storm flow. Field measurements from both the catch basins and the CDS unit were obtained during the past wet season, FY 2005/06, by crews from the Wastewater Collection Systems Division after every storm greater than 0.25 inches. Conclusion The study objective was to determine the trash capture effectiveness during the wet season for inserts sized to accommodate the existing 10-year storm design of City-owned catch basins. These inserts were deemed to have a 92 to 97 percent trash capture effectiveness during storms greater than 0.25 inches. For dry days the trash capture effectiveness of the inserts is 100 percent, given that no flow is generated. It should be noted that the City of Los Angeles during a typical year experiences twenty five (25) wet days and three hundred forty (340) dry days. Therefore, the year-round effectiveness of the tested insert is calculated to be 99.2% to 99.7% (e.g., {340X(100%) + 25X(92%)}/365 = 99.2%). Since the tested insert was sized for a 10 year storm, a set of calculation was performed afterwards to calculate the performance of the insert for a 1 year, 1 hour storm event. This was done by comparing the flow rates for both storm events. It became evident that the flow rate of the 10 year storm is approximately 70% higher than the 1yr / 1hr flow (2.01cfs versus 2.01cfs). An adjustment factor was then applied to the test results to reflect the adjustment in performance. The CB insert capture effectiveness for the 1 year /1 hour storm was deemed to be 100% effective. ES - 2
6 CHAPTER 1 PILOT STUDY Background The intent of this report is to present the results gathered by the City of Los Angeles through a pilot study to determine insert trash capture effectiveness during the wet season for inserts sized to accommodate the existing 10-year storm design of City-owned catch basins. In compliance with the CWA and existing consent decree between the U.S. EPA and the environmental groups, RWQCB approved the TMDLs for the Los Angeles River and Ballona Creek and Wetlands on September 19, This Trash TMDL requires a reduction of 10% of trash per year for a tenyear period. The RWQCB has based compliance on a three-year rolling average, with the first milestone in September 2006 when the City must achieve a 20% trash reduction. The RWQCB further identified trash in urban runoff that is conveyed through the storm drain as a primary source of pollution reaching the Los Angeles River and Ballona Creek. Trash that gets into the water bodies can cause water quality problems. Settleables, such as glass, cigarette butts, rubber, and construction debris, can be a problem for bottom feeders and can contribute to sediment contamination. Some debris, such as diapers, medical and household waste, is a source of bacteria and toxic substances. The Trash TMDL identified the following beneficial uses as being impaired due to trash in these waterbodies: 1) contact recreation like bathing and swimming; 2) non-contact recreation such as fishing, hiking, jogging, and bicycling; and 3) habitat for aquatic life and bird life. The inserts being used in this pilot study are made of galvanized steel plates with 5 mm openings. They have been confirmed to meeting the requirements of the RWQCB for a full capture device, i.e., the ability to treat the storm flow of a 1-year, 1-hour storm. This was determined by calculating 1-1
7 the surface area of an insert and translating it into effective pipe diameter and comparing it to the existing size of the outlet pipe for a catch basin. All catch basins in the City have been designed to intercept runoff from a tenyear storm with outlet pipes designed to be a minimum of 18 inches (Source: City of Los Angeles, Bureau of Engineering, Storm Drain Manual, Part G, Section G222 and Section G353, June 1969). The method states that if the effective pipe diameter of the insert is greater than 18 inches, then the insert can pass more flow than the existing outlet pipe, thus it will pass flow from a ten-year storm, above and beyond the 1-year, 1-hour storm criterion for a full capture device. Supplementary analysis further showed that if the insert area progressively becomes blocked, only a small percentage of that area will be required to remain open to pass the 1-year, 1-hour storm. Throughout the study the word trash has been used to represent sediment, debris, vegetation and litter and should not be misconstrued to represent only anthropogenic trash. Description of Study Area The catch basins retrofitted with inserts were located southwest of the downtown Los Angeles Civic Center adjacent to the Coliseum/Exposition Park area of the City (See Figure 1.1). The drainage area is approximately 138 acres, with three-quarters commercial land use and the remaining multifamily residential land use (see Figure 1.2). This area is regarded as a high trash generation area within the City. Catch Basin and CDS Details The physical parameters of the fifty (50) catch basins (CBs) included in the study were consistent. Table 1 shows the parameters for each CB. As the Table shows, over two-thirds of the CBs had a curb opening length of 3.5 feet and curb opening height of eight (8) to ten (10) inches. Additionally, many of the CBs had a depth that was shallow to moderate. The catch basin drainage area in which these catch basins are found had a hydrodynamic system installed on the downstream end of the mainline storm drain located at Vermont and 43 rd Street. The system being used is a CDS Technologies Continuous Deflective Separation (CDS) unit Model PSW with treatment design flow rate of 26.5 cubic feet per second (cfs). A CDS unit is recognized by the RWQCB as a full capture device. Catch Basin Insert Details 1-2
8 The inserts being used in the study have been verified as meeting the requirements of the RWQCB for a full capture device, i.e., the ability to treat the storm flow of a 1-year, 1-hour storm. The CB inserts evaluated for the study have been purchased and installed by Practical Technology, Inc. They are manufactured from hot dipped galvanized steel screen sheets with 5 millimeters (0.197 inch) diameter circular openings. Inserts installed in curb opening CBs encompass the entire width and approximately 80% of the entire length of the basin; whereas, inserts installed in grate CBs fit the entire opening. See Figure 1.3 for typical insert installation and configuration. During a typical rain event trash that has accumulated in the street gutters is washed into the catch basin. The function of the CB inserts is to capture all trash greater than 5 mm while maintaining adequate drainage capacity of the CB and storm drain system. If the storm event is of great intensity, flow will begin to backup into the catch basin causing the floatable trash within the catchment area to rise. Excessive flow will go into the overflow, thus preventing any flooding of the streets. 1-3
9 City of Los Angeles Vicinity Map LEIGHTON MENLO Pilot Study Area COLISEUM BROWNING SANTA BARBARA SOUTH PARK MARTIN LUTHER KING JR KANSAS 40TH VERMONT 40TH HOOVER 40TH 41ST 41ST 41ST MENLO 41ST 41ST 42ND 42ND Legend 42ND Pilot Study: Insert Locations Catch Basin Location CDS Freeway City Street 42ND City of Los Angeles Boundary Outside of City LA Miles Figure 1.1 Study Area RITA L. ROBINSON DIRECTOR SHAHRAM KHARAGHANI PROGRAM MANAGER FILE-LOC H:/GIS/PilotStudyLocations DRAWN BY: AM CHECKED BY: MS DATE 05/19/06 DATE REVISED X This map shall not be copied or reproduced, all or any part thereof, whether for distribution or resale, without the proper written permission of the Dept. of Public Works, City of Los Angeles Thomas Bros Data reproduced with permission granted by THOMAS BROS MAP

10 ***** ***** N COLISEUM DR W 39TH PL Pilot Study Area LEIGHTON AV MENLO AV S COLISEUM DR S FIGUEROA ST SOUTH PARK DR S VERMONT AV W MARTIN LUTHER KING JR BLVD W 40TH PL W 40TH PL W 40TH PL S HOOVER ST W 41ST ST W 41ST ST MENLO AV W 41ST PL W 41ST DR W 42ND ST W 41ST PL W 42ND ST Legend Pilot Study: Insert Locations Catch Basin Location CDS Pilot Study: Landuse Multi - family Commercial W 42ND PL W 42ND PL Freeway City Street City of Los Angeles Boundary Outside of City LA Miles Figure 1.2 Study Area: Landuse RITA L. ROBINSON DIRECTOR SHAHRAM KHARAGHANI PROGRAM MANAGER FILE-LOC H:/GIS/PilotStudyLanduse DRAWN BY: AM CHECKED BY: MS DATE 05/19/06 DATE REVISED X This map shall not be copied or reproduced, all or any part thereof, whether for distribution or resale, without the proper written permission of the Dept. of Public Works, City of Los Angeles Thomas Bros Data reproduced with permission granted by THOMAS BROS MAP
11 Table 1.1 Pilot Study Catch Basin Parameters No Address Location CLAMMS ID No. Catch Basin Dimensions (ft) Length Width Depth Vol. ft 3 Street Cleaning Frequency 1 MENLO AVE & LEIGHTON AVE NE WEEKLY 2 MENLO AVE & LEIGHTON AVE SE WEEKLY 3 MENLO AVE & MARTIN LUTHER KING JR BLVD 200' E OF MENLO AVE WEEKLY 4 MENLO AVE & MARTIN LUTHER KING JR BLVD NE 300' N OF MLK WEEKLY 5 MARTIN LUTHER KING JR BLVD & MENLO AVE EN 300' N OF MLK WEEKLY 6 MARTIN LUTHER KING JR BLVD & MENLO AVE ES 300' N OF MLK WEEKLY 7 HOOVER ST & MARTIN LUTHER KING JR BLVD NE DAILY 8 HOOVER ST & MARTIN LUTHER KING JR BLVD NW DAILY 9 MENLO AVE & MARTIN LUTHER KING JR BLVD NE WEEKLY 10 MENLO AVE & MARTIN LUTHER KING JR BLVD NW WEEKLY 11 VERMONT AVE & MARTIN LUTHER KING JR BLVD NE DAILY 12 MARTIN LUTHER KING JR BLVD & MENLO AVE EN DAILY 13 MARTIN LUTHER KING JR BLVD & VERMONT AVE EN DAILY 14 MARTIN LUTHER KING JR BLVD & MENLO AVE ES DAILY 15 MARTIN LUTHER KING JR BLVD & VERMONT AVE ES DAILY 16 MENLO AVE & 40TH PL NW WEEKLY 17 MENLO AVE & 40TH PL NE WEEKLY 18 VERMONT AVE & 40TH PL NE DAILY 19 40TH PL & MENLO AVE EN WEEKLY 20 40TH PL & VERMONT AVE EN WEEKLY 21 40TH PL & MENLO AVE ES WEEKLY 22 40TH PL & VERMONT AVE ES WEEKLY 23 MENLO AVE & 41ST ST NW WEEKLY 24 MENLO AVE & 41ST ST NE WEEKLY 25 VERMONT AVE & 41ST ST NE DAILY 26 41ST ST & MENLO AVE EN WEEKLY 27 41ST ST & VERMONT AVE EN WEEKLY 28 41ST ST & MENLO AVE ES WEEKLY 29 41ST ST & VERMONT AVE ES WEEKLY 30 MENLO AVE & 41ST DR NW WEEKLY 31 MENLO AVE & 41ST DR NE WEEKLY 32 VERMONT AVE & 41ST DR NE DAILY 33 41ST DR & MENLO AVE EN WEEKLY 34 41ST DR & VERMONT AVE EN WEEKLY 35 41ST DR & MENLO AVE ES WEEKLY 36 41ST DR & VERMONT AVE ES WEEKLY 37 MENLO AVE & 42ND ST NE WEEKLY 38 MENLO AVE & 42ND ST NW WEEKLY 39 VERMONT AVE & 42ND ST NW DAILY 40 VERMONT AVE & 42ND ST NE WEEKLY 41 42ND ST & MENLO AVE EN WEEKLY 42 42ND ST & VERMONT AVE EN WEEKLY 43 42ND ST & MENLO AVE ES WEEKLY 44 42ND ST & VERMONT AVE ES WEEKLY 45 MENLO AVE & 42ND ST SW WEEKLY 46 MENLO AVE & 42ND ST SE WEEKLY 47 VERMONT AVE & 42ND PL NW DAILY 48 VERMONT AVE & 42ND PL NE DAILY 49 42ND PL & VERMONT AVE EN WEEKLY 50 42ND PL & VERMONT AVE ES WEEKLY 1-6
12 sidewalk maintenance hole 5mm screen insert maintenance access hatch outlet pipe Trash/debris diverter appurtenance street gutter Catch basin opening (front) storm runoff Plan Trash/debris diverter appurtenance street gutter maintenance hole cover Catch basin opening (front) curb face storm runoff 5mm screen insert catchment area outlet pipe Profile Figure 1.3 Typical Insert Installation 1-7
13 CHAPTER 2 PILOT STUDY TEST PROTOCOL Goal The goal of this test protocol is: 1. To determine CB insert trash capture effectiveness during wet weather. Test Protocol General 1. The inserts evaluated for the pilot study were purchased from Practical Technology, Inc. They are constructed from hot dipped galvanized steel screen sheets with 5mm openings. Inserts installed in curb opening CBs encompass the entire width and approximately 80% of the entire length of the basin; whereas inserts installed in grate inlet CBs (3 total) fit the entire opening. 2. Wastewater Collection Systems Division (WCSD) crews will perform data collection and measurements after a storm event having an accumulation greater than 0.25 inches as measured at the civic center of the City of Los Angeles. Collection and measurements will be from October 1, 2005 to April 30, Existing data collection procedures will be employed and amended, if necessary. Data from individual measurements will be recorded in tabular form (see Fig. 2.1), using existing WCSD data collection forms or amended forms provided by Watershed Protection Division (WPD). 4. Existing historical CB and CDS cleaning data will be gathered for comparison with that of the data collection from this study. 2-1
14 5. Data collection and measurements will be performed if the storm events occurred ten or more days apart. 6. Precipitation data of every storm event will be obtained from the County of Los Angeles, Department of Public Works real time rain gauge identified as the Los Angeles-Ducommun (#377, Lat ; Long ; Elev. 306). Data will be analyzed for total rainfall, one-hour maximum rainfall, and 30-minute maximum rainfall (rainfall intensity). 7. The following field conditions will be recorded by WPD staff at the start of the study at each retrofitted CB: a. Location; b. Volume of insert and size of CB opening; c. Height of insert; d. Visual observations of street surroundings; e. Visual observations of inside of catch basin; and f. Street cleaning frequency at CB location. 8. The following field conditions will be recorded during data collection at each retrofitted catch basin: a. Existing weather conditions; b. Fullness of insert (i.e., none, minimal, ¼ full, ½ full, ¾ full, full); c. Visual observations for signs of ponding immediately adjacent to CB opening; and d. Other parameters, as the study proceeds. 9. Following each cleaning WCSD will forward the results to WPD for data assessment. Evaluation of Capture Effectiveness Determination of an overall trash capture effectiveness of inserts will rely on field measurements and visual observations. 1. WCSD crews will visually monitor the CDS unit for floating trash after every storm event described. If no floating trash is visible, such result shall be recorded, otherwise crews will remove the floating trash. 2. WCSD crews will remove all accumulated trash after every storm from all retrofitted CBs. 3. Trash Capture (TC) effectiveness of inserts will be determined as follows for each set of cleaning data: 2-2
15 TC Effectiveness = n i CB n i trash CB trash + CDS trash Where CB trash and CDS trash are the trash quantities for the CBs and CDS unit, respectively. These quantities will be expressed in both weight (lbs) and in-place-volume based on the height of the trash and cross-sectional area of the units. 2-3
16 Figure 2.1 WCSD data collection form 2-4
17 CHAPTER 3 PILOT STUDY RESULTS The intent of this section is to present the results obtained by the WCSD crews during the cleaning of the CBs and CDS unit after every storm greater than 0.25 inch. There were a total of 4 rain events of a magnitude that triggered a cleaning event during the 2005/2006 wet season. Though there were several small rain events (< 0.25 inch) during this wet season, the maintenance crews were not asked to clean either the catch basins or CDS. For these smaller rain events, visual observations, were made by staff and documented through photos. Table 3.1 illustrates the rain event data and the corresponding capture effectiveness based on the Test Protocol procedure. Table 3.1 CB Insert Capture Effectiveness Per Rain Event > 0.25 inches Event (Wet Season Only) Storm Size (in) Date Collected Trash (lbs) CBs (a) CDS (b) Insert % Capture Effectiveness ( c ) /17-18/05 1, /31/05-1/2/06 2, /17-18/06 2, /20-21/06 1, Figures 3.1 through 3.3 below, show typical contents found in the catchment area of the inserts just after a storm event. Depending on the catch basin location, the contents may differ. For example, more sediment and vegetation were found in those CBs in the multi-family landuse, while those in the commercial landuse had more trash (i.e., Styrofoam cups, plastic bags, etc.). Figures 3.4 through 3.5 show the typical contents of the CDS unit after a storm event. This material is what escaped the inserts through the overflow due to large flows mobilizing floatable trash found within the catchment area. As the pictures show, much of the contents are materials that easily float such as Styrofoam cups and containers, light film plastics, 3-1


18 and some paper products. Figures 3.6 through 3.9 show trash captured in the catch basins following rain events. Figure 3.1 Typical CB insert with trash in catchment area Figure 3.2 Typical CB insert with vegetation in catchment area Figure 3.3 Typical CB insert with sediment in catchment area 3-2


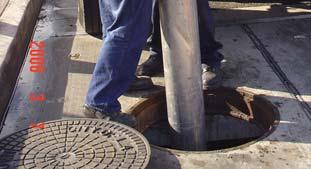
19 Figure 3.4 Typical CDS unit contents after storm event Figure 3.5 WCSD crews cleaning the CDS unit after a storm event 3-3


20 st a. 41 and Menlo Ave. b. 42 nd and Vermont Ave. Figure 3.6 Typical debris in CB after rain event No. 1, 10/17-18/2005 a. 41 st and Menlo Ave. b. 42 nd and Vermont Ave. Figure 3.7 Typical debris in CB after rain event No. 2, 12/31/ /02/2006 st nd a. 41 and Menlo Ave. b. 42 and Vermont Ave. Figure 3.8 Typical debris in CB after rain event No. 3, 02/17-18/


21 a. 41 st and Menlo Ave. b. 42 nd and Vermont Ave. Figure 3.9 Typical debris in CB after rain event No. 4, 03/19-20/
22 CHAPTER 4 PILOT STUDY ANALYSIS AND RECOMMENDATIONS Data Analysis The study objective was to determine the trash capture effectiveness during the wet season for inserts sized to accommodate the existing 10-year storm design of City-owned catch basins. These inserts were deemed to have a 92 to 97 percent trash capture effectiveness during storms greater than 0.25 inches. The only time trash escapes the insert catchment area is when sufficient flow is generated to mobilize floatable trash in the catchment area and push it over the overflow. Hence, for dry days the trash capture effectiveness of the insert is 100 percent, given that no flow is generated. It should be noted that the Trash TMDL document established a yearly Waste Load Allocation for each municipality within the watershed(s) based on a phased reduction of a 10% per year from the estimated current discharge (baseline) over a 10-year period. In addition, the City of Los Angeles during a typical year experiences twenty five (25) wet days and three hundred forty (340) dry days. Therefore, the year-round effectiveness of the insert is calculated to be 99.2% to 99.7% (e.g., {(340 X 100%) + (25 X 92%)}/365 = 99.2%). In accordance with the Trash TMDL document, a full capture device is defined as any single device or series of devices that traps all particles retained by a 5 mm mesh screen and has a design treatment capacity of not less than the peak flow rate of a 1-year/1-hour storm. Therefore, the inserts piloted herein and deployed by the City in its catch basins clearly satisfy the above definition. 4-1
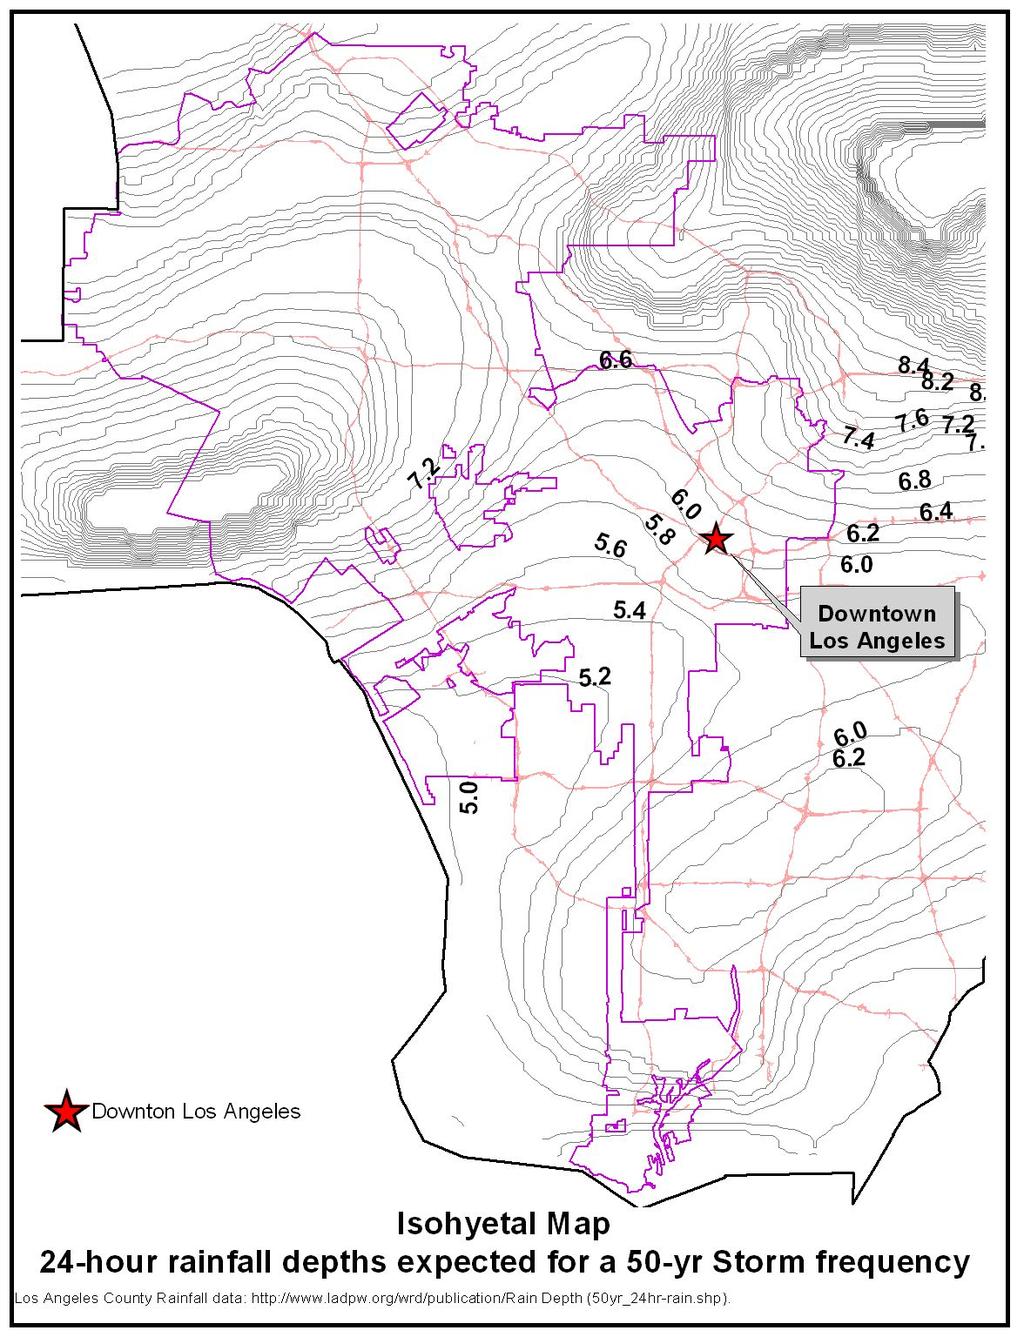
23 It is also important to point out that the inserts tested were sized for a 10 year storm, therefore their performance under a lesser flow rate, such as, a 1-year/1-hour storm is expected to show higher efficiency than the 92% 97% documented in this study. This can be demonstrated by the following set of calculations: The flow rate for a 1 year / 1 hour storm for each catch basin in the pilot study area is calculated as follows: Q =CiA C =.95 i = 0.46 in/hr (LADPW isohyetal map, 1yr, 30min) A = 134 acres (drainage area of Coliseum area)/ 50 (# of catch basins in Coliseum area) = 2.68 acres Q = (.95) (.46) (2.68) = 1.17 cfs Similarly, the flow rate for a 10 yr/ 1 hr storm for each catch basin is calculated as follows: Q =CiA C =.95 i =.79 in/hr * A = 2.68 acres Q = (.95) (.79) (2.68) = 2.01 cfs By comparing both flow rates, it is evident that the flow rate of the 10 year storm is approximately 70% higher than the 1yr / 1hr flow. *Converting Storm Events for a Given Location Location: Downtown Los Angeles (See map in Attachment) 1 Depth for a 50yr-24hr storm event: 6.0 inches 1 Intensity = RainDepth 6 inches = = Duration 24 hrs in / hr 4-2
24 Convert from 50yr-24hr storm to 10yr-24 hr storm: To convert to a 10yr-24 hr storm multiply by LA County 10yr Rainfall Frequency Multiplication Factor. 2 10yr-24hr factor = (See attachment Table 5.3.1) Therefore, 10yr-24 hr equivalent storm: Depth 10yr-24hr Intensity = = 6.0 in = in RainDepth 4.28 inches = = Duration 24 hrs I 10yr-24hr = in/hr Convert from 10yr-24 hr storm to a 10yr-1hr storm: in / hr To convert from a 10yr-24 hr storm to a 10yr-1hr storm, use normalized intensity equation which relates intensity, duration, and frequency (IDF). 3 Where: It t I1440 _It_ I1440 = Rainfall intensity for the duration given in inch/hr = Converting time in minutes (60 min = 1 hr) = 24 hr rainfall intensity in inch/hr = Peak Normalized intensity, dimensionless Therefore, Intensity (I) for a 10yr-1hr storm: I 10yr-60min 1440 min = 60 min in / hr I 10yr-60min = 0.79 in/hr Therefore, the surface area of the current insert that is sized to handle the 10 year storm can be reduced by 70% to treat the 1 year / 1 hour storm. 1 Los Angeles County Rainfall data: Depth (50yr_24hrrain.shp). (See Attachment) 2 Los Angeles County Department of Public Works, Hydrology Manual, Jan 2006, Chapter 5, Table 5.3.1, Pg. 43 (See Attachment) 3 Los Angeles County Department of Public Works, Hydrology Manual, Jan 2006, Chapter 5, Equation 5.1.2, Pg
25 An adjustment factor as high as 70% may be applied to the test results to reflect the adjustment in performance. Table 4.1 reflects the CB insert capture effectiveness for the two different storm events after applying the adjustment factor for the 1 year /1 hour storm. Table 4.1 CB Insert Capture Effectiveness Comparison by Storm Flow Rates (Wet Season Only) Insert % Capture Effectiveness Event Date 10-year/1-hour 1-year/1-hour (a.) (b.) 1 10/17-18/ /31/05-1/2/ /17-18/ /20-21/ Note: a. Percent capture effectiveness based on the study. b. Capture effectiveness = a. X 1.70 Example: 92% X 1.70 = 156%, thus 100%. Observations Throughout the study many observations, other than capture effectiveness, were recorded and below are some aspects that need to be considered with the use of this type of insert: Appropriate siting of an insert is essential due to the maintenance requirements. As was observed, inserts in areas that are heavy with vegetation (i.e., tree lined streets, parkways with grassy areas, etc.) exacerbate the cleaning requirements of the insert. Lack of cleaning will result in the insert clogging, diminishing it ability to retain trash and increasing the probability of that trash going over the overflow. The 5mm screen openings are problematic, in that they tend to close/clog with minimal debris and may result in localized ponding. The use of this insert configuration in shallow catch basins is not recommended. The insert significantly decreases the volume of the catch basin. Cross bracing shall be provided for inserts having a bottom screen section to avoid failure through shearing around the perimeter anchoring points. Inserts having a bottom screen section need to provide a means for access to the CB outlet pipe. 4-4
26 Recommendations The City should continue to use catch basin inserts in high trash generation areas based on the inserts high trash capture capability. However, the City should continue to evaluate different configurations of inserts based on the following criteria: Maximizing trash capture area; Minimizing flooding potential; Optimizing insert screen material openings; and Ease of maintenance. 4-5
27 Attachment
28 1
29 2
30 3
31 4
BRANDON LAKES AVENUE PRE AND POST CONDITIONS DRAINAGE REPORT
 BRANDON LAKES AVENUE PRE AND POST CONDITIONS DRAINAGE REPORT Hillsborough County Public Works County Center, 22nd Floor 601 E. Kennedy Blvd. Tampa, FL 33602 BRANDON LAKES AVENUE DRAINAGE IMPROVEMENTS Capital
STREUVER FIDELCO CAPPELLI, LLC YONKERS DOWNTOWN DEVELOPMENT PHASE 1. DRAFT ENVIRONMENTAL IMPACT STATEMENT For: PALISADES POINT
 STREUVER FIDELCO CAPPELLI, LLC YONKERS DOWNTOWN DEVELOPMENT PHASE 1 DRAFT ENVIRONMENTAL IMPACT STATEMENT For: PALISADES POINT Prepared by: PAULUS, SOKOLOWSKI & SARTOR STORMWATER MANAGEMENT 1. Methodology
City of Thornton Attn: Tim Semones Development Engineeering 9500 Civic Center Dr. Thornton, CO 80229
 Development Engineering Land Surveying Construction Administration District Services October 20, 2017 City of Thornton Attn: Tim Semones Development Engineeering 9500 Civic Center Dr. Thornton, CO 80229
9/12/2014 O V E RV I E W
 K E E P I N G T H E N E W M I S S I O N R E AC H C L E A N T R A S H & F L O ATA B L E S B M P S T U D Y Russell Persyn, P.E., Ph.D. (SARA) Cris Parker, P.E., CFM (HDR) September 4, 2014 O V E RV I E W»
Typical Hydrologic Period Report (Final)
") (DELCORA) (Final) November 2015 (Updated April 2016) CSO Long-Term Control Plant Update REVISION CONTROL REV. NO. DATE ISSUED PREPARED BY DESCRIPTION OF CHANGES 1 4/26/16 Greeley and Hansen Pg. 1-3,
(DELCORA) (Final) November 2015 (Updated April 2016) CSO Long-Term Control Plant Update REVISION CONTROL REV. NO. DATE ISSUED PREPARED BY DESCRIPTION OF CHANGES 1 4/26/16 Greeley and Hansen Pg. 1-3,
LOCATED IN INDIAN RIVER COUNTY PREPARED FOR S.J.R.W.M.D. AND F.W.C.D. DECEMBER, 2003 Updated 2007 Updated May 2014 PREPARED BY
 FELLSMERE WATER CONTROL DISTRICT EAST MASTER DRAINAGE PLAN AND STORMWATER HYDROLOGIC ANALYSIS OF THE GRAVITY DRAINAGE SYSTEM LOCATED BETWEEN THE EAST BOUNDARY, LATERAL U, THE MAIN CANAL, AND DITCH 24 LOCATED
Sediment Trap. A temporary runoff containment area, which promotes sedimentation prior to discharge of the runoff through a stabilized spillway.
 Sediment Trap SC-15 Source: Caltrans Construction Site Best Management Practices Manual, 2003. Description A temporary runoff containment area, which promotes sedimentation prior to discharge of the runoff
Sediment Control Practices. John Mathews Ohio Dept. of Natural Resources, Division of Soil and Water Resources
 Sediment Control Practices John Mathews Ohio Dept. of Natural Resources, Division of Soil and Water Resources Practices Treat the Largest Soil Particles Sand Sand Silt Clay Treated Untreated Settleable
Stormwater Guidelines and Case Studies. CAHILL ASSOCIATES Environmental Consultants West Chester, PA (610)
") Stormwater Guidelines and Case Studies CAHILL ASSOCIATES Environmental Consultants West Chester, PA (610) 696-4150 www.thcahill.com Goals and Challenges for Manual State Stormwater Policy More Widespread
Stormwater Guidelines and Case Studies CAHILL ASSOCIATES Environmental Consultants West Chester, PA (610) 696-4150 www.thcahill.com Goals and Challenges for Manual State Stormwater Policy More Widespread
SILT FENCE EFFECTIVENESS
 SILT FENCE EFFECTIVENESS Michelle G. Holloway, Department of Earth Sciences, University of South Alabama, Mobile, AL 36688. E-mail: MLG@jaguar1.usouthal.edu. Sediment is the number one pollutant in Dog
Stone Outlet Sediment Trap
 3.12 Sediment Control Description: A stone outlet sediment trap is a small detention area formed by placing a stone embankment with an integral stone filter outlet across a drainage swale for the purpose
MAPPING THE RAINFALL EVENT FOR STORMWATER QUALITY CONTROL
 Report No. K-TRAN: KU-03-1 FINAL REPORT MAPPING THE RAINFALL EVENT FOR STORMWATER QUALITY CONTROL C. Bryan Young The University of Kansas Lawrence, Kansas JULY 2006 K-TRAN A COOPERATIVE TRANSPORTATION
Sediment Trap. At multiple locations within the project site where sediment control is needed.
 Sediment Trap SE-3 Objectives EC Erosion Control SE Sediment Control TR Tracking Control WE Wind Erosion Control Non-Stormwater NS Management Control Waste Management and WM Materials Pollution Control
FOR PROJECTS INITIATED AFTER NOVEMBER 1, 2008 ITEM 716 EMBANKMENT EARTH OUTLET SEDIMENT TRAP
 AFTER NOVEMBER 1, 2008 ITEM 716 EMBANKMENT EARTH OUTLET SEDIMENT TRAP 716.1 Description. This work shall consist of furnishing, installing, maintaining, and removing temporary erosion protection and sediment
Section 4: Model Development and Application
 Section 4: Model Development and Application The hydrologic model for the Wissahickon Act 167 study was built using GIS layers of land use, hydrologic soil groups, terrain and orthophotography. Within
Technical Memorandum. City of Salem, Stormwater Management Design Standards. Project No:
 Technical Memorandum 6500 SW Macadam Avenue, Suite 200 Portland, Oregon, 97239 Tel: 503-244-7005 Fax: 503-244-9095 Prepared for: Project Title: City of Salem, Oregon City of Salem, Stormwater Management
TPDES: Soil, Erosion and Sedimentation Methods
 SAWS TPDES: Soil, Erosion and Sedimentation Methods Philip Handley Supervisor-Resource Protection & Compliance August 25, 2014 TPDES: Soil, Erosion and Sedimentation Methods Soil Common term: Dirt Common
STORMWATER REPORT FRITO LAY SUBDIVISION NO. 3
 STORMWATER REPORT FRITO LAY SUBDIVISION NO. 3 May 2018 STORMWATER REPORT I. Subdivision Data a. The parcel is adjacent to the existing Frito Lay property in Topeka; and the subject plat application encompasses
WATER MANAGEMENT REPORT FOR PAGE ESTATES
 WATER MANAGEMENT REPORT FOR PAGE ESTATES SLB Consulting of SW Florida, LLC PO Box 2826 Bonita Springs, FL. 34133 Phone: 239-948-9566 sandra@slbconsult.com C.O.A. # 25395 September 1, 2014 Sandra L. Bottcher
Notes: We all know that Toulmins Spring Branch is a sub-watershed of Three Mile Creek watershed. Some part of it is in Mobile area and rest of it is
 1 Notes: This presentation is about some of our findings from a study carried out over the last 3-4 months on stormwater management of Toulmins Spring Branch watershed by NEP. The objective of this study
Continuing Education Course #101 Drainage Design with WinTR-55
 1 of 5 Continuing Education Course #101 Drainage Design with WinTR-55 1. WinTR-55 uses the Kinematic Wave method for calculating storm runoff rates and volumes. 2. According to the Velocity Method, the
INFLOW DESIGN FLOOD CONTROL SYSTEM PLAN 40 C.F.R. PART PLANT YATES ASH POND 2 (AP-2) GEORGIA POWER COMPANY
 GEORGIA POWER COMPANY") INFLOW DESIGN FLOOD CONTROL SYSTEM PLAN 40 C.F.R. PART 257.82 PLANT YATES ASH POND 2 (AP-2) GEORGIA POWER COMPANY EPA s Disposal of Coal Combustion Residuals from Electric Utilities Final Rule (40 C.F.R.
INFLOW DESIGN FLOOD CONTROL SYSTEM PLAN 40 C.F.R. PART 257.82 PLANT YATES ASH POND 2 (AP-2) GEORGIA POWER COMPANY EPA s Disposal of Coal Combustion Residuals from Electric Utilities Final Rule (40 C.F.R.
PRELIMINARY DRAFT FOR DISCUSSION PURPOSES
 Memorandum To: David Thompson From: John Haapala CC: Dan McDonald Bob Montgomery Date: February 24, 2003 File #: 1003551 Re: Lake Wenatchee Historic Water Levels, Operation Model, and Flood Operation This
D. B. G R A Y E N G I N E E R I N G I N C.
 STORMWATER MANAGEMENT REPORT 948 Hunt lub Road Ottawa, Ontario Report No. 12020-SWM August 27, 2012 Revised April 21, 2014 Revised December 9, 2014 Revised April 14, 2015 D. B. G R A Y E N G I N E E R
Drainage Study for Civic Center Way
 Drainage Study for 23401 Civic Center Way P.C.C.E. INC. CIVIL ENGINEERING AND DESIGN Drainage Study for 23401 Civic Center Way WHOLE FOODS AT THE PARK Prepared by: P.C.C.E. INC STEPHEN R. SMITH, P.E. 23801
Hydrology and Hydraulics Design Report. Background Summary
 To: National Park Services Montezuma Castle National Monument Richard Goepfrich, Facility Manager From: Multicultural Technical Engineers Date: Tuesday - February 13, 2018 Subject: 30% Hydrology and Hydraulics
Engineer's Report. Main Street Business Area. Festoon Lighting and Sidewalk Cleaning Assessment District (Fiscal Year )
") Engineer's Report for the Main Street Business Area Festoon Lighting and Sidewalk Cleaning Assessment District (Fiscal Year 2008-09) Prepared under the provisions of the Benefit Assessment Act of 1982
Engineer's Report for the Main Street Business Area Festoon Lighting and Sidewalk Cleaning Assessment District (Fiscal Year 2008-09) Prepared under the provisions of the Benefit Assessment Act of 1982
President s Day Weekend Storm Community Meeting and Workshop April 17, 2017
 President s Day Weekend Storm Community Meeting and Workshop April 17, 2017 Meeting outline 1. Progress update on the City of San Jose s recovery efforts 2. Water district presentation on: Weather situation
Suitable Applications Sediment traps should be considered for use:
 Categories EC Erosion Control SE Sediment Control TC Tracking Control WE Wind Erosion Control Non-Stormwater NS Management Control Waste Management and WM Materials Pollution Control Legend: Primary Objective
Construction Exits Rock pads
 Construction Exits Rock pads SEDIMENT CONTROL TECHNIQUE Type 1 System Sheet Flow Sandy Soils Type 2 System Concentrated Flow [1] Clayey Soils Type 3 System Supplementary Trap Dispersive Soils [1] Minor
******************* Project Description ******************* File Name... NAAF Stormwater Improvement Project 11_21_2014.SPF
 Autodesk Storm and Sanitary Analysis 2014 - Version 8.1.62 (Build 1) ----------------- *** Project Description *** File Name... NAAF Stormwater Improvement Project 11_21_2014.SPF Analysis Options Flow
FHWA - HIGHWAY HYDROLOGY
 The unit peak discharge is computed with Equation 5.6 by interpolating c 0, c, and c Table 5.5 using a type II distribution. The peak discharge is also calculated as follows. from Variable SI Unit U Unit.5444
ADDENDA #1 CONTRACT # C May 3, 2013 Page 1 of 1
 State of California Natural Resources Agency Edmund G. Brown Jr., Governor DEPARTMENT OF PARKS AND RECREATION Major General Anthony L. Jackson, USMC (Ret), Director ADDENDA #1 CONTRACT # C1247040 May 3,
3.0 TECHNICAL FEASIBILITY
 3.0 TECHNICAL FEASIBILITY 3.1 INTRODUCTION To enable seasonal storage and release of water from Lake Wenatchee, an impoundment structure would need to be constructed on the lake outlet channel. The structure
CITY OF BEAVER DAM SNOW & ICE REMOVAL POLICY
 CITY OF BEAVER DAM SNOW & ICE REMOVAL POLICY Revised January, 2016 Approved by Operations Committee: February 1, 2016 This snow and ice removal policy guides Public Works personnel with deicing, plowing,
Storm Water Best Management Practice: Development of Debris Filtering Structure for Supercritical Flow
 Storm Water Best Management Practice: Development of Debris Filtering Structure for Supercritical Flow Jungseok Ho 1, Todd Marti 2, and Julie Coonrod 3 1 Department of Civil Engineering, University of
Specifications Whitcomb Elementary School Demolition January 15, 2016
 SECTION 31 2500 - EROSION CONTROL PART 1 - GENERAL 1.1 RELATED DOCUMENTS: A. The provisions of the Contract Documents apply to the work of this Section. B. The Virginia Erosion and Sediment Control Handbook,
Continuing Education Associated with Maintaining CPESC and CESSWI Certification
 Continuing Education Associated with Maintaining CPESC and CESSWI Certification Module 2: Stormwater Management Principles for Earth Disturbing Activities Sponsors: ODOTs Local Technical Assistance Program
EROSION CONTROL NARRATIVE
 EROSION CONTROL NARRATIVE Erosion and sediment control has been designed for the Willow Bend Phase I Subdivision according to UDFCD and the City of Thornton criteria, in order to minimize erosion and sediment
ARTICLE 5 (PART 2) DETENTION VOLUME EXAMPLE PROBLEMS
 DETENTION VOLUME EXAMPLE PROBLEMS") ARTICLE 5 (PART 2) DETENTION VOLUME EXAMPLE PROBLEMS Example 5.7 Simple (Detention Nomograph) Example 5.8 Offsite and Unrestricted Areas (HEC-HMS) Example 5.9 Ponds in Series w/ Tailwater (HEC-HMS) Example
ARTICLE 5 (PART 2) DETENTION VOLUME EXAMPLE PROBLEMS Example 5.7 Simple (Detention Nomograph) Example 5.8 Offsite and Unrestricted Areas (HEC-HMS) Example 5.9 Ponds in Series w/ Tailwater (HEC-HMS) Example
TREASURE COAST REGIONAL PLANNING COUNCIL M E M O R A N D U M. To: Council Members AGENDA ITEM 4B10
 TREASURE COAST REGIONAL PLANNING COUNCIL M E M O R A N D U M To: Council Members AGENDA ITEM 4B10 From: Date: Subject: Staff December 14, 2018 Council Meeting Local Government Comprehensive Plan Review
DRAINAGE REPORT FOR THORNTON SELF STORAGE THORNTON, COLORADO
 DRAINAGE REPORT FOR THORNTON SELF STORAGE THORNTON, COLORADO Prepared by: Bowman Consulting 603 Park Point Dr. Suite 100 Golden, CO 80401 (303)-801-2900 June 29, 2015 Revised August 14, 2015 CERTIFICATE
Chapter 10 - Sacramento Method Examples
 Chapter 10 Sacramento Method Examples Introduction Overview This chapter presents two example problems to demonstrate the use of the Sacramento method. These example problems use the SACPRE and HEC-1 computer
Materials. Use materials meeting the following.
 208.01 Section 208. SOIL EROSION AND SEDIMENTATION CONTROL 208.01 Description. Install and maintain erosion and sedimentation controls to minimize soil erosion and to control sedimentation from affecting
CASE STUDIES. Introduction
 Introduction The City of Winston-Salem faces the challenge of maintaining public infrastructure (e.g., water and sewer lines, storm drains, roads, culverts and bridges) while minimizing the potential impacts
Study 16.5 Probable Maximum Flood (PMF)
") Initial Study Report Meeting Study 16.5 Probable Maximum Flood (PMF) October 22, 2014 Prepared by 10/22/2014 1 Study 16.5 Objectives Develop a site-specific PMP to be used for the derivation of the PMF
Initial Study Report Meeting Study 16.5 Probable Maximum Flood (PMF) October 22, 2014 Prepared by 10/22/2014 1 Study 16.5 Objectives Develop a site-specific PMP to be used for the derivation of the PMF
Standards for Soil Erosion and Sediment Control in New Jersey May 2012
 STANDARD FOR SEDIMENT BASIN Definition A barrier, dam, excavated pit, or dugout constructed across a waterway or at other suitable locations to intercept and retain sediment. Basins created by construction
September 6, City of Thornton 9500 Civic Center Drive Thornton, CO (303) RE: Maverik Thornton, CO - Drainage Report
 RE: Maverik Thornton, CO - Drainage Report") September 6, 2016 City of Thornton 9500 Civic Center Drive Thornton, CO 80229 (303) 538-7295 RE: Maverik Thornton, CO - Drainage Report As per your request, we are submitting to you the drainage report
September 6, 2016 City of Thornton 9500 Civic Center Drive Thornton, CO 80229 (303) 538-7295 RE: Maverik Thornton, CO - Drainage Report As per your request, we are submitting to you the drainage report
Appendix B Equations and Examples
 Equations and Examples Purpose The purpose of this appendix is to provide background equations and example problems for clarity of calculations used throughout the manual. This appendix is divided into
Black Gore Creek 2013 Sediment Source Monitoring and TMDL Sediment Budget
 Black Gore Creek 2013 Sediment Source Monitoring and TMDL Sediment Budget Prepared for: Prepared By: - I. Introduction The Black Gore Creek Total Maximum Daily Load (TMDL) was developed in collaboration
Storm Sewer Design [2]
![Storm Sewer Design [2]](/thumbs/82/86956590.jpg "Storm Sewer Design [2]") Class 5 [1] Storm Sewer Design 9. Check Q < Qf and Vmax > vf > Vmin. Vmin is normally specified to avoid sedimentation. This will normally be 1.0 m/s at pipe full condition. (BS EN 752 suggests that for
Class 5 [1] Storm Sewer Design 9. Check Q < Qf and Vmax > vf > Vmin. Vmin is normally specified to avoid sedimentation. This will normally be 1.0 m/s at pipe full condition. (BS EN 752 suggests that for
Estimating Sewage System Flows
 9 Estimating Sewage System Flows DWSD Wholesale Sewer Rates 201 In this module, you will learn the sources of dry and wet weather flows and how these flows are estimated. Three different tools are used
Woodford County Erosion Prevention Plan and Permit. Application #
 Woodford County Erosion Prevention Plan and Permit Application # Date Instructions: Applicant will complete Parts A and B, and attach a proposed site diagram. This diagram must be completed in accordance
Attachment B to Technical Memorandum No.2. Operations Plan of Ross Valley Detention Basins
 Attachment B to Technical Memorandum No.2 Operations Plan of Ross Valley Detention Basins Operations Plan of Ross Valley Detention Basins Stetson Engineers Inc. January 26, 2011 1.0 Introduction Achieving
APPROVED JURISDICTIONAL DETERMINATION FORM U.S. Army Corps of Engineers
 APPROVED JURISDICTIONAL DETERMINATION FORM U.S. Army Corps of Engineers This form should be completed by following the instructions provided in Section IV of the JD Form Instructional Guidebook. SECTION
Stormwater Capacity Analysis for Westover Branch Watershed
 Stormwater Capacity Analysis for Westover Branch Watershed Pimmit Run Little Pimmit Run, Mainstem Stohman's Run Gulf Branch Pimmit Run Tributary Little Pimmit Run, W. Branch Little Pimmit Run, E. Branch
Chapter 5 CALIBRATION AND VERIFICATION
 Chapter 5 CALIBRATION AND VERIFICATION This chapter contains the calibration procedure and data used for the LSC existing conditions model. The goal of the calibration effort was to develop a hydraulic
Coarse Sediment Traps
 Coarse Sediment Traps SEDIMENT CONTROL TECHNIQUE Type 1 System Sheet Flow Sandy Soils Type 2 System [1] Concentrated Flow Clayey Soils [2] Type 3 System Supplementary Trap Dispersive Soils [1] Though primarily
City of San Marcos Storm Water Pollution Program
 City of San Marcos Storm Water Pollution Program ECON 421 (Public Economics) Spring 2017 Robert Brown Professor of Economics California State University San Marcos Reed Thornberry Storm Water Project Manager
Template for Sediment and Erosion Control Plan General Instructions
 Template for Sediment and Erosion Control Plan General Instructions Introduction: Soil erosion and sediment deposition from farmlands can contribute to degraded surface water quality. Sediment delivery
Relationship between rainfall and beach bacterial concentrations on Santa Monica Bay beaches
 85 IWA Publishing 2003 Journal of Water and Health 01.2 2003 Relationship between rainfall and beach bacterial concentrations on Santa Monica Bay beaches Drew Ackerman and Stephen B. Weisberg ABSTRACT
Template for Sediment and Erosion Control Plan General Instructions. Section Instructions
 Template for Sediment and Erosion Control Plan General Instructions Introduction: Soil erosion and sediment deposition from farmlands can contribute to degraded surface water quality. Sediment delivery
APPENDIX B DRAINAGE REPORT
 APPENDIX B DRAINAGE REPORT B-1 South Lamar Blvd. Transportation Corridor Study Drainage Report Prepared for: City of Austin and HDR, Inc. Prepared by: and Services, Inc. Final 07-09-2015 Michael C. Meriwether,
Technical Memorandum No RAINFALL
 Pajaro River Watershed Study in association with Technical Memorandum No. 1.2.2 RAINFALL Task: Collection and Analysis of Rainfall Data To: PRWFPA Staff Working Group Prepared by: J. Schaaf Reviewed by:
Large-Scale Sediment Retention Device Testing (ASTM D 7351) SedCatch Sediment Basket Inlet Filter Exposed to 1.5% Sediment Load
 SedCatch Sediment Basket Inlet Filter Exposed to 1.5% Sediment Load") Large-Scale Sediment Retention Device Testing (ASTM D 7351) of SedCatch Sediment Basket Inlet Filter Exposed to 1.5% Sediment Load February 2010 Submitted to: SedCatch Environmental Products 8380 Point
Large-Scale Sediment Retention Device Testing (ASTM D 7351) of SedCatch Sediment Basket Inlet Filter Exposed to 1.5% Sediment Load February 2010 Submitted to: SedCatch Environmental Products 8380 Point
Chapter 7 Mudflow Analysis
 Chapter 7 Mudflow Analysis 7.0 Introduction This chapter provides information on the potential and magnitude of mud floods and mudflows that may develop in Aspen due to rainfall events, snowmelt, or rain
Climate Adaptation Challenges for Boston s Water and Sewer Systems
 National Association of Flood & Stormwater Management Agencies Climate Adaptation Challenges for Boston s Water and Sewer Systems John P Sullivan P.E. October 15,2014 Boston 1630 Boston 1630-2012 Boston
The effectiveness of the Natural Resource Conservation Service (NRCS) and Huff rainfall distribution methods for use in detention basin design
 and Huff rainfall distribution methods for use in detention basin design") Scholars' Mine Masters Theses Student Theses and Dissertations Spring 2010 The effectiveness of the Natural Resource Conservation Service (NRCS) and Huff rainfall distribution methods for use in detention
Scholars' Mine Masters Theses Student Theses and Dissertations Spring 2010 The effectiveness of the Natural Resource Conservation Service (NRCS) and Huff rainfall distribution methods for use in detention
Instream Sediment Control Systems
 Instream Sediment Control Systems INSTREAM PRACTICES Photo 1 Photo 2 Modular sediment The information contained within this series of fact sheets deals only with the design of temporary instream sediment
ASSESSMENT OF STORM DRAIN SOURCES OF CONTAMINANTS TO SANTA MONICA BAY VOLUME I ANNUAL POLLUTANTS LOADINGS TO SANTA MONICA BAY FROM STORMWATER RUNOFF
 ASSESSMENT OF DRAIN SOURCES OF CONTAMINANTS TO SANTA MONICA BAY I ANNUAL POLLUTANTS LOADINGS TO SANTA MONICA BAY FROM WATER by Michael K. Stenstrom Department of Civil and Environmental Engineering University
Rainfall Observations in the Loxahatchee River Watershed
 Rainfall Observations in the Loxahatchee River Watershed Richard C. Dent Loxahatchee River District September 1997 Introduction Rain is a common occurrence in south Florida, yet its presence or absence
WELCOME Lake Wabukayne OPEN HOUSE
 WELCOME Lake Wabukayne Sediment Removal Project OPEN HOUSE We are here to: Update you, the community, on recent developments and activities at Lake Wabukayne Present the preferred alternative and receive
Chapter 7 Mudflow Analysis
 Chapter 7 Mudflow Analysis 7.0 Introduction This chapter provides information on the potential and magnitude of mud floods and mudflows that may develop in Aspen due to rainfall events, snowmelt, or rain
Clark Regional Wastewater District
 2016 Clark Regional Wastewater District Infiltration and Inflow Report For Salmon Creek Treatment Plant February 13, 2017 In Compliance with the NPDES Waste Discharge Permit No. WA-002363-9 Special Condition
UTILITY REPORT FOR THORNTON SELF STORAGE THORNTON, COLORADO
 UTILITY REPORT FOR THORNTON SELF STORAGE THORNTON, COLORADO Prepared by: Bowman Consulting 63 Park Point Dr. Suite 1 Golden, CO 841 (33)-81-29 June 29, 215 Revised August 14, 215 Revised September 3, 215
Large-Scale Sediment Retention Device Testing (ASTM D 7351) SedCatch Sediment Basket Inlet Filter Exposed to 6% Sediment Load
 SedCatch Sediment Basket Inlet Filter Exposed to 6% Sediment Load") Large-Scale Sediment Retention Device Testing (ASTM D 7351) of SedCatch Sediment Basket Inlet Filter Exposed to 6% Sediment Load February 2010 Submitted to: SedCatch Environmental Products 8380 Point O
Large-Scale Sediment Retention Device Testing (ASTM D 7351) of SedCatch Sediment Basket Inlet Filter Exposed to 6% Sediment Load February 2010 Submitted to: SedCatch Environmental Products 8380 Point O
Stormwater Management Master Plan
 City of New Berlin Stormwater Management Master Plan June 2000 Report Contents Executive Summary... ES Section 1 Introduction...1-1 1.1 Project Background...1-1 1.2 Purpose and Scope...1-6 Section 2 Objectives
9. PROBABLE MAXIMUM PRECIPITATION AND PROBABLE MAXIMUM FLOOD
 9. PROBABLE MAXIMUM PRECIPITATION AND PROBABLE MAXIMUM FLOOD 9.1. Introduction Due to the size of Watana Dam and the economic importance of the Project to the Railbelt, the Probable Maximum Flood (PMF)
Field Sampling Report
 Field Sampling Report September 26, 2014 Submitted to: Mr. Geoff Brosseau Bay Area Stormwater Management Agencies Association (BASMAA) P.O. Box 2385 Menlo Park, CA 94026 info@basmaa.org Submitted by: 4749
Hydrology Study Report
 Hafeez Consulting www.hafeezconsulting.com Civil/ Structural Engineering, Design & Construction 1451 S. Hacienda St. Anaheim CA 92804 (714) 225-4565 Fax (714)917-2977 engineer@hafeezconsulting.com Hydrology
Construction Exits Vibration grids
 Construction Exits Vibration grids SEDIMENT CONTROL TECHNIQUE Type 1 System Sheet Flow Sandy Soils Type 2 System Concentrated Flow Clayey Soils [1] Type 3 System Supplementary Trap Dispersive Soils [1]
3.11 Floodplains Existing Conditions
 Other stormwater control practices may be needed to mitigate water quality impacts. In addition to detention facilities, other practices such as vegetated basins/buffers, infiltration basins, and bioswales
CITY OF EAST PEORIA SNOW AND ICE CONTROL PROGRAM INTRODUCTION
 CITY OF EAST PEORIA SNOW AND ICE CONTROL PROGRAM INTRODUCTION The responsibility for providing snow and ice control on East Peoria s 240 lane miles of streets and alleys rests with the Street Divisions
August 2006 El Paso. Policy Factors
 August 2006 El Paso Flooding: Technical and Policy Factors John Walton University of Texas at El Paso El Paso, Texas UTEP History Deficiencies in El Paso Arroyo drainage systems were multitudinous and
Tracking California s Trash Project
 Tracking California s Trash Project Evaluation of the On-land Visual Assessment Protocol as a Method to Establish Baseline Levels of Trash and Detect Improvements in Stormwater Quality State Water Resources
Final Drainage Report
 Final Drainage Report Expo Rail Operations and Maintenance Facility Santa Monica, California Prepared for: Exposition Metro Line Construction Authority Prepared by: W2 Design, Inc. 50 S. De Lacey Avenue
The Winter of Zero Visibility
 The Winter of Zero Visibility Tom Reynolds & Shawn Patterson Town of Marshfield, MA Marc Valenti Town of Lexington, MA Insert Marshfield Picture Here Daniel Nee City of Boston, MA Who is: Town of Lexington
CITY OF MINOT SNOW REMOVAL PLAN October 2018
 CITY OF MINOT SNOW REMOVAL PLAN October 2018 1.0 GENERAL This plan has been written to provide information regarding snow removal procedures and policies. The plan provides guidance, while maintaining
Stormwater Inlet Sediment Traps
 Stormwater Inlet Sediment Traps SEDIMENT CONTROL TECHNIQUES Photo 1 Kerb inlet Photo 2 Field (drop) inlet Table 1 provides the recommended default classification of various sediment control systems suitable
APPENDIX G APPENDIX G SEDIMENT CONTAINMENT SYSTEM DESIGN RATIONALE
 APPENDIX G SEDIMENT CONTAINMENT SYSTEM DESIGN RATIONALE March 18, 2003 This page left blank intentionally. March 18, 2003 G-2 FIGURES Page # Figure G.1 Estimated Runoff from Precipitation Over Different
THE STATE OF SURFACE WATER GAUGING IN THE NAVAJO NATION
 THE STATE OF SURFACE WATER GAUGING IN THE NAVAJO NATION Aregai Tecle Professor of Hydrology Northern Arizona University Flagstaff, AZ Acknowledgement Many thanks to my research team mates and Elisabeth
2012 Rainfall, Runoff, Water Level & Temperature Beebe Lake Wright County, MN (# )
") www.fixmylake.com 18029 83 rd Avenue North Maple Grove, MN 55311 mail@freshwatersci.com (651) 336-8696 2012 Rainfall, Runoff, Water Level & Temperature Beebe Lake Wright County, MN (#86-0023) Prepared
www.fixmylake.com 18029 83 rd Avenue North Maple Grove, MN 55311 mail@freshwatersci.com (651) 336-8696 2012 Rainfall, Runoff, Water Level & Temperature Beebe Lake Wright County, MN (#86-0023) Prepared
Drainage Analysis. Appendix F
 Drainage Analysis Appendix F Golden View Drive Elizabeth Street LMORE CREEK Ricky Road Rabbit Creek Road LITTLE RABBIT CREEK East 156th Avenue MOA Project #10-026 Golden View Drive Intersection
HISTORY OF CONSTRUCTION FOR EXISTING CCR SURFACE IMPOUNDMENT PLANT GASTON ASH POND 40 CFR (c)(1)(i) (xii)
(1)(i) (xii)") HISTORY OF CONSTRUCTION FOR EXISTING CCR SURFACE IMPOUNDMENT PLANT GASTON ASH POND 40 CFR 257.73(c)(1)(i) (xii) (i) Site Name and Ownership Information: Site Name: E.C. Gaston Steam Plant Site Location:
HISTORY OF CONSTRUCTION FOR EXISTING CCR SURFACE IMPOUNDMENT PLANT GASTON ASH POND 40 CFR 257.73(c)(1)(i) (xii) (i) Site Name and Ownership Information: Site Name: E.C. Gaston Steam Plant Site Location:
Weighting of Field Monitoring Data With Probability Distributions of Daily Rainfall
 Weighting of Field Monitoring Data With Probability Distributions of Daily Rainfall Abstract James H. Lenhart, PE, D.WRE and Scott A. de Ridder CONTECH Stormwater Solutions, 11835 NE Glenn Widing Drive,
Lower Tuolumne River Accretion (La Grange to Modesto) Estimated daily flows ( ) for the Operations Model Don Pedro Project Relicensing
 Estimated daily flows ( ) for the Operations Model Don Pedro Project Relicensing") Lower Tuolumne River Accretion (La Grange to Modesto) Estimated daily flows (1970-2010) for the Operations Model Don Pedro Project Relicensing 1.0 Objective Using available data, develop a daily time series
Lower Tuolumne River Accretion (La Grange to Modesto) Estimated daily flows (1970-2010) for the Operations Model Don Pedro Project Relicensing 1.0 Objective Using available data, develop a daily time series
Orica Australia Pty Ltd Ammonium Nitrate Facility Upgrade
 Orica Australia Pty Ltd Ammonium Nitrate Facility Upgrade January 2010 Revision 0 Contents 1. Introduction 1 1.1 Purpose 1 1.2 Objectives 1 1.3 Relevant Environmental Legislation, Guidelines and Policies
APPENDIX B WORKSHEETS & EXHIBITS
 APPENDIX B WORKSHEETS & EXHIBITS A worksheet provides the designer a representation of a measure that allows for input of specific design criteria. The plan designer will be required to assess field conditions
Lecture 14: Floods. Key Questions
 Lecture 14: Floods Key Questions 1. What is an upstream flood? 2. What is a downstream flood? 3. What were the setup conditions that cause floods? 4. What is a 100-year flood? 5. How are 100-year flood
U-Shaped Sediment Traps
 U-Shaped Sediment Traps SEDIMENT CONTROL TECHNIQUE Type 1 System Sheet Flow Sandy Soils Type 2 System Concentrated Flow Clayey Soils [1] Type 3 System Supplementary Trap Dispersive Soils [1] Generally