& ~ Hurricane Season Review ~
|
|
|
- Molly Johnston
- 6 years ago
- Views:
Transcription


")
1 & ~ Hurricane Season Review ~ St. Maarten Hurricane Gonzalo: Monday October 13 th 5:15pm Meteorological Department St. Maarten Airport Rd. # 69, Simpson Bay (721) or (721)
2 The information contained in this Climatological Summary must not be copied in part or any form, or communicated for the use of any other party without the expressed written permission of the Meteorological Department St. Maarten. All data and observations were recorded at the Princess Juliana International Airport. This document is published by the Meteorological Department St. Maarten, and a digital copy is available on our website. Pictures on page 8 are compliments DCOMM, staff and public. All rights of the enclosed information remain the property of: Meteorological Department St. Maarten Airport Road #69, Simpson Bay St. Maarten, Dutch Caribbean Prepared by: Sheryl Etienne-LeBlanc Carshena Gordon Forecast Section Telephone: (721) or (721) Fax: (721) Website: meteo@sintmaartengov.org MDS February 2015 Page 2 of 24
3 Table of Contents Introduction...4 Island Climatology...5 About Us....6 Hurricane Season...7 Local Effects...7 Summary...9 Overview of Storms formed Climate Data...13 Rainfall...13 Temperature...15 Wind...16 Air Pressure...18 Cloud Cover...18 Sunshine Duration...19 Summary...20 Conclusion...20 Outlook for Rainfall Outlook for Feb-Mar-Apr Tropical Cyclone Names...22 Appendix.. 23 Stages of Tropical Cyclone Development...23 Saffir-Simpson Hurricane Scale...24 Watches & Warnings...24 MDS February 2015 Page 3 of 24

 is located on the south western strip of St. Maarten at latitude 18.")
4 Introduction In the extreme north east section of the Eastern Caribbean, lies an island which is approximately 37 square miles shared by two countries. French St. Martin to the north and Dutch St. Maarten to the south which occupies 16 square miles. The island is relatively flat but has a central range with various peaks. Pic Paradise on the French side is the highest point (1400ft). The Princess Juliana International Airport (TNCM) is located on the south western strip of St. Maarten at latitude o north and longitude o west. MDS February 2015 Page 4 of 24
5 ISLAND CLIMATOLOGY Based on records ( ) at Princess Juliana International Airport (PJIA), the normal annual rainfall is approximately 1160mm or 46 inches. Like many other Caribbean islands the driest months are from January to June while the wettest months are from July to November. December, May and June can be considered as transition months since they can be either dry or wet. The driest month on record is March while the wettest is November. On average there are about 140 rain days a year with April having the least (8 days) and November the most (15 days). Rainfall during December to April can be attributed mainly from old frontal boundaries or shear lines dipping southwards from north east United States while the rainfall during May and June are often from upper level trough interactions and from July onwards, rainfall is mostly from tropical cyclones. The normal daily average temperature is about 27 o C or 81 o F, the normal maximum and minimum temperatures are 32 o C and 23 o C respectively. August and September are the warmest months while February is the coolest. On average St. Maarten receives approximately 251 hours of sunshine monthly and 8 to 10 hours daily. The months with the most sunshine hours are March and April and the least hours are recorded in November.. MDS February 2015 Page 5 of 24
6 About Us The Meteorological Department of St. Maarten (MDS) most commonly referred to as the Met. Office is a scientific organization that operates 24 hours a day, all year round, monitoring and continuously keeping watch of the weather conditions across the island. Reliable early warnings are issued in the event of any severe weather, seismic or climatic events allowing decision-makers, communities, and individuals to be better prepared; thus avoiding socio-economic setbacks and helping to improve the quality of life for everyone on St. Maarten and the surrounding region. Our Mission Our aim is to protect life and property, by providing reliable meteorological services in support of the social and economic development of the country through monitoring and predicting weather & climate, using up-to-date technology to enable optimal utilization of resources. We issue appropriate weather forecasts and warnings for St. Maarten, its adjacent waters and air space. Our Vision The vision of the Meteorological Department of St. Maarten is to achieve excellence in meteorological science, and the provision of quality weather and climate services. Tasks The objectives of the Meteorological Department of St. Maarten are to: Monitor weather conditions 24/7, 365 ¼ days a year Observe, record, and transmit upper-air data (temperature, humidity, winds, etc.) Correspond with regional & international weather stations on various meteorological & climatological phenomena. Produce and disseminate weather forecasts and warnings to the general public, marine and aviation industries. Issue special reports whenever necessary, such as in the event of heavy rainfall, tropical storms, and/or other hazardous weather phenomena. Manage and maintain meteorological and climatological data on a regular basis (monthly and yearly). Uphold national & international policy in the field of meteorology, climatology and other geophysical fields. MDS February 2015 Page 6 of 24
7 2014 Hurricane Season The 2014 Atlantic Hurricane Season was a relatively quiet season as was predicted. NOAA s latest prediction was for a below-average season with 7-12 named storms, 3-6 hurricanes with 0-2 major hurricanes. Actually, there were 8 named storms, 6 hurricanes with 2 major hurricanes. Two storms, Edouard and Gonzalo became major hurricanes. Major hurricanes are those reaching categories 3 and above was the second year in a row that the Atlantic Hurricane Season was below average. Some of the reasons being; the presence of extensive dry air in key areas of development in the early and mid-season, cooler than normal sea surface temperatures and large areas of vertical wind shear. Local Effects In the 2014 hurricane season, there were only a few impacts on St. Maarten. Early August, convection associated with Tropical Storm Bertha drifted very close to St. Maarten, however only gusty winds were felt on the island, no significant rainfall or damage were reported. On September 3 rd and 4 th a tropical wave affected the island by producing overcast conditions and heavy rainfall. A total of 43.4mm / 1.7 inches of rainfall was recorded. On October 13 th, Hurricane Gonzalo grazed the island, leaving some structural damaged, downed power lines and minor flooding. A total of 144.7mm / 5.6inches of rainfall was recorded. A maximum wind gust of 69 kt. /79 mph was recorded before data was lost at the office due to flooding. On November 7th, the interaction of a low pressure center and a surface trough brought a tremendous amount of rainfall across the island. Massive flooding was reported island wide. The Meteorological Department recorded 255.0mm/10 inches of rainfall in a 24-hour period. MDS February 2015 Page 7 of 24

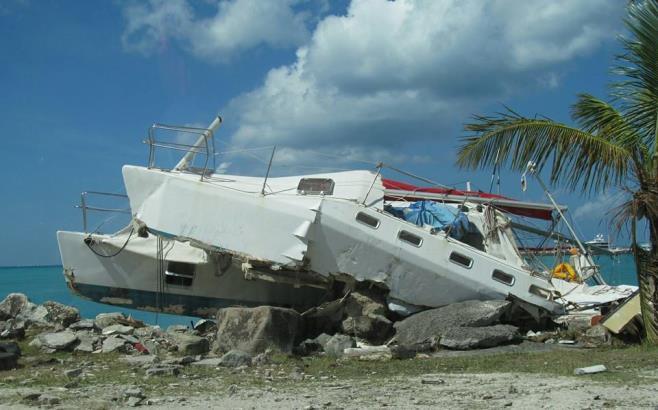
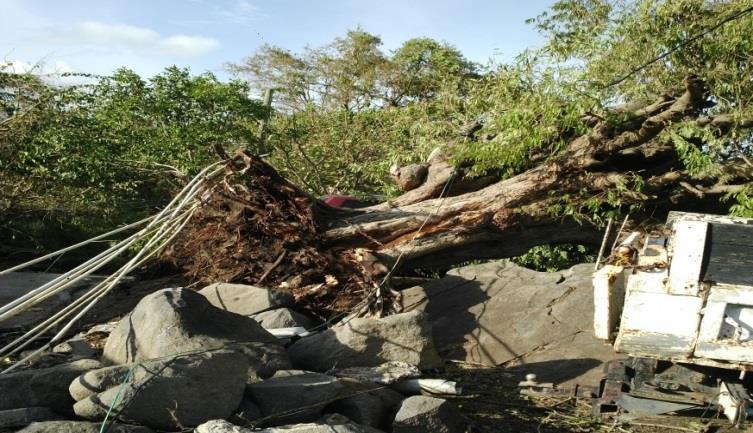
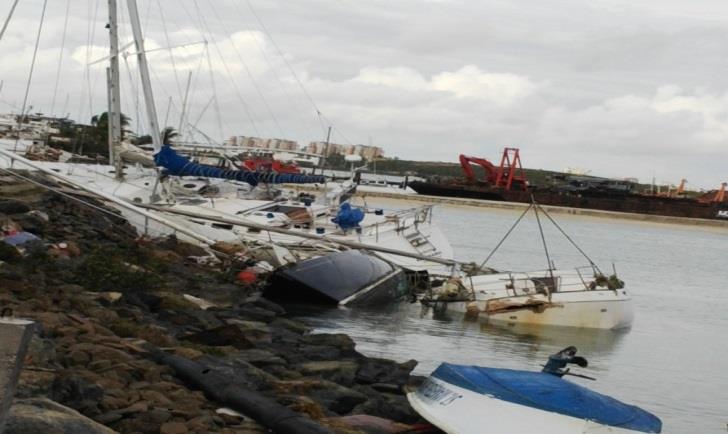

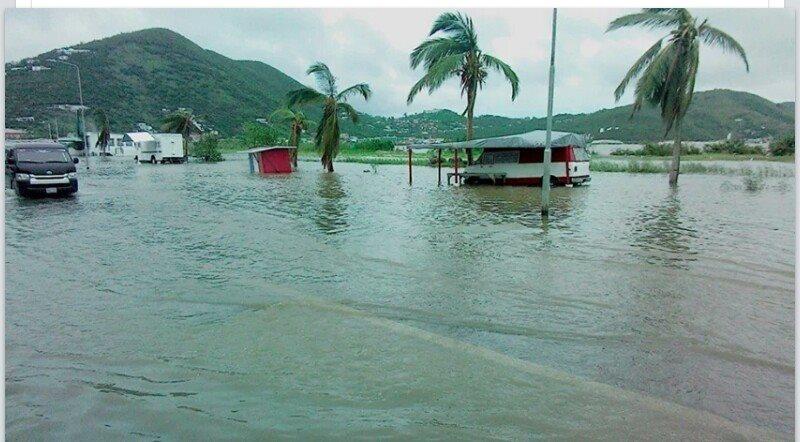
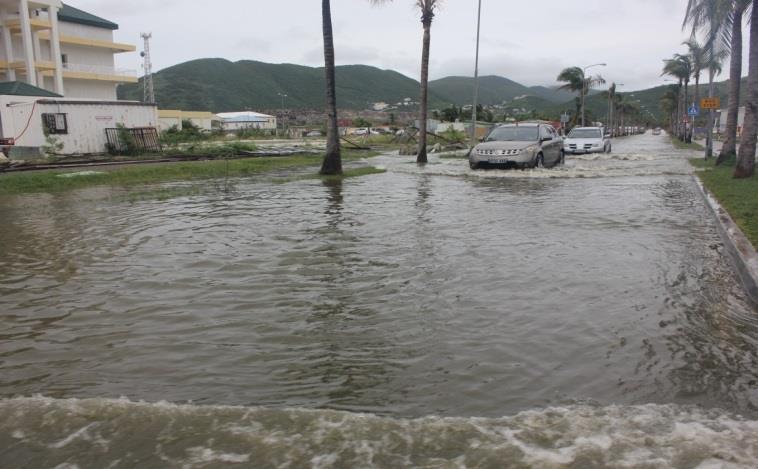

8 Some of the destruction done by Hurricane Gonzalo Flooding of November 7 th MDS February 2015 Page 8 of 24
9 Summary Below is a recap of the 2014 Atlantic Hurricane Season in relation to its effects on St. Maarten. Storm Name Active Dates Highest Category TD 2 Jul. 21 Jul. 23 Tropical Depression Min. Pressure (mbar) Max. Winds Local Effects Observed Rainfall (mm) Observed Winds Gusts Kt. Mph kts Mph None 1 Arthur Jul. 1 - Jul. 5 Hurricane None 2 Bertha Aug.1 - Aug. 6 Hurricane Cat Minor Cristobal Aug.23-Aug. 29 Hurricane None 4 Dolly Sept. 1- Sept. 3 Tropical Storm None 5 Edouard Sept.11-Sept.19 Major Hurricane Cat. 3 6 Fay Oct. 10- Oct. 13 Hurricane Cat. 1 7 Gonzalo Oct. 12- Oct. 19 Major Hurricane Cat None None Minimal Hanna Oct. 22- Oct. 28 Tropical Storm None MDS February 2015 Page 9 of 24
10 Overview of the Storms formed in the 2014 Hurricane Season Hurricane Arthur (July 1 st to 5 th ) On June 27 th, a non-tropical area of low pressure, formed over South Carolina and moved into the southwestern Atlantic the next day. It was upgraded to a tropical depression on July 1 st. The depression was further upgraded to Tropical Storm Arthur nine hours later based on surface observations from Grand Bahama. The cyclone attained Category 1 hurricane intensity on July 3 rd and further intensified to reach Category 2 strength the next day. Arthur became extratropical on July 5 th. Hurricane Bertha (August 1 st to 6 th ) Bertha originated from a tropical wave that moved off of the west coast of Africa on July 24 th with limited thunderstorm activity. Increased convection resulted in the formation of a low pressure area on July 29 th. The low finally acquired enough persistent deep convection to be declared a tropical storm on August 1 st, when it was located about 300 miles east southeast of Barbados. Bertha passed north of Martinique and south of Puerto Rico by August 2 nd and rapidly intensified, becoming a hurricane early on August 4 th about 170 miles north northeast of San Salvador in the central Bahamas. By August 6 th, the tropical cyclone transitioned into a frontal extra-tropical. Bertha; a category 1 hurricane caused 2 rip current deaths in the United states Hurricane Cristobal (August 23 rd to 29 th ) A strong tropical wave developed into Tropical Depression Four while located near Turks and Caicos Islands on August 23 rd. The system intensified into Tropical Storm Cristobal while moving northwestward on the following day. However, Cristobal soon decelerated and moved erratically due to an upper-level trough. Despite being continually plagued by wind shear, the storm managed to reach Category 1 hurricane intensity early on August 25 th. The storm lost its tropical characteristics and transitioned into an extratropical cyclone while located well southeast of Newfoundland on August 29 th. Tropical Storm Dolly (September 1 st to 3 rd ) A tropical wave crossed the Yucatán Peninsula quickly strengthened after entering the Bay of Campeche, and became a Tropical Depression Five on September 1 st. The tropical depression had strengthened into Tropical Storm Dolly the following day. Tropical Storm Dolly made landfall near Tampico, Mexico on September 3 rd and dissipated that same day after losing its well defined center of circulation over Eastern Mexico. One fatality was attributed to the storm. MDS February 2015 Page 10 of 24
11 Major Hurricane Edouard (September 11 th to 19 th ) Edouard developed from a westward-moving tropical wave that exited the coast of western Africa late on September 6 th. By September 11 th, deep convection had become sufficiently organized to designate the system as a tropical depression about 720 miles west of the Cape Verde Islands. Edouard became a major hurricane early on September 16 th, reaching its peak intensity of 105 kt. that morning when it was located about 360 miles east of Bermuda, making it the first major hurricane to develop in the Atlantic basin since Hurricane Sandy of Edouard weakened to a tropical storm late on September 18 th, and degenerated into a strong post-tropical cyclone early on September 19 th about 400 miles west of the western Azores Islands. Hurricane Fay(October 10 th to 13 th ) A lobe of vorticity broke off of a mid- to upper-level trough over the east-central Atlantic Ocean and moved westward on October 7 th. A large area of showers and thunderstorms formed in association with this system that day several hundred miles northeast of the northern Lesser Antilles, with the developing convection possibly enhanced by a surge of moisture from an easterly wave passing to the south. Fay was a short-lived hurricane of non-tropical origin that passed over Bermuda before turning east-northeastward into the north-central Atlantic Ocean. Fay became the first hurricane to make landfall on Bermuda since Emily of Major Hurricane Gonzalo (October 12 th to 19 th ) The development of Gonzalo can be traced to a tropical wave that departed the west coast of Africa on October 4 th. Thunderstorm activity associated with system increased in organization, and it is estimated that a tropical depression formed around 8pm October 11 th about 340 miles east of the Leeward Islands. The tropical depression strengthened and became a tropical storm on October 12 th when it was located about 330 miles southeast of St. Maarten. Gonzalo began to rapidly strengthen and became a hurricane late October 13 th when it was located just east of St. Maarten. Gonzalo made landfall on the island of St. Martin at about 2245 UTC with an estimated intensity of 75 kt, and passed over Anguilla about 45 minutes later. Tropical Storm Hanna(October 22 nd to 28 th ) The genesis of Hanna was associated with the remnants of eastern Pacific Tropical Storm Trudy. A weak area of surface low pressure developed in association with a mid-level feature on October 21 st about 60 miles east of Veracruz, Mexico, and the low moved slowly eastward while producing disorganized showers and thunderstorms that day. The system degenerated into a remnant low by October 23 rd and on October 26 th, the remnants of the depression became a little better organized. The low became a tropical depression again on October 27 th, when it was located about 70 miles east of the Nicaragua/Honduras border. The cyclone strengthened to a tropical storm 6 hours later and maintained minimal tropical storm strength until it moved inland over northeastern Nicaragua. Hanna weakened to a tropical depression a couple of hours after it moved inland, and then degenerated into a remnant low over eastern Honduras on October 28 th. MDS February 2015 Page 11 of 24

12 2014 Atlantic Hurricane Season Storm Track MDS February 2015 Page 12 of 24
. 391.5 mm or 15.4 inches was recorded during the first half of 2014 while 789.")

13 (mm) MDS Climatological Summary Climate Data Rainfall The total rainfall recorded at the Princess Juliana International Airport, for the year 2014 was mm or 46.5 inches. This amount was slightly above the normal range, normal annual rainfall about 1026mm mm/40-42 inches ( ) mm or 15.4 inches was recorded during the first half of 2014 while 789.3mm or 31.1 inches was recorded during the second half of the year Rainfall Vs Normal Rainfall Jan Feb Mar Apr May Jun Jul Aug Sep Oct Nov Dec Rainfall Normal Fig. 1 May, October and November exceeded the normal monthly rainfall for 2014, while the remaining months were either below normal or near normal. November was the wettest month of the year, with a total of mm or 12.9 inches; while the driest month was March with 10.1 mm or 0.4 of an inch of rainfall. The wettest day of the year was November 7 th, when mm or 10.0 inches was recorded which was as a result of an upper level low interacting with a surface trough across the area. MDS February 2015 Page 13 of 24
14 (mm) No. of Days MDS Climatological Summary Monthly Total Rain Days Jan Feb Mar Apr May Jun Jul Aug Sep Oct Nov Dec Fig. 2 A rain day is considered any day which records 1.0 mm or more rainfall. Normally there are approximately 140 rain days in a year on St. Maarten. For 2014, there were 133 rain days with the month of January having the most (16 days) followed by February and August with fifteen (15) days each. Just a few records were broken in November was the wettest since 2003 and exceptionally wet compared to November March 2014 was the driest March since 2000 and drier than March November 7 th was the wettest day since November 18 th 1999 (Hurricane Lenny) Rainfall Vs 2013 Rainfall Jan Feb Mar Apr May Jun Jul Aug Sep Oct Nov Dec MDS February 2015 Page 14 of 24
15 ( C) (oc) MDS Climatological Summary 2014 Temperature The average temperature recorded in 2014 was 27.3 C (81 F) which was normal. The 30-year normal ( ) is 27.3 o C. September was the warmest month while February was the coolest month which is normal for St. Maarten. There was a variation of about 3.2 o C between the warmest and coolest month Monthly Average Temperature Jan Feb Mar Apr May Jun Jul Aug Sep Oct Nov Dec The highest daily temperature recorded in 2013 was 32.7 C (91 F) and was recorded on August 19 th while the lowest daily temperature was recorded on February 22 nd and November 8 th as 22.1 C (72 F). The difference between the maximum and minimum temperatures recorded was 10.6 C Temperature Statistics Jan Feb Mar Apr May Jun Jul Aug Sep Oct Nov Dec Avg. Temp. Max. Temp. Min. Temp. MDS February 2015 Page 15 of 24
16 (knots) MDS Climatological Summary Annual Average Temperature Vs Normal Avg. Temp. Normal Temp Annual Average temperature for the past 15 years has been below normal most of the time and becoming near normal in the most recent years. Wind Surface wind at the Princess Juliana International Airport for 2014 was generally from the east at an average speed of 9.4 knots (11 mph) which is normal compared to the 30-year average ( ). The highest monthly average wind speeds were recorded in January as 11.3 knots (13 mph); while October had the lowest monthly average wind speeds at 7.1 knots (8 mph). The highest wind gust for the year occurred on October 13 th at a speed of 69 knots (79 mph). This was during the passage of Hurricane Gonzalo Wind Speed Statistics Jan Feb Mar Apr May Jun Jul Aug Sep Oct Nov Dec Avg. Wind Speed Max. Wind Speed MDS February 2015 Page 16 of 24

17 This following wind analysis was derived using the average hourly wind speeds and direction from 1 st January to 31 st December % of the time winds came from between 60 and 80 degrees, i.e between northeast and East northeast. 67% of the time winds were coming from between 80 and 120 degrees, i.e. between East Northeast and east. 50% of the time in 2014 wind speeds at Juliana were between 5 and 10 knots. 40% of the time wind speeds were between 10 and 15 knots. 8% of the time wind speeds were between 0 and 5 knots and 2% of the time speeds were between 15 and 20 knots. MDS February 2015 Page 17 of 24
18 (%) Millibars MDS Climatological Summary 2014 Air Pressure At the Princess Juliana International the average Mean Sea-Level Pressure for 2014 was millibars. The Highest daily average was recorded on July 8 th as mb while the lowest daily average of mb occurred on October 13 th Average Pressure (QNH) Jan Feb Mar Apr May Jun Jul Aug Sep Oct Nov Dec Cloud Cover The average cloud cover for St. Maarten over the past year as recorded at the Princess Juliana International Airport was 47.6 %. The highest monthly average cloud cover was 62.0 % during the month of May while March had the lowest value of 37.0 % Monthly Cloud Coverage Jan Feb Mar Apr May Jun Jul Aug Sep Oct Nov Dec MDS February 2015 Page 18 of 24
19 (hours) (hours) MDS Climatological Summary 2014 Sunshine Duration Approximately 70% of possible sunshine was recorded at the surface at the Princess Juliana International Airport, that is, hours out of a possible hours. The average daily sunshine duration was 8 hours 36 minutes. March received the most hours of sunshine in 2014, an average of 9 hours and 36 minutes per day; while May received the least with a daily average of 7 hours and 42 minutes. Maximum daily sunshine hours was recorded on May 6 th as 11 hours 42 mins. On August 2 nd and September 4 th absolutely no sunshine was recorded due to cloudy to overcast skies Daily Average Sunshine Jan Feb Mar Apr May Jun Jul Aug Sep Oct Nov Dec Monthly Total Sunshine Duration Jan Feb Mar Apr May Jun Jul Aug Sep Oct Nov Dec Monthly Total MDS February 2015 Page 19 of 24
20 Statistic Summary Below is a recap of the 2014 climate data, in terms of averages, extremes, and totals: Rainfall Total Rainfall for the year mm 46.5 inches Wettest Month mm/12.9 in November Driest Month 10.1 mm/0.4 in March 24-hr Maximum Rainfall mm/10.0 in November 7 th Number of Rain Days (with 1.0+ mm) Temperature Conclusion 133 days Average Air Temperature 27.3 C 81 F Absolute Maximum Temperature 32.7 C 91 F Absolute Minimum Temperature 22.1 C 72 F Warmest Month 28.8 C/84 F September Coolest Month 25.6 C/78 F February Average Relative Humidity 73 % Wind & Pressure Average Wind Speed 9.4 knots 11 mph Maximum Wind Gust 69 knots 79 mph Average Air Pressure Sunshine & Clouds mbs. Average Cloud Coverage 47.6 % Average Daily Sunshine Duration 8 hours : 36 minutes This report provides a summary of all the meteorological data recorded at the Princess Juliana International Airport during the year The data was collected from various meteorological parameters under regulations stipulated by the World Meteorological Organization. These elements include rainfall, relative humidity, atmospheric pressure, wind speed and direction, cloud cover and sunshine duration among others. The Meteorological Department St. Maarten (MDS) records and compiles climatological data for use in research in a number of fields and institutions. Records go as far back as the 1950 s in certain parameters. Requests for data must be put in writing through the Department Head. MDS February 2015 Page 20 of 24
 months.")
21 Outlook for 2015 Rainfall Outlook for Feb-Mar-Apr 2015 Rainfall for the next three (3) months February-March-April is hardly predictable at this time for the northeast Caribbean. Based on historical data, the current state of the weather and subjective input, St. Maarten is likely to experience near-normal to above normal Rainfall during the next three (3) months. There is a 35% chance of being Above Normal (more than mm); a 35% chance of being Near Normal (between mm and mm); and a 30% chance of being Below Normal (less than mm). Note that the area indicated by the green arrow is the northeast Caribbean Region. MDS February 2015 Page 21 of 24
22 List of Cyclone names for 2015 Tropical Atlantic Hurricane Season ANA HENRI ODETTE BILL IDA PETER CLAUDETTE JOAQUIN ROSE DANNy KATE SaM ERIKA LaRRY TeRESA FRED MINDY VicTOR GRACE NICHOLAS WANDA BE PREPARED!!! BE ALERT!!! BE READY!!! Be reminded that it only takes one storm to impact our island to make it an active season for us. Therefore, all coastal and island residents need to prepare the same for every season, regardless of how much activity is predicted. MDS February 2015 Page 22 of 24
23 Appendix Stages of Tropical Cyclone Development Below are the decisive factors (criteria) for the various development stages for tropical cyclones: Stage Tropical disturbance Tropical wave Tropical Depression Tropical Storm Hurricane Extra-tropical Cyclone Subtropical Cyclone Post-tropical Cyclone Criteria A discrete system of clouds, showers, and thunderstorms that originates in the tropics and maintains its identity for 24 hours or more. A type of trough of low pressure or tropical disturbance that moves generally from east to west, typically embedded in the tropical easterlies. They are also sometimes called easterly waves. A tropical disturbance that has developed a closed circulation (counterclockwise winds blowing around a center of low pressure in the Northern Hemisphere). Tropical depressions contain maximum sustained (1-minute) winds of 38 mph (62 km/h or 33 knots) or less. A well-organized warm-core tropical cyclone that has maximum sustained (1-minute) winds of mph ( km/h or knots). Once a system reaches tropical storm status, it is given a name by the National Hurricane Center (located in Miami, Florida). A warm-core tropical cyclone that has maximum sustained (1-minute) winds of at least 74mph (119 km/h or 64 knots). Hurricanes are categorized by the Saffir-Simpson Scale (see next page). A cyclone that is no longer tropical in origin, which usually means the system moves away from the tropics and moves toward the poles. An extra-tropical cyclone has no wind speed criteria and may exceed hurricane force. A closed circulation, low-pressure system that has characteristics of both tropical and extra-tropical cyclones. Subtropical cyclones typically have a radius of maximum winds occurring relatively far from the center (usually more than 60 nautical miles), and generally have a less symmetric wind field and distribution of convection (clouds and thunderstorms). A former tropical cyclone that no longer possesses sufficient tropical characteristics to be considered a tropical cyclone. Post-tropical cyclones can, however, continue carrying heavy rains and high winds. MDS February 2015 Page 23 of 24
24 Major MDS Climatological Summary 2014 Saffir-Simpson Hurricane Scale The Saffir-Simpson Hurricane Scale is a 1-5 rating based on the hurricane s intensity, which is used to give an estimate of the potential property damage and flooding expected from a hurricane landfall. Wind speed is the determining factor in the scale. Category Max. Sustained Winds Effects mph km/h knots Minimal Damage Moderate Damage Extensive Damage Extreme Damage Catastrophic Damage Watches & Warnings Tropical Storm Watch Issued when tropical storm conditions (sustained winds of 39-73mph, km/h, or knots) are possible within the specified area within the next 48 hours (2 days). Tropical Storm Warning Issued when tropical storm conditions (sustained winds of 39-73mph, km/h, or knots) are expected somewhere within the specified area within the next 36 hours (1.5 days). Hurricane Watch Issued when hurricane conditions (sustained winds of 74+ mph, 119+ km/h, or 64+ knots) are possible within the specified area within the next 48 hours (2 days). Hurricane Warning Issued when hurricane conditions (sustained winds of 74+ mph, 119+ km/h, or 64+ knots) are expected within the specified area within the next 36 hours (1.5 days). Note: Hurricane preparedness activities become difficult once winds reach tropical storm force, therefore, hurricane watches & warnings are issued well in advance of the anticipated onset of tropical-storm-force winds. MDS February 2015 Page 24 of 24
& ~ Hurricane Season Review ~
 & ~ Hurricane Season Review ~ St. Maarten experienced drought conditions in 2016 with no severe weather events. All Photos compliments Paul G. Ellinger Meteorological Department St. Maarten Airport Rd.
ovember 2008 Antigua and Barbuda Meteorological Service
 ovember 2008 Antigua and Barbuda Meteorological Service The Atlantic Hurricane Season Summary 2008 Special Focus on Antigua and Barbuda The Season in Brief Sixteen (16) named storms formed in the Atlantic
ARUBA CLIMATOLOGICAL SUMMARY 2017 PRECIPITATION
 ARUBA CLIMATOLOGICAL SUMMARY 2017 PRECIPITATION The total amount of rainfall recorded at Reina Beatrix International Airport for the year 2017 was 391.0 mm. This is 17.1 % below normal ( Figure 1 ). During
ARUBA CLIMATOLOGICAL SUMMARY 2014 PRECIPITATION
 ARUBA CLIMATOLOGICAL SUMMARY 2014 PRECIPITATION The total amount of rainfall recorded at Reina Beatrix International Airport for the year 2014 was 309.2 mm. This is 34.4 % below normal ( Figure 1 ). During
2006 ATLANTIC HURRICANE SUMMARY. Weather Research Center Houston, Texas
 2006 ATLANTIC HURRICANE SUMMARY Weather Research Center Houston, Texas Weather Research Center 5104 Caroline Houston, Texas 77004 Phone: 713-529-3076 Fax: 713-528-3538 E-mail: wrc@wxresearch.org 2006 Atlantic
2008 ATLANTIC HURRICANE SUMMARY
 2008 ATLANTIC HURRICANE SUMMARY Hurricane Dolly Hurricane Ike Hurricane Gustav Weather Research Center Houston, Texas Weather Research Center 5104 Caroline Houston, Texas 77004 Phone: 713-529-3076 Fax:
2015 Hurricane Season Summary for Eastern Canada Impacts and Operational Notes
 2015 Hurricane Season Summary for Eastern Canada Impacts and Operational Notes John Parker Canadian Hurricane Centre, Meteorological Service of Canada April, 2016 Storms affecting Canadian territory in
An upper to mid level circulation (Low) in the NW Caribbean is
 in the NW Caribbean is") WEEKLY WEATHER OUTLOOK BELIZE, CENTRAL AMERICA PERIOD: Monday-Monday, Oct. 1 October 8, 2012 DATE ISSUED: Monday, Oct 1, 2012 6:00 am RFrutos EcoSolutions & Services SYNOPSIS: An upper to mid level circulation
WEEKLY WEATHER OUTLOOK BELIZE, CENTRAL AMERICA PERIOD: Monday-Monday, Oct. 1 October 8, 2012 DATE ISSUED: Monday, Oct 1, 2012 6:00 am RFrutos EcoSolutions & Services SYNOPSIS: An upper to mid level circulation
METEOROLOGICAL SERVICE NETHERLANDS ANTILLES & ARUBA CLIMATOLOGICAL SUMMARY 2001
 METEOROLOGICAL SERVICE NETHERLANDS ANTILLES & ARUBA CLIMATOLOGICAL SUMMARY 2001 PUBLISHED BY THE METEOROLOGICAL SERVICE OF THE NETHERLANDS ANTILLES AND ARUBA. FEBRUARY 2002. 1 Table of Contents Introduction...
Storm Summary for Hurricane Joaquin
 Storm Summary for Hurricane Joaquin Wednesday, September 30, 2015 at 5 PM EDT (Output from Hurrevac, based on National Hurricane Center Forecast Advisory #12) Joaquin is currently a Category 1 hurricane
HURRICANES. Part 1/Group 1 Student Handout Historical Occurrence Study 2. Part 2/Group2 Student Handout Storm Tracking 5
 LEARNING EXPERIENCE 1 STUDENT HANDOUT HURRICANES Developed by Rebecca C. Smyth 1, Matt Morris 2,3 and Kathy Ellins 4 1. Research Scientist Associate, Bureau of Economic Geology, Jackson School of Geosciences,
Ch. 11: Hurricanes. Be able to. Define what hurricane is. Identify the life and death of a hurricane. Identify the ways we track hurricanes.
 Ch. 11: Hurricanes Be able to Define what hurricane is. Identify the life and death of a hurricane. Identify the ways we track hurricanes. What are Hurricanes? Smaller than mid-latitude cyclones. Don t
August Forecast Update for Atlantic Hurricane Activity in 2015
 August Forecast Update for Atlantic Hurricane Activity in 2015 Issued: 5 th August 2015 by Professor Mark Saunders and Dr Adam Lea Dept. of Space and Climate Physics, UCL (University College London), UK
Atlantic Basin Satellite Image
 Tropical Update 11 AM EDT Friday, September 7, 2018 Tropical Depression Gordon, Tropical Storm Florence, Potential Tropical Cyclone #8 (90%), Invest 92L (90%) This update is intended for government and
Monthly Long Range Weather Commentary Issued: SEPTEMBER 19, 2016 Steven A. Root, CCM, Chief Analytics Officer, Sr. VP,
 Monthly Long Range Weather Commentary Issued: SEPTEMBER 19, 2016 Steven A. Root, CCM, Chief Analytics Officer, Sr. VP, sroot@weatherbank.com SEPTEMBER 2016 Climate Highlights The Month in Review The contiguous
July Forecast Update for North Atlantic Hurricane Activity in 2018
 July Forecast Update for North Atlantic Hurricane Activity in 2018 Issued: 5 th July 2018 by Professor Mark Saunders and Dr Adam Lea Dept. of Space and Climate Physics, UCL (University College London),
The 2014 Atlantic Hurricane Season. What is New and What to Expect. Mark Chambers President & CEO ImpactWeather, Inc.
 The 2014 Atlantic Hurricane Season What is New and What to Expect Mark Chambers President & CEO ImpactWeather, Inc. Hurricane Climatology for the Gulf of Mexico A Look back at 2013 The outlook for this
Champaign-Urbana 2001 Annual Weather Summary
 Champaign-Urbana 2001 Annual Weather Summary ILLINOIS STATE WATER SURVEY 2204 Griffith Dr. Champaign, IL 61820 wxobsrvr@sws.uiuc.edu Maria Peters, Weather Observer January: After a cold and snowy December,
Hurricanes. GEOG/ENST 2331 Lecture 18 Ahrens: Chapter 14. Figure to right Atlantic Hurricanes: 2017
 Hurricanes GEOG/ENST 2331 Lecture 18 Ahrens: Chapter 14 Figure to right Atlantic Hurricanes: 2017 Western Pacific Typhoons: 2017 Hurricanes Tropical cyclones Dynamics Formation Structure Movement Dissipation
UPDATE OF REGIONAL WEATHER AND SMOKE HAZE (December 2017)
") UPDATE OF REGIONAL WEATHER AND SMOKE HAZE (December 2017) 1. Review of Regional Weather Conditions for November 2017 1.1 In November 2017, Southeast Asia experienced inter-monsoon conditions in the first
UPDATE OF REGIONAL WEATHER AND SMOKE HAZE (December 2017) 1. Review of Regional Weather Conditions for November 2017 1.1 In November 2017, Southeast Asia experienced inter-monsoon conditions in the first
August Forecast Update for Atlantic Hurricane Activity in 2012
 August Forecast Update for Atlantic Hurricane Activity in 2012 Issued: 6 th August 2012 by Professor Mark Saunders and Dr Adam Lea Dept. of Space and Climate Physics, UCL (University College London), UK
Champaign-Urbana 1999 Annual Weather Summary
 Champaign-Urbana 1999 Annual Weather Summary ILLINOIS STATE WATER SURVEY 2204 Griffith Dr. Champaign, IL 61820 wxobsrvr@sws.uiuc.edu Maria Peters, Weather Observer A major snowstorm kicked off the new
Chapter 24. Tropical Cyclones. Tropical Cyclone Classification 4/19/17
 Chapter 24 Tropical Cyclones Tropical Cyclones Most destructive storms on the planet Originate over tropical waters, but their paths often take them over land and into midlatitudes Names Hurricane (Atlantic
Tropical Update. 5 AM EDT Wednesday, September 6, 2017 Hurricane Irma, Tropical Storm Jose, and Tropical Storm Katia
 Tropical Update 5 AM EDT Wednesday, September 6, 2017 Hurricane Irma, Tropical Storm Jose, and Tropical Storm Katia This update is intended for government and emergency response officials, and is provided
Government of Sultanate of Oman Public Authority of Civil Aviation Directorate General of Meteorology. National Report To
 Government of Sultanate of Oman Public Authority of Civil Aviation Directorate General of Meteorology National Report To Panel on Tropical Cyclones in the Bay of Bengal And Arabian Sea 43rd Session, India
Tropical Update. 5 AM EDT Thursday, September 7, 2017 Hurricane Irma, Hurricane Jose, and Hurricane Katia
 Tropical Update 5 AM EDT Thursday, September 7, 2017 Hurricane Irma, Hurricane Jose, and Hurricane Katia This update is intended for government and emergency response officials, and is provided for informational
Pre-Season Forecast for North Atlantic Hurricane Activity in 2018
 Pre-Season Forecast for North Atlantic Hurricane Activity in 2018 Issued: 30 th May 2018 by Professor Mark Saunders and Dr Adam Lea Dept. of Space and Climate Physics, UCL (University College London),
Marshall Alexander Forecaster Commonwealth of Dominica
 Marshall Alexander Forecaster Commonwealth of Dominica Dominica 2015 Impacts Tropical Storm Danny (August 24 th ) Tropical Storm Erika (August 27 th ) Tropical Storm Grace (Remnants) (September 10 th -11
(April 7, 2010, Wednesday) Tropical Storms & Hurricanes Part 2
 Tropical Storms & Hurricanes Part 2") Lecture #17 (April 7, 2010, Wednesday) Tropical Storms & Hurricanes Part 2 Hurricane Katrina August 2005 All tropical cyclone tracks (1945-2006). Hurricane Formation While moving westward, tropical disturbances
Lecture #17 (April 7, 2010, Wednesday) Tropical Storms & Hurricanes Part 2 Hurricane Katrina August 2005 All tropical cyclone tracks (1945-2006). Hurricane Formation While moving westward, tropical disturbances
Tropical Update. 5 PM EDT Thursday, September 7, 2017 Hurricane Irma, Hurricane Jose, and Hurricane Katia
 Tropical Update 5 PM EDT Thursday, September 7, 2017 Hurricane Irma, Hurricane Jose, and Hurricane Katia This update is intended for government and emergency response officials, and is provided for informational
August Forecast Update for Atlantic Hurricane Activity in 2016
 August Forecast Update for Atlantic Hurricane Activity in 2016 Issued: 5 th August 2016 by Professor Mark Saunders and Dr Adam Lea Dept. of Space and Climate Physics, UCL (University College London), UK
The Climate of Marshall County
 The Climate of Marshall County Marshall County is part of the Crosstimbers. This region is a transition region from the Central Great Plains to the more irregular terrain of southeastern Oklahoma. Average
Agricultural Outlook Forum Presented: February 17, 2006 THE SCIENCE BEHIND THE ATLANTIC HURRICANES AND SEASONAL PREDICTIONS
 Agricultural Outlook Forum Presented: February 17, 2006 THE SCIENCE BEHIND THE ATLANTIC HURRICANES AND SEASONAL PREDICTIONS Gerald Bell Meteorologist, National Centers for Environmental Prediction NOAA,
The Climate of Payne County
 The Climate of Payne County Payne County is part of the Central Great Plains in the west, encompassing some of the best agricultural land in Oklahoma. Payne County is also part of the Crosstimbers in the
Storm Summary for Hurricane Jose
 Storm Summary for Hurricane Jose Tuesday, September 19, 2017 at 11 AM EDT (Output from Hurrevac, based on National Hurricane Center Forecast Advisory #57) Jose is currently a Category 1 hurricane on the
The Climate of Murray County
 The Climate of Murray County Murray County is part of the Crosstimbers. This region is a transition between prairies and the mountains of southeastern Oklahoma. Average annual precipitation ranges from
Preface. Keithley Meade Director of Meteorology (Ag.) Antigua and Barbuda Meteorological Service
 Antigua and Barbuda Meteorological Service") Preface The countdown to Copenhagen is on. World leaders are scheduled to meet in Copenhagen, Denmark at the United Nations Climate Change Conference (COP15) to seal the deal on a comprehensive climate
Preface The countdown to Copenhagen is on. World leaders are scheduled to meet in Copenhagen, Denmark at the United Nations Climate Change Conference (COP15) to seal the deal on a comprehensive climate
MIAMI-SOUTH FLORIDA National Weather Service Forecast Office
 MIAMI-SOUTH FLORIDA National Weather Service Forecast Office http://www.weather.gov/miami June 2015 South Florida Weather Summary Dry East, Wet West...Drought Remains SE Florida July 3, 2015: Depending
WEEKLY WEATHER OUTLOOK BELIZE, CENTRAL AMERICA
 WEEKLY WEATHER OUTLOOK BELIZE, CENTRAL AMERICA PERIOD: Sunday, June 17 until Monday, June 25, 2012 DATE ISSUED: Sunday, June 17, 2012; 3:00 pm RFrutos EcoSolutions & Services SYNOPSIS: An upper level trough
The Climate of Texas County
 The Climate of Texas County Texas County is part of the Western High Plains in the north and west and the Southwestern Tablelands in the east. The Western High Plains are characterized by abundant cropland
What is happening to the Jamaican climate?
 What is happening to the Jamaican climate? Climate Change and Jamaica: Why worry? Climate Studies Group, Mona (CSGM) Department of Physics University of the West Indies, Mona Part 1 RAIN A FALL, BUT DUTTY
The Climate of Seminole County
 The Climate of Seminole County Seminole County is part of the Crosstimbers. This region is a transition region from the Central Great Plains to the more irregular terrain of southeastern Oklahoma. Average
Chapter 24 Tropical Cyclones
 Chapter 24 Tropical Cyclones Tropical Weather Systems Tropical disturbance a cluster of thunderstorms about 250 to 600 km in diameter, originating in the tropics or sub-tropics Tropical depression a cluster
The Climate of Pontotoc County
 The Climate of Pontotoc County Pontotoc County is part of the Crosstimbers. This region is a transition region from the Central Great Plains to the more irregular terrain of southeast Oklahoma. Average
The Climate of Bryan County
 The Climate of Bryan County Bryan County is part of the Crosstimbers throughout most of the county. The extreme eastern portions of Bryan County are part of the Cypress Swamp and Forest. Average annual
Tropical Update. 5 PM EDT Sunday, September 10, 2017 Hurricane Irma, Hurricane Jose, Tropical Wave (60%)
") Tropical Update 5 PM EDT Sunday, September 10, 2017 Hurricane Irma, Hurricane Jose, Tropical Wave (60%) This update is intended for government and emergency response officials, and is provided for informational
Tropical Update 5 PM EDT Sunday, September 10, 2017 Hurricane Irma, Hurricane Jose, Tropical Wave (60%) This update is intended for government and emergency response officials, and is provided for informational
Climate Outlook through 2100 South Florida Ecological Services Office Vero Beach, FL September 9, 2014
 Climate Outlook through 2100 South Florida Ecological Services Office Vero Beach, FL September 9, 2014 Short Term Drought Map: Short-term (
April Forecast Update for Atlantic Hurricane Activity in 2016
 April Forecast Update for Atlantic Hurricane Activity in 2016 Issued: 5 th April 2016 by Professor Mark Saunders and Dr Adam Lea Dept. of Space and Climate Physics, UCL (University College London), UK
Tropical Update. 5 AM EDT Tuesday, September 12, 2017 Post-Tropical Cyclone Irma, Hurricane Jose, & Tropical Wave (10%)
") Tropical Update 5 AM EDT Tuesday, September 12, 2017 Post-Tropical Cyclone Irma, Hurricane Jose, & Tropical Wave (10%) This update is intended for government and emergency response officials, and is provided
Tropical Update 5 AM EDT Tuesday, September 12, 2017 Post-Tropical Cyclone Irma, Hurricane Jose, & Tropical Wave (10%) This update is intended for government and emergency response officials, and is provided
July Forecast Update for Atlantic Hurricane Activity in 2016
 July Forecast Update for Atlantic Hurricane Activity in 2016 Issued: 5 th July 2016 by Professor Mark Saunders and Dr Adam Lea Dept. of Space and Climate Physics, UCL (University College London), UK Forecast
ESCI 241 Meteorology Lesson 19 Tropical Cyclones Dr. DeCaria
 ESCI 241 Meteorology Lesson 19 Tropical Cyclones Dr. DeCaria READING: Chapter 16 GENERAL A tropical cyclone is a large, low-pressure system that forms over the tropical oceans. Tropical cyclones are classified
Tropical Cyclones. Objectives
 Tropical Cyclones FIU Undergraduate Hurricane Internship Lecture 2 8/8/2012 Objectives From this lecture you should understand: Global tracks of TCs and the seasons when they are most common General circulation
Hurricanes and Tropical Weather Systems:
 Hurricanes and Tropical Weather Systems: An influence on weather in parts of the USA Meteorology 411 Iowa State University Week 2 Bill Gallus Classification/Terminology Tropical Disturbance enhanced convection
April Forecast Update for Atlantic Hurricane Activity in 2018
 April Forecast Update for Atlantic Hurricane Activity in 2018 Issued: 5 th April 2018 by Professor Mark Saunders and Dr Adam Lea Dept. of Space and Climate Physics, UCL (University College London), UK
8.1 Attachment 1: Ambient Weather Conditions at Jervoise Bay, Cockburn Sound
 8.1 Attachment 1: Ambient Weather Conditions at Jervoise Bay, Cockburn Sound Cockburn Sound is 20km south of the Perth-Fremantle area and has two features that are unique along Perth s metropolitan coast
Tropical Update. 5 PM EDT Sunday, October 7, 2018 Tropical Storm Michael, Tropical Storm Leslie, & Invest 92L (30%)
") Tropical Update 5 PM EDT Sunday, October 7, 2018 Tropical Storm Michael, Tropical Storm Leslie, & Invest 92L (30%) This update is intended for government and emergency response officials, and is provided
Tropical Update 5 PM EDT Sunday, October 7, 2018 Tropical Storm Michael, Tropical Storm Leslie, & Invest 92L (30%) This update is intended for government and emergency response officials, and is provided
Tropical Update 11 AM EDT Thursday, September 6, 2018 Tropical Depression Gordon, Hurricane Florence, Invest 92L (90%) & African Tropical Wave (50%)
 & African Tropical Wave (50%)") Tropical Update 11 AM EDT Thursday, September 6, 2018 Tropical Depression Gordon, Hurricane Florence, Invest 92L (90%) & African Tropical Wave (50%) This update is intended for government and emergency
Tropical Update 11 AM EDT Thursday, September 6, 2018 Tropical Depression Gordon, Hurricane Florence, Invest 92L (90%) & African Tropical Wave (50%) This update is intended for government and emergency
The Climate of Kiowa County
 The Climate of Kiowa County Kiowa County is part of the Central Great Plains, encompassing some of the best agricultural land in Oklahoma. Average annual precipitation ranges from about 24 inches in northwestern
Tropical Update. 11 AM EDT Tuesday, October 9, 2018 Hurricane Michael, Tropical Storm Leslie, Tropical Storm Nadine
 Tropical Update 11 AM EDT Tuesday, October 9, 2018 Hurricane Michael, Tropical Storm Leslie, Tropical Storm Nadine This update is intended for government and emergency response officials, and is provided
WEDNESDAY 30 TH AUGUST, :57 p.m. Tropical Storm Irma forms in the Atlantic. Don t let your guard down, always #Be Ready.
 Chapter 1 - The Set Up In the days leading up to Irma a series of composed and sobering text messages, presented in truncated form below, from Department of Disaster Management warned us of the pending
The Climate of Haskell County
 The Climate of Haskell County Haskell County is part of the Hardwood Forest. The Hardwood Forest is characterized by its irregular landscape and the largest lake in Oklahoma, Lake Eufaula. Average annual
Hurricane Irma Page 1 HURRTRAK RM/Pro 2017 Summary Report for Tampa, FL 09/09/ EDT, Adv. # 43
 Hurricane Irma Page 1 Description of impact to Tampa, FL, Tampa, FL, is expected to receive a major impact from Hurricane Irma. The forecast maximum wind for this location has decreased since the last
DEPARTMENT OF EARTH & CLIMATE SCIENCES Name SAN FRANCISCO STATE UNIVERSITY Nov 29, ERTH 360 Test #2 200 pts
 DEPARTMENT OF EARTH & CLIMATE SCIENCES Name SAN FRANCISCO STATE UNIVERSITY Nov 29, 2018 ERTH 360 Test #2 200 pts Each question is worth 4 points. Indicate your BEST CHOICE for each question on the Scantron
2013 ATLANTIC HURRICANE SEASON OUTLOOK. June RMS Cat Response
 2013 ATLANTIC HURRICANE SEASON OUTLOOK June 2013 - RMS Cat Response Season Outlook At the start of the 2013 Atlantic hurricane season, which officially runs from June 1 to November 30, seasonal forecasts
Monthly Long Range Weather Commentary Issued: NOVEMBER 16, 2015 Steven A. Root, CCM, Chief Analytics Officer, Sr. VP, sales
 Monthly Long Range Weather Commentary Issued: NOVEMBER 16, 2015 Steven A. Root, CCM, Chief Analytics Officer, Sr. VP, sales sroot@weatherbank.com OCTOBER 2015 Climate Highlights The Month in Review The
WEATHER SYSTEMS IMPACTING THE CAYMAN ISLANDS Prepared by the staff of the Cayman Islands National Weather Service
 WEATHER SYSTEMS IMPACTING THE CAYMAN ISLANDS 2008 Prepared by the staff of the Cayman Islands National Weather Service TROPICAL STORM DOLLY Formed 194 miles west of Grand Cayman July 19 th. The tropical
Tropical Update. 5 AM EDT Monday, October 8, 2018 Tropical Storm Michael, Tropical Storm Leslie, Invest 92L (10%) & African Tropical Wave (50%)
 & African Tropical Wave (50%)") Tropical Update 5 AM EDT Monday, October 8, 2018 Tropical Storm Michael, Tropical Storm Leslie, Invest 92L (10%) & African Tropical Wave (50%) This update is intended for government and emergency response
Tropical Update 5 AM EDT Monday, October 8, 2018 Tropical Storm Michael, Tropical Storm Leslie, Invest 92L (10%) & African Tropical Wave (50%) This update is intended for government and emergency response
National Hurricane Center Products. Jack Beven National Hurricane Center
 National Hurricane Center Products Jack Beven National Hurricane Center Florida Governor s Hurricane Conference 11 May 2014 NHC Tropical Cyclone Products NHC provides the big picture that complements and
At the Midpoint of the 2008
 At the Midpoint of the 2008 Atlantic Hurricane Season Editor s note: It has been an anxious couple of weeks for those with financial interests in either on- or offshore assets in the Gulf of Mexico and
Tropical Storms & Hurricanes Part 1. August 1992
 Lecture #16 (April 5, 2010, Monday) Tropical Storms & Hurricanes Part 1 August 1992 Tracks of rain accumulation & clouds from Hurricane Rita September 2005 Tropical Cyclones Around the Globe Why none here?
Hurricanes. April 14, 2009
 Tropical Weather & Hurricanes Chapter 15 April 14, 2009 Tropical meteorology Tropics characterized by seasonal wet and drier periods- wet when sun is nearly overhead at noon and inter-tropical convergence
The Climate of Grady County
 The Climate of Grady County Grady County is part of the Central Great Plains, encompassing some of the best agricultural land in Oklahoma. Average annual precipitation ranges from about 33 inches in northern
April Forecast Update for North Atlantic Hurricane Activity in 2019
 April Forecast Update for North Atlantic Hurricane Activity in 2019 Issued: 5 th April 2019 by Professor Mark Saunders and Dr Adam Lea Dept. of Space and Climate Physics, UCL (University College London),
photo courtesy of
 BRITISH VIRGIN ISLANDS REPORT TROPICAL STORM JEANNE photo courtesy of www.bviplatinum.com PREPARED BY THE DEPARTMENT OF DISASTER MANAGEMENT 1 EVENT 13 th -16 th September, 2004 TROPICAL STORM JEANNE Sequence
Three main areas of work:
 Task 2: Climate Information 1 Task 2: Climate Information Three main areas of work: Collect historical and projected weather and climate data Conduct storm surge and wave modeling, sea-level rise (SLR)
Understanding Hurricanes. Kieran Bhatia
 Understanding Hurricanes Kieran Bhatia Why do we care? What are they? When should we be ready? Why aren t forecasts perfect? If a hurricane makes landfall, what should we expect? Tropical cyclones have
NWS HURRICANES June 3, 2015
 NWS HURRICANES June 3, 2015 Hurricane Season June 1 November 30 2 What s the concern? All tropical systems passing within 125nm of central Maryland since 1950 Mid-Atlantic Hurricanes Greatest Risk: August
Hurricane Basics and Preparedness. Jim Weyman Director, Central Pacific Hurricane Center Phone Office:
 Hurricane Basics and Preparedness Jim Weyman Director, Central Pacific Hurricane Center Phone Office: 973-5270 james.weyman@noaa.gov United States Hurricane/Typhoon Centers National Hurricane Center, Miami
July Forecast Update for Atlantic Hurricane Activity in 2017
 July Forecast Update for Atlantic Hurricane Activity in 2017 Issued: 4 th July 2017 by Professor Mark Saunders and Dr Adam Lea Dept. of Space and Climate Physics, UCL (University College London), UK Forecast
WEEKEND WEATHER OUTLOOK BELIZE, CENTRAL AMERICA
 WEEKEND WEATHER OUTLOOK BELIZE, CENTRAL AMERICA PERIOD: Friday, July 13 until Monday, July 16, 2012 DATE ISSUED: Friday, June 13, 2012, 9:00 am RFrutos SYNOPSIS: A weak pressure gradient over the NW Caribbean
GC Briefing. Weather Sentinel Hurricane Florence. Status at 5 PM EDT (21 UTC) Today (NHC) Discussion. September 13, 2018
 Today (NHC) Discussion. September 13, 2018") GC Briefing September 13, 2018 Weather Sentinel Hurricane Florence Tropical storm conditions have been reported for areas of North Carolina and will continue to spread inland to the west and south. Hurricane
GC Briefing September 13, 2018 Weather Sentinel Hurricane Florence Tropical storm conditions have been reported for areas of North Carolina and will continue to spread inland to the west and south. Hurricane
Foundations of Earth Science, 6e Lutgens, Tarbuck, & Tasa
 Foundations of Earth Science, 6e Lutgens, Tarbuck, & Tasa Weather Patterns and Severe Weather Foundations, 6e - Chapter 14 Stan Hatfield Southwestern Illinois College Air masses Characteristics Large body
What s s New for 2009
 What s s New for 2009 Graphical Tropical Weather Outlook becomes operational Special Tropical Disturbance Statement replaced with Special Tropical Weather Outlook Tropical Cyclone Wind Field Graphic becomes
Hurricane Matthew Page 1 Location Forecast Analysis Summary Report - Advanced Wind Estimation On
 Page 1 Current NHC Forecast Predictions Maximum Sustained Winds / Storm Category: 138 MPH / Category 4 Forward motion: 9 mph towards the North Hurricane Force winds extend from the center: 46 miles Tropical
Champaign-Urbana 1998 Annual Weather Summary
 Champaign-Urbana 1998 Annual Weather Summary ILLINOIS STATE WATER SURVEY Audrey Bryan, Weather Observer 2204 Griffith Dr. Champaign, IL 61820 wxobsrvr@sparc.sws.uiuc.edu The development of the El Nìno
Daily Operations Briefing Wednesday, October 16, :30 a.m. EDT
 Daily Operations Briefing Wednesday, October 16, 2013 8:30 a.m. EDT 1 Significant Activity: Oct 15 16 Significant Events: None Tropical Activity: Atlantic Area 1 (10%) Eastern Pacific Tropical Depression
Hurricanes. Hurricanes are large, tropical storm systems that form and develop over the warm waters near the equator.
 Hurricanes Hurricanes are large, tropical storm systems that form and develop over the warm waters near the equator. They are responsible for weather that can devastate entire communities: Heavy rain --
GC Briefing. Weather Sentinel Tropical Storm Michael. Status at 8 AM EDT (12 UTC) Today (NHC) Discussion. October 11, 2018
 Today (NHC) Discussion. October 11, 2018") GC Briefing Weather Sentinel Tropical Storm Michael October 11, 2018 After making landfall as a high-end category-4 hurricane on the Florida Panhandle, Michael weakened to tropical storm status early this
GC Briefing Weather Sentinel Tropical Storm Michael October 11, 2018 After making landfall as a high-end category-4 hurricane on the Florida Panhandle, Michael weakened to tropical storm status early this
Hurricane Irma Page 1 HURRTRAK RM/Pro 2017 Summary Report for Tampa, FL 09/10/ EDT, Adv. # 46
 Hurricane Irma Page 1 Description of impact to Tampa, FL, Tampa, FL, is expected to receive a major impact from Hurricane Irma. The forecast maximum wind for this location has increased since the last
Tropical Update. 5 PM EDT Thursday, August 27, 2015 Tropical Storm Erika
 Tropical Update 5 PM EDT Thursday, August 27, 2015 Tropical Storm Erika This update is intended for government and emergency response officials, and is provided for informational and situational awareness
Hurricane Wilma Post Storm Data Acquisition Estimated Peak Wind Analysis and Storm Tide Data. December 27, 2005
 Hurricane Wilma Post Storm Data Acquisition Estimated Peak Wind Analysis and Storm Tide Data December 27, 2005 Hurricane Wilma was the sixth major hurricane of the record-breaking 2005 Atlantic hurricane
El Niño Update Impacts on Florida
 Current Issues in Emergency Management (CIEM) Sessions 1 &2 October 12 th and 26 th, 2006 Florida Division of Emergency Management Tallahassee, Florida El Niño Update Impacts on Florida Bart Hagemeyer
Homework 8: Hurricane Damage (adapted from Pipkin et al.)
") 1 Homework 8: Hurricane Damage (adapted from Pipkin et al.) Tropical cyclones have a significant impact on coastal areas of the world. In the Atlantic and Eastern Pacific Oceans they are called hurricanes
1 Homework 8: Hurricane Damage (adapted from Pipkin et al.) Tropical cyclones have a significant impact on coastal areas of the world. In the Atlantic and Eastern Pacific Oceans they are called hurricanes
Ocean in Motion 7: El Nino and Hurricanes!
 Ocean in Motion 7: El Nino and Hurricanes! A. Overview 1. Ocean in Motion -- El Nino and hurricanes We will look at the ocean-atmosphere interactions that cause El Nino and hurricanes. Using vocabulary
The Weather Wire. Contents: Summer 2018 Outlook. Summer 2018 Outlook Drought Monitor May Summary/Statistics June Preview Rainfall Totals
 The Weather Wire June 2018 Volume 25 Number 6 Contents: Summer 2018 Outlook Drought Monitor May Summary/Statistics June Preview Rainfall Totals Summer 2018 Outlook June 1 st marked the first day of meteorological
PRMS WHITE PAPER 2014 NORTH ATLANTIC HURRICANE SEASON OUTLOOK. June RMS Event Response
 PRMS WHITE PAPER 2014 NORTH ATLANTIC HURRICANE SEASON OUTLOOK June 2014 - RMS Event Response 2014 SEASON OUTLOOK The 2013 North Atlantic hurricane season saw the fewest hurricanes in the Atlantic Basin
Tropical Update. 1 PM EDT Monday, May 21, 2018 Caribbean Disturbance (20%)
") Tropical Update 1 PM EDT Monday, May 21, 2018 Caribbean Disturbance (20%) This update is intended for government and emergency response officials, and is provided for informational and situational awareness
Tropical Update 1 PM EDT Monday, May 21, 2018 Caribbean Disturbance (20%) This update is intended for government and emergency response officials, and is provided for informational and situational awareness
Fiji Islands Weather Summary December 2005 Rainfall Outlook till March 2006
 Volume 5: Issue: 12 Inside this issue: In Brief and Weather Patterns 1 Table in three Months Forecast Verification and Graphs (Nadi, Labasa and Suva) Other Climatic variables and New Records Table 4 2
Outlook 2008 Atlantic Hurricane Season. Kevin Lipton, Ingrid Amberger National Weather Service Albany, New York
 Outlook 2008 Atlantic Hurricane Season Kevin Lipton, Ingrid Amberger National Weather Service Albany, New York Summary 2007 Hurricane Season Two hurricanes made landfall in the Atlantic Basin at category-5
Tropical Update. 5 PM EDT Tuesday, September 5, 2017 Hurricane Irma, Tropical Storm Jose, and Tropical Depression Thirteen
 Tropical Update 5 PM EDT Tuesday, September 5, 2017 Hurricane Irma, Tropical Storm Jose, and Tropical Depression Thirteen This update is intended for government and emergency response officials, and is