A Case Study of the Persistence of Weather Forecast Model Errors
|
|
|
- Lorena Lindsey
- 6 years ago
- Views:
Transcription

1 A Case Study of the Persistence of Weather Forecast Model Errors by Barbara Sauter ARL-TR-3418 January 2005 Approved for public release; distribution is unlimited.
2 NOTICES Disclaimers The findings in this report are not to be construed as an official Department of the Army position unless so designated by other authorized documents. Citation of manufacturer s or trade names does not constitute an official endorsement or approval of the use thereof. Destroy this report when it is no longer needed. Do not return it to the originator.
3 Army Research Laboratory White Sands Missile Range, NM ARL-TR-3418 January 2005 A Case Study of the Persistence of Weather Forecast Model Errors Barbara Sauter Computational and Information Sciences Directorate Approved for public release; distribution is unlimited.
4 REPORT DOCUMENTATION PAGE Form Approved OMB No Public reporting burden for this collection of information is estimated to 1 hour per response, including the time for reviewing instructions, searching existing data sources, gathering and maintaining the data needed, and completing and reviewing the collection information. Send comments regarding this burden estimate or any other aspect of this collection of information, including suggestions for reducing the burden, to Department of Defense, Washington Headquarters Services, Directorate for Information Operations and Reports ( ), 1215 Jefferson Davis Highway, Suite 1204, Arlington, VA Respondents should be aware that notwithstanding any other provision of law, no person shall be subject to any penalty for failing to comply with a collection of information if it does not display a currently valid OMB control number. PLEASE DO NOT RETURN YOUR FORM TO THE ABOVE ADDRESS. 1. REPORT DATE (DD-MM-YYYY) January REPORT TYPE Final 4. TITLE AND SUBTITLE A Case Study of the Persistence of Weather Forecast Model Errors 3. DATES COVERED (From - To) 5a. CONTRACT NUMBER 5b. GRANT NUMBER 5c. PROGRAM ELEMENT NUMBER 6. AUTHOR(S) Barbara Sauter 5d. PROJECT NUMBER 5e. TASK NUMBER 5f. WORK UNIT NUMBER 7. PERFORMING ORGANIZATION NAME(S) AND ADDRESS(ES) U.S. Army Research Laboratory Computational and Information Sciences Directorate Battlefield Environment Division (ATTN: AMSRD-ARL-CI-EM) White Sands Missile Range, NM SPONSORING/MONITORING AGENCY NAME(S) AND ADDRESS(ES) U.S. Army Research Laboratory 2800 Powder Mill Road Adelphi, MD DISTRIBUTION/AVAILABILITY STATEMENT Approved for public release; distribution is unlimited. 8. PERFORMING ORGANIZATION REPORT NUMBER ARL-TR SPONSOR/MONITOR'S ACRONYM(S) ARL 11. SPONSOR/MONITOR'S REPORT NUMBER(S) ARL-TR SUPPLEMENTARY NOTES 14. ABSTRACT Decision makers could frequently benefit from information about the amount of uncertainty associated with a specific weather forecast. Automated numerical weather prediction models provide deterministic weather forecast values with no estimate of the likely error. This case study examines the day-to-day persistence of forecast errors of basic surface weather parameters for four sites in northern Utah. Although exceptionally low or high forecast errors on one day are more likely to be associated with a similar quality forecast the following day, the relationship is not considered strong enough to provide beneficial guidance to users without meteorological expertise. Days resulting in forecast errors showed no persistence in the quality of the subsequent day s forecast. More sophisticated methods are needed to generate and portray weather forecast uncertainty information. 15. SUBJECT TERMS Weather Forecast Uncertainty; Forecast Errors; Error Persistence; WRF; MM5; Utah MesoWest 16. SECURITY CLASSIFICATION OF: a. REPORT U b. ABSTRACT U c. THIS PAGE U 17. LIMITATION OF ABSTRACT SAR 18. NUMBER OF PAGES 19a. NAME OF RESPONSIBLE PERSON Barbara Sauter 48 19b. TELEPHONE NUMBER (Include area code) (505) Standard Form 298 (Rev. 8/98) Prescribed by ANSI Std. Z39.18 ii
5 Content List of Figures List of Tables iv vi Summary 1 1. Introduction 3 2. Methodology Forecast Model Runs Surface Validation Stations Results Case Study Considerations Background Information on Station Observed Weather and Forecast Errors Observed Weather Forecast Errors Forecast Error Persistence Detailed Error Persistence Case Study Results Summary Error Persistence Results by Station Summary Error Persistence Results by Weather Parameter Summary Error Persistence Results by Time of Day Summary Error Persistence Results by Season Summary Error Persistence Results by Model Conclusions Overall Case Study Results Recommendations...29 References 31 Appendix. Average Forecast Error Ranges 32 Acronyms 39 iii
6 Distribution List 40 List of Figures Figure 1. Surface station locations...5 Figure 2. Observed temperatures most frequently occurred within the ranges shown for each station and time. Summer months depicted by a red line, winter months by a blue line...7 Figure 3. Observed dew-point temperatures most frequently occurred within the ranges shown for each station and time. Summer months depicted by a red line, winter months by a blue line...7 Figure 4. WRF dew-point temperature forecasts compared to the observations at 2 a.m. for the summer months at station DVE Figure 5. Mean temperature errors at DVE for summer nighttime forecasts. Data markers are coded in green (), yellow (), or red ()...11 Figure 6. Mean wind speed errors at DVE for summer daytime forecasts. Data markers are coded in green (), yellow (), or red ()...13 Figure 7. The number of days with the dew-point temperature forecast error category of (green bars), (yellow bars), and (red bars), given the previous oneday forecast error category on the left and the previous two-day forecast error category on the right, for PRP at 2 p.m. in the summer Figure 8. The daily dew-point temperature forecast error amounts for PRP at 2 p.m. in the summer...16 Figure 9. The daily temperature forecast error amounts at SNZ at 2 a.m. in the summer...18 Figure 10. The number of days with the dew-point temperature forecast error category of (green bars), (yellow bars), and (red bars), given the previous oneday forecast error category on the left and the previous two-day forecast error category on the right, for WBB at 2 a.m. in the summer...20 Figure 11. The daily dew-point temperature forecast error amounts for WBB at 2 a.m. in the summer...20 Figure 12. WRF wind speed forecasts compared to the observations at 2 a.m. for the summer months at WBB...21 Figure 13. Daily temperature forecast error categories for the daytime winter forecasts for WBB. The marker labels indicate the forecast day in order from 1 through 60, equating to the forecast period of January 1 through February 29, iv
7 Figure 14. Each chart shows the combined results for all forecasts for stations (a) DVE, (b) PRP, (c) SNZ, and (d) WBB. The y-axis indicates the percentage of subsequent days with the forecast error category of (green bars), (yellow bars), and (red bars), given the previous day s forecast error category, which is listed on the horizontal labels for the x-axis on the left half of each chart. The right half of each chart provides the same information, except the x-axis groupings are based on having two previous days in the same error category Figure 15. Each chart shows the combined results for all forecasts for weather parameters (a) temperature, (b) dew-point temperature, (c) wind speed, and (d) wind direction. See figure 14 caption for chart details Figure 16. Each chart shows the combined results for (a) the nighttime forecasts and (b) the daytime forecasts. See figure 14 caption for chart details Figure 17. Each chart shows all the forecast results for (a) the summer forecasts and (b) the winter forecasts. See figure 14 caption for chart details...27 Figure 18. Each chart shows the all the forecast results for (a) the WRF and (b) the MM5. See figure 14 caption for chart details Figure A-1. The range of absolute temperature errors used for the error category is shown by the line for (a) MM5 summer forecasts, (b) WRF summer forecasts, (c) MM5 winter forecasts, and (d) WRF winter forecasts. One-third of the forecasts in each category had errors greater than the highest value and one-third had errors less than the lowest value depicted by the line. The asterisk associated with each line is the absolute error for the given station and time Figure A-2. The range of absolute dew-point temperature errors used for the error category is shown by the line for (a) MM5 summer forecasts, (b) WRF summer forecasts, (c) MM5 winter forecasts, and (d) WRF winter forecasts. One-third of the forecasts in each category had errors greater than the highest value and one-third had errors less than the lowest value depicted by the line. The asterisk associated with each line is the absolute error for the given station and time...35 Figure A-3. The range of absolute wind speed errors used for the error category is shown by the line for (a) MM5 summer forecasts, (b) WRF summer forecasts, (c) MM5 winter forecasts, and (d) WRF winter forecasts. One-third of the forecasts in each category had errors greater than the highest value and one-third had errors less than the lowest value depicted by the line. The asterisk associated with each line is the absolute error for the given station and time Figure A-4. The range of absolute wind direction errors used for the error category is shown by the line for (a) MM5 summer forecasts, (b) WRF summer forecasts, (c) MM5 winter forecasts, and (d) WRF winter forecasts. One-third of the forecasts in each category had errors greater than the highest value and one-third had errors less than the lowest value depicted by the line. The asterisk associated with each line is the absolute error for the given station and time v
8 List of Tables Table 1. Surface station information...4 Table 2. Average differences between WRF forecast and observed values. Observed wind data at SNZ is considered unreliable....8 Table 3. Percent of forecasts in each error category 24 hours later, given the previous day s error category...28 Table 4. Percent of forecasts in each error category on the third day, given a consistent error category over the previous two days...29 vi
9 Summary Military and civilian activities affected by the weather require decision makers to rely on uncertain weather forecasts. Specific information on the amount of uncertainty associated with a forecast has historically been non-existent, or based on a human expert indicating a level of confidence. Organizations and individuals involved in producing or using weather forecasts are becoming more aware of the value of including information about the amount of uncertainty associated with a forecast. At the same time, information processes are becoming more automated, relying less on human expertise. Various organizations are investigating methods to automatically calculate and portray weather forecast uncertainty. One proposed method was to provide a stoplight chart indicating whether the validated model forecast, from either 24 or 48 hours earlier, had produced errors that were either than, the same as, or than the error for the particular model being used. Specifically, for each numerical weather prediction model available, the error produced by that model over some historical period would be known. If the forecast validated the previous day produced a significantly lower than error for a particular model, the Web link to that model output would be preceded by a green circle; whereas, if a model generated a typical error on the previous day relative to its own historical performance it would be preceded by a yellow circle, or if it produced a higher than error it would be preceded by a red circle. Two color-coded circles would be presented if the previous two days results were considered. This case study looks at model forecast errors on consecutive days to determine how useful it might be for a user to be given a,, or marker based on the previous day s forecast. This case study is based on forecast errors for both the Pennsylvania State University/NCAR Mesoscale Model Version 5 (MM5) and the Weather Research and Forecasting (WRF) model for four specific sites in the vicinity of Salt Lake City, Utah. Ranges of forecast error values were defined as,, or for single parameter forecasts at the same location, time of day, season, and model. The divisions between the error categories were based on the thresholds that would produce an equal number of forecasts in each category. The summer months included 54 days and the winter months included 57 days, resulting in approximately forecasts in each error category for each permutation of 4 stations, 4 weather parameters, 2 times of day, 2 seasons, and 2 forecast models. A day-by-day analysis shows how frequently the error category persisted for consecutive days. The report provides many details of these analyses. Forecasts that were or than the range were more likely to be associated with forecasts in the same category the following day. These persistent and error categories generally occurred on 40-50% of the following days, with about 25% of the following days falling in the opposite error 1
10 category. The days with forecast errors were equally likely to be followed by any of the three forecast error categories. The original suggestion that precipitated this effort is not being pursued. The results seen in this study provide further justification that a simple stoplight marker based on a previous day s forecast error is not sufficient to allow weather forecast users to incorporate an appropriate level of uncertainty information into their decisions involving probability, risk, and benefits. 2
11 1. Introduction Weather forecasters regularly use the term persistence to indicate non-changing weather from one day to the next. Experienced forecasters will also recall specific instances when a forecast model performed poorly, and suspect poor performance from that model when similar conditions occur. This case study examines the likelihood of a poor model forecast to persist from one day to the next, without consideration of the weather pattern influencing the area. In a previous study, two mesoscale forecast models were run over northern Utah (1). These models were the Pennsylvania State University/National Center for Atmospheric Research (NCAR) Mesoscale Model Version 5 (MM5) and the first version of the Weather Research and Forecasting (WRF) model, under development by NCAR, the National Oceanic and Atmospheric Administration, and several universities (2, 3). The results of those hourly model forecasts compared to surface observations at sites showed some very large errors. In order to examine the model performance in more detail, and to investigate any patterns in the quality of the forecasts, this case study focuses on four of the surface stations at one time during the night and one time during the day. Although the goal of this study emphasizes the relative performance of the individual model at a specific site over a limited timeframe, many general error statistics are included. These individual error amounts do not accurately reflect the models capabilities to the degree indicated by the values given, since the surface sensors used for validation do not meet standard height or calibration requirements. The Utah MesoWest Cooperative provides error flags for questionable observations, but these flags were not available for this study (4). Only rudimentary errorchecking was performed on the observations to ensure they were within possible limits. 2. Methodology 2.1 Forecast Model Runs Both the MM5 and WRF models were initialized with Global Forecast System (GFS) model output data (5). The MM5 was run with a coarse domain and two nests on an Army High Performance Computing Resource Center s Cray computer, while the non-nested version of the WRF was run on a U.S. Army Research Laboratory Major Shared Resource Center IBM system (6, 7). The model forecast data used for comparison with surface observations was based on 5-km grid spacing for both models. Model runs were initialized at 1800 Greenwich Mean Time (GMT) for 28 days in July 2003, 26 days in August 2003, 28 days in January 2004, and 29 days in February The initial 6 hours were used for spin-up purposes, so that the WRF validation times of 0900 and 2100 GMT used in this study would be considered a 9- and 21-hour 3
12 forecast. These times were 2 a.m. and 2 p.m. Mountain Standard Time (MST). Through an inconsistency in the handling of the WRF and MM5 validation files for this case study, the times available for the MM5 analysis were one hour later each day, valid at 3 a.m. and 3 p.m. MST. The forecast model parameters of temperature and dew-point temperature at 2 m and u- and v-wind components at 10 m were horizontally interpolated to the surface station locations. Wind speed and direction values have been calculated from the wind components and are used in the discussion of the results. 2.2 Surface Validation Stations As mentioned in the introduction, this case study leverages an existing dataset. Four meteorological stations were selected for closer scrutiny based on their dew-point temperature errors for a single day, reflecting a wide range of forecast error amounts: Promontory Point, UT (PRP): much than DV-Burns, UT (DVE): than WBB/U Utah, UT (WBB): than Bountiful/F G House, UT (SNZ): much than That criterion is not consistent for all the days used in this study, but the four stations previously selected were kept for this analysis. Site information for these stations is listed in table 1. PRP is situated on a hill on a peninsula extending into the Great Salt Lake, while DVE is in the Wasatch Mountains. WBB and SNZ are in urban areas, with WBB on the roof of a University of Utah building in Salt Lake City and SNZ on a 3-m tower in the backyard of a house in the vicinity of Bountiful, Utah. All four stations are part of the SNOWNET mesonet. Table 1. Surface station information. ID Name Latitude ( N) Longitude ( W) Elevation (ft) PRP Promontory Point DVE DV - Burns WBB WBB/U Utah SNZ Bountiful/F G House Figure 1 shows the location of the four stations on a map of the Great Salt Lake/Wasatch Front areas, highlighting the complex terrain of northern Utah. 4


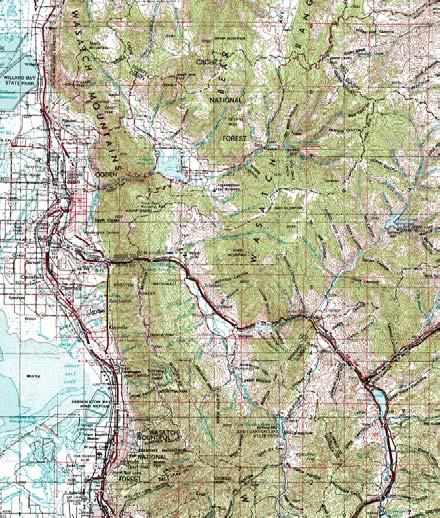
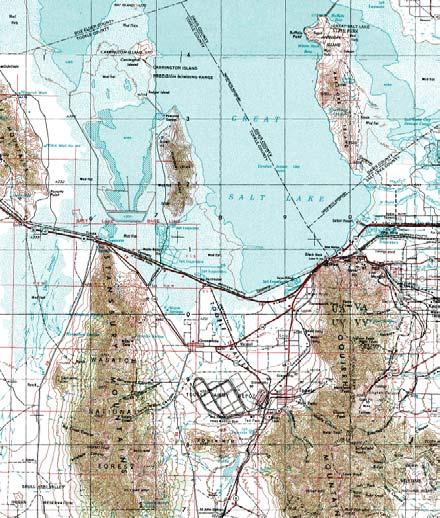
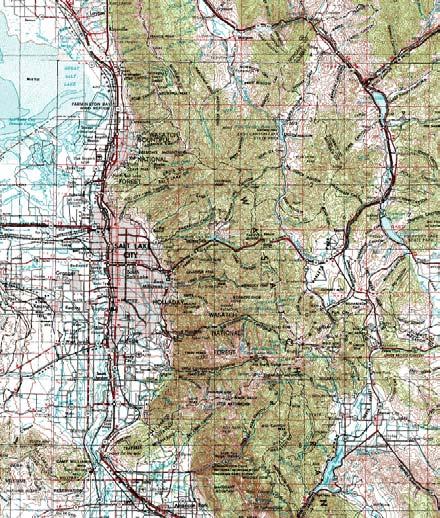
13 PRP SNZ WBB DVE Figure 1. Surface station locations. 5
14 3. Results 3.1 Case Study Considerations Although an attempt was made to narrow the scope of the thousands of results from the previous model output study, the resulting subset of data from two models, four stations, two times per day for two seasons still poses difficulties in analyzing and describing meaningful results. The primary goal of the analysis is to determine how often the quality level of a numerical model forecast persisted from one forecast to the following day s forecast. Some definition of a persistent error must be used. In order to accomplish this, the forecasts are classified as (the third of the forecasts with the lowest errors), (the third in the middle), or (the third with the highest errors). This grouping results in approximately equal numbers of forecasts in each classification. If no correlation exists between the quality of a forecast on a preceding day and the quality of the forecast on the subsequent day, each preceding day classification category would result in approximately 33% of each classification on the next day. The sample size may be too small to obtain statistically significant results, and the classification groupings occasionally place forecasts with very small error differences in adjacent groups. With these limitations in mind, the following sections describe some of the results seen relating to the persistence of forecast errors from one forecast to the forecast 24 hours later. 3.2 Background Information on Station Observed Weather and Forecast Errors Observed Weather Within each season, the individual stations temperatures most frequently fell within a C range over the two-month period, with occasional observations above or below that range. Figure 2 highlights these prevailing ranges, providing the summer temperatures with a red line and winter temperatures with a blue line. SNZ showed the highest daytime temperatures, but was cooler than the other urban station, WBB, at night during the summer. The most frequently observed dew-point temperatures were typically within a C range. As expected, the dew-point temperatures were significantly lower than the temperatures in the summer months, but were usually quite close to the temperatures in the winter months. 6
15 Prevailing Temperatures ( C) DVE PRP SNZ WBB DVE PRP SNZ WBB 2:00 a.m. 2:00 p.m. Figure 2. Observed temperatures most frequently occurred within the ranges shown for each station and time. Summer months are depicted by a red line, winter months by a blue line Prevailing Dew-Points ( C) DVE PRP SNZ WBB DVE PRP SNZ WBB 2:00 a.m. 2:00 p.m. Figure 3. Observed dew-point temperatures most frequently occurred within the ranges shown for each station and time. Summer months are depicted by a red line, winter months by a blue line. 7
16 Wind speeds were predominantly light. Wind direction was only analyzed for this study for observations with corresponding wind speeds greater than 1 m/s. The nighttime winds at DVE were usually below 2 m/s, with primarily southerly winds in the summer and no determinant direction in the winter. DVE s daytime wind reports were slightly stronger, concentrated between 0 and 4 m/s, and most frequently occurred from either a northerly or south to southwesterly direction. The other high elevation station, PRP, reported somewhat higher wind speeds, generally between 1 and 7 m/s. The summertime wind came from all directions during the night, while winds with a westerly component were most frequent during the day. Southerly winds were most common at PRP during the winter; however, all wind directions occurred a significant portion of the time. SNZ almost always reported wind speeds below 1 m/s. In addition to suspecting the observations were not reliable, SNZ did not report for ten days in mid-august. No analyses of the SNZ wind data will be provided. WBB showed both diurnal and seasonal variations in observed winds. During the summer months, wind speeds were generally between 1 and 6 m/s, but the direction varied from predominantly north to east at night and south to northwest during the day. The winter reports reflected wind speeds below 2.5 m/s from all directions during the night, with somewhat stronger winds, up to 5 m/s, from southwest to northwest during the day Forecast Errors A summary of the WRF model forecast errors is provided in table 2. Table 2. Average differences between WRF forecast and observed values. Observed wind data at SNZ is considered unreliable. WBB SNZ PRP DVE Summer Winter 2 a.m. 2 p.m. 2 a.m. 2 p.m. Mean Error Absolute Error Mean Error Absolute Error Mean Error Absolute Error Mean Error Absolute Error T ( C) DP ( C) WS (m/s) WD ( ) T ( C) DP ( C) WS (m/s) WD ( ) T ( C) DP ( C) WS (m/s) WD ( ) T ( C) DP ( C) WS (m/s) WD ( ) NOTE: Shading indicates unreliable data. 8
17 Positive values for temperature, dew-point temperature, and wind speed mean errors indicate the forecasts were higher than the observations. When the mean error listed for wind direction is positive, the forecast wind was from a direction clockwise from the observed direction. The WRF exhibited a warm bias for all four stations during the winter, which was most pronounced at PRP, which is situated on a peninsula extending into the Great Salt Lake. The WRF forecasts for summertime temperatures were often too low, while the dew-point temperature forecasts at the same place and time were much too high, resulting in extremely overestimated relative humidity. Average wind speed forecasts typically reflected a bias 2-3 m/s too high at DVE, with smaller (or even low) biases at the other stations, excluding SNZ. Average wind direction absolute errors consistently ranged between 40º and 70º. The MM5 forecasts were valid one hour after the WRF forecasts. Most of these forecasts revealed error trends similar to those seen in the WRF forecasts. The appendix provides the mean absolute errors for both the MM5 and WRF forecasts by season, station, and time of day. These charts in the appendix also highlight the range of errors categorized as in the forecast error persistence analysis. The purpose of this study is not to evaluate the forecast model performance in detail; however, the simple face validations of plots of forecast and observed data points, as shown in figure 4, strongly suggest the model forecasts contain some skill, even when the bias error is significant. The Pearson correlation coefficient for these summer dew-point temperature forecasts and observations is
18 Dew-Point ( C) forecast observed 7/3 7/10 7/17 7/24 7/31 8/7 8/14 8/21 8/28 Summer Dates 2 a.m. Figure 4. WRF dew-point temperature forecasts compared to the observations at 2 a.m. for the summer months at station DVE. 3.3 Forecast Error Persistence The following sections provide the results of this case study on the day-to-day persistence of model forecast errors. Initial discussions provide some of the details seen at each of the four stations. Following those discussions, the findings are summarized by station, weather parameter, time, season, and forecast model. Whenever the forecast model is not explicitly named, the information is based on the WRF outcomes Detailed Error Persistence Case Study Results DV-Burns (DVE) DVE is situated several miles southeast of Park City, Utah. Although, at over 7000-ft elevation, it is the highest station used in this case study, higher mountain peaks are found both to the west and east of the site. For the summer temperature forecasts valid at 2 a.m., a result was only slightly more likely to be followed by a result 24 hours later, as opposed to either an or result. While more frequent than either of the other categories alone, the probability of the forecast error category repeating was still less than 50%, which was almost always the case. An forecast day was also only slightly more likely to be associated with an forecast the subsequent day, rather than a forecast, but was unlikely to be followed by a forecast. On the other hand, days when the 2 a.m. temperature forecast proved to be than usual were significantly followed by another temperature forecast the next day. 10
19 The categories of,, and are based strictly on absolute error amounts. Figure 5 highlights the mean temperature errors, with the absolute error category for each day displayed by a green, yellow, or red data marker. Wide day-to-day variations exist, but noticeable trends appear, including a majority of forecasts during the first half of July and primarily forecasts during the second half of July. More variations are seen in the August results. The summer nighttime temperature forecast biases were predominantly too cold. The 2 p.m. summer temperature forecasts were significantly more likely to be in the same or adjacent category than in the opposite category from the previous day. Out of the 14 days with afternoon temperature forecasts, the following afternoon included a forecast on 7 days, an forecast on 5 days, and a forecast on 2 days. The days after an afternoon temperature forecast were pretty evenly divided between,, and forecasts. The typical July temperature warm bias of about 2 C in the afternoon was often found in the opposite direction as the nighttime bias, but was not as large. This study does not investigate correlations between the nighttime and daytime errors on the same date, but a cursory inspection of the DVE temperature forecasts seems to show little correlation between these errors. 4.0 Temperature Errors ( C) /3 7/10 7/17 7/24 7/31 8/7 8/14 8/21 8/28 Summer Dates 2:00 a.m. Figure 5. Mean temperature errors at DVE for summer nighttime forecasts. Data markers are coded in green (), yellow (), or red (). The summer dew-point temperature forecasts for DVE included a very large warm bias, with mean errors of 8.6 C for the 2 a.m. forecasts and 7.1 C for the 2 p.m. forecasts. Every nighttime forecast was too high, and all but one daytime forecast was too high. The actual amount of the forecast error frequently changed from one day to the next in the nighttime 11
20 forecasts, but forecasts were much more likely to be followed by forecasts again the following day. Of the 18 days in the category, 13 of the subsequent days also displayed forecast errors. This is one of the highest percentages of error persistence, and is due to dew-point temperature forecast errors greater than 10 C on all but one day during the first two weeks in July. A single 3-day period from July 4-6 showed errors close to 15 C each day, while a 4-day period from July contained daily errors of approximately 2 C each day. Otherwise, the errors differed by over 2 C almost every day. Significant changes, by 5 C or greater from one day to the next, occurred for 11 out of the 47 days with data available for consecutive days. The dew-point temperature forecasts valid at 2 p.m. were somewhat concentrated in the first half of July, like the 2 a.m. forecasts, but were more spread out over the rest of July and August with a weaker pattern of persistent errors. Wind speed observations were frequently missing for station DVE at the 2 a.m. validation time. Almost all of the existing validations showed wind speed forecasts to be too high, with an mean error of 2.6 m/s. It s also possible that the consistently very low wind speed observations at these times were not accurate, but other DVE reports from the same general timeframe do include higher wind speeds so the sensor was not stuck at low readings. Although few consecutive days are available, the nighttime wind speed error amounts seem to jump around fairly randomly. Most of the daytime reports for these summer dates were available including wind observations. The mean error at 2 p.m. was 1.2 m/s with an absolute error of 1.7 m/s. As shown in figure 6, no strong pattern exists in the persistence of absolute error category from one day to the next. The wind speed forecasts exhibit a consistent bias of too high in July, continuing but becoming less dominant in August. 12
21 6.0 Wind Speed Errors (m/s) /3 7/10 7/17 7/24 7/31 8/7 8/14 8/21 8/28 Summer Dates 2 p.m. Figure 6. Mean wind speed errors at DVE for summer daytime forecasts. Data markers are coded in green (), yellow (), or red (). Wind direction evaluations are only considered for observations with wind speed greater than 1 m/s, in order to lessen the impact of variable wind cases. Therefore, the summer dates at 2 a.m. provided too few wind direction observations to analyze. The 2 p.m. observations reflected no pattern in the amount of wind direction forecast errors for or forecast days, though the forecast days appeared less likely to be followed by a forecast day. The winter months included an even smaller error persistence relationship for nighttime temperature forecasts, which had only been evident in the category for the summer months. The persistence of the temperature forecast error category was stronger in the daytime for the summer months, and that pattern was repeated to the same or to a slightly greater degree in the winter months. The dew-point temperature forecast error s were much smaller in the winter than in the summer months. The winter mean and absolute errors were approximately 3 C for both the 2 a.m. and 2 p.m. forecasts. The nighttime dew-point temperature forecasts in the and categories were no more likely to be followed by the same category the following day than a different category. Those forecasts falling in the category were slightly more likely to be again the next day. The daytime forecasts repeated the same category for the and forecasts 7 out of 18 days, while the forecasts preceded another forecast 8 out of 17 days. The summer occurrence of many missing 2 a.m. wind observations was repeated in the winter. The 2 p.m. wind observations displayed a noticeable tendency for forecasts to be followed by forecasts, and for forecasts to be followed by forecasts. This trend seems primarily due to the 13
22 changing pattern in wind speed forecast bias amounts, which are low or near zero in mid-january and late February. The remainder of the winter days reflected wind speed forecasts that were too high, but by varying amounts. Light winds or missing observations for the 2 p.m. forecasts provided very few consecutive days for wind direction in January. A pattern evidenced over several consecutive days in early February showed northerly observed winds associated with northwesterly forecast winds. Otherwise, the wind direction errors varied considerably from one day to the next in February. The MM5 error patterns are discussed relative to the WRF results described above for DVE: The summer MM5 temperature forecast errors seemed to be slightly less persistent for the nighttime forecasts, and about the same for the daytime forecasts. The summer MM5 dew-point temperature errors for both the 3 a.m. and 3 p.m. valid times showed a greater relationship between a forecast one day being followed by a forecast the next day than was seen in the WRF results. On the other hand, the persistency of the forecasts was evident but not to the degree found in the WRF results. Specifically, the MM5 results showed 9 out of 18 forecasts followed by another forecast, when the WRF results were 13 out of 18. The winter MM5 temperature forecast errors didn t exhibit strong persistence, but did show a slightly higher incidence of forecasts after a previous forecast at nighttime than seen in the winter WRF forecasts. The opposite occurred in the daytime forecasts, where the WRF error persistence was stronger, while the MM5 showed no relationship. As was the case for WRF, the winter MM5 dew-point temperature forecast errors were not particularly persistent, with the strongest but still small relationship found in the category in the afternoon forecasts. The summer and winter MM5 wind speed and wind direction results were similar to the WRF results Promontory Point (PRP) PRP is the second highest station in this case study, at approximately a 6900-ft elevation. The site is complex not solely because of the hilly terrain, but also because of its location on a peninsula extending into the Great Salt Lake. The summer 2 a.m. WRF temperature forecasts included a negative bias of 1.4 C that was strongest in July. The same forecast error category as the day before did not repeat most frequently, except for the category, which resulted in another category only one day more than an result. Having an opposite category occur was infrequent, however. For 16 nighttime temperature forecasts qualifying as a result, only 3 of the following days were a result. Out of the 15 results, only 2 of the following days were a result. The 2 p.m. temperature forecast errors were much larger than the nighttime errors, and 14
23 showed a stronger persistence from one day to the next. The mode for the second day was always the same category. In each category, about half of the subsequent days fell in the same category as the previous day. The two days with extremely high errors were each followed by days with smaller errors but still much higher than. The summer dew-point temperature forecasts included extremely large biases of 11 C at 2 a.m. and over 8 C at 2 p.m. The individual categories encompassed large error ranges, and the forecast error value generally changed by several degrees on adjacent days. The largest errors in the nighttime forecasts were always followed by another larger than error. The daytime forecasts showed a strong modal response of the second day falling in the same category as the preceding day. Figure 7 depicts this on the left side of the chart labeled Previous Day. For each daily forecast in the category of,, and, the bars show how many subsequent days fell in each of those categories. The right side of the chart shows the same information, except that the x-axis categories of,, and consist of cases where the two previous days were in the same category rather than just one previous day. This setup seems to display a considerable amount of persistence in the quality of the forecast. As seen in figure 8, however, there are still frequently very large variations in the dew-point temperature forecast error from one day to the next. Number of Subsequent Days with Forecast (green), (yellow), or (red) Better Average Worse Better Average Worse Previous Day Previous 2 Days Figure 7. The number of days with the dew-point temperature forecast error category of (green bars), (yellow bars), and (red bars), given the previous one-day forecast error category on the left and the previous two-day forecast error category on the right, for PRP at 2 p.m. in the summer. 15
24 Dew-Point Errors ( C) /3 7/10 7/17 7/24 7/31 8/7 8/14 8/21 8/28 Summer Dates 2 p.m. Figure 8. The daily dew-point temperature forecast error amounts for PRP at 2 p.m. in the summer. The summer wind speed forecasts produced similar mean bias amounts of -1.1 m/s at 2 a.m. and -1.3 m/s at 2 p.m. However, the nighttime forecasts resulted in much more variation, including more frequent high errors in early July and late August and too low forecasts most of the rest of the time. The daytime wind speed forecasts had lower overall error amounts, with forecasts that were consistently too low. Neither the nighttime or daytime forecasts showed any persistence in the amount of absolute error from one day to the next. In fact, for the days with or forecast results, the next day s forecast was more likely to be the opposite category than the same category. The wind direction at PRP during the summer at 2 a.m. was predominantly out of the north. The WRF wind direction forecasts at these times did not show any bias and were often very accurate, with the wind direction forecasts categorized as when the error was between 15 and 45º. Unlike the wind speed results, the nighttime wind direction errors reflected the common pattern of infrequent occurrence of the opposite category on days following a or forecast. The observed wind directions were more variable at 2 p.m. The forecast error category encompassed higher errors, ranging from 45º to 85º. As with the wind speeds, the daytime wind directions in the second day category were as likely or more likely to be the opposite than to be the same as the day before. The winter temperature forecast errors for PRP were higher than the summer errors for both validation times. The nighttime forecasts exhibited a higher persistence in error category than was seen in the summer months, while the daytime forecasts showed less persistence than in the summer. On the other hand, the dew-point temperature forecast errors were only about half as 16
25 large in the winter, when compared to the 11 C nighttime error and 8 C daytime error experienced in the summer. The dew-point temperature errors showed some persistence from one day to the next. The nighttime pattern was similar to the summer results, but the daytime persistence was not as strong as seen in the summer. The wind speed errors were slightly more likely to show persistence between consecutive days in the winter than in the summer. The winter wind direction nighttime forecasts repeated the same category more frequently than either of the other categories the following day when the previous day fell in the category, but not when the previous day s forecast fell in the or categories. As seen in the summer forecasts, the daytime wind direction forecasts were more frequently in the opposite category than in the same category. The MM5 error patterns are discussed relative to the WRF results described above for PRP: Any persistence in the summer MM5 temperature nighttime forecast errors was weak, with the opposite category occurring more frequently than seen in the WRF results. The pattern of persistence was stronger in the daytime forecast, and is similar to the WRF pattern. The summer MM5 dew-point temperature mean and absolute errors for both the 3 a.m. and 3 p.m. valid times were approximately 8 C. Both times reflected patterns showing persistence of error amounts from one day to the next, as seen in the WRF results. The summer MM5 wind speed error categories mirrored the WRF findings of opposite category errors occurring more frequently than same category errors on subsequent days. The MM5 wind direction nighttime errors were slightly higher than the WRF errors in the summer months. The persistence of the error category was also somewhat less, with only the category forecast days most likely to be followed by a forecast in the same category. The MM5 wind direction forecasts shared similar daytime error amounts as well as the lack of persistence produced by WRF. The bias in the winter MM5 temperature forecasts was generally in the same direction as the WRF forecasts, with similar or somewhat smaller absolute errors for the MM5. Both the MM5 and WRF nighttime results showed the repeat of and forecasts to be more frequent than a different category, but this persistence still occurred in less than 50% of the cases. Better nighttime MM5 forecasts were followed by another forecast in 7 out of 16 days, compared to 12 out of 17 for the WRF forecasts. The MM5 daytime temperature forecasts were even more likely to repeat an or forecast; however, the forecast days were followed by an equal distribution of each of the three categories. The winter MM5 dew-point temperature errors exhibited no particular persistence pattern compared to a small persistence in the larger WRF forecast errors. 17
26 The winter MM5 wind speed and wind direction forecasts also showed no persistence in the forecast error from one day to the next Bountiful/F G House (SNZ) SNZ is the lowest station used in this case study, at a 4760-ft elevation. It is located in the backyard of a house in Bountiful, which is a city of about 40,000 just north of Salt Lake City. As mentioned previously, no analyses of the wind forecast data is included for SNZ. The summer temperature forecasts at SNZ at 2 a.m. encompassed a wide range of errors, as shown in figure 9. Several instances occurred with two or more consecutive days containing similar errors; however, there were just as many instances where the model produced wildly divergent errors on consecutive days. The temperature forecast bias was more consistently too low for the daytime forecasts, but no significant pattern appeared in the amount of the error from one day to the next Temperature Errors ( C) /3 7/10 7/17 7/24 7/31 8/7 8/14 8/21 8/28 Summer Dates 2 a.m. Figure 9. The daily temperature forecast error amounts at SNZ at 2 a.m. in the summer. The summer dew-point temperature forecasts for SNZ also contained large errors, and frequent sizeable day-to-day changes. However, both the nighttime and daytime dew-point temperature error categories were more likely to repeat the following day than the temperature error categories. The temperature and dew-point temperature forecasts for SNZ were much more accurate during the winter months. The only category exhibiting a significant persistence trend for temperature 18
27 forecasts was the forecasts. Each category was slightly more likely to be followed by the same category for the dew-point temperatures. The MM5 error patterns are discussed relative to the WRF results described above for SNZ: The summer MM5 temperature mean errors were similar to those seen in the WRF. The daytime forecasts displayed strong persistence in the error amounts for one five-day period and another four-day period. The summer MM5 nighttime dew-point temperature errors were smaller than the equivalent WRF errors, and showed no day-to-day pattern. The afternoon dew-point temperature errors were somewhat higher than the WRF errors, and also reflected the greater likelihood to repeat an error category the following day. The winter MM5 temperature forecasts were less accurate than the WRF forecasts at night, but as accurate during the day. Both times shared the WRF pattern of the forecasts being most likely to be followed by another forecast. The winter MM5 dew-point temperature forecast mean and absolute error amounts were very similar to those produced by the WRF. While the WRF forecasts showed persistence in the error categories for these dew-point temperature forecasts, the MM5 results showed no persistence WBB/U Utah (WBB) WBB is located in the large urban area of Salt Lake City, slightly higher than SNZ at an elevation of 4900 ft. Whereas the SNZ sensors are on a mast in the backyard of a house, the WBB sensors are on the roof of a University of Utah building. The summer temperature forecasts at WBB displayed a large bias of -6 C. With few forecasts accurate within 4 C, the error categories incorporated ranges of 1-5 C for the forecasts, 5-7 C for the forecasts, and 7-11 C for the forecasts. Based on these relatively large ranges, each category was most likely to be associated with the repeat of the same error category the following day, but not by a high percentage. The afternoon temperature forecasts also contained a low bias, but only by about half as much as at night. These forecasts showed no persistence in the forecast error categories. The WBB summer dew-point temperature forecast errors were even greater than the temperature errors, with the opposite bias of forecasts much higher than observed values. The nighttime results are portrayed in figure 10, showing some of the highest persistence occurrences in this study. This occurrence is primarily due to the change in bias errors from extremely large values in July to smaller values in August, as seen in figure 11. This pattern is similar to the one for the summer dew-point temperature errors at PRP. The summer daytime dew-point temperature forecast errors were smaller than during the night, but the bias and persistence trends were the same as the nighttime results. 19
28 Number of Subsequent Days with Forecast (green), (yellow), or (red) Better Average Worse Better Average Worse Previous Day Previous 2 Days Figure 10. The number of days with the dew-point temperature forecast error category of (green bars), (yellow bars), and (red bars), given the previous one-day forecast error category on the left and the previous two-day forecast error category on the right, for WBB at 2 a.m. in the summer Dew-Point Errors ( C) /3 7/10 7/17 7/24 7/31 8/7 8/14 8/21 8/28 Summer Dates 2 a.m. Figure 11. The daily dew-point temperature forecast error amounts for WBB at 2 a.m. in the summer. 20
29 The mean absolute error for the summer nighttime wind speed forecasts for WBB is just 2 m/s. However, figure 12 provides the forecast and observed values for each date, highlighting the lack of correlation between these data points. Their Pearson correlation coefficient is zero. With the lack of forecast skill, it is not surprising that the errors do not contain a pattern of persistence. The afternoon wind speed forecasts have a slightly positive correlation coefficient, but the days with or forecast errors were more likely to be followed by the opposite category than the same category Wind Speed (m/s) forecast observed 0.0 7/3 7/10 7/17 7/24 7/31 8/7 8/14 8/21 8/28 Summer Dates 2:00 a.m. Figure 12. WRF wind speed forecasts compared to the observations at 2 a.m. for the summer months at WBB. The summer wind direction forecasts had a mean absolute error of about 60º at 2 a.m. and slightly less at 2 p.m. Each time resulted in a slightly positive correlation coefficient. The and categories were only slightly more likely to be followed by the same category the next day. Winter temperature forecasts at the 2 a.m. valid time contained smaller errors than the ones in the summer. The persistence trend was similar, though, with each category slightly more likely to be followed by the same category the following day. The 4 C mean absolute temperature error in the winter 2 p.m. forecasts was somewhat higher than in the summer forecasts. These daytime temperature errors showed the most persistence of any sample of the case study. Of the forecast days, 11 subsequent days were also, 6 were, and 0 were. The days were followed by 5, 10, and 3 forecast days. The forecast days were associated with 2, 2, and 14 forecasts on the next day. Figure 13 depicts the order of the occurrences of all the forecast categories, starting with day 1 as 21
30 January 1, 2004 and going through day 60 as February 29, The high rate of persistence is associated with a long period of 6-12 C too high temperature forecasts from January 9 through January 24, followed by many days with forecast errors within 2 C, and then with primarily 2-4 C error amounts, including both overforecast and underforecast days, during the last half of February. Better Avg Worse WRF Temperature Error Categories at 2:00 p.m. (Day 1-60 = Jan 1-Feb 29) Figure 13. Daily temperature forecast error categories for the daytime winter forecasts for WBB. The marker labels indicate the forecast day in order from 1 through 60, equating to the forecast period of January 1 through February 29, The winter dew-point temperature forecast errors were considerably smaller than the errors seen in the summer months. There was a general trend for the high bias to decrease through the twomonth period, but many days deviated from the trend. The and categories were slightly more likely to be followed by the same category for both the nighttime and daytime forecasts. As seen in the summer results, the winter wind speed forecast errors were usually quite small. The first week in January and the second week in February produced several 2 a.m. forecast errors higher than any other period, but they did not occur on consecutive days. The daytime forecasts did not show any persistence pattern. The winter wind direction forecasts produced mean absolute errors comparable to the summer errors. The wind direction errors do not display any persistence for either the nighttime or daytime. The MM5 error patterns are discussed relative to the WRF results described above for WBB: The MM5 summer temperature forecasts produced larger errors at the nighttime than at the daytime, as was the case for the WRF, but the errors were smaller than those generated by the WRF. Only the category was most likely to repeat on consecutive days for the 3 a.m. MM5 forecasts, and any persistence seen at 3 p.m. was very slight. 22
Preliminary Comparison of March May Radiosonde Soundings with March May Climatological Profiles for Yuma, Arizona
 ARL-TN-0812 FEB 2017 US Army Research Laboratory Preliminary Comparison of March May Radiosonde Soundings with March May Climatological Profiles for Yuma, Arizona by J Cogan and P Haines NOTICES Disclaimers
Real-Time Environmental Information Network and Analysis System (REINAS)
") Calhoun: The NPS Institutional Archive Faculty and Researcher Publications Faculty and Researcher Publications 1998-09 Real-Time Environmental Information Network and Analysis System (REINAS) Nuss, Wendell
Calhoun: The NPS Institutional Archive Faculty and Researcher Publications Faculty and Researcher Publications 1998-09 Real-Time Environmental Information Network and Analysis System (REINAS) Nuss, Wendell
Predicting Tropical Cyclone Formation and Structure Change
 Predicting Tropical Cyclone Formation and Structure Change Patrick A. Harr Department of Meteorology Naval Postgraduate School Monterey, CA 93943-5114 Telephone: (831)656-3787 FAX:(831)656-3061 email:
Improvement of Mesoscale Numerical Weather Prediction For Coastal Regions of Complex Terrain FY2003
 Improvement of Mesoscale Numerical Weather Prediction For Coastal Regions of Complex Terrain FY2003 Clifford F. Mass Department of Atmospheric Sciences Box 351640 University of Washington Seattle, Washington
Coastal Engineering Technical Note
 Coastal Engineering Technical Note CETN I-48 (12/91) Evaluation and Application of the Wave Information Study for the Gulf of Mexico INTRODUCTION The Wave Information Study (WIS) for the Gulf of Mexico
Weather Research and Forecasting (WRF) Results over New Mexico
 Results over New Mexico") Weather Research and Forecasting (WRF) Results over New Mexico by Barbara Sauter ARL-TR-3715 January 2006 Approved for public release; distribution is unlimited. NOTICES Disclaimers The findings in this
Weather Research and Forecasting (WRF) Results over New Mexico by Barbara Sauter ARL-TR-3715 January 2006 Approved for public release; distribution is unlimited. NOTICES Disclaimers The findings in this
Hot Environment Assessment Tool (HEAT) User s Guide for Apple Mobile Devices
 User s Guide for Apple Mobile Devices") ARL-TR-7347 JULY 2015 US Army Research Laboratory Hot Environment Assessment Tool (HEAT) User s Guide for Apple Mobile Devices by David Sauter Approved for public release; distribution unlimited. NOTICES
ARL-TR-7347 JULY 2015 US Army Research Laboratory Hot Environment Assessment Tool (HEAT) User s Guide for Apple Mobile Devices by David Sauter Approved for public release; distribution unlimited. NOTICES
Regional Stratification and Shear of the Various Streams Feeding the Philippine Straits ESR Component
 Regional Stratification and Shear of the Various Streams Feeding the Philippine Straits ESR Component Amy Ffield Earth & Space Research, 290 Clausland Mountain Road, Upper Grandview, NY 10960-4113 phone:
PIPS 3.0. Pamela G. Posey NRL Code 7322 Stennis Space Center, MS Phone: Fax:
 PIPS 3.0 Ruth H. Preller Naval Research Laboratory, Code 7322 Stennis Space Center, MS 39529 phone: (228) 688-5444 fax: (228)688-4759 email: preller@nrlssc.navy.mil Pamela G. Posey NRL Code 7322 Stennis
NAVGEM Platform Support
 DISTRIBUTION STATEMENT A. Approved for public release; distribution is unlimited. NAVGEM Platform Support Mr. Timothy Whitcomb Naval Research Laboratory 7 Grace Hopper Ave, MS2 Monterey, CA 93943 phone:
DISTRIBUTION STATEMENT A. Approved for public release; distribution is unlimited.
 DISTRIBUTION STATEMENT A. Approved for public release; distribution is unlimited. The Probabilistic Nature of Extended-Range Predictions of Tropical Cyclone Activity and Tracks as a Factor in Forecasts
Erik L. Swanberg 1 and Steven G. Hoffert 2. Veridian Systems 1, Autometric 2. Sponsored by Defense Threat Reduction Agency
 USING ATMOSPHERIC 137 CS MEASUREMENTS AND HYSPLIT TO CONFIRM CHERNOBYL AS A SOURCE OF 137 CS IN EUROPE Erik L. Swanberg 1 and Steven G. Hoffert 2 Veridian Systems 1, Autometric 2 Sponsored by Defense Threat
REGENERATION OF SPENT ADSORBENTS USING ADVANCED OXIDATION (PREPRINT)
") AL/EQ-TP-1993-0307 REGENERATION OF SPENT ADSORBENTS USING ADVANCED OXIDATION (PREPRINT) John T. Mourand, John C. Crittenden, David W. Hand, David L. Perram, Sawang Notthakun Department of Chemical Engineering
AL/EQ-TP-1993-0307 REGENERATION OF SPENT ADSORBENTS USING ADVANCED OXIDATION (PREPRINT) John T. Mourand, John C. Crittenden, David W. Hand, David L. Perram, Sawang Notthakun Department of Chemical Engineering
Predicting Deformation and Strain Behavior in Circuit Board Bend Testing
 Predicting Deformation and Strain Behavior in Circuit Board Bend Testing by Ronen Aniti ARL-CR-0693 May 2012 prepared by Science and Engineering Apprenticeship Program George Washington University 2121
System Reliability Simulation and Optimization by Component Reliability Allocation
 System Reliability Simulation and Optimization by Component Reliability Allocation Zissimos P. Mourelatos Professor and Head Mechanical Engineering Department Oakland University Rochester MI 48309 Report
PERFORMANCE OF THE WRF-ARW IN THE COMPLEX TERRAIN OF SALT LAKE CITY
 P2.17 PERFORMANCE OF THE WRF-ARW IN THE COMPLEX TERRAIN OF SALT LAKE CITY Jeffrey E. Passner U.S. Army Research Laboratory White Sands Missile Range, New Mexico 1. INTRODUCTION The Army Research Laboratory
AN EMPIRICAL SHAPED CHARGE JET BREAKUP MODEL
 AD AD-E40 57 Technical Report ARMET-TR-1009 AN EMPIRICAL SHAPED CHARGE JET BREAKUP MODEL Ernest L. Baker James Pham Tan Vuong July 2014 U.S. ARMY ARMAMENT RESEARCH, DEVELOPMENT AND ENGINEERING CENTER Munitions
Optical Turbulence Model for Laser Propagation and Imaging Applications
 Optical Turbulence Model for Laser Propagation and Imaging Applications E. S. Oh a1, J. C. Ricklin b, G. C. Gilbreath a, N. J. Vallestero c, F. D. Eaton d a U.S. Naval Research Laboratory, Washington D.C.
Experimental and Theoretical Studies of Ice-Albedo Feedback Processes in the Arctic Basin
 LONG TERM GOALS Experimental and Theoretical Studies of Ice-Albedo Feedback Processes in the Arctic Basin D.K. Perovich J.A. Richter-Menge W.B. Tucker III M. Sturm U. S. Army Cold Regions Research and
Sea Ice Model for Marginal Ice Zone
 Sea Ice Model for Marginal Ice Zone Max D. Coon Northwest Research Associates, Inc. 14508 N.E. 20 th Street Bellevue, WA 98007-3713 Phone: (425) 644-9660 ext. 332 Fax: (425) 644-8422 E-mail: max@nwra.com
REDUCING PEAK POWER IN AUTOMATED WEAPON LAYING
 AD AD-E403 AD-E403 737 Technical Report ARWSE-TR-15036 REDUCING PEAK POWER IN AUTOMATED WEAPON LAYING Joshua Stapp Matthew Tomik February 2016 U.S. ARMY ARMAMENT RESEARCH, DEVELOPMENT AND ENGINEERING CENTER
The Extratropical Transition of Tropical Cyclones
 The Extratropical Transition of Tropical Cyclones Elizabeth A. Ritchie Department of Electrical and Computer Engineering and the Center for High Performance Computing Room 125, EECE Building Albuquerque,
Two-Dimensional Simulation of Truckee River Hydrodynamics
 Two-Dimensional Simulation of Truckee River Hydrodynamics by Stephen H. Scott PURPOSE: The purpose of this Coastal and Hydraulics Engineering Technical Note (CHETN) is to demonstrate the use of multidimensional
Experimental and Theoretical Studies of Ice-Albedo Feedback Processes in the Arctic Basin
 LONG TERM GOALS Experimental and Theoretical Studies of Ice-Albedo Feedback Processes in the Arctic Basin D.K. Perovich J.A. Richter-Menge W.B. Tucker III M. Sturm U. S. Army Cold Regions Research and
Attribution Concepts for Sub-meter Resolution Ground Physics Models
 Attribution Concepts for Sub-meter Resolution Ground Physics Models 76 th MORS Symposium US Coast Guard Academy Approved for public release distribution. 2 Report Documentation Page Form Approved OMB No.
3.6 EFFECTS OF WINDS, TIDES, AND STORM SURGES ON OCEAN SURFACE WAVES IN THE JAPAN/EAST SEA
 3.6 EFFECTS OF WINDS, TIDES, AND STORM SURGES ON OCEAN SURFACE WAVES IN THE JAPAN/EAST SEA Wei Zhao 1, Shuyi S. Chen 1 *, Cheryl Ann Blain 2, Jiwei Tian 3 1 MPO/RSMAS, University of Miami, Miami, FL 33149-1098,
Report Documentation Page
 Report Documentation Page Form Approved OMB No. 0704-0188 Public reporting burden for the collection of information is estimated to average 1 hour per response, including the time for reviewing instructions,
Report Documentation Page
 Improved Techniques for Targeting Additional Observations to Improve Forecast Skill T. N. Palmer, M. Leutbecher, K. Puri, J. Barkmeijer European Centre for Medium-Range Weather F orecasts Shineld Park,
DISTRIBUTION STATEMENT A. Approved for public release; distribution is unlimited.
 DISTRIBUTION STATEMENT A. Approved for public release; distribution is unlimited. Understanding Impacts of Outflow on Tropical Cyclone Formation and Rapid Intensity and Structure Changes with Data Assimilation
Predictive Model for Archaeological Resources. Marine Corps Base Quantico, Virginia John Haynes Jesse Bellavance
 Predictive Model for Archaeological Resources Marine Corps Base Quantico, Virginia John Haynes Jesse Bellavance Report Documentation Page Form Approved OMB No. 0704-0188 Public reporting burden for the
Expressions for the Total Yaw Angle
 ARL-TN-0775 SEP 2016 US Army Research Laboratory Expressions for the Total Yaw Angle by Benjamin A Breech NOTICES Disclaimers The findings in this report are not to be construed as an official Department
Estimation of Vertical Distributions of Water Vapor and Aerosols from Spaceborne Observations of Scattered Sunlight
 Estimation of Vertical Distributions of Water Vapor and Aerosols from Spaceborne Observations of Scattered Sunlight Dale P. Winebrenner Polar Science Center/Applied Physics Laboratory University of Washington
The Sediment Budget Calculator: A Webtool to Develop a Family of Viable Inlet and Adjacent Beach Sediment Budget Solutions
 The Sediment Budget Calculator: A Webtool to Develop a Family of Viable Inlet and Adjacent Beach Sediment Budget Solutions by Julie Dean Rosati, Charles A. Sumner, and Derek A. Wilson PURPOSE: This Coastal
Analysis Comparison between CFD and FEA of an Idealized Concept V- Hull Floor Configuration in Two Dimensions. Dr. Bijan Khatib-Shahidi & Rob E.
 Concept V- Hull Floor Configuration in Two Dimensions Dr. Bijan Khatib-Shahidi & Rob E. Smith 10 November 2010 : Dist A. Approved for public release Report Documentation Page Form Approved OMB No. 0704-0188
Report Documentation Page
 Inhibition of blood cholinesterase activity is a poor predictor of acetylcholinesterase inhibition in brain regions of guinea pigs exposed to repeated doses of low levels of soman. Sally M. Anderson Report
Understanding Near-Surface and In-cloud Turbulent Fluxes in the Coastal Stratocumulus-topped Boundary Layers
 Understanding Near-Surface and In-cloud Turbulent Fluxes in the Coastal Stratocumulus-topped Boundary Layers Qing Wang Meteorology Department, Naval Postgraduate School Monterey, CA 93943 Phone: (831)
Monsoon Disturbances Over Southeast and East Asia and the Adjacent Seas
 Monsoon Disturbances Over Southeast and East Asia and the Adjacent Seas C.-P. Chang Department of Meteorology Naval Postgraduate School, Code MR/Cp Monterey, CA 93943 Telephone 831-656-2840, e-mail cpchang@nps.navy.mil
Aviation Weather Routing Tool: A Decision Aid for Manned/Unmanned Aircraft Routing
 Aviation Weather Routing Tool: A Decision Aid for Manned/Unmanned Aircraft Routing Dr. Richard Shirkey Mr. Terry Jameson Battlefield Environment Division Army Research Laboratory, WSMR rshirkeyn@arl.army.mil
Use of Wijsman's Theorem for the Ratio of Maximal Invariant Densities in Signal Detection Applications
 Use of Wijsman's Theorem for the Ratio of Maximal Invariant Densities in Signal Detection Applications Joseph R. Gabriel Naval Undersea Warfare Center Newport, Rl 02841 Steven M. Kay University of Rhode
DIRECTIONAL WAVE SPECTRA USING NORMAL SPREADING FUNCTION
 CETN-I-6 3185 DIRECTIONAL WAVE SPECTRA USING NORMAL SPREADING FUNCTION PURPOSE : To present a parameterized model of a directional spectrum of the sea surface using an energy spectrum and a value for the
Guide to the Development of a Deterioration Rate Curve Using Condition State Inspection Data
 Guide to the Development of a Deterioration Rate Curve Using Condition State Inspection Data by Guillermo A. Riveros and Elias Arredondo PURPOSE: The deterioration of elements of steel hydraulic structures
Coupled Ocean-Atmosphere Modeling of the Coastal Zone
 Coupled Ocean-Atmosphere Modeling of the Coastal Zone Eric D. Skyllingstad College of Oceanic and Atmospheric Sciences, Oregon State University 14 Ocean Admin. Bldg., Corvallis, OR 97331 Phone: (541) 737-5697
Quantitation and Ratio Determination of Uranium Isotopes in Water and Soil Using Inductively Coupled Plasma Mass Spectrometry (ICP-MS)
") Quantitation and Ratio Determination of Uranium Isotopes in Water and Soil Using Inductively Coupled Plasma Mass Spectrometry (ICP-MS) D.N. Kurk, T.E. Beegle, S.C. Spence and R.J. Swatski Report Documentation
Quantitation and Ratio Determination of Uranium Isotopes in Water and Soil Using Inductively Coupled Plasma Mass Spectrometry (ICP-MS) D.N. Kurk, T.E. Beegle, S.C. Spence and R.J. Swatski Report Documentation
A 1/10th Degree Global Ocean Simulation Using the Parallel Ocean Program
 A 1/10th Degree Global Ocean Simulation Using the Parallel Ocean Program Mathew E Maltrud Fluid Dynamics Group MS B216 Los Alamos National Laboratory Los Alamos, NM 87545 phone: (505) 667-9097 fax: (505)
Design for Lifecycle Cost using Time-Dependent Reliability
 Design for Lifecycle Cost using Time-Dependent Reliability Amandeep Singh Zissimos P. Mourelatos Jing Li Mechanical Engineering Department Oakland University Rochester, MI 48309, USA : Distribution Statement
Implementation of Modeling the Land-Surface/Atmosphere Interactions to Mesoscale Model COAMPS
 DISTRIBUTION STATEMENT A: Approved for public release; distribution is unlimited. Implementation of Modeling the Land-Surface/Atmosphere Interactions to Mesoscale Model COAMPS Dr. Bogumil Jakubiak Interdisciplinary
USER S GUIDE. ESTCP Project ER
 USER S GUIDE Demonstration of a Fractured Rock Geophysical Toolbox (FRGT) for Characterization and Monitoring of DNAPL Biodegradation in Fractured Rock Aquifers ESTCP Project ER-201118 JANUARY 2016 F.D.
Investigation of the Air-Wave-Sea Interaction Modes Using an Airborne Doppler Wind Lidar: Analyses of the HRDL data taken during DYNAMO
 DISTRIBUTION STATEMENT: Approved for public release, distribution is unlimited. Investigation of the Air-Wave-Sea Interaction Modes Using an Airborne Doppler Wind Lidar: Analyses of the HRDL data taken
7. PERFORMING ORGANIZATION NAME(S) AND ADDRESS(ES) 8. PERFORMING ORGANIZATION REPORT NUMBER
 AND ADDRESS(ES) 8. PERFORMING ORGANIZATION REPORT NUMBER") REPORT DOCUMENTATION PAGE Form Approved OMB No. 0704-0188 The public reporting burden for this collection of information is estimated to average 1 hour per response, including the time for reviewing instructions,
REPORT DOCUMENTATION PAGE Form Approved OMB No. 0704-0188 The public reporting burden for this collection of information is estimated to average 1 hour per response, including the time for reviewing instructions,
Evolution of Tropical Cyclone Characteristics
 Evolution of Tropical Cyclone Characteristics Patrick A. Harr Department of Meteorology Naval Postgraduate School Monterey, CA 93943-5114 Telephone : (831) 656-3787 FAX: (831) 656-3061 email: paharr@nps.navy.mil
CRS Report for Congress
 CRS Report for Congress Received through the CRS Web Order Code RS21396 Updated May 26, 2006 Summary Iraq: Map Sources Hannah Fischer Information Research Specialist Knowledge Services Group This report
Laboratory Benchmark for Models of the Transport in the Kara Sea
 Laboratory Benchmark for Models of the Transport in the Kara Sea Thomas McClimans SINTEF Civil and Environmental Engineering N-7465 Trondheim Norway voice: +47 73592417 fax: +47 73 592376 email: thomas.mcclimans@civil.sintef.no
MONSOON DISTURBANCES OVER SOUTHEAST AND EAST ASIA AND THE ADJACENT SEAS
 MONSOON DISTURBANCES OVER SOUTHEAST AND EAST ASIA AND THE ADJACENT SEAS LONG TERM GOALS C.-P. Chang Department of Meteorology Naval Postgraduate School, Code MR/Cp Monterey, CA 93943 Telephone 408-656-2840,
Internal Tide Generation in the Indonesian Seas
 Internal Tide Generation in the Indonesian Seas Amy Ffield Earth and Space Research, 290 Clausland Mountain Road, Upper Grandview, NY 10960 Phone: (845) 353-1733 Fax: (845) 353-1733 Email: ffield@esr.org
Satellite Observations of Surface Fronts, Currents and Winds in the Northeast South China Sea
 Satellite Observations of Surface Fronts, Currents and Winds in the Northeast South China Sea Michael J. Caruso Department of Physical Oceanography, MS #21 Woods Hole Oceanographic Institution Woods Hole,
EFFECTS OF LOCAL METEOROLOGICAL VARIABILITY ON SURFACE AND SUBSURFACE SEISMIC-ACOUSTIC SIGNALS
 EFFECTS OF LOCAL METEOROLOGICAL VARIABILITY ON SURFACE AND SUBSURFACE SEISMIC-ACOUSTIC SIGNALS Jason R. McKenna and Mihan H. McKenna U.S. Army Engineer Research & Development Center, Vicksburg, MS 39180
Crowd Behavior Modeling in COMBAT XXI
 Crowd Behavior Modeling in COMBAT XXI Imre Balogh MOVES Research Associate Professor ilbalogh@nps.edu July 2010 831-656-7582 http://movesinstitute.org Report Documentation Page Form Approved OMB No. 0704-0188
Scattering of Internal Gravity Waves at Finite Topography
 Scattering of Internal Gravity Waves at Finite Topography Peter Muller University of Hawaii Department of Oceanography 1000 Pope Road, MSB 429 Honolulu, HI 96822 phone: (808)956-8081 fax: (808)956-9164
High Resolution Surface Characterization from Marine Radar Measurements
 DISTRIBUTION STATEMENT A: Distribution approved for public release; distribution is unlimited High Resolution Surface Characterization from Marine Radar Measurements Hans C. Graber CSTARS - University
Fleet Maintenance Simulation With Insufficient Data
 Fleet Maintenance Simulation With Insufficient Data Zissimos P. Mourelatos Mechanical Engineering Department Oakland University mourelat@oakland.edu Ground Robotics Reliability Center (GRRC) Seminar 17
Sensitivity of West Florida Shelf Simulations to Initial and Boundary Conditions Provided by HYCOM Data-Assimilative Ocean Hindcasts
 Sensitivity of West Florida Shelf Simulations to Initial and Boundary Conditions Provided by HYCOM Data-Assimilative Ocean Hindcasts George Halliwell, MPO/RSMAS, University of Miami Alexander Barth, University
Near-Surface Dispersion and Circulation in the Marmara Sea (MARMARA)
") DISTRIBUTION STATEMENT A. Approved for public release; distribution is unlimited. Near-Surface Dispersion and Circulation in the Marmara Sea (MARMARA) Pierre-Marie Poulain Istituto Nazionale di Oceanografia
DISTRIBUTION STATEMENT A. Approved for public release; distribution is unlimited. Near-Surface Dispersion and Circulation in the Marmara Sea (MARMARA) Pierre-Marie Poulain Istituto Nazionale di Oceanografia
Analysis of Mixing and Dynamics Associated with the Dissolution of Hurricane-Induced Cold Wakes
 DISTRIBUTION STATEMENT A: Approved for public release; distribution is unlimited. Analysis of Mixing and Dynamics Associated with the Dissolution of Hurricane-Induced Cold Wakes Carol Anne Clayson Dept.
General Atomics Pulsed Power Capacitor Comparison Test Report
 ARL-TR-7350 JULY 2015 US Army Research Laboratory General Atomics Pulsed Power Capacitor Comparison Test Report by Richard L Thomas Approved for public release; distribution unlimited. NOTICES Disclaimers
Using Dye to Study Lateral Mixing in the Ocean: 100 m to 1 km
 DISTRIBUTION STATEMENT A. Approved for public release; distribution is unlimited. Using Dye to Study Lateral Mixing in the Ocean: 100 m to 1 km Murray D. Levine Oregon State University College of Earth,
Optimizing Robotic Team Performance with Probabilistic Model Checking
 Optimizing Robotic Team Performance with Probabilistic Model Checking Software Engineering Institute Carnegie Mellon University Pittsburgh, PA 15213 Sagar Chaki, Joseph Giampapa, David Kyle (presenting),
Surface Fluxes and Wind-Wave Interactions in Weak Wind Conditions
 Surface Fluxes and Wind-Wave Interactions in Weak Wind Conditions Jielun Sun Microscale and Mesoscale Meteorology National Center for Atmospheric Research phone: (303) 497-8994 fax: (303) 497-8171 email:
HYCOM Caspian Sea Modeling. Part I: An Overview of the Model and Coastal Upwelling. Naval Research Laboratory, Stennis Space Center, USA
 HYCOM Caspian Sea Modeling. Part I: An Overview of the Model and Coastal Upwelling By BIROL KARA, ALAN WALLCRAFT AND JOE METZGER Naval Research Laboratory, Stennis Space Center, USA MURAT GUNDUZ Institute
Broadband matched-field source localization in the East China Sea*
 Broadband matched-field source localization in the East China Sea* Renhe Zhang Zhenglin Li Jin Yan Zhaohui Peng Fenghua Li National Laboratory of Acoustics, Institute of Acoustics, Chinese Academy of Sciences,
Coastal Ocean Circulation Experiment off Senegal (COCES)
") DISTRIBUTION STATEMENT A: Approved for public release; distribution is unlimited. Coastal Ocean Circulation Experiment off Senegal (COCES) Pierre-Marie Poulain Istituto Nazionale di Oceanografia e di Geofisica
DISTRIBUTION STATEMENT A: Approved for public release; distribution is unlimited. Coastal Ocean Circulation Experiment off Senegal (COCES) Pierre-Marie Poulain Istituto Nazionale di Oceanografia e di Geofisica
Coastal Mixing and Optics
 Coastal Mixing and Optics W. Scott Pegau College of Oceanic and Atmospheric Sciences Ocean. Admin. Bldg. 104 Oregon State University Corvallis, OR 97331-5503 Phone: (541) 737-5229 fax: (541) 737-2064 email:
Metrology Experiment for Engineering Students: Platinum Resistance Temperature Detector
 Session 1359 Metrology Experiment for Engineering Students: Platinum Resistance Temperature Detector Svetlana Avramov-Zamurovic, Carl Wick, Robert DeMoyer United States Naval Academy Abstract This paper
Convection and Shear Flow in TC Development and Intensification
 DISTRIBUTION STATEMENT A. Approved for public release; distribution is unlimited. Convection and Shear Flow in TC Development and Intensification C.-P. Chang Department of Meteorology Naval Postgraduate
Coastal and Hydraulics Laboratory
 ERDC/CHL TR-05-6 Texas City Ship Channel Deepening Study, Hydrodynamic Model Lisa M. Lee, Jennifer N. Tate, and R. C. Berger August 2005 Coastal and Hydraulics Laboratory Approved for public release; distribution
ANALYSIS AND MODELING OF STRATOSPHERIC GRAVITY WAVE ACTIVITY ALONG ER-2 FLIGHT TRACKS
 To appear in Proceedings of the 1 st SPARC General Assembly, Melbourne, Australia, 2-6 December 1996. ANALYSIS AND MODELING OF STRATOSPHERIC GRAVITY WAVE ACTIVITY ALONG ER-2 FLIGHT TRACKS Julio T. Bacmeister
Assimilation of Synthetic-Aperture Radar Data into Navy Wave Prediction Models
 Assimilation of Synthetic-Aperture Radar Data into Navy Wave Prediction Models David T. Walker Earth Sciences Group, Veridian ERIM International P.O. Box 134008, Ann Arbor, MI 48113-4008 phone: (734)994-1200
THREE-DIMENSIONAL STRUCTURE AND EVOLUTION OF PROPAGATING DISTURBANCES IN THE MARINE LAYER OFF THE U.S
 THREE-DIMENSIONAL STRUCTURE AND EVOLUTION OF PROPAGATING DISTURBANCES IN THE MARINE LAYER OFF THE U.S. WEST COAST: ANALYSIS OF 1996 AIRCRAFT OBSERVATION LONG TERM GOALS John M. Bane, Jr. Department of
LAGRANGIAN MEASUREMENTS OF EDDY CHARACTERISTICS IN THE CALIFORNIA CURRENT
 LAGRANGIAN MEASUREMENTS OF EDDY CHARACTERISTICS IN THE CALIFORNIA CURRENT Robert C. Beardsley, Kenneth H. Brink, Richard Limeburner Clark Laboratory, Mail Stop 21 Woods Hole Oceanographic Institution Woods
OBJECTIVES C C APPROACH
 TOWARDS PREDITING DEEP ONVETION IN THE LABRADOR SEA Martin Visbeck LDEO olumbia University Palisades NY 10964 phone: (914) 365-8531, visbeck@ldeo.columbia.edu Award Number N00014-96-1-0573 LONG-TERM GOALS
MODELING SOLAR UV/EUV IRRADIANCE AND IONOSPHERE VARIATIONS WITH MT. WILSON MAGNETIC INDICIES
 1 MODELING SOLAR UV/EUV IRRADIANCE AND IONOSPHERE VARIATIONS WITH MT. WILSON MAGNETIC INDICIES Roger K. Ulrich Department of Physics and Astronomy University of California at Los Angeles Los Angeles, CA
Dynamics of Boundary Currents and Marginal Seas
 Dynamics of Boundary Currents and Marginal Seas W. E. Johns University of Miami, RSMAS/MPO 4600 Rickenbacker Causeway, Miami, Florida 33149-1098 Phone (305)361-4054; fax: (305)361-4696; email: wjohns@rsmas.miami.edu
REPORT DOCUMENTATION PAGE. Theoretical Study on Nano-Catalyst Burn Rate. Yoshiyuki Kawazoe (Tohoku Univ) N/A AOARD UNIT APO AP
 N/A AOARD UNIT APO AP") REPORT DOCUMENTATION PAGE Form Approved OMB No. 0704-0188 The public reporting burden for this collection of information is estimated to average 1 hour per response, including the time for reviewing instructions,
REPORT DOCUMENTATION PAGE Form Approved OMB No. 0704-0188 The public reporting burden for this collection of information is estimated to average 1 hour per response, including the time for reviewing instructions,
SWELL RATIO TESTER REPORT FY 2003
 Indian Head Division IHTR 2654 Naval Surface Warfare Center 24 September 2004 Indian Head, MD 20640-5035 SWELL RATIO TESTER REPORT FY 2003 Ralph Gamba Approved for public release; distribution is unlimited.
Diagonal Representation of Certain Matrices
 Diagonal Representation of Certain Matrices Mark Tygert Research Report YALEU/DCS/RR-33 December 2, 2004 Abstract An explicit expression is provided for the characteristic polynomial of a matrix M of the
Comparative Analysis of Flood Routing Methods
 US Army Corps of Engineers Hydrologic Engineering Center Comparative Analysis of Flood Routing Methods September 1980 Approved for Public Release. Distribution Unlimited. RD-24 REPORT DOCUMENTATION PAGE
Advanced Numerical Methods for NWP Models
 Advanced Numerical Methods for NWP Models Melinda S. Peng Naval Research Laboratory Monterey, CA 93943-552 Phone: (831) 656-474 fax: (831) 656-4769 e-mail: melinda.peng@nrlmry.navy.mil Award #: N148WX2194
Upper Ocean Measurements of Water Masses and Circulation in the Japan Sea
 Upper Ocean Measurements of Water Masses and Circulation in the Japan Sea Stephen C. Riser School of Oceanography, University of Washington, Seattle, Washington 98195 USA Phone: (206) 543-1187 Fax: (206)
Thermo-Kinetic Model of Burning for Polymeric Materials
 Thermo-Kinetic Model of Burning for Polymeric Materials Stanislav I. Stoliarov a, Sean Crowley b, Richard Lyon b a University of Maryland, Fire Protection Engineering, College Park, MD 20742 b FAA W. J.
by John Raby, Jeff Passner, Gail Vaucher, and Yasmina Raby ARL-TR-6000 May 2012 Approved for public release; distribution is unlimited.
 Performance Comparison of High Resolution Weather Research and Forecasting Model Output with North American Mesoscale Model Initialization Grid Forecasts by John Raby, Jeff Passner, Gail Vaucher, and Yasmina
Analysis of South China Sea Shelf and Basin Acoustic Transmission Data
 DISTRIBUTION STATEMENT A: Approved for public release; distribution is unlimited. Analysis of South China Sea Shelf and Basin Acoustic Transmission Data Ching-Sang Chiu Department of Oceanography Naval
VLBA IMAGING OF SOURCES AT 24 AND 43 GHZ
 VLBA IMAGING OF SOURCES AT 24 AND 43 GHZ D.A. BOBOLTZ 1, A.L. FEY 1, P. CHARLOT 2,3 & THE K-Q VLBI SURVEY COLLABORATION 1 U.S. Naval Observatory 3450 Massachusetts Ave., NW, Washington, DC, 20392-5420,
SW06 Shallow Water Acoustics Experiment Data Analysis
 DISTRIBUTION STATEMENT A: Approved for public release; distribution is unlimited. SW06 Shallow Water Acoustics Experiment Data Analysis James F. Lynch MS #12, Woods Hole Oceanographic Institution Woods
Super-Parameterization of Boundary Layer Roll Vortices in Tropical Cyclone Models
 DISTRIBUTION STATEMENT A. Approved for public release; distribution is unlimited. Super-Parameterization of Boundary Layer Roll Vortices in Tropical Cyclone Models PI Isaac Ginis Graduate School of Oceanography
Ocean Acoustics Turbulence Study
 Ocean Acoustics Turbulence Study PI John Oeschger Coastal Systems Station 6703 West Highway 98 Panama City, FL 32407 phone: (850) 230-7054 fax: (850) 234-4886 email: OeschgerJW@ncsc.navy.mil CO-PI Louis
P. Kestener and A. Arneodo. Laboratoire de Physique Ecole Normale Supérieure de Lyon 46, allée d Italie Lyon cedex 07, FRANCE
 A wavelet-based generalization of the multifractal formalism from scalar to vector valued d- dimensional random fields : from theoretical concepts to experimental applications P. Kestener and A. Arneodo
Shallow Water Fluctuations and Communications
 Shallow Water Fluctuations and Communications H.C. Song Marine Physical Laboratory Scripps Institution of oceanography La Jolla, CA 92093-0238 phone: (858) 534-0954 fax: (858) 534-7641 email: hcsong@mpl.ucsd.edu
Marginal Sea - Open Ocean Exchange
 Marginal Sea - Open Ocean Exchange Michael A. Spall Mail Stop 21 Department of Physical Oceanography Woods Hole Oceanographic Institution Woods Hole, MA 02543-1541 phone: (508) 289-3342 fax: (508) 457-2181
Characterization of Caribbean Meso-Scale Eddies
 Characterization of Caribbean Meso-Scale Eddies Jose M. Lopez P.O. Box 9013 Mayaguez, Puerto Rico 00681-9013 phone: (787) 834-7620 fax: (787) 834-8025 email: jlopez@uprm.edu phone: (787) 899-2049 Jorge
2008 Monitoring Research Review: Ground-Based Nuclear Explosion Monitoring Technologies SPECTRAL ANALYSIS OF RADIOXENON
 SPECTRAL ANALYSIS OF RADIOXENON Matthew W. Cooper, Ted W. Bowyer, James C. Hayes, Tom R. Heimbigner, Charles W. Hubbard, Justin I. McIntyre, and Brian T. Schrom Pacific Northwest National Laboratory Sponsored
Calculating Latent Heat Fluxes Over the Labrador Sea Using SSM/I Data
 Calculating Latent Heat Fluxes Over the Labrador Sea Using SSM/I Data Bernard Walter NorthWest Research Associates P. O. Box 3027 Bellevue, WA 98009 phone: (425) 644-9660, x-320; fax: (425) 644-8422; e-mail: