2 nd Tidal and Water Level Working Group Meeting
|
|
|
- Ginger Jackson
- 6 years ago
- Views:
Transcription
 Chris Jones United Kingdom Hydrographic")
1 2 nd Tidal and Water Level Working Group Meeting Norwegian Hydrographic Service, Stavanger, Norway April 2010 Vertical Offshore Reference Framework (VORF) Chris Jones United Kingdom Hydrographic Office
2 Presentation Structure What is VORF? Technical development Validation and Testing Summary
3 What is VORF? VORF = Vertical Offshore Reference Frame A set of mathematical models of the major surfaces used in the current and future charting of UK home waters A suite of software utilities allowing the transformation of mapping and positioning data between the VORF surfaces
4 Current practice for bathymetric data processing Tide gauge observed tide (and time) Use co-tidal chart derived from survey vessel Tidal correction Sea Surface Issues: Complexity onshore and offshore operations, time Latency the process takes time and hence is expensive depth measurement (and time of observation) Accuracy issues co-tidal charts have limited resolution and are derived from limited data; seabed gauges are expensive Charted depth Inconsistency practices using Chart Datum are sometimes poorly defined and can lead to discrepancies LAT or use seabed gauge

5 Bathymetric data processing with VORF and GPS survey vessel (+GPS) Tidal correction = h e VORF LAT Tidal correction Sea Surface depth measurement Charted depth = Depth measurement tidal correction h e LAT Charted VORFdepth LAT GRS80 Ellipsoid - accessible everywhere via GPS
6 VORF surfaces: HAT MHWS MSL2000 OD(Newlyn) (OD other) MLWS LAT Chart Datum GRS80 Ellipsoid
7 Technical development of VORF
8 Technologies applied in development of VORF Tide gauge data GPS data Satellite altimetry Gravity field models Tidal modelling
9 VORF Overall Approach Find mean sea level Model lowest astronomical tide Combine surfaces
10 Developing VORF (in one slide) Interpolation (data merging) by least squares collocation and a covariance function derived from the characteristics of the tide gauge and altimetry data. MSL Satellite altimetry: sea level measured directly from space Sea surface topography = MSL - geoid Interpolate sea surface Tide gauge topography MSL Altimeter measurements Tide gauge observations Tidal modelling Ellipsoidal height of mean sea level at coast Ellipsoidal height of Ellipsoidal satellite from height of MSL GPS in open oceans Ellipsoidal height of tide gauge from GPS
11 mm Monthly MSL Observations Many tide gauge stations only have one month of observations. Variations due to winds, pressure, currents, etc. Correct by cross comparison North Shields Monthly MSL above RLR RLR = Revised Local Reference (a generic level for time series analysis). Year
12 Spatial Correlation Monthly MSL above RLR mm North Shields Immingham Whitby Year Coefficient of correlation between pairs of tidal stations help to control the interpolation of MSL at stations where there are short series of data.

13 Spatial Correlation Spatial Correlation Scatter Plots Coefficients of correlation in monthly means of MSL PSMSL Tide Gauges Straight Line Distance Distorted by stations on opposite coasts which are relatively close to each other but have little correlation Straight Line Distance (km) North Shields to Workington only 140km apart but the coastal distance is > 1000km
14 Spatial Correlation Spatial Correlation Scatter Plots Coefficients of correlation in monthly means of MSL PSMSL Tide Gauges Sea Distance (km) Sea Distance Represents the shortest distance necessary to travel between the points by sea. Improved pattern in the correlation but there are still regions where the correlation is weaker than others.

15 Zones of De-correlation Looked at sea distance routes of pairs of stations that had correlations less than the average for their distance apart. Three zones of de-correlation were identified. Each zone has a single scale factor The proportions of any sea distance passing through the zone were multiplied by the factor to recalibrate the distance. Example: 2 stations separated by a sea distance of 1000km, 500km of which passes through a zone with a factor of 1.5, then the two stations would be expected to behave as if they were 1250km apart.
16 Spatial Correlation Spatial Correlation Scatter Plots Coefficients of correlation in monthly means of MSL PSMSL Tide Gauges Sea Distance Adjusted for Decorrelated Zones (km) Sea Distance adjusted for Decorrelated Zones Great improvement in coefficient of correlation which, although falling away over larger distances, the most important interval [0-500 km] shows stronger pattern.
17 Data sources: Tide Gauge data via the Permanent Service for Mean Sea Level (PSMSL) National Tidal and Sea Level Facility (NTSLF) stations High quality continuous observations BUT low spatial density

18 Data sources: Tide Gauges Admiralty Tide Table (ATT) Around 700 Standard and Secondary Port locations Good spatial density BUT occasionally low precision due to short term data series
19 Chart Datum: VORF aims to unify all these separate datums into one, seamless surface Process involves verifying the link between CD and Ordnance Datum (the landlevelling height datum)
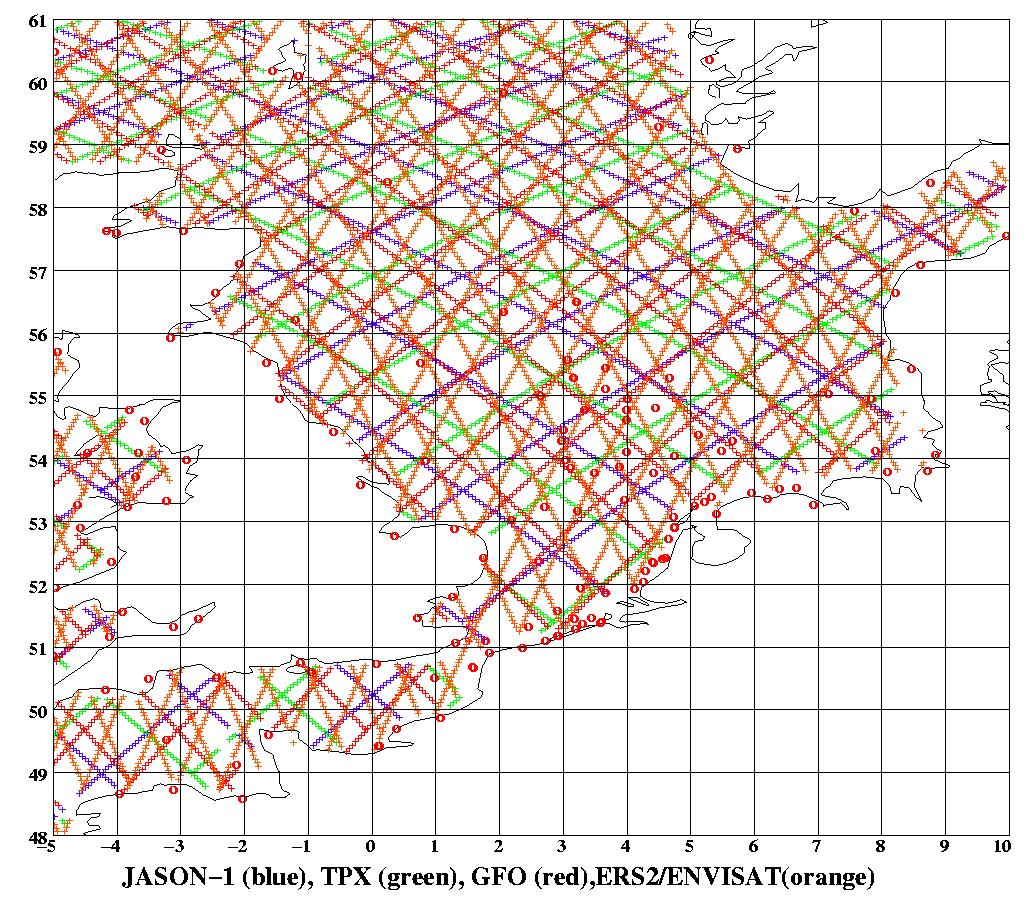
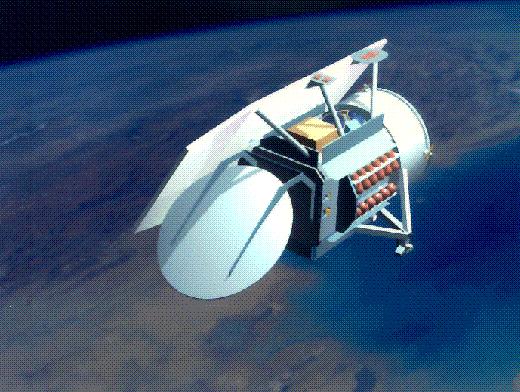
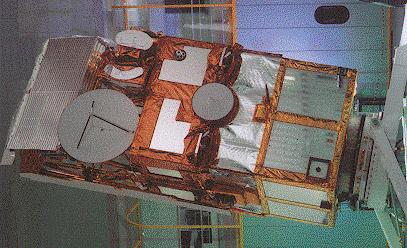
20 Technologies applied: Satellite Altimetry ENVISAT TOPEX JASON GFO ERS1/2
21 Technologies applied: OSGM05 UK gravity field model (OSGM09 now available)

22 River Datums

23 Use of Areas of Applicability

24 Boundaries of VORF Model: UK Continental Shelf
25 Testing and validation of VORF
26 Locations for testing
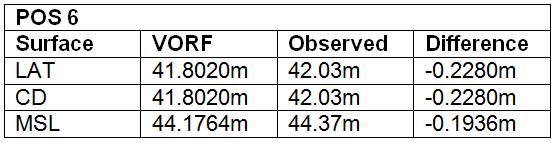
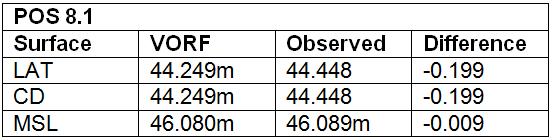
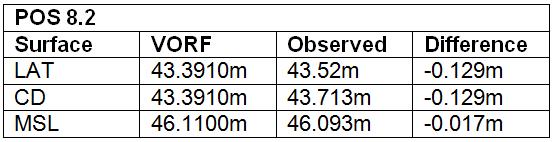
27 Objectives of testing Obtain the necessary data at each location to allow for the separations available in the VORF model to be derived independently. The derived values will then be compared with the VORF output to ensure that they fall within the error budget.
28 Method of Data Gathering Deploy a tide gauge at a test location. Leave the gauge recording data for at least 2 months (seabed mounted gauge, or in some instances a fixed structure such as a jetty or platform). Ensure the gauge is logging using times that are synchronised with the GPS logging described below. Data is to be corrected for atmospheric pressure factors. Vessel must record water level height relative to the ellipsoid to within 5cm accuracy (for example by RTK, post-processed dual frequency GPS etc.). Great care must be taken to ensure that it is the water level height that is resolved (i.e. the reference point to water level value must be regularly determined). Therefore vessel draft (which affects antenna height) may need to be controlled.
29 Method of Data Gathering Position the vessel directly above (or within 500m of) the recording tide gauge position. Log the water level height from the GPS solution onboard the vessel for at least 8 hours. The vessel should be stationary (at anchor) during this procedure to reduce squat and settlement influences. Data should be logged from at least 1 hour before until 1 hour after high/low water (or longer as necessary) so that 1 peak and 1 trough of the tide curve are resolved. Leave the tide gauge logging data for 2 months. Repeat the vessel logging procedure before recovering the tide gauge.
30 Analysis of Gathered Data Tide Gauge Conduct harmonic analysis on the tide gauge observations. Derive Chart Datum (CD) at the location, by:- Transfer Datum from an established location. Use Co-Tidal Chart. Use harmonic constituents to compute Lowest Astronomical Tide (LAT) using a Mean Sea Level value of 0 (zero). Once CD has been established, compute the various tidal planes (Mean High / Low Water Springs [MHWS / MLWS] etc.) The next step is to then establish these planes with respect to the ellipsoid.
31 Analysis of Gathered Data Linking the Tide Gauge data to the GPS data Using the simultaneous GPS and Tide Gauge records, subtract the raw tide gauge readings from the GPS heights (for each corresponding record over the length of available GPS observations) and obtain the mean of these differences. Add this mean difference to all raw tide gauge readings Obtain the mean of the adjusted tide gauge readings this gives a value which can be considered to be MSL above the reference ellipsoid. The tidal planes derived from the tidal analysis can now be referenced to the reference ellipsoid.
32 Results so far...
33
34 VORF software functionality Transformation between datums Estimated error in transformations Visualisation User error detection Point/file mode data import Deals with complexity of searching for special cases such as rivers and impounded datums. High speed data retrieval and processing.
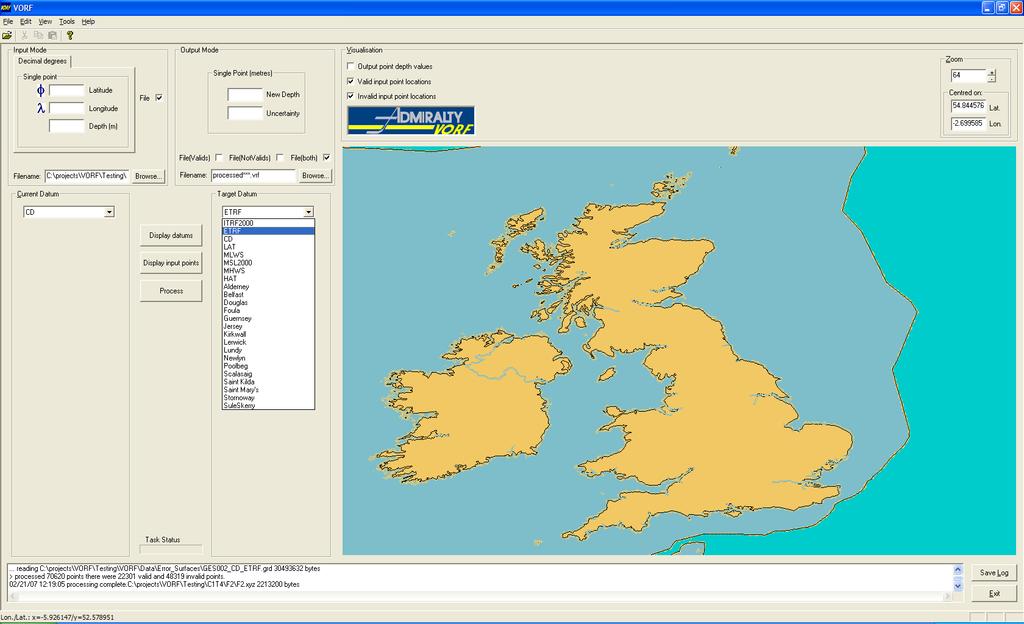
35 VORF Application

36 Current progress: V2.0 delivered to UKHO Jan 08. Now to do: Stakeholders to be revisited Needs full testing Needs to be developed into robust software Safety case
37 How can VORF benefit the UKHO? Cost and efficiency of surveys Quality control Enabling new technologies Developing new products
38 Summary of VORF advantages VORF derives continuous surfaces, with fixed reference to ETRF89. It provides a consistent interpolation between Chart Datums, and methodology for extrapolation offshore. It eliminates some of the reliance on remote or expensive tidal observations. It has the potential to be built in to real-time applications. It fully exploits current and future GPS technology, and is the basis for future accuracy enhancements.
39 Conclusions VORF is an enabling technology Surveying without tide gauges cheaper, faster, more accurate New navigation and space management concepts Fully integrated data products SOLAS improved navigation in critical areas VORF will help UKHO in its development of marine charting and navigation products
40 References and Further Reading General descriptions: Iliffe, Jonathan, Marek Ziebart, James Turner, Joao F Oliveira, and Ruth Adams. The VORF project Joining up Land and Marine Data. GIS Professional. Issue 13, November/December 2006, pp Adams, Ruth, Jonathan Iliffe, Marek Ziebart, James Turner, and Joao F Oliveira. Joining up Land and Sea the UKHO/UCL Vertical Offshore Reference Frame. Hydro International Volume 10 Number 10, December More detail on the methodology : Iliffe, Jonathan C., Marek K Ziebart and Jim F Turner. "The derivation of vertical datum surfaces for hydrographic applications". The Hydrographic Journal, No. 125, 2007, pp 3-8. Further details on the methodology of deriving sea surface topography around the British Isles as part of the project can be found in: Iliffe, J. C., Ziebart, M. K. and Turner, J. F. (2007) 'A New Methodology for Incorporating Tide Gauge Data in Sea Surface Topography Models', Marine Geodesy, 30:4, Future uses:: Ziebart, M., J.Iliffe, J.Turner, J.Oliveira and R.Adams (2007), VORF The UK Vertical Offshore Reference Frame: Enabling Real-time Hydrographic Surveying, proceedings of ION GNSS2007, Fort Worth, Texas, USA, September, 2007.
Shape of the Earth. Data Output by the Receiver
 It is quite common for confusion to arise about the process used during a hydrographic survey when GPS-derived water surface elevation is incorporated into the data as an RTK Tide correction. This article
Final VRF grids Date: Aug 25, 2011 Author: R. Forsberg, G. Strykowski, O. Andersen
 Final VRF grids Date: Aug 25, 2011 Author: R. Forsberg, G. Strykowski, O. Andersen www.blast-project.eu 1 Authors Name Organisation Rene Forsberg National Space Institute, DTU G. Strykowski National Space
Location. Datum. Survey. information. Etrometa. Step Gauge. Description. relative to Herne Bay is -2.72m. The site new level.
 Tide Gauge Location OS: 616895E 169377N WGS84: Latitude: 51 o 22.919196 N Longitude: 01 o 6.9335907 E Instrument Type Etrometa Step Gauge Benchmarks Benchmark TGBM = 5.524m above Ordnance Datum Newlyn
Scarborough Tide Gauge
 Tide Gauge Location OS: 504898E 488622N WGS84: Latitude: 54 16' 56.990"N Longitude: 00 23' 25.0279"W Instrument Valeport 740 (Druck Pressure Transducer) Benchmarks Benchmark Description TGBM = 4.18m above
Location. Datum. Survey. information. Etrometa. Step Gauge. Description. relative to Herne Bay is -2.72m. The site new level.
 Tide Gauge Location OS: 616895E 169377N WGS84: Latitude: 51 o 22.919196 N Longitude: 01 o 6.9335907 E Instrument Type Etrometa Step Gauge Benchmarks Benchmark TGBM = 5.524m above Ordnance Datum Newlyn
Arun Platform Tide Gauge
 Arun Platform Tide Gauge Location OS: 506423E 97778N WGS84: Latitude: 50 46 11.39042"N Longitude: 00 29 31.73595"W Instrument Valeport 730 (Druck Pressure Transducer) TGBM Benchmarks Benchmark Description
Ellipsoidally Referenced Surveys Separation Models
 Ellipsoidally Referenced Surveys Separation Models David DODD - Canada Jerry MILLS - USA Key words: Hydrography, Ellipsoid, Chart Datum Summary One of the most significant issues in hydrography today is
Active microwave systems (2) Satellite Altimetry * the movie * applications
 Satellite Altimetry * the movie * applications") Remote Sensing: John Wilkin wilkin@marine.rutgers.edu IMCS Building Room 211C 732-932-6555 ext 251 Active microwave systems (2) Satellite Altimetry * the movie * applications Altimeters (nadir pointing
Remote Sensing: John Wilkin wilkin@marine.rutgers.edu IMCS Building Room 211C 732-932-6555 ext 251 Active microwave systems (2) Satellite Altimetry * the movie * applications Altimeters (nadir pointing
Vertical Reference Frames Simple Geometry or Measurement Sciences or a complex combination of both?
 Vertical Reference Frames Simple Geometry or Measurement Sciences or a complex combination of both? By David Philip The views expressed in this presentation are based on my own web-based research to date
Progress towards Establishment of a Unique Vertical Datum for Hydrography and Land Surveying in the Emirate of Dubai-Case Study
 Progress towards Establishment of a Unique Vertical Datum for Hydrography and Land Surveying in the Emirate of Dubai-Case Study Yousuf AL MARSOOQI, Amira ALZAROUNI, Satheesh GOPI, United Arab Emirates
Ellipsoid Hydro Datum Geoid Errors
 Ellipsoid Hydro Datum Geoid Errors Jack L. Riley Office of Coast Survey Hydrographic Systems & Technology Branch Geoid Errors via Ellipsoid Hydrography? Per datum hydro Traditional & ellipsoid referenced
Adapting NEMO for use as the UK operational storm surge forecasting model
 Adapting NEMO for use as the UK operational storm surge forecasting model Rachel Furner 1, Jane Williams 2, Kevin Horsburgh 2, Andy Saulter 1 1; Met Office 2; NOC Table of Contents Existing CS3 model Developments
MLLW and the NAD83 Ellipsoid: An Investigation of Local Offsets and Trends Using PPK and Gauge Derived Water Surfaces.
 MLLW and the NAD83 Ellipsoid: An Investigation of Local Offsets and Trends Using PPK and Gauge Derived Water Surfaces. Abstract: Authors Doug Lockhart, Fugro Pelagos, Inc. Andy Orthmann, Fugro Pelagos,
SOUTH AFRICAN TIDE TABLES
 SAN HO-2 2018 SOUTH AFRICAN TIDE TABLES PUBLISHED BY THE HYDROGRAPHER SOUTH AFRICAN NAVY PRIVATE BAG X1 TOKAI, 7966 COPYRIGHT RESERVED ISBN 978-0-9869717-9-2 CONTENTS Preface.... (iii) Tidal Levels......(iv)
SOUTH AFRICAN TIDE TABLES
 SAN HO-2 2019 SOUTH AFRICAN TIDE TABLES PUBLISHED BY THE HYDROGRAPHER SOUTH AFRICAN NAVY PRIVATE BAG X1 TOKAI, 7966 COPYRIGHT RESERVED ISBN 978-0-9947002-0-9 Intentionally left blank CONTENTS Preface....
P. Cipollini, H. Snaith - A short course on Altimetry. Altimetry 2 - Data processing (from satellite height to sea surface height)
") P. Cipollini, H. Snaith - A short course on Altimetry Altimetry 2 - Data processing (from satellite height to sea surface height) 1 2 Satellite height to sea surface height The altimeter measures the altitude
P. Cipollini, H. Snaith - A short course on Altimetry Altimetry 2 - Data processing (from satellite height to sea surface height) 1 2 Satellite height to sea surface height The altimeter measures the altitude
Vertical Reference Frame Pacific
 Vertical Reference Frame Pacific Andrick Lal SPC Geoscience Division GIS&RS User Conference 29 th November 2016 USP, Fiji. What does it mean? All buildings and features have a height. But what is it relative
Why do we need a proper geoid
 Why do we need a proper geoid Petr Vaníček Department of Geodesy and Geomatics Engineering University of New Brunswick P.O. Box 4400 Fredericton, N.B. CND E3B 53 1 My working hypothesis: Let us all agree
Tidal stream atlases Reprinted by PC Maritime with kind permission of Proudman Laboratory
 The generation of UK tidal stream atlases from regularly gridded hydrodynamic modelled data by Colin Bell and Lisa Carlin Proudman Oceanographic Laboratory http://www.pol.ac.uk http://www.pcmaritime.co.uk
Specification & Content of Marine Reference Information
 Specification & Content of Marine Reference Information By Mike Osborne and James Rapaport SeaZone Solutions Limited CONTENTS 1. History of Marine Data 2. User Requirements 3. Geographic Content 4. SeaZone
In this module we will be looking at the factors which cause the tides and how to calculate their effects. At first
 LESSON 5.1 Tides and How To Allow for Them In this module we will be looking at the factors which cause the tides and how to calculate their effects. At first this subject might seem a little daunting,
PGM2016: A new geoid model for the. Philippines
 PGM2016: A new geoid model for the Philippines United Nations/Nepal Workshop on the Applications of Global Navigation Satellite Systems Kathmandu, Nepal December 12-16, 2016 Ronaldo Gatchalian, Chief Geodesy
Fra momentan vannstand til lokal geoideinformasjon From instantaneous sea level to local geoid information
 Fra momentan vannstand til lokal geoideinformasjon From instantaneous sea level to local geoid information Geometric geoid determination by using vessel borne GNSS/INS, tide gauges and air borne laserscanning.
Design and Implementation of a NOAA/NOS Cook Inlet and Shelikof Straits Circulation Modeling System
 Design and Implementation of a NOAA/NOS Cook Inlet and Shelikof Straits Circulation Modeling System Presented at a NOAA/AEA Stakeholders Meeting, August 24, 2011, Anchorage Alaska Richard Patchen and Lyon
Characterization of the Nigerian Shoreline using Publicly-Available Satellite Imagery
 University of New Hampshire University of New Hampshire Scholars' Repository Center for Coastal and Ocean Mapping Center for Coastal and Ocean Mapping 1-2014 Characterization of the Nigerian Shoreline
BLAST Harmonising spatial information across the North Sea region
 b r i n g i n g l a n d a n d s e a t o g e t h e r BLAST Content: Harmonising spatial information across the North Sea region 3 BLAST Harmonising spatial information across the North Sea region 4 6 8
BLAST vertical datums: Overview, conventions and recommendations
 BLAST vertical datums: Overview, conventions and recommendations Date: June 20, 2011 Authors: Strykowski G., O.B. Andersen, I. Einarsson and R. Forsberg DTU Space, Denmark L. Doorst; T. Ligteringen, Hydrographic
Assessing Storm Tide Hazard for the North-West Coast of Australia using an Integrated High-Resolution Model System
 Assessing Storm Tide Hazard for the North-West Coast of Australia using an Integrated High-Resolution Model System J. Churchill, D. Taylor, J. Burston, J. Dent September 14, 2017, Presenter Jim Churchill
Supplement of Scenario-based numerical modelling and the palaeo-historic record of tsunamis in Wallis and Futuna, Southwest Pacific
 Supplement of Nat. Hazards Earth Syst. Sci., 15, 1763 1784, 2015 http://www.nat-hazards-earth-syst-sci.net/15/1763/2015/ doi:10.5194/nhess-15-1763-2015-supplement Author(s) 2015. CC Attribution 3.0 License.
Sea Level Variability in the East Coast of Male, Maldives
 Sea Level Variability in the East Coast of Male, Maldives K.W. Indika 1 *, E.M.S. Wijerathne 2, G. W. A. R. Fernando 3, S.S.L.Hettiarachchi 4 1 National Aquatics Resources Research and Development Agency,
Geodesy. orientation. shape. gravity field
 Geodesy noun Science of measuring the shape, orientation and gravity field of the Earth and how it changes over time. shape orientation gravity field Positioning has always been important Downstream applications
THE OPEN UNIVERSITY OF SRI LANKA
 THE OPEN UNIVERSITY OF SRI LANKA Extended Abstracts Open University Research Sessions (OURS 2017) 16 th & 17 th November, 2017 The Open University of Sri Lanka - 2017 All rights reserved. No part of this
A Mission to Planet Mars Gravity Field Determination
 A Mission to Planet Mars Gravity Field Determination Department for Theoretical Geodesy Graz University of Technology and Space Research Institute Austrian Academy of Sciences Gravity field CHAMP GRACE
Sea Level Space Watch: Service Offering
 Space for Smarter Government Programme Sea Level Space Watch: Service Offering General Sea Level Space Watch : Operational service developed to support national flood defence planning. Systematically updated
Storm surge forecasting and other Met Office ocean modelling
 Storm surge forecasting and other Met Office ocean modelling EMODnet stakeholder meeting Clare O Neill + many others Outline Ocean modelling at the Met Office Storm surge forecasting Current operational
NOAA s National Ocean Service. Center for Operational Oceanographic Products and Services
 NOAA s National Ocean Service Center for Operational Oceanographic Products and Services Richard Edwing, CO-OPS Acting Director January 27, 2010 Outline CO-OPS Overview Programs Observing Systems PORTS
Charts and Chart Work with Poole Sailing
 with Poole Sailing Nautical charts are a mine of information but they need to be up to date. Corrections to charts are published by the Hydrographic Office monthly as Notices to Mariners both in print
DERIVATION OF SEA LEVEL ANOMALY USING SATELLITE ALTIMETER. Ami Hassan Md Din, Kamaludin Mohd Omar
 DERIVATION OF SEA LEVEL ANOMALY USING SATELLITE ALTIMETER Ami Hassan Md Din, Kamaludin Mohd Omar Faculty of Geoinformation Science and Engineering Universiti Teknologi Malaysia Skudai, Johor E-mail: amihassan@utm.my
multibeam bathymetric data is often based on the local depth datum, which is the local lowest normal low sea level, see the Figure 1. Multibeam Bathym
 3D DYNAMIC TERRAIN VISUALIZATION OF ISLAND AREAS AI Bo a, *, TANG Xinming b, SHI Shaoyu c, WANG Hongyan d, YANG Fanlin e a Geomatics College, Shandong University of Science and Technology, Qingdao, China
GSA DATA REPOSITORY D. Livsey and A.R. Simms
 GSA DATA REPOSITORY 2013273 D. Livsey and A.R. Simms Supplementary Information The supplementary information is divided into three sections: (1) Tide model and datums, (2) Vertical error calculation, and
The Integration of Land and Marine Spatial Data Set As Part of Indonesian Spatial Data Infrastructure Development
 UNITED NATIONS E/CONF.97/6/IP. 46 ECONOMIC AND SOCIAL COUNCIL Seventeenth United Nations Regional Cartographic Conference for Asia and the Pacific Bangkok, 18-22 September 2006 Item 7 of the provisional
Sea level changes around Thailand
 Final symposium 27 May Bangkok, Thailand Sea level changes around Thailand Marc Naeije Contents GEO2TECDI- SONG: measuring sea level around Thailand Concept of satellite altimetry Concept of tide gauges
Quality assessment of altimeter and tide gauge data for Mean Sea Level and climate studies
 Quality assessment of altimeter and tide gauge data for Mean Sea Level and climate studies G. Valladeau, L. Soudarin, M. Gravelle, G. Wöppelmann, N. Picot Increasing and improving in-situ datasets Page
REPORT ON SEA LEVEL MEASUREMENT FOR GHANA
 20TH SEPTEMBER 2006 REPORT ON SEA LEVEL MEASUREMENT FOR GHANA Emmanuel K. Nkebi 1 1 Survey Department of Ghana, P. O. Box CT903, Accra Tel: 233 21 777 334 Fax : 233 21 765687 E-mail: survey@ghana.com E-mail:eknkebi@yahoo.com
Developing a Seabed Resurvey Strategy: A GIS approach to modelling seabed changes and resurvey risk
 Developing a Seabed Resurvey Strategy: A GIS approach to modelling seabed changes and resurvey risk A. M. Bakare, J. G. Morley, R. R. Simons Department of Geomatic Engineering, University College London,
Height systems. Rudi Gens Alaska Satellite Facility
 Rudi Gens Alaska Satellite Facility Outline Why bother about height systems? Relevant terms Coordinate systems Reference surfaces Geopotential number 2 Why bother about height systems? give a meaning to
BUILDING AN ACCURATE GIS
 BUILDING AN ACCURATE GIS 2006 GIS in the Rockies Denver, Colorado September 13, 2006 William E. Linzey United States Department of Commerce National Oceanic and Atmospheric Administration National Geodetic
Vision: The National Oceanography Centre will, by 2015, be recognised as the world-leading Centre for integrated ocean sciences and technology".
 National Oceanography Centre from coast to deep ocean Waterfront Campus, Southampton Vision: Joseph Proudman Building, Liverpool The National Oceanography Centre will, by 2015, be recognised as the world-leading
Marine environment monitoring : The basic requirements to support Marine Renewable Energies
 Marine environment monitoring : The basic requirements to support Marine Renewable Energies SHOM in brief SHOM is the French Government agency in charge of Hydrography and Oceanography SHOM s vocation
The Global Geodetic Observing System (GGOS) of the International Association of Geodesy, IAG
 of the International Association of Geodesy, IAG") The Global Geodetic Observing System (GGOS) of the International Association of Geodesy, IAG Hans-Peter Plag (1), Markus Rothacher (2), Richard Gross (3), Srinivas Bettadpur (4) (1) Nevada Bureau of Mines
The Global Geodetic Observing System (GGOS) of the International Association of Geodesy, IAG Hans-Peter Plag (1), Markus Rothacher (2), Richard Gross (3), Srinivas Bettadpur (4) (1) Nevada Bureau of Mines
Geodetic applications of GNSS in the Black Sea region
 BALGEOS II - Balkan countries integration into GGOS Second workshop, 27-29 January, 2010 Vienna - AUSTRIA Geodetic applications of GNSS in the Black Sea region Lyubka Pashova CENTRAL LABORATORY OF GEODESY
S-100 the geospatial standard for Hydrographic Data
 International Hydrographic Organisation S-100 the geospatial standard for Hydrographic Data John G Pepper Head of GI Strategy & Policy United Kingdom Hydrographic Office www.iho.org About the IHO The IHO
New satellite mission for improving the Terrestrial Reference Frame: means and impacts
 Fourth Swarm science meeting and geodetic missions workshop ESA, 20-24 March 2017, Banff, Alberta, Canada New satellite mission for improving the Terrestrial Reference Frame: means and impacts Richard
14 th NIOHC, Myanmar National Report MYANMAR NAVAL HYDROGRAPHIC CENTRE (MNHC) NATIONAL REPORT HYDROGRAPHIC DEPARTMENT, ROYAL THAI NAVY-HDRTN
 NATIONAL REPORT HYDROGRAPHIC DEPARTMENT, ROYAL THAI NAVY-HDRTN") 14 th NIOHC, Myanmar National Report MYANMAR NAVAL HYDROGRAPHIC CENTRE (MNHC) NATIONAL REPORT 14 th NORTH INDIAN OCEAN HYDROGRAPHIC COMMISSION CONFERENCE HYDROGRAPHIC DEPARTMENT, ROYAL THAI NAVY-HDRTN
14 th NIOHC, Myanmar National Report MYANMAR NAVAL HYDROGRAPHIC CENTRE (MNHC) NATIONAL REPORT 14 th NORTH INDIAN OCEAN HYDROGRAPHIC COMMISSION CONFERENCE HYDROGRAPHIC DEPARTMENT, ROYAL THAI NAVY-HDRTN
Sea Level Monitoring and the GLOSS Programme
 Sea Level Monitoring and the GLOSS Programme Philip L. Woodworth Permanent Service for Mean Sea Level Proudman Oceanographic Laboratory, UK Port Meteorological Officers Meeting, IMO, 25 July 2003 www.pol.ac.uk
Determining and Monitoring Sea Level in the Caribbean using
 Determining and Monitoring Sea Level in the Caribbean using Satellite Altimetry Dexter DAVIS (UWI,Trinidad & Tobago), Michael SUTHERLAND (Canada), Sandesh JAGGAN & Demi SINGH (UWI, Trinidad & Tobago) Overview
Presented at the FIG Congress 2018, May 6-11, 2018 in Istanbul, Turkey
 Presented at the FIG Congress 2018, May 6-11, 2018 in Istanbul, Turkey Paper ID: 9253 (Peer Review) By: Amalina Izzati Abdul Hamid, Ami Hassan Md Din & Kamaludin Mohd Omar Geomatic Innovation Research
What s Up? Tidal and Vertical Datums. Noel Zinn Hydrometronics LLC July 2011, revised November 2013
 What s Up? Tidal and Vertical Datums Noel Zinn Hydrometronics LLC www.hydrometronics.com July 2011, revised November 2013 1 Motivation The real world is three-dimensional, therefore, coordinates are necessarily
Consideration of a Global Vertical Reference System (GVRS) in the IERS Conventions
 in the IERS Conventions") Consideration of a Global Vertical Reference System (GVRS) in the IERS Conventions Johannes Ihde Federal Agency for Cartography and Geodesy (BKG) Chair of IAG ICP1.2 (2003-2007) Vertical Reference Frames
Consideration of a Global Vertical Reference System (GVRS) in the IERS Conventions Johannes Ihde Federal Agency for Cartography and Geodesy (BKG) Chair of IAG ICP1.2 (2003-2007) Vertical Reference Frames
The GOCE User Toolbox
 The GOCE User Toolbox Jérôme Benveniste - ESA Earth Observation Science and Applications Department Per Knudsen - Danish National Space Center and the GUT TEAM 37th COSPAR Scientific Assembly 2008, Montreal
1 The satellite altimeter measurement
 1 The satellite altimeter measurement In the ideal case, a satellite altimeter measurement is equal to the instantaneous distance between the satellite s geocenter and the ocean surface. However, an altimeter
Effects of Unresolved High-Frequency Signals in Altimeter Records Inferred from Tide Gauge Data
 534 JOURNAL OF ATMOSPHERIC AND OCEANIC TECHNOLOGY VOLUME 19 Effects of Unresolved High-Frequency Signals in Altimeter Records Inferred from Tide Gauge Data RUI M. PONTE Atmospheric and Environmental Research,
Lowest Astronomical Tide in the North Sea derived from a vertically referenced shallow water model, and an assessment of its suggested sense of safety
 Lowest Astronomical Tide in the North Sea derived from a vertically referenced shallow water model, and an assessment of its suggested sense of safety Cornelis Slobbe, The Netherlands, Delft University
Construction of Tidal Datums Based on Ellipsoid Using Spatial Interpolation
 Construction of Tidal Datums Based on Ellipsoid Using Spatial Interpolation Wonjong Lee and Yunsoo Choi and Kijong Han and Heeyoon Park, Republic of Korea Key words: Spatial Interpolation, Tidal bench
The GOCE Geoid in Support to Sea Level Analysis
 The GOCE Geoid in Support to Sea Level Analysis The geoid is a very useful quantity for oceanographers Thomas Gruber Astronomical & Physical Geodesy (IAPG) Technische Universität München 1. Characteristics
The IHPT Marine Spatial Data infrastructure and its contribution to the INSPIRE Directive
 The IHPT Marine Spatial Data infrastructure and its contribution to the INSPIRE Directive INSPIRE - GWF 2015 - Coastal & Marine session Lisbon Congress Center, Portugal - Thursday, 28 May 2015 Summary
Preliminary Data Release for the Humboldt Bay Sea Level Rise Vulnerability Assessment: Humboldt Bay Sea Level Rise Inundation Mapping
 Preliminary Data Release for the Humboldt Bay Sea Level Rise Vulnerability Assessment: Humboldt Bay Sea Level Rise Inundation Mapping Prepared by: Jeff Anderson, Northern Hydrology & Engineering (jeff@northernhydrology.com)
GPS KINEMATIC APPLICATIONS & HYDROGRAPHY
 GPS KINEMATIC APPLICATIONS & HYDROGRAPHY ROCK SANTERRE, Ph.D., QLS, P.Eng. DÉPARTEMENT DES SCIENCES GÉOMATIQUES UNIVERSITÉ LAVAL HYDROGRAPHY = MARINE GEOMATICS 2 Design Planning Acquisition Processing
EMODnet High Resolution Seabed Mapping - further developing a high resolution digital bathymetry for European seas
 EMODnet High Resolution Seabed Mapping - further developing a high resolution digital bathymetry for European seas IMDIS 2018 Conference, 7 November 2018, Barcelona - Spain Thierry Schmitt Dick M.A. Schaap
Global & National Geodesy, GNSS Surveying & CORS Infrastructure
 Global & National Geodesy, GNSS Surveying & CORS Infrastructure Chris Rizos School of Surveying & Spatial Information Systems University of New South Wales, Sydney, Australia President-elect, International
Texas Coastal Ocean Observation Network. Richard Edwing Director, Center for Operational Oceanographic Products and Services November 2016
 Texas Coastal Ocean Observation Network Richard Edwing Director, Center for Operational Oceanographic Products and Services November 2016 What is CO-OPS? Meaningful oceanographic data for the Nation CO-OPS
COUNTRY REPORT ON CARTOGRAPHIC ACTIVITIES IN SINGAPORE ( ) Submitted by Singapore **
 Submitted by Singapore **") UNITED NATIONS E/CONF.97/5/CRP. 9 ECONOMIC AND SOCIAL COUNCIL Seventeenth United Nations Regional Cartographic Conference for Asia and the Pacific Bangkok, 18-22 September 2006 Item 6 (b) of the provisional
UNITED NATIONS E/CONF.97/5/CRP. 9 ECONOMIC AND SOCIAL COUNCIL Seventeenth United Nations Regional Cartographic Conference for Asia and the Pacific Bangkok, 18-22 September 2006 Item 6 (b) of the provisional
EMODnet High Resolution Seabed Mapping - further developing and providing a high resolution digital bathymetry for European seas
 EMODnet High Resolution Seabed Mapping - further developing and providing a high resolution digital bathymetry for European seas EGU Fall 2017 meeting New Orleans USA, December 2017 Schaap Dick MARIS,
Evaluation of height network in Latvia
 Evaluation of height network in Latvia Kaminskis J. (,), Balodis J. (), Janpaule I. (,), Normand M. (,), Rubans A. (), Silabriedis G. (,), Zvirgzds J. (,) AFFILIATION: () Riga Technical University; ()
HYDROGRAPHIC SECTION QATAR NATIONAL REPORT TO THE 6 TH ROPME SEA AREA HYDROGRAPHIC COMMISSION MEETING
 HYDROGRAPHIC SECTION QATAR NATIONAL REPORT TO THE 6 TH ROPME SEA AREA HYDROGRAPHIC COMMISSION MEETING ABU DHABI, UNITED ARAB EMIRATES 9 11 FEBRUARY 2015 Page left intentionally blank 1. Hydrographic Section
GEOID UNDULATIONS OF SUDAN USING ORTHOMETRIC HEIGHTS COMPARED WITH THE EGM96 ANG EGM2008
 GEOID UNDULATIONS OF SUDAN USING ORTHOMETRIC HEIGHTS COMPARED Dr. Abdelrahim Elgizouli Mohamed Ahmed* WITH THE EGM96 ANG EGM2008 Abstract: Positioning by satellite system determine the normal height above
COMBINING ALTIMETRY AND HYDROGRAPHY FOR GEODESY
 COMBINING ALTIMETRY AND HYDROGRAPHY FOR GEODESY Helen M. Snaith, Peter G. Challenor and S Steven G. Alderson James Rennell Division for Ocean Circulation and Climate, Southampton Oceanography Centre, European
The Integration of Bathymetry, Topography and Shoreline and the Vertical Datum Transformations behind It
 VOL. 3 No. 3 (NEW SERIES) NOVEMBER 2002 _ The Integration of Bathymetry, Topography and Shoreline and the Vertical Datum Transformations behind It By Dr. Bruce Parker, National Ocean Service, NOAA, USA
CHAPTER 27 AN EVALUATION OF TWO WAVE FORECAST MODELS FOR THE SOUTH AFRICAN REGION. by M. Rossouw 1, D. Phelp 1
 CHAPTER 27 AN EVALUATION OF TWO WAVE FORECAST MODELS FOR THE SOUTH AFRICAN REGION by M. Rossouw 1, D. Phelp 1 ABSTRACT The forecasting of wave conditions in the oceans off Southern Africa is important
SSH retrieval in the ice covered Arctic Ocean: from waveform classification to regional sea level maps
 ESA Climate Change Initiative SSH retrieval in the ice covered Arctic Ocean: from waveform classification to regional sea level maps CLS LEGOS PML Arctic SIE status 2 nd lowest on record with 4.14 10 6
NOAA Inundation Dashboard
 NOAA Inundation Dashboard Audra Luscher & Paul Fanelli NOS Center for Operational Oceanographic Products & Services (CO-OPS) Hampton Roads Sea Level Rise/Flooding Adaptation Forum July 29, 2016 http://tidesandcurrents.noaa.gov/inundationdb/newyork.html
UNDERSTANDING STORM TIDES
 UNDERSTANDING STORM TIDES Run from the water, hide from the wind.. CATEGORY CATEGORY CATEGORY CATEGORY CATEGORY 1 2 3 4 5 WIND 74-95 mph 64-82 knots 96-110 mph 83-95 knots 111-130 mph 96-113 knots 131-155
18 th NSHC Tidal Working Group meeting, Brest 7-8 February 2012
 18 th NSHC Tidal Working Group meeting, Brest 7-8 February 2012 Contents: MINUTES OF THE MEETING... 2 ANNEX A: AGENDA 18TH TWG MEETING... 11 ANNEX B: TERMS OF REFERENCE FOR THE NORTH SEA HYDROGRAPHIC...
1/28/16. EGM101 Skills Toolbox. Oblate spheroid. The shape of the earth Co-ordinate systems Map projections. Geoid
 EGM101 Skills Toolbox Oblate spheroid The shape of the earth Co-ordinate systems Map projections The geoid is the shape that the surface of the oceans would take under the influence of Earth's gravitation
R E P U B L I C O F C Y P R U S NATIONAL REPORT OF CYPRUS TO THE MEDITERRANEAN AND BLACK SEAS HYDROGRAPHIC COMMISSION (MBSHC)
") R E P U B L I C O F C Y P R U S NATIONAL REPORT OF CYPRUS TO THE MEDITERRANEAN AND BLACK SEAS HYDROGRAPHIC COMMISSION (MBSHC) ISTANBUL MEETING 25-27 SEPTEMBER 2013 NATIONAL REPORT OF CYPRUS TO THE MEDITERRANEAN
R E P U B L I C O F C Y P R U S NATIONAL REPORT OF CYPRUS TO THE MEDITERRANEAN AND BLACK SEAS HYDROGRAPHIC COMMISSION (MBSHC) ISTANBUL MEETING 25-27 SEPTEMBER 2013 NATIONAL REPORT OF CYPRUS TO THE MEDITERRANEAN
Dr Marc Lucas CLS Toulouse, France.
 Dr Marc Lucas CLS Toulouse, France. Oceanology International 15th March 2012 Slide 1 Ocean depiction In the past: Information mainly comes from in situ measurements (ADCP) Now: The role of satellite data
VALIDATION OF ALTIMETER SIGNIFICANT WAVE HEIGHT USING WAVE GAUGE MEASUREMENT IN PACITAN COASTAL WATERS, EAST JAVA, INDONESIA
 VALIDATION OF ALTIMETER SIGNIFICANT WAVE HEIGHT USING WAVE GAUGE MEASUREMENT IN PACITAN COASTAL WATERS, EAST JAVA, INDONESIA *Yati Muliati, **Andojo Wurjanto, *** Widodo S. Pranowo * Institut Teknologi
Hindcast Arabian Gulf
 Hindcast Arabian Gulf Image of isobars of atmospheric pressure and hindcast wind- and wave field over the Arabian Gulf during a storm in January 1993. Detailed wave studies are supported by nesting of
THAILAND NATIONAL REPORT
 NIOHC18 TH National Report THAILAND NATIONAL REPORT 18 th NORTH INDIAN OCEAN HYDROGRAPHIC COMMISSION (NIOHC) CONFERENCE Goa, India 9 th 12 th April 2018-1 - CONTENTS 1. Hydrographic Office / Service 3
CENTIMETRE LEVEL OF ACCURACY OF QUASIGEOID MODEL IN POLAND
 CENTIMETRE LEVEL OF ACCURACY OF QUASIGEOID MODEL IN POLAND Jan Krynski Institute of Geodesy and Cartography, Poland krynski@igik.edu.pl Adam Lyszkowicz University of Warmia and Mazury in Olsztyn, Poland
NATIONAL REPORT OF ESTONIA
 BSHC 21 th Conference 27-29 Sept 2016 Klaipeda, Lithuania NATIONAL REPORT OF ESTONIA Executive summary This report summarizes the activities of the Estonian Maritime Administration in the field of hydrography
Satellite ALTimetry. SALT applications and use of data base for SE-Asia region. SEAMERGES kick-off meeting, Bangkok, Thailand.
 Satellite ALTimetry SALT applications and use of data base for SE-Asia region SEAMERGES kick-off meeting, Bangkok, Thailand Marc Naeije 4 March 2004 1 Faculty of Aerospace Engineering DEOS/AS SEAMERGES
Flood Mapping Michael Durnin October 9 th
 Michael Durnin October 9 th 2014 Leading Surveyors Company Profile Est. 1983 Celebrating 30 Years in Business Six Offices in UK & Ireland Over 30 Specialised Survey Services ISO 9001:2008 Registered Over
INTEGRATION OF HYDROGRAPHIC AND TOPOGRAPHIC DATA FOR COASTAL GIS SOLUTIONS
 Integration of data for coastal GIS INTEGRATION OF HYDROGRAPHIC AND TOPOGRAPHIC DATA FOR COASTAL GIS SOLUTIONS Igor KARNIČNIK (Geodetic Institute of Slovenia, Jamova 2, Ljubljana, Slovenia; igor.karnicnik@geod-is.si)
Appendix G.19 Hatch Report Pacific NorthWest LNG Lelu Island LNG Maintenance Dredging at the Materials Offloading Facility
 Appendix G.19 Hatch Report Pacific NorthWest LNG Lelu Island LNG Maintenance Dredging at the Materials Offloading Facility Project Memo H345670 To: Capt. David Kyle From: O. Sayao/L. Absalonsen December
Thoughts on Sun-Synchronous* Altimetry
 Thoughts on Sun-Synchronous* Altimetry R. D. Ray NASA Goddard Space Flight Center 14 March 2007 * Yes, a sun-synchronous wide swath is still sun-synch! Whatʼs so bad about sun-synchronous altimetry? For
ON THE ACCURACY OF CURRENT MEAN SEA SURFACE MODELS FOR THE USE WITH GOCE DATA
 ON THE ACCURACY OF CURRENT MEAN SEA SURFACE MODELS FOR THE USE WITH GOCE DATA Ole B. Andersen 1, M-.H., Rio 2 (1) DTU Space, Juliane Maries Vej 30, Copenhagen, Denmark (2) CLS, Ramon St Agne, France ABSTRACT
A new geoid model for Bhutan. Machiel Bos Rui Fernandes
 A new geoid model for Bhutan Machiel Bos (machiel@segal.ubi.pt) Rui Fernandes (rui@segal.ubi.pt) June 2015 1 Definition of heights June 2015 2 Purpose of a geoid model Orthometric heights are the official
Space research. Horizon Work Programme. "Countdown to Horizon 2020 Space" Earth Observation topics. Brussels, 12 December 2013
 Space research Horizon 2020 - Work Programme "Countdown to Horizon 2020 Space" Earth Observation topics Brussels, 12 December 2013 richard.gilmore@ec.europa.eu Table of contents FP/Copernicus - general
Extremes and even Changing Tides. Philip Woodworth, POL. with thanks to Ivan Haigh (Southampton) and Melisa Menendez (Santander)
 and Melisa Menendez (Santander)") Changing Sea Level Means and Extremes and even Changing Tides Philip Woodworth, POL with thanks to Ivan Haigh (Southampton) and Melisa Menendez (Santander) Contents UK Mean Sea Level change revisited Components
Changing Sea Level Means and Extremes and even Changing Tides Philip Woodworth, POL with thanks to Ivan Haigh (Southampton) and Melisa Menendez (Santander) Contents UK Mean Sea Level change revisited Components