Research Update on Solar Polar Fields/Coronal Hole IMF and Large Earthquakes, and a Proposed Method for Quantifying Coronal Hole Geo effectiveness
|
|
|
- Lesley Owens
- 6 years ago
- Views:
Transcription
1 1 Research Update on Solar Polar Fields/Coronal Hole IMF and Large Earthquakes, and a Proposed Method for Quantifying Coronal Hole Geo effectiveness Ben Davidson Space Weather News, LLC & The Mobile Observatory Project Keywords: earthquake, sun, solar, interplanetary magnetic fields, coronal holes, solar polar fields Key Points The previously observed and statistically modelled patterns of solar polar fields (SPF) extremes and reversals triggering large earthquakes continued in 2014 and Only one of the ten largest earthquakes failed to demonstrate any correlation with the activity of the sun s interplanetary magnetic fields. Coronal holes offer a promising candidate for future research into the mechanism by which the sun s interplanetary magnetic fields may trigger earthquakes. Introduction In October 2015, a study was published comparing the solar polar fields (SPF) data to the earthquake archives from the United States Geological Survey. (Davidson 2015[1]). The team found that a statistically significant relationship exists between both peaks in magnetism and
2 2 magnetic reversals of the SPF, and the largest (M8+) earthquakes during the data period of the SPF available at that time ( ). The impetus to conduct that study was daily solar and seismic observations made for a solar/earth news program produced by Space Weather News (SWN). After three years of reporting on daily solar activity, extreme earth weather, and seismic activity, a pattern had become apparent to SWN, and to many of the viewers, whereby periods of increased earthquake activity (normally 2 4 days) seemed to occur during periods when coronal holes were crossing the center heliographic longitudes, and ended before the solar wind streams from those coronal holes arrived at earth. Currently, no quantitative coronal hole data exists, only qualitative lists of coronal hole numbers, dates, and polarity. Current methods do not attempt to measure the size and position of the coronal hole; larger, transequatorial coronal holes are more likely to be geoeffective. The only quantitative measure of coronal hole magnetic fields is the SPF data from Stanford s Wilcox Solar Observatory (WSO), which is restricted to the IMF near the 55th latitude of the solar poles, measured at the heliographic longitude directly facing earth, and is given in 10 day averages. We propose, and will conduct the implementation of, a method for quantifying the earthquake geo effectiveness of a coronal hole based on its size and position. In a separate study, a shorter but significant peak in magnetism over a six day period, leading up to a M8.3 earthquake in Chile on September 16, 2015, was inferred from solar wind speed (SWS) data provided by the National Solar Observatory (NSO). (Davidson 2015 [2]). The SWS fluctuation took place within an earth facing coronal hole opening, and was too short to be captured in SPF data that is averaged over ten days. While the mechanism of action that triggers these earthquakes is not exactly known, we can continue to evaluate the initial model in the time since the end of the analysis in Davidson 2015 [1], and we can further examine the solar phenomena associated with the IMF of coronal holes present on days when significant earthquakes occur. SPF, coronal holes, SWS, and large earthquakes during the operation of the Solar Dynamics Observatory (SDO) The SDO launched in February 2010 and began returning public data a few months later. The satellite revolutionized the way we are able to look at the sun, and has allowed for unprecedented detail in locating and tracking coronal holes. The first large earthquake to occur during the tenure of the SDO was in Japan in March Each of the following images of the sun is from NASA s SDO/AIA in 211 Angstroms, accessed via helioviewer.org, and verified via NASA/SDO archives.

![This earthquake occurred at the peak of positive magnetism of the southern SPF. (Davidson 2015 [1]).](/docs-images/71/66212690/images/3-1.jpg "The southern coronal hole seen here, which contained the southern SPF, extends north across the equator in the earth facing position at the time of the earthquake.")
3 3 March 11, 2011 M9 Earthquake struck Honshu, Japan. April 11, 2012 Two M8 Earthquakes struck Sumatra on the Same Day The largest earthquake of 2011 was the M9 earthquake and tsunami disaster in Japan on March 11th. This earthquake occurred at the peak of positive magnetism of the southern SPF. (Davidson 2015 [1]). The southern coronal hole seen here, which contained the southern SPF, extends north across the equator in the earth facing position at the time of the earthquake. It is unlikely that the peaking strength measured in the SPF stopped at the 55th latitude. It is more likely that the IMF of this coronal hole were strong at more northern latitudes as well, including those most interacting with earth. We will analyze the coronal holes for other large earthquakes up to the present time. The fish shaped coronal hole here is all northern fields, while the less obvious dark area on the equator to the left of it is actually an extension of the southern polar coronal hole. It is rare to see two transequatorial coronal holes of opposite polarity fields in such close proximity. The two largest earthquakes of 2012 both struck on April 11th, M8.6 and M8.2, near Sumatra. These earthquakes occurred soon after a peak in positive southern SPF magnetism (Davidson 2015 [1]) and it represented the peak positive magnetism of the combined SPF over a 10 year period (WSO 2016). February 6, 2013 M8 Earthquake struck Solomon Islands


4 4 A M8 earthquake struck the Solomon Islands area on February 6, Like the Sumatra earthquakes ten months earlier, and the Japan earthquake in 2011, this one also occurred during the peak in positive magnetism of the southern SPF, and this one also occurred during a positive peak of the combined SPF. The combined SPF peak was the strongest positive magnetism since April 2012, and has not been matched as of March of The coronal hole on the south here contained the SPF and associated IMF that was peaking in strength. May 24, 2013 M8.3 Earthquake struck Eastern Russia The largest earthquake of 2013 occurred on May 24, 2013, when a M8.3 earthquake struck the Kamchatka peninsula of Russia. It occurred during the lone southern magnetic reversal of this ~11 year solar cycle. The southern SPF was positive on May 17th as it had been all previous solar cycle, and it was negative on May 27th. (WSO 2016). The coronal hole on the north is easily visible in geoeffective position, but there is also an extension of the southern polar coronal hole seen as the dark stair shaped area. Although the northern SPF were unremarkable in the 10 day averages from the WSO, the SWS product allows the method from Davidson 2015 [2] to be used to analyse the coronal holes present on the earth facing disk (left half of the colorful chart). Both northern and southern coronal holes presented fast SWS indicative of strong IMF. Although the northern coronal hole area is mostly green (moderately powerful, like the SPF data would indicate) there is evidence of a small section of powerful northern fields associated with the thin red region stretched horizontally within it. April 2, 2014 M8.2 Earthquake struck Chile
![5 On April 2, 2014 a M8.2 earthquake struck Chile. It occurred during multiple northern SPF reversals. However, none of the reversals exactly fit the restrictive factors in Davidson 2015 [1].](/docs-images/71/66212690/images/5-1.jpg "Here we also see both polar coronal holes extending to lower latitudes in an earth facing position, indicating that both northern and southern IMF were tipped to face earth.")
![Most importantly, this earthquake occurred as the north and south SPF curves stopped interacting at polar minimum ( definition in Davidson 2015 [1]) and broke in their separate directions](/docs-images/71/66212690/images/5-2.jpg "(polarities) for the coming ~11 years. You can see this below with just the N and S SPF curves as the final place where red and blue cross paths before beginning this next polar fields cycle.")
5 5 On April 2, 2014 a M8.2 earthquake struck Chile. It occurred during multiple northern SPF reversals. However, none of the reversals exactly fit the restrictive factors in Davidson 2015 [1]. Here we also see both polar coronal holes extending to lower latitudes in an earth facing position, indicating that both northern and southern IMF were tipped to face earth. Most importantly, this earthquake occurred as the north and south SPF curves stopped interacting at polar minimum ( definition in Davidson 2015 [1]) and broke in their separate directions (polarities) for the coming ~11 years. You can see this below with just the N and S SPF curves as the final place where red and blue cross paths before beginning this next polar fields cycle. Either this occurrence is coincidental or the restrictions from Davidson 2015 [1] on when polar minimum ends may need to be revised. In the third image we see the coronal hole plot from NSO/GONG on April 2nd, Red denotes negative magnetism of a coronal hole and green denotes positive magnetism. We can see that the IMF was present in an earth facing longitude from north to south heliographic poles, and that it was entirely negative.

6 6 June 23, 2014 a M7.9 Earthquake struck Alaska On June 23, 2014 a M7.9 earthquake struck Alaska. The southern coronal hole is easily visible; the northern coronal hole is much less noticeable but it is dipping to low latitudes as well. Both coronal holes contain IMF that was potentially geoeffective. The long term SPF data reveals only a minor peak in northern field magnetism (negative) at this time, right before a reversal of polarity in the northern SPF. (WSO 2016). However, this time period represented a new level of negative magnetism for our star, one we hadn t seen in more than five years. Below we see the end of polar minimum and beginning of the separation of the magnetism of SPF poles. The Chilean earthquake in April occurred at the left side of the chart, as the SPF curves had their final interactions of the cycle (see Appendix A for longer term visualization). The chart covers the four month window of SPF data surrounding the June 23rd earthquake in Alaska. June 23rd is found at the trough of the combined SPF magnetism the dip in the middle represents the strongest combined negative magnetism of the SPF (yellow curve) since October 30th, 2010 (WSO 2016). Here we see the SPF data from April through August Blue is the northern SPF, Red is the southern SPF, and yellow is the combined (average) SPF magnetism of the sun. The black line is the day of the earthquake in Alaska.
![7 In addition to observing a negative peak of the combined SPF magnetism, this earthquake can be analyzed using similar methods to those used in Davidson 2015 [2], where shorter term](/docs-images/71/66212690/images/7-0.jpg "IMF strength fluctuations may be inferred via SWS analysis.")
.")
.")
7 7 In addition to observing a negative peak of the combined SPF magnetism, this earthquake can be analyzed using similar methods to those used in Davidson 2015 [2], where shorter term IMF strength fluctuations may be inferred via SWS analysis. SWS June 21 23, 2014: June 21, 2014 (AM/PM) June 22, 2014/June 23, 2014 (AM) June 23, 2014 (Midday/PM) Earthquake Day There is a noticeable short term surge in northern coronal hole SWS which can be seen as the appearance and expansion of a red area in the earth facing position on the northern hemisphere (top left side of the SWS charts above). The short term surge in northern field magnetism, up to earthquake day, appears to present the strongest magnetism of the aforementioned long term peak experienced by the SPF. Also compare the southern field SWS in the earth facing position with that on the far side of the sun (right side). The southern SPF exhibited relatively strong magnetism around the sun s southern polar area but red patches extend up towards the equator in the earth facing position, which means they are more likely to be geoeffective.
8 8 SPF during the eight great earthquakes of 2015 Below we see the 2015 SPF data. Six of the eight M7.5+ earthquakes in 2015 are close enough to peaks in SPF magnetism to qualify under Davidson 2015 [1]. Here we see the SPF data from Blue curve is the northern SPF, red curve is the southern SPF, and yellow is the combined SPF magnetism of the sun. Vertical Lines: Blue M7.5 Papua New Guinea, March 29, positive northern peak; Orange M7.5 Papua New Guinea, May 5, positive northern peak; Red M7.8 Japan, May 30, negative southern peak; Black M7.5 Afghanistan, October 26, positive northern peak; Green (two earthquakes) M7.6 Peru, M7.6 Brazil, November 24, positive northern peak. On March 29, 2015 a M7.5 earthquake struck Papua New Guinea while the northern SPF peaked in magnetism. (WSO 2016). On May 5, 2015 a M7.5 earthquake struck Papua New Guinea while the northern SPF peaked in magnetism. (WSO 2016). On May 30, 2015 a M7.8 struck Japan while the southern SPF peaked in magnetism. (WSO 2016). On October 26, 2015 a M7.5 earthquake struck afghanistan while the northern fields peaked in magnetism. (WSO 2016). On November 24, 2015 two M7.6 earthquakes struck Brazil and Peru within minutes of each other while the northern fields peaked in magnetism. (WSO 2016). Those six earthquakes are excellent matches for the model in Davidson 2015 [1], but two earthquakes in 2015 were of great magnitude and did not fit that model a M7.8 in Nepal on April 25, 2015, and a M8.3 earthquake in Chile on September 16, They can be seen as the black lines on same SPF figure below.
 this earthquake fails to match the models using solar magnetic fields.")
9 9 The Nepalese earthquake does not match the model correlating SPF data to large earthquakes, nor is there any inferrable short term peak in magnetism in the SWS data; other than a coronal hole facing earth on the south (seen as the negative opening stretching north of the equator in this coronal hole plot from NSO GONG) this earthquake fails to match the models using solar magnetic fields. The Chilean earthquake was the focus of Davidson 2015 [2], and presented a SWS spike implying a peak in magnetism of the SPF and associated coronal hole IMF currently facing earth. This SWS event took only six days, and cannot be captured in 10 day averaged SPF data.
 shows the coronal holes on that day; the southern polar coronal hole is visible, along with multiple dark patches to the north in the earth facing position.")
![The southern SPF peaked in magnetism the week leading up to the earthquake (Davidson 2015 [1], WSO 2015), and those are the IMF most exposed to earth at the time of the earthquake, via that southern](/docs-images/71/66212690/images/10-1.jpg "coronal hole. On December 26, 2004 a M9.1 earthquake struck Sumatra, producing a tsunami that killed more than 200,000 people.")
10 10 Examples from before the operational life of the SDO Coronal Holes on the Sun, February 27, 2010 (left) and December 26, 2004 (right) On February 27, 2010 a M8.8 earthquake struck Chile. The left image (SOHO EIT) shows the coronal holes on that day; the southern polar coronal hole is visible, along with multiple dark patches to the north in the earth facing position. The southern SPF peaked in magnetism the week leading up to the earthquake (Davidson 2015 [1], WSO 2015), and those are the IMF most exposed to earth at the time of the earthquake, via that southern coronal hole. On December 26, 2004 a M9.1 earthquake struck Sumatra, producing a tsunami that killed more than 200,000 people. The right image (GOES 12 SXI) has been enhanced with white arrows to show the dark transequatorial coronal hole that might otherwise evade notice. The SPF were presenting earth with a combined SPF magnetic reversal, where the SPF rapidly switched from negative to positive, and where the northern fields had peaked in negative magnetism immediately before hand. (Davidson 2015 [1], WSO 2015). While more recent GOES satellites have offered greatly enhanced coronal hole visibility, our ability to analyze coronal holes was far less robust just a few years ago. Our ability to fully understand these coronal hole structures was greatly enhanced with the implementation of the SDO. Future analysis of SWS, coronal holes. Unfortunately, the SWS product from NSO GONG was discontinued on January 20, 2016 and the method put forth in Davidson 2015 [2] will not be possible in the immediate future. A backup product, the Earth Magnetic Connectivity product from GONG, which derived coronal holes
11 11 and solar wind speed, had been used periodically before it was discontinued in July Solar wind telemetry from STEREO A may act as a stand in for a few years until it orbits close enough to earth to be functionally indistinguishable from ACE, DSCOVR, GOES R and other satellites set to be taking solar wind readings at that time, but it will only provide a narrow reading and is unlikely to provide useful data on solar wind at other heliospheric latitudes. STEREO A may be useful for gauging the strength of equatorial coronal holes a few days in advance. In 2016, coronal hole data will be greatly enhanced when size and position relative to the earth facing position of the sun are tracked and catalogued, allowing for the first quantitative analysis of earth facing coronal holes as an earthquake trigger to begin. The product will use SDO images at first, and may be complemented or supplemented as subsequent satellites become operational. Final Thoughts While further research and analysis is needed to confirm any results from this or previous papers cited here, 2014 and 2015 presented encouraging data for continuing to monitor solar activity and earthquake activity, and investigate the possible connections between the two spheres resembled many years from the 1980s in terms of its mediocre SPF/earthquake correlation and the Nepal earthquake of 2015 showed no correlation at all, but 2015 overall was a standout among the 40 year observation period. Other than witnessing the end of the SWS products, the data available for future analysis is robust and will soon be enhanced with quantitative coronal hole data. See Following Pages For Acknowledgements, Citations, Appendices (Images by Ben Davidson, open usage rights granted, with credit.) Acknowledgements.
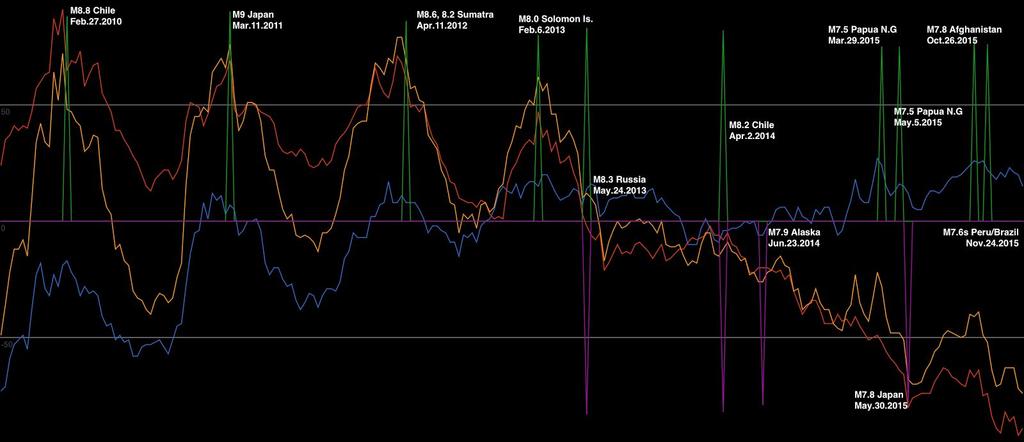
12 12 This note includes images provided courtesy of NASA s Solar Dynamics Observatory, and the AIA, HMI, and EVE teams, as well as images from NSO/GONG, in association with the NSF and AURA. Helioviewer.org was used to access the SDO images. The author wishes to express continued appreciation for Dr.s Holloman and U yen s contributions to the foundation of this field of study, and to the journal New Concepts in Global Tectonics (ncgt.org) for publishing our initial works in this field. Citations. [1] Davidson, U yen, Holloman (2015) Relationship Between M8+ Earthquake Occurrences and the Solar Polar Magnetic Fields. New Concepts in Global Tectonics Journal, V.3, No. 3, September 2015, pp [2] Davidson, B. (2015) A Surge and Short Term Peak in Northern Solar Polar Field Magnetism Prior to the M8.3 Earthquake Near Chile on September 16, New Concepts in Global Tectonics Journal, V.3, No. 3, September 2015, pp Both [1] and [2] can be read by downloading the September 2015 issue here: [3] 10 day Average Solar Polar Fields Data from Stanford s Wilcox Solar Observatory. See Next Page For Annotated Graphic Appendix A, SPF and Large Earthquakes From 2010 through (Images by Ben Davidson, open usage rights granted, with credit.) The blue, red, and yellow curves are still the north, south, and combined SPF curves. The green and purple spikes are days of major earthquakes. Purple is for negative SPF events, green is for positive events, and reversals have both green and purple spikes.
13 13
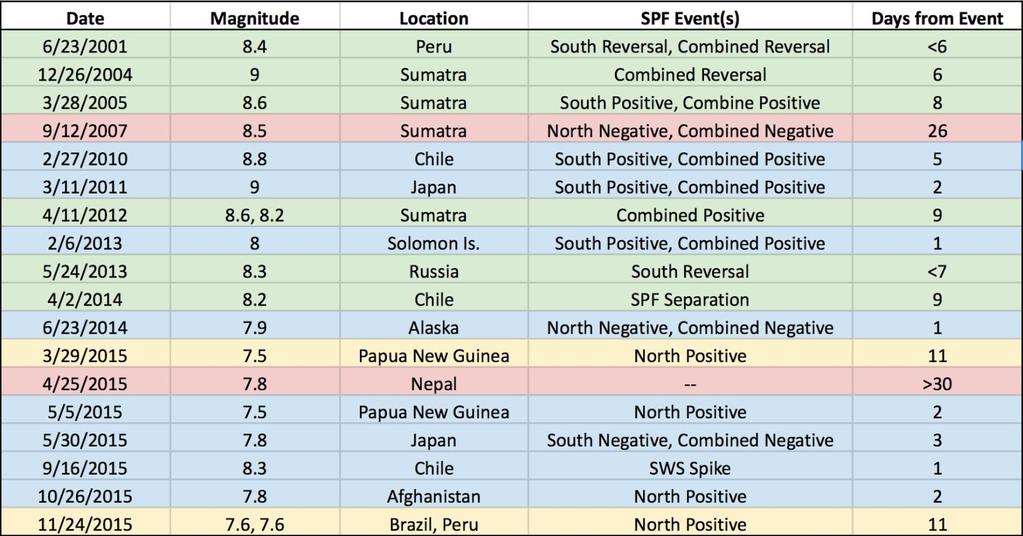
14 14 Appendix B (Images by Ben Davidson, open usage rights granted, with credit.) Date Magnitude Location SPF Event(s) Days from Event 6/23/ Peru South Reversal, Combined Reversal <6 12/26/ Sumatra Combined Reversal 6 3/28/ Sumatra South Positive, Combine Positive 8 9/12/ Sumatra North Negative, Combined Negative 26 2/27/ Chile South Positive, Combined Positive 5 3/11/ Japan South Positive, Combined Positive 2 4/11/ , 8.2 Sumatra Combined Positive 9 2/6/ Solomon Is. South Positive, Combined Positive 1 5/24/ Russia South Reversal <7 4/2/ Chile >30 6/23/ Alaska North Negative, Combined Negative 1 3/29/ Papua New Guinea North Positive 11 4/25/ Nepal >30 5/5/ Papua New Guinea North Positive 2 5/30/ Japan South Negative, Combined Negative 3 9/16/ Chile >30 10/26/ Afghanistan North Positive 2 11/24/ , 7.6 Brazil, Peru North Positive 11 This chart shows each of the earthquakes mentioned in this publication, plus several of the largest earthquakes back to The SPF events are listed, along with the number of days between the earthquake and the SPF event. The SPF events are restricted to those from Davidson 2015 [1]. Given that periods of peak magnetism occur once per year per pole, and SPF reversals occur only briefly every ~11 years, the close proximity of so many of these earthquakes to SPF events should not be ignored. Blue rows are 5 days or less, green is <10, yellow is 10 15, and red is 15+. Of the three events without any significant SPF events, the Chilean earthquake of 2014 presented with an SPF separation apart from the previously defined end of polar minimum. (Davidson 2015 [1]). The 2015 Chilean earthquake was an excellent SWS model match from Davidson 2015 [2]. The Nepal earthquake has no apparent correlation with any of the presented solar magnetic field models. Below, the same chart has been updated to include the SWS spike for the 2015 Chile event, and the SPF separation that ends polar minimum for the 2014 Chile Event.
15 15
Geomagnetic Disturbance Report Reeve Observatory
 Event type: Geomagnetic disturbances due to recurrent coronal hole high-speed stream Background: This background section defines the events covered. A coronal hole is a large dark region of less dense
The Dancing Lights Program
 The Sun Teacher Background: The Dancing Lights Program Margaux Krahe Many people think the Sun is just a fiery yellow ball. The Sun is not actually burning because fire requires oxygen. Really, the Sun
Teacher Background: The Dancing Lights Program
 Teacher Background: The Dancing Lights Program The Sun Many people think the Sun is just a fiery yellow ball. The Sun isn t actually burning because fire requires oxygen. Really, the Sun a giant ball of
The information you need will be on the internet. Please label your data with the link you used, in case we need to look at the data again.
 Solar Activity in Many Wavelengths In this lab you will be finding the sidereal rotation period of the Sun from observations of sunspots, you will compare the lifetimes of larger and smaller sunspots,
Geomagnetic Disturbance Report Reeve Observatory
 Event type: Various geomagnetic disturbances including coronal hole high-speed stream, coronal mass ejection, sudden impulse and reverse shock effects Background: This background section defines the various
INTERPLANETARY ASPECTS OF SPACE WEATHER
 INTERPLANETARY ASPECTS OF SPACE WEATHER Richard G. Marsden Research & Scientific Support Dept. of ESA, ESTEC, P.O. Box 299, 2200 AG Noordwijk, NL, Email: Richard.Marsden@esa.int ABSTRACT/RESUME Interplanetary
Lecture 17 The Sun October 31, 2018
 Lecture 17 The Sun October 31, 2018 1 2 Exam 2 Information Bring a #2 pencil! Bring a calculator. No cell phones or tablets allowed! Contents: Free response problems (2 questions, 10 points) True/False
Verification Of January HDD Forecasts
 Verification Of January HDD Forecasts W2020 / Average HDD stands for Heating Degree Day. A Heating Degree Day is zero if the average temperature is 65 degrees. An HDD of -30 would mean an average temperature
Pacific Decadal Oscillation ( PDO ):
:") Time again for my annual Winter Weather Outlook. Here's just a small part of the items I considered this year and how I think they will play out with our winter of 2015-2016. El Nino / La Nina: When looking
Time again for my annual Winter Weather Outlook. Here's just a small part of the items I considered this year and how I think they will play out with our winter of 2015-2016. El Nino / La Nina: When looking
Interplanetary Field During the Current Solar Minimum
 Interplanetary Field During the Current Solar Minimum C.T. Russell 1, L.K. Jian 1, J. G. Luhmann 2, T.L. Zhang 3 1 UCLA, 2 UCB, 3 SRI, OEAW SOHO 23 Understanding a Peculiar Solar Minimum Asticou Inn, Northeast
Using This Flip Chart
 Using This Flip Chart Sunspots are the first indicators that a storm from the Sun is a possibility. However, not all sunspots cause problems for Earth. By following the steps in this flip chart you will
ASTRONOMY Merit Badge Requirements
 ASTRONOMY Merit Badge Requirements 1) Do the following: A) Sketch the face of the moon, indicating on it the locations of at least five seas and five craters. B) Within a single week, sketch the position
North-South Offset of Heliospheric Current Sheet and its Causes
 North-South Offset of Heliospheric Current Sheet and its Causes X. P. Zhao, J. T. Hoeksema, P. H. Scherrer W. W. Hansen Experimental Physics Laboratory, Stanford University Abstract Based on observations
Which Earth latitude receives the greatest intensity of insolation when Earth is at the position shown in the diagram? A) 0 B) 23 N C) 55 N D) 90 N
 0 B) 23 N C) 55 N D) 90 N") 1. In which list are the forms of electromagnetic energy arranged in order from longest to shortest wavelengths? A) gamma rays, x-rays, ultraviolet rays, visible light B) radio waves, infrared rays, visible
1. In which list are the forms of electromagnetic energy arranged in order from longest to shortest wavelengths? A) gamma rays, x-rays, ultraviolet rays, visible light B) radio waves, infrared rays, visible
SOLAR WIND PROTON DENSITY INCREASE AND GEOMAGNETIC BACKGROUND ANOMALIES BEFORE STRONG M6+ EARTHQUAKES. V. Straser*, G. Cataldi
 SOLAR WIND PROTON DENSITY INCREASE AND GEOMAGNETIC BACKGROUND ANOMALIES BEFORE STRONG M6+ EARTHQUAKES V. Straser*, G. Cataldi *International Earthquake and Volcano Prediction Center E-mail: valentino.straser@alice.it
LAB 2: Earth Sun Relations
 LAB 2: Earth Sun Relations Name School The amount of solar energy striking the Earth s atmosphere is not uniform; distances, angles and seasons play a dominant role on this distribution of radiation. Needless
Geomagnetic storms. Measurement and forecasting
 Geomagnetic storms. Measurement and forecasting Anna Gustavsson 17 October 2006 Project of the Space Physics Course 2006 Umeå University 1 Introduction Effects of magnetic storms on technology Geomagnetic
Gordon Petrie NSO, Boulder, Colorado, USA
 On the enhanced coronal mass ejection detection rate since the solar cycle 3 polar field reversal ApJ 81, 74 Gordon Petrie NSO, Boulder, Colorado, USA .5 >..5 I- I I I I I I i 4 6 8 I 1 14 16 AVERAGE MONTHLY
Solar Activity The Solar Wind
 Solar Activity The Solar Wind The solar wind is a flow of particles away from the Sun. They pass Earth at speeds from 400 to 500 km/s. This wind sometimes gusts up to 1000 km/s. Leaves Sun at highest speeds
MHD MODELING FOR HMI JON A. LINKER SCIENCE APPLICATIONS INTL. CORP. SAN DIEGO
 MHD MODELING FOR HMI ZORAN MIKIĆ JON A. LINKER SCIENCE APPLICATIONS INTL. CORP. SAN DIEGO Presented at the HMI Team Meeting Stanford University, Palo Alto, May 1 2, 23 USEFULNESS OF MHD MODELS A global
Exemplar for Internal Achievement Standard. Mathematics and Statistics Level 3
 Exemplar for internal assessment resource Mathematics and Statistics for Achievement Standard 91580 Exemplar for Internal Achievement Standard Mathematics and Statistics Level 3 This exemplar supports
Tracking Solar Eruptions to Their Impact on Earth Carl Luetzelschwab K9LA September 2016 Bonus
 Tracking Solar Eruptions to Their Impact on Earth Carl Luetzelschwab K9LA September 2016 Bonus In June 2015, the Sun emitted several M-Class flares over a 2-day period. These flares were concurrent with
Using This Flip Chart
 Using This Flip Chart Solar storms can cause fluctuations in the magnetosphere called magnetic storms. These magnetic storms have disabled satellites and burned out transformers shutting down power grids.
Your web browser (Safari 7) is out of date. For more security, comfort and the best experience on this site: Update your browser Ignore
 is out of date. For more security, comfort and the best experience on this site: Update your browser Ignore") Your web browser (Safari 7) is out of date. For more security, comfort and the best experience on this site: Update your browser Ignore AURO RA northern lights (aurora borealis), southern lights (aurora
Your web browser (Safari 7) is out of date. For more security, comfort and the best experience on this site: Update your browser Ignore AURO RA northern lights (aurora borealis), southern lights (aurora
Sentinel-1 Long Duration Mutual Interference
 MPC-S1 Sentinel-1 Long Duration Mutual Interference Reference: Nomenclature: MPC-0432 DI-MPC-ARC Issue: 1. 0 Date: 2018,Dec.04 MPC-0432 DI-MPC-ARC V1.0 2018,Dec.04 i.1 Chronology Issues: Issue: Date: Reason
The Solar wind - magnetosphere - ionosphere interaction
 The Solar wind - magnetosphere - ionosphere interaction Research seminar on Sun-Earth connections Eija Tanskanen Friday January 27, 2006 12-14 a.m., D115 Outline 1. Basics of the Earth s magnetosphere
How did the solar wind structure change around the solar maximum? From interplanetary scintillation observation
 Annales Geophysicae (2003) 21: 1257 1261 c European Geosciences Union 2003 Annales Geophysicae How did the solar wind structure change around the solar maximum? From interplanetary scintillation observation
A Comparative Study of Different Approaches and Potential Improvement to Modeling the Solar Wind
 A Comparative Study of Different Approaches and Potential Improvement to Modeling the Solar Wind Sun, X. and Hoeksema, J. T. W.W. Hansen Experimental Physics Laboratory (HEPL), Stanford University Abstract:
What is an eclipse? Lunar Eclipses. By NASA, adapted by Newsela staff on Word Count 866 Level 940L
 What is an eclipse? By NASA, adapted by Newsela staff on 07.17.17 Word Count 866 Level 940L This image of the moon crossing in front of the sun was captured on January 30, 2014, by NASA's Solar Dynamics
Geography Class 6 Chapters 3 and
 CHAPTER 3 MOTIONS OF THE EARTH The Earth is always travelling in Space. That makes each person on Earth, a Space Traveller. No one feels the movement of the Earth because humans are too tiny when compared
Practice Seasons Moon Quiz
 1. Which diagram represents the tilt of Earth's axis relative to the Sun's rays on December 15? A) B) C) D) 2. The diagram below represents Earth in space on the first day of a season. 5. Base your answer
Tracking Sunspots. Overview: Objectives: Lesson Preparation: Procedure: Details. Materials. Standards
 Tracking Sunspots Overview: Students will examine sunspots and track them at different latitudes on the Sun. This activity is adapted from the Tracking Sunspots activity on NASA s Solar and Heliocentric
The Magnetic Sun. CESAR s Booklet
 The Magnetic Sun CESAR s Booklet 1 Introduction to planetary magnetospheres and the interplanetary medium Most of the planets in our Solar system are enclosed by huge magnetic structures, named magnetospheres
What is an eclipse? Lunar Eclipses. By NASA, adapted by Newsela staff on Word Count 866 Level 940L
 What is an eclipse? By NASA, adapted by Newsela staff on 07.17.17 Word Count 866 Level 940L This image of the moon crossing in front of the sun was captured on January 30, 2014, by NASA's Solar Dynamics
Solar Activity during the Rising Phase of Solar Cycle 24
 International Journal of Astronomy and Astrophysics, 213, 3, 212-216 http://dx.doi.org/1.4236/ijaa.213.3325 Published Online September 213 (http://www.scirp.org/journal/ijaa) Solar Activity during the
A. Windnagel M. Savoie NSIDC
 National Snow and Ice Data Center ADVANCING KNOWLEDGE OF EARTH'S FROZEN REGIONS Special Report #18 06 July 2016 A. Windnagel M. Savoie NSIDC W. Meier NASA GSFC i 2 Contents List of Figures... 4 List of
Using Solar Active Region Latitude Analysis to Monitor Solar Cycle Progress
 Using Solar Active Region Latitude Analysis to Monitor Solar Cycle Progress A Study Commissioned by RyeBrook Space Science Services RyeBrook Space 2017 Abstract: This paper seeks to answer the question
The Celestial Sphere. Chapter 1. Constellations. Models and Science. Constellations. Diurnal vs. Annular Motion 9/16/2010
 The Celestial Sphere Chapter 1 Cycles of the Sky Vast distances to stars prevent us from sensing their true 3-D arrangement Naked eye observations treat all stars at the same distance, on a giant celestial
What is an eclipse? Lunar Eclipses. By NASA, adapted by Newsela staff on Word Count 866 Level 940L
 What is an eclipse? By NASA, adapted by Newsela staff on 07.17.17 Word Count 866 Level 940L This image of the moon crossing in front of the sun was captured on January 30, 2014, by NASA's Solar Dynamics
C) the seasonal changes in constellations viewed in the night sky D) The duration of insolation will increase and the temperature will increase.
 the seasonal changes in constellations viewed in the night sky D) The duration of insolation will increase and the temperature will increase.") 1. Which event is a direct result of Earth's revolution? A) the apparent deflection of winds B) the changing of the Moon phases C) the seasonal changes in constellations viewed in the night sky D) the
1. Which event is a direct result of Earth's revolution? A) the apparent deflection of winds B) the changing of the Moon phases C) the seasonal changes in constellations viewed in the night sky D) the
Solar Energetic Particles measured by AMS-02
 Solar Energetic Particles measured by AMS-02 Physics and Astronomy Department, University of Hawaii at Manoa, 96822, HI, US E-mail: bindi@hawaii.edu AMS-02 collaboration The Alpha Magnetic Spectrometer
A Living Planet. The Earth Inside and Out
 A Living Planet The Earth Inside and Out Planet Earth Earth s Rotation, Revolution, and Tilt Most of Earth s energy comes from the Sun, which we call solar energy. Imagine that the Earth has an imaginary
CTU Presents. The Fitful Rise of Solar Cycle 24 What it Means in the Coming Year. Frank Donovan W3LPL
 CTU Presents The Fitful Rise of Solar Cycle 24 What it Means in the Coming Year Frank Donovan W3LPL Introduction This presentation focuses on: The four major fall and winter DX contests: CQ WW SSB and
What Patterns Can Be Observed in a Year?
 LESSON 3 What Patterns Can Be Observed in a Year? From this vantage point, you can see the moon, sun, stars, and Earth. From Earth s surface, there are patterns to how the sun, moon, and stars appear in
What is an eclipse? By NASA, adapted by Newsela staff on Word Count 786 Level 870L
 What is an eclipse? By NASA, adapted by Newsela staff on 07.16.17 Word Count 786 Level 870L This image of the moon crossing in front of the sun was captured on January 30, 2014, by NASA's Solar Dynamics
Earth & Beyond Teacher Newsletter
 Paul Floyd s Astronomy & Space Website Earth & Beyond Teacher Newsletter www.nightskyonline.info Earth & Beyond Teaching opportunities for 2012 This special edition has been prepared to assist you with
Long term data for Heliospheric science Nat Gopalswamy NASA Goddard Space Flight Center Greenbelt, MD 20771, USA
 Long term data for Heliospheric science Nat Gopalswamy NASA Goddard Space Flight Center Greenbelt, MD 20771, USA IAU340 1-day School, Saturday 24th February 2018 Jaipur India CMEs & their Consequences
Chapter 8 Geospace 1
 Chapter 8 Geospace 1 Previously Sources of the Earth's magnetic field. 2 Content Basic concepts The Sun and solar wind Near-Earth space About other planets 3 Basic concepts 4 Plasma The molecules of an
STCE Newsletter. 7 Dec Dec 2015
 Published by the STCE - this issue : 18 Dec 2015. Available online at http://www.stce.be/newsletter/. The Solar-Terrestrial Centre of Excellence (STCE) is a collaborative network of the Belgian Institute
STCE Newsletter. 9 Jun Jun 2014
 Published by the STCE - this issue : 19 Jun 2014. Available online at http://www.stce.be/newsletter/. The Solar-Terrestrial Centre of Excellence (STCE) is a collaborative network of the Belgian Institute
PHYS133 Lab 6 Sunspots and Solar Rotation
 PHYS133 Lab 6 Sunspots and Solar Rotation Goals: Select a series of images with sunspots suitable for measurement. View an animation of the images showing the motion of the spots as the Sun rotates. Devise
astronomy A planet was viewed from Earth for several hours. The diagrams below represent the appearance of the planet at four different times.
 astronomy 2008 1. A planet was viewed from Earth for several hours. The diagrams below represent the appearance of the planet at four different times. 5. If the distance between the Earth and the Sun were
INVESTIGATIONS OF THE STRUCTURE OF THE DIURNAL VARIATIONS OF GEOMAGNETIC FIELD
 Geologica Macedonica, Vol. 26, No. 1, pp. 37 51 (2012) GEOME 2 ISSN 0352 1206 Manuscript received: May 6, 2012 UDC: 556.385 Accepted: October 10, 2012 Original scientific paper INVESTIGATIONS OF THE STRUCTURE
Introduction To Modern Astronomy I: Solar System
 ASTR 111 003 Fall 2007 Lecture 02 Sep. 10, 2007 Introduction To Modern Astronomy I: Solar System Introducing Astronomy (chap. 1-6) Planets and Moons (chap. 7-15) Chap. 16: Our Sun Chap. 28: Search for
Sun Earth Connection Missions
 Sun Earth Connection Missions ACE Advanced Composition Explorer The Earth is constantly bombarded with a stream of accelerated particles arriving not only from the Sun, but also from interstellar and galactic
Earth s Motion. Lesson Outline LESSON 1. A. Earth and the Sun 1. The diameter is more than 100 times greater than
 Lesson Outline Earth s Motion LESSON 1 A. Earth and the Sun 1. The diameter is more than 100 times greater than Earth s diameter. a. In the Sun, atoms combine during, producing huge amounts of energy.
KUALA LUMPUR MONSOON ACTIVITY CENT
 T KUALA LUMPUR MONSOON ACTIVITY CENT 2 ALAYSIAN METEOROLOGICAL http://www.met.gov.my DEPARTMENT MINISTRY OF SCIENCE. TECHNOLOGY AND INNOVATIO Introduction Atmospheric and oceanic conditions over the tropical
Hinode mission status
 Hinode mission status 28.9.3 T. Shimizu (ISAS/JAXA) 2nd Hinode Science Meeting Overview Hinode has been operated for two years after the launch on 23 September 26 (JST). All the three telescopes are continuing
Magnitude 7.5 NEW BRITAIN REGION, PAPUA NEW GUINEA
 A magnitude 7.5 earthquake struck off the eastern coast of Papua New Guinea on Tuesday, approximately 130 km (81 mi) southsouthwest of Kokopo at a depth of 42 km (26.1 mi). There are reports of some structural
Julene Louis - first published by The Mountain Astrologer, 2007 /
 Eclipse Mechanics and the Saros Series Julene Louis - first published by The Mountain Astrologer, 2007 / 06.11.2015 Eclipses occur when the Sun, Earth, and Moon align with the Moon s nodes. The alignment
CHAPTER 2 DATA. 2.1 Data Used
 CHAPTER DATA For the analysis, it is required to use geomagnetic indices, which are representatives of geomagnetic activity, and Interplanetary Magnetic Field (IMF) data in addition to f F,which is used
STCE Newsletter. 11 Jan Jan 2016
 Published by the STCE - this issue : 21 Jan 2016. Available online at http://www.stce.be/newsletter/. The Solar-Terrestrial Centre of Excellence (STCE) is a collaborative network of the Belgian Institute
drinking straw, protractor, string, and rock. observer on Earth. Sun across the sky on March 21 as seen by an
 1. The diagram below represents some constellations and one position of Earth in its orbit around the Sun. These constellations are visible to an observer on Earth at different times of the year. When
An Introduction to Space Weather. J. Burkepile High Altitude Observatory / NCAR
 An Introduction to Space Weather J. Burkepile High Altitude Observatory / NCAR What is Space Weather? Space Weather refers to conditions in interplanetary space, produced by the Sun, that can disrupt
Magnetic Fields at Hale Solar Sector Boundaries
 Magnetic Fields at Hale Solar Sector Boundaries Leif Svalgaard HEPL Stanford University Huntsville Workshop, 25 March 2014 1 Discovery of Sector Structure Quasi-Stationary Corotating Structure in the Interplanetary
ERBE Geographic Scene and Monthly Snow Data
 NASA Contractor Report 4773 ERBE Geographic Scene and Monthly Snow Data Lisa H. Coleman, Beth T. Flug, Shalini Gupta, Edward A. Kizer, and John L. Robbins Science Applications International Corporation
Laboratory Exercise #7 - Introduction to Atmospheric Science: The Seasons
 Laboratory Exercise #7 - Introduction to Atmospheric Science: The Seasons page - 1 Section A - Introduction: This lab consists of both computer-based and noncomputer-based questions dealing with atmospheric
Page Eclipses INTERACTIVE. Lunar phases
 Page 30 1.4 Eclipses INTERACTIVE Lunar phases An eclipse occurs when the Moon happens to lie exactly between the Earth and the Sun, or when the Earth lies exactly between the Sun and the Moon, so that
GEO-VIII November Geohazard Supersites and Natural Laboratories Progress Report. Document 9
 GEO-VIII 16-17 November 2011 Geohazard Supersites and Natural Laboratories Progress Report Document 9 This document is submitted to GEO-VIII for information. Geohazard Supersites and Natural Laboratories
Magnitude 8.2 NORTHWEST OF IQUIQUE, CHILE
 An 8.2-magnitude earthquake struck off the coast of northern Chile, generating a local tsunami. The USGS reported the earthquake was centered 95 km (59 miles) northwest of Iquique at a depth of 20.1km
Mars Opposition Friday 27 th July 2018
 Mars Opposition Friday 27 th July 2018 Mars is about 6,780 kilometres in diameter or roughly half the size of the Earth whose diameter is 12,742km. As they orbit the Sun, the minimum distance between the
Activity 7: Be an Aurora Forecaster
 ACTIVITY 7 NASA/STEREO Be an Aurora Forecaster Iñupiaq value: Respect for Nature We can predict when the northern lights are likely to occur by monitoring solar activity. When a solar storm such as a coronal
Solar-terrestrial relation and space weather. Mateja Dumbović Hvar Observatory, University of Zagreb Croatia
 Solar-terrestrial relation and space weather Mateja Dumbović Hvar Observatory, University of Zagreb Croatia Planets Comets Solar wind Interplanetary magnetic field Cosmic rays Satellites Astronauts HELIOSPHERE
Center Data Analysis Service supported by the FAGS
 Solar Influences Data analysis Center Data Analysis Service supported by the FAGS SUNSPOT BULLETIN 2 n Provisional international and normalized hemispheric daily sunspot numbers for September 2 computed
Adventures Under the Northern Lights
 Conversations on Jesuit Higher Education Volume 50 Article 25 September 2016 Adventures Under the Northern Lights William Gutsch Follow this and additional works at: http://epublications.marquette.edu/conversations
FARSIDE HELIOSEISMIC HOLOGRAPHY: RECENT ADVANCES
 FARSIDE HELIOSEISMIC HOLOGRAPHY: RECENT ADVANCES I. González Hernández 1, F. Hill 1, C. Lindsey 2, D. Braun 2, P. Scherrer 3, and S.M. Hanasoge 3 1 National Solar Observatory, Tucson, Arizona, USA 2 NorthWest
Using Solar Active Region Latitude Analysis to Monitor Solar Cycle Progress
 Using Solar Active Region Latitude Analysis to Monitor Solar Cycle Progress Published by RyeBrook Space Science Services 216 Abstract: This paper seeks to answer the question does solar active region latitude
Directed Reading. Section: Viewing the Universe THE VALUE OF ASTRONOMY. Skills Worksheet. 1. How did observations of the sky help farmers in the past?
 Skills Worksheet Directed Reading Section: Viewing the Universe 1. How did observations of the sky help farmers in the past? 2. How did observations of the sky help sailors in the past? 3. What is the
UPDATE OF REGIONAL WEATHER AND SMOKE HAZE (February 2018)
") UPDATE OF REGIONAL WEATHER AND SMOKE HAZE (February 2018) 1. Review of Regional Weather Conditions for January 2018 1.1 The prevailing Northeast monsoon conditions over Southeast Asia strengthened in January
UPDATE OF REGIONAL WEATHER AND SMOKE HAZE (February 2018) 1. Review of Regional Weather Conditions for January 2018 1.1 The prevailing Northeast monsoon conditions over Southeast Asia strengthened in January
4. What verb is used to describe Earth s
 Name: Date: 1 Read the text and then answer the questions. No matter where on Earth you live, you have day and night. That happens because of a movement of Earth called rotation. Earth rotates, or turns,
Here s what a weak El Nino usually brings to the nation with temperatures:
 Time again for my annual Winter Weather Outlook. Here's just a small part of the items I considered this year and how I think they will play out with our winter of 2018-2019. El Nino / La Nina: When looking
Magnitude 7.5 NEW BRITAIN REGION, PAPUA NEW GUINEA
 A magnitude 7.5 earthquake struck off the eastern coast of Papua New Guinea on Sunday, approximately 54 km (33 miles) southeast of Kokopo. Residents reported strong ground shaking for about five minutes.
Global Temperature Report: December 2018
 Jan 2, 2019 Vol. 28, No. 9 For Additional Information: Dr. John Christy, (256) 961-7763 christy@nsstc.uah.edu Dr. Roy Spencer, (256) 961-7960 spencer@nsstc.uah.edu Global Temperature Report: December 2018
The Synchronic Frame of Photospheric Magnetic field: The Improved Synoptic Frame
 1 The Synchronic Frame of Photospheric Magnetic field: The Improved Synoptic Frame X. P. Zhao, J. T. Hoeksema and P. H. Scherrer W. W. Hansen Experimental Physics Laboratory, Stanford University Short
AIA DATA ANALYSIS OVERVIEW OF THE AIA INSTRUMENT
 AIA DATA ANALYSIS OVERVIEW OF THE AIA INSTRUMENT SDO SUMMER SCHOOL ~ August 2010 ~ Yunnan, China Marc DeRosa (LMSAL) ~ derosa@lmsal.com WHAT IS SDO? The goal of Solar Dynamics Observatory (SDO) is to understand:
Lecture 5 The Formation and Evolution of CIRS
 Lecture 5 The Formation and Evolution of CIRS Fast and Slow Solar Wind Fast solar wind (>600 km/s) is known to come from large coronal holes which have open magnetic field structure. The origin of slow
Please be ready for today by:
 Please be ready for today by: 1. HW out for a stamp 2. Paper and pencil/pen for notes 3. Be ready to discuss what you know about El Nino after you view the video clip What is El Nino? El Nino Basics El
Making a Climograph: GLOBE Data Explorations
 Making a Climograph: A GLOBE Data Exploration Purpose Students learn how to construct and interpret climographs and understand how climate differs from weather. Overview Students calculate and graph maximum
Lessons from the 2004 Sumatra earthquake and the Asian tsunami
 Lessons from the 2004 Sumatra earthquake and the Asian tsunami Kenji Satake National Institute of Advanced Industrial Science and Technology Outline 1. The largest earthquake in the last 40 years 2. Tsunami
Solar Sector Structure: Fact or Fiction?
 Solar Sector Structure: Fact or Fiction? Leif Svalgaard Stanford University LMSAL, August 18, 2011 1 Discovery of Sector Structure Quasi-Stationary Corotating Structure in the Interplanetary Medium John
5 - Seasons. Figure 1 shows two pictures of the Sun taken six months apart with the same camera, at the same time of the day, from the same location.
 ASTR 110L 5 - Seasons Purpose: To plot the distance of the Earth from the Sun over one year and to use the celestial sphere to understand the cause of the seasons. What do you think? Write answers to questions
What Is the Relationship Between Earth s Tilt and the Seasons?
 Learning Set 2 Why Are There Differences in Temperature? Review Images and Graphics While reading about Earth s tilt and the seasons, pay particular attention to the graphics included. How do they help
Seismic Recording Station AZ_PFO Summary Report
 Seismic Recording Station AZ_PFO Summary Report Thank you for hosting station AZ_PFO on your property. We hope that you find the enclosed report interesting. Your station is one of the 2000 USArray seismic
Seasons Page 520. A. What Causes Seasons?
 Seasons Page 520 A. What Causes Seasons? 1. Seasons are caused by the tilt of the earth s axis as it moves around the sun. 2. Seasons happen because the Earth is tilted on its axis at a 23.5 angle. 3.
Magnitude 7.1 NEAR THE EAST COAST OF HONSHU, JAPAN
 Japan was rattled by a strong aftershock and tsunami warning Thursday night nearly a month after a devastating earthquake and tsunami flattened the northeastern coast. This earthquake can be considered
5 - Seasons. Figure 1 shows two pictures of the Sun taken six months apart with the same camera, at the same time of the day, from the same location.
 Name: Partner(s): 5 - Seasons ASTR110L Purpose: To measure the distance of the Earth from the Sun over one year and to use the celestial sphere to understand the cause of the seasons. Answer all questions
Motions of the Sun Model Exploration
 Name Date Bell Motions of the Sun Model Exploration 1. Go to the University of Nebraska-Lincoln Motions of the Sun Simulator: http://astro.unl.edu/naap/motion3/animations/sunmotions.swf 2. This is what
Lab Activity: Climate Variables
 Name: Date: Period: Water and Climate The Physical Setting: Earth Science Lab Activity: Climate Variables INTRODUCTION:! The state of the atmosphere continually changes over time in response to the uneven
Geomagnetic Sudden Impulses
 Geomagnetic Sudden Impulses Whitham D. Reeve 2013 W. Reeve 1. Introduction This article discusses geomagnetic sudden impulses observed with the SAM-III magnetometer system at Anchorage, Alaska USA during
The Project. National Schools Observatory
 Sunspots The Project This project is devised to give students a good understanding of the structure and magnetic field of the Sun and how this effects solar activity. Students will work with sunspot data