Vision The resilience of water supply and sanitation in the face of climate change. Climate change projection study
|
|
|
- Kevin Bailey
- 6 years ago
- Views:
Transcription

1 Vision 2030 The resilience of water supply and sanitation in the face of climate change Climate change projection study 1
2 Executive Summary Introduction Aim of the project and background Data and methodology Predictions of changes in precipitation by Predicted changes in annual, seasonal and monthly means Predicted changes in short-period precipitation extremes Model evaluation Concluding remarks Appendix Prepared by Anca Brookshaw and Richard Graham, Climate Products, Met Office Hadley Centre Reviewed by Mike Davey and Anca Brookshaw, Met Office Hadley Centre Scientific contributors include Holger Pohlmann, Doug Smith, Robin Clark and other Met Office Hadley Centre scientists Authorised for issue by Richard Graham, Manager, Climate Products Date: 25/02/2009 Direct contact: anca.brookshaw@metoffice.gov.uk Tel This report was prepared in good faith. Neither the Met Office nor its employees, contractors or subcontractors, make any warranty, express or implied, or assume any legal liability or responsibility for its accuracy, completeness, or any party s use of its contents. The views and opinions contained in the report do not necessarily state or reflect those of the World Health Organization and Met Office. The named authors alone are responsible for the views expressed in this publication. This report is not edited by the World Health Organization to conform to the requirements of WHO style. The published material is being distributed without warranty of any kind, either expressed or implied. The responsibility for the interpretation and use of the material lies with the reader. In no event shall the World Health Organization be liable for damages arising from its use. 2
3 Executive Summary Changes in climate expected over the next decades, some of which are already unavoidable, will bring with them the challenge of adapting to the associated impacts. Any efforts towards adaptation would benefit from the support of credible, robust predictions of climate changes at regional scales. This study is aiming to inform adaptation strategies in the sector of water supply and sanitation technologies. The decadal prediction system (DePreSys) from the Met Office Hadley Centre is used here as the basis for predictions of changes in precipitation, all around the world, over the next 20 years. Two time frames during this period are selected for illustration: the 9-year periods centred on 2020 and 2030 respectively. Predictions are provided for annual, seasonal and monthly averages, as well as for some large-scale extreme events. The model predictions are subject to uncertainties, an estimate of which is provided alongside the prediction maps in the report. Predictions and associated uncertainties will be used, together with regional information on the status of water supply and sanitation technologies, to help develop strategies for adaptation. DePreSys is designed to provide realistic predictions for large-scale changes in climate over the next few decades, including both natural and man-made influences on the climate system. Key advantages of the system include: it uses a climate model (HadCM3) which is well-established and respected for large scale applications, it uses observations as initial conditions for the predictions, ensembles of predictions provide some estimate of uncertainty due to initial conditions. Although, arguably, this is the best currently available tool to predict changes in climate for the near-future, there are caveats to consider when using the predictions: in common with other state-of-the-art climate models, a number of key processes for local-scale precipitation are poorly or not at all represented in the underlying model; initial-condition uncertainty is not fully sampled; other sources of uncertainty (relating to model formulation or future greenhouse-gas emissions) are not investigated; the corrections applied to the model output to derive the predictions are relatively simple and unlikely to compensate for all modelling errors. In general, because the science of decadal prediction is at a very early stage, a lot more fundamental research is needed before meaningful statements of confidence in these predictions can be made. A rigorous quantitative assessment of their reliability (by predicting past cases) is not possible at this stage, but case studies presented in this report show that plausible predictions of annual-mean precipitation over large-scale areas are achievable with DePreSys. The value of information on individual regions would be greatly enhanced by combining it with detailed understanding of the regional meteorology and of the strengths and limitations of climate models at regional scales. In the absence of quantitative assessments of confidence in the predictions, consistency between models has been used to categorise the predicted changes; the robust findings, according to this criterion, are summarised below. 3
4 Patterns of change predicted for the period around 2020 appear spatially coherent, and are mainly large scale. They are broadly similar to the patterns of predictions for the period around Annual-mean precipitation is predicted to increase in high-latitude areas, in both hemispheres, with changes predicted to become apparent by the 2020s; precipitation is predicted to decrease in southern Africa, parts of Central America and of the Mediterranean basin by the 2030s (more than two thirds of models analysed agree). Additionally, annual-mean precipitation is predicted to decrease over northern South America and some parts of Central America, starting by the 2020s and continuing at least to the 2030s, and is predicted to increase over South Asia, already by the 2020s, persisting or increasing further by the 2030s, as well as over parts of central Africa (more than two thirds of HadCM3 models agree, but less agreement among other models). Additionally, annual-mean precipitation is predicted to decrease in coastal regions of western North America, starting by the 2020s, and in the Mediterranean region, by the 2030s; annual-mean precipitation increases are predicted for some parts of the Sahel region of western Africa (all DePreSys predictions agree, but less agreement among other models). It must be emphasised that these are predictions for 9-year averages centred on 2020 and 2030 respectively; uncertainties in variability of individual years around these dates are large over the whole globe. More generally, even confident predictions by one or several models remain subject to model error, and thus cannot be guaranteed. A limited analysis of predicted changes, around 2030, in large-scale extreme events lasting a few days, reveals uncertainty in the sign of the expected changes, in most parts of the world. However, some features are supported by 90% of members of the DePreSys ensemble; these are summarised below. The intensity of wet 5-day large-scale events is predicted to decrease in parts of the Middle East, northeastern and southwestern Africa as well as in northeastern Brazil and some coastal areas in western North America; areas in eastern Asia and parts of the northern extratropics show relatively large risk of increase in intensity of such events. The number of dry 10-day periods is predicted to increase over parts of southern Africa, over large areas in central and eastern South America, areas of the Mediterranean basin and the coastal region of western North America. These changes are consistent with the predictions that these areas will be drier in the annual mean. In light of the considerations listed above, the predictions presented here may be cautiously used to gauge large-scale patterns of change across the globe; they should not be used for applications which require small-scale details. 4
5 1. Introduction Climate change will have impacts on many sectors of activity and in all parts of the world; many such impacts are already being felt. Predictions of expected changes have the potential to help plan for the future, by informing adaptation strategies. Causes of changes in climate vary with time into the future changes due to anthropogenic influences on the climate system are modulated by, and act alongside, changes due to natural variability. This is particularly the case in the near future (a few years ahead), when the expected human influences are still relatively small, and their effect is comparable to that of the natural variability of the system. A variety of climate prediction systems have been designed to exploit the various sources of predictability. The Met Office s decadal prediction system is used in this project to assess changes in precipitation over the next 30 years. This system is designed to take account of the current observed global climate state, and as a consequence is expected to give a better estimate than IPCC-type models of the changes expected over relatively short periods in the future when the influence of climate variability is thought to make a significant contribution to the expected changes. Climate predictions inevitably refer to time averages and space averages; prediction of individual weather events years into the future is not possible. Predictions are presented here for changes in period means at all locations around the globe; a summary assessment of changes in precipitation extremes is also included. The model the predictions are derived from, like most climate models, has coarse resolution, and as a consequence the results are applicable for large-scale changes. Further analysis, taking account of local influences on precipitation, would be needed for applications at local scales. As predictions are inherently uncertain, it is important to assess the associated uncertainty, especially if decisions are to be based on these predictions; some estimates are given here, but they are based on limited information (given the scope and extent of the project). The report starts by presenting the aim of the study, in section 2; section 3 describes the data and methodology employed. In the main part of the report, section 4, predictions are presented both for the changes in mean precipitation and in statistics of extremes. Section 5 looks at evidence on the model s ability to reproduce observed recent climate; it also includes a comparison of the predictions presented here, derived from the decadal prediction system, with some predictions for the same period obtained from other climate models. The final section presents a few concluding remarks and suggestions for work to enhance these predictions. It is followed by an appendix including maps of changes in seasonal- and monthly-mean precipitation, as well as supplementary graphs supporting the discussion in section 4 (these maps were separated from the main body of the report to make this easier to read. Many references are made in the text to the maps included in the appendix, so it is important to regard the appendix as an integral part of the report). The work has resulted in a global database of predictions to 2030 of annual, seasonal, monthly and 5-day timescales. This database will be used in parallel work to assess 5
6 impacts on water and sanitation technologies. Results presented in this report represent an overview of the information available. 2. Aim of the project and background The purpose of this study is to provide information about precipitation patterns in the future and thus support the assessment of the likely impact of climate change on the viability of technologies currently used (or planned for the near future) to provide water supply and sanitation consistent with meeting the targets set as part of the Millennium Development Goals. If climate change affects the viability of water supply and sanitation technologies, the consequences may increase the cost of achieving the Millennium Development Goals or potentially jeopardise the timely achievement of some of the specific targets. This work is intended to help inform the understanding of the likely impacts of climate change and thus contribute to the development of evidence-based guidance on which water and sanitation technologies to promote in different situations. The findings could also be used as a framework for assessing future development of technologies and their likely costeffectiveness and robustness. Specifically, the study provides predictions of likely changes in global precipitation patterns expected by 2030 and some estimates of changes at regional level, both in the mean amount of precipitation and in the intensity of extremes, as well as assessing some of the uncertainties associated with these predictions. These estimates are based on the Met Office s decadal prediction system. Despite the system s theoretical merits, discussed in the next section, the estimates presented here have an important limitation: being derived from a single model, they inevitably ignore any prediction uncertainties due to the formulation of the model. As a consequence, this collection of predictions is to be regarded as a generic tool for first order assessment of changes at regional scales. Further analysis, including predictions from other models, would be required for detailed local applications, especially as far as estimating the true uncertainties in the predictions is concerned. 3. Data and methodology Modelling framework The predictions provided as a result of this study are based on the Met Office Hadley Centre s decadal prediction system (DePreSys). It is a prediction system designed to represent changes in the climate over next few decades, when external influences on the climate system are thought to be comparable in magnitude to the effects of natural variability. In a departure from the usual techniques of modelling the climate, which only aim to capture the envelope of natural variability around forced changes, and not to forecast the phases of the variability, DePreSys predictions are started from observed conditions which specify the current phase of variability of the climate on interannual (and decadal, or multi-decadal) timescales. There is evidence to indicate that retrospective predictions using DePreSys have better skill at reproducing observed decadal averages of large-scale temperature changes than similar predictions without the information contained in the initial conditions, at least in the first few years of the prediction (Smith et 6
7 al, 2007). This suggests that even for other variables (including precipitation) and longerrange predictions for which the influence of initial conditions is an ongoing research question it would be prudent to include observed initial conditions. DePreSys (Smith et al, 2007), uses Hadley Centre s climate prediction model HadCM3 (Gordon et al, 2000). This is a coupled ocean-atmosphere general circulation model, which represents the atmosphere and the oceans, throughout their depth, as latitudelongitude grids. The atmospheric grid has horizontal resolution of 2.5 in latitude and 3.75 in longitude and 19 vertical levels; the oceanic grid has horizontal resolution of 1.25 x 1.25 and 20 vertical levels. Variables at each grid point can be regarded as representing conditions in a grid box: a model grid point on the Earth s surface represents an area whose extent depends on the latitude at which it is situated on the globe (e.g. in midlatitudes the size of a grid box is approximately 300kmx300km). As a consequence, the predictions are only meaningful at these or larger scales any inferences for precise locations would require supplementary interpretation. Uncertainty estimation As part of the prediction system, the model is run in ensemble mode 1, with each ensemble member started from initial conditions created by assimilating observations into the initial state of both the ocean and the atmosphere, in the form of anomalies from longterm climatology. The anomaly initialisation approach recognises that the model climatology is not a perfect representation of the real-world climatology, and is designed to reduce the impact of the differences (in effect, it uses the model to predict anomalies relative to its own climate). The forecast used in this study is a 10-member ensemble started from conditions observed on 10 consecutive days in March The climatology of the model is provided by a mean of 4 simulations for 1979 to 2001 made using HadCM3, which include natural and man-made influences on the climate system, such as volcanic eruptions and anthropogenically produced greenhouse gases (referred to as forcings ). Predictions In this study, changes are estimated in the annual, seasonal (3-month averages) and monthly means of precipitation and presented as maps and graphs. On the maps provided, the value indicated in each grid box represents the average of values at the box in question and the 8 grid boxes surrounding it; these will be referred to as 9-box averages, centred at the given location. This is done to smooth the grid-scale spatial variations that can be artefacts of small scale noise in the system and thus not representative of actual variations. Aggregating information over larger areas is necessary in order to achieve scales at which global climate models can be expected to resolve regional climate features with reasonable skill. In general, skill of predictions increases with averaging, both in space and in time. Year-to-year changes over the next 30 years are presented in this report only for annual means of large-area averages. These predictions are not intended to offer precise year-to-year sequences, but illustrate typical 1 An ensemble, in this context, is a set of predictions designed to quantify uncertainties in the outcomes predicted, given uncertainties in the inputs into the model. For example, DePreSys is an initial-value ensemble which uses ten different forecasts ( members ) to estimate the expected range of changes in climate variables; the ensemble members differ only by their initial conditions. This approach is needed for long-range predictions: small differences in the initial state of the atmosphere and ocean can amplify to large differences in the outcomes predicted for months or years into the future. 7
8 interannual variability. The regions used are those defined by Giorgi and Francisco (2000) for regional analysis of climate model simulations, and are listed below. Name Acronym Latitude ( ) Longitude ( ) Australia AUS 45S-11S 110E-155E Amazon Basin AMZ 20S-12N 82W-34W Southern South America SSA 56S-20S 76W-40W Central America CAM 10N-30N 116W-83W Western North America WNA 30N-60N 130W-103W Central North America CNA 30N-50N 103W-85W Eastern North America ENA 25N-50N 85W-60W Alaska ALA 60N-72N 170W-103W Greenland GRL 50N-85N 103W-10W Mediterranean Basin MED 30N-48N 10W-40E Northern Europe NEU 48N-75N 10W-40E Western Africa WAF 12S-18N 20W-22E Eastern Africa EAF 12S-18N 22E-52E Southern Africa SAF 35S-12S 10W-52E Sahara SAH 18N-30N 20W-65E Southeast Asia SEA 11S-20N 95E-155E East Asia EAS 20N-50N 100E-145E South Asia SAS 5N-30N 65E-100E Central Asia CAS 30N-50N 40E-75E Tibet TIB 30N-50N 75E-100E North Asia NAS 50N-70N 40E-180E Following their method, only model land grid points from each region are used in the analysis. A map of these regions and country boundaries is in Figure 1. Figure 1 Giorgi regions 8
9 The changes in precipitation (whether in annual, seasonal or monthly means) are presented as anomalies relative to the climatology for We make use of both the model climatology and an observed climatology. Unless specified otherwise, the present day climatology refers to the model climatology over the period , and is estimated as the mean of a 4-member ensemble of HadCM3 predictions with forcings derived from observations. In most cases the target times for the predictions are 2020 and To increase the robustness of the results, unless specified otherwise, each of the predictions is estimated by 9-year averages centred on the target year in question (e.g., the predictions for a season of 2020 are obtained as averages of model predictions for the same season in the 9 years ). Although individual years are not predictable years in advance, due to influences of natural fluctuations from year to year, the 9-year average is potentially more predictable. Changes to the statistics of extreme events at grid-box scale are estimated from daily data output by the forecast model. Predictions are based on the same 10-member ensemble initialised in March The method used follows that of Clark et al. (2006) and Clark and Brown (2008). Changes in extreme rainfall statistics are calculated by comparing DePreSys forecasts for the 9 years (centred on 2030) with DePreSys hindcasts (retrospective forecasts) for the 9-year period (centred on 1989), described below. Data for model evaluation A set of hindcasts using DePreSys was created to help assess the skill of the system by comparison with observations. The hindcasts are 4-member ensembles (started from consecutive days), with start dates at 3-month intervals, from initial conditions created by assimilating observations. The external forcings applied to the system are derived from concentrations of greenhouse gases and sulphate aerosol provided by SRES scenario B2 2 (see IPCC, 2007), observed volcanic aerosol decayed from the initial value with oneyear timescale and solar forcing obtained by repeating the previous 11-year solar cycle. The hindcast dataset covers the period ; for each year 4-member hindcast ensembles are started from March, June, September and December. In addition, two 10- member hindcasts were initialised 10 years apart, in 1965 and 1975 respectively, and run for 30 years each, with external forcing similar to those used for the shorter hindcasts further discussion on these hindcasts is available in the section on model evaluation. Data from other climate models is used to set the DePreSys prediction in a wider context of climate change predictions. The methodology will be fully explained in the section on model evaluation; in brief, it consists of comparing maps of predicted changes in precipitation (for 9-year periods centred on 2020 and 2030 respectively), similar to the maps of changes projected for the end of the century included in the report by the Intergovernmental Panel on Climate Change (IPCC), on the physical science basis of climate change (IPCC 2007, Figure SPM.7). Two prediction systems are used for this comparison. The first is an ensemble formed by perturbing parameters in the physics of the atmospheric part of HadCM3, with the aim of quantifying uncertainties due to parametrisations used in one model. This ensemble will be referred to as the QUMP 2 The choice of scenario is assumed to make little difference to the predicted outcome: differences in global average temperature predicted under different scenarios have been shown to be small up to around However, since the distribution and concentration of aerosols is important for regional predictions of precipitation (and these differ from scenario to scenario), this is a limiting assumption. 9
10 ensemble (from quantifying uncertainties in model predictions, the name of the project which gave rise to it Murphy et al, 2004). Each of its members is a slightly different model version from the others, with the differences between models restricted to the physics of the atmospheric component. The QUMP ensemble is designed to systematically sample a wide range of process uncertainties. The second is the multimodel ensemble formed from all the models participating in the IPCC s 4th assessment, and will be referred to as the AR4 ensemble. This ensemble samples (in an ad hoc way) a wider range of uncertainty due to model formulation than the QUMP ensemble (participating models may have different physics, dynamics and resolution). In practice, the two types of ensembles give similar ranges of changes in key aspects of large-scale climate change by the end of the century (for a given emissions scenario). The predictions available to this study from these two ensembles all use external forcings specified by SRES scenario A1B. Observations are used for converting predicted percentage changes into amount changes and for evaluating the model s performance in reproducing the observed precipitation variability from 1979 onwards. For the period since 1979 data from the Global Precipitation Climatology Project (GPCP, Adler et al. 2003) are used for annual, seasonal and monthly averages, and data from the CPC Merged Analysis of Precipitation (CMAP, Xie, P., and P.A. Arkin, 1997) are used for 5-day averages ; for the period prior to the satellite era data from the Goddard Institute for Space Studies (GISS, Dai et al. 1997) the Climate Research Unit (CRU, Hulme 1992) and the Variability Analysis of Surface Climate Observations (VASClimO, Beck et al. 2005) project are used. 4. Predictions of changes in precipitation by Predicted changes in annual, seasonal and monthly means Using data from a 10-member DePreSys ensemble forecast initialised with conditions observed in March 2007, estimates are generated for the changes in precipitation amounts expected around 2020 and Deterministic estimates of the changes in annual-mean precipitation are calculated as 9-year averages centred on the target year. At each location (grid point) the value plotted is the average of the model output over a 3x3 grid-point array centred on the location in question. Predicted changes are shown both as percentages (of climatological values) and amounts. Percentage changes are calculated directly from model data, as (model absolute value - model climatology)/model climatology. This represents, in model world, the changes expected as a proportion of current ( ) values. As illustrated in Figure 2, the model world and the real world climatologies differ to a certain extent. The differences are largest in the tropics, especially over southeastern Asia, and they are a rough measure of model error (though it is likely that there is also uncertainty in the observations). It is clear from these differences that amount and percentage changes will not both be the same in the modelled and observed worlds. We can either assume that the observed anomalies (absolute value climatology) are well represented by the model and assume them to be invariant between the model and the real world in which case the relative changes, obtained by dividing the anomalies by the climatological values will differ between model and observations or assume that the relative change ((absolute value climatology)/climatology) is the invariant measure, in which case the anomalies in the real world must differ from those directly predicted by the 10

11 model. Neither of these assumptions is likely to be entirely defendable without a deeper understanding of the source and structure of model errors (which is beyond the scope of this project). We proceed here with the latter assumption, and use the relative changes derived exclusively from the model as good representations of the relative changes expected in the real world; to calculate the amount changes expected we multiply the expected relative change by the observed climatological value at each location. Figure 2 Annual-mean precipitation climatology for : model (top map), observations (middle map) and the difference (bottom map), all expressed in mm/day This procedure removes the mean bias and part of the bias in the variance in the model predictions. However, it is unlikely to fully correct the model data at most locations; predictions for areas where the differences between the observed and modeled climate are large (e.g. southeastern Asia) should be viewed with considerable caution. Also, it must be emphasised that given the coarse resolution of the model, some important processes which influence regional precipitation are poorly represented, or missing 11
12 entirely (e.g. strong topographical forcing) in such areas (e.g. high terrain, not correctly reflected in the model topography) more detailed analysis of model biases would be necessary to increase confidence in the predictions. It is important to take into account both the predicted relative changes and the changes in amounts. In regions where (at certain times of year, at least) the precipitation amounts are low, apparently small changes (negligible, in the convention adopted in the plots presented here) may represent a large proportion of current levels and potentially have a larger impact than the absolute value of the change might suggest. Conversely, large percentage changes which in fact reflect small absolute amounts could mislead on the severity of the expected impacts if not accompanied by the information on changes in amounts. The best estimate changes in 9-year averages are calculated as means of the 10- member ensemble. (There are other ways not presented here of deriving a best estimate for predicted changes; the optimal choice would ultimately depend on the application the predictions are used for.) A 9-year average is regarded as an average year around the target date, and as such will not exhibit precisely the same variability as individual years; however, it is preferred for best estimates as it s likely to be more predictable than individual years. An example of how 9-year average values compare with corresponding values for individual years is illustrated in Figure 3, where annual means (of globally-averaged precipitation anomalies) are plotted on the same scale as 9-year rolling means of the same variable. It is evident that the individual values exhibit larger year-to-year variations than the 9-year means. Figure 3 Example of differences between changes in individual annual means (red line) and 9-year rolling averages (black line); see text for explanation The best estimates are accompanied by estimates of the 10%-90% range for predicted annual-mean precipitation changes. Expected extreme values of annual-mean precipitation, which are highlighted by the 10%-90% range, are deemed of more interest if calculated for individual years, represented by the model, than for 9-year averages. The range is delimited by the 10 th and 90 th percentiles of the set of predictions available at each grid point for the target period (where the 90 predictions from each of the 10 members and for each of the 9 years around the target date are considered separately. Years and ensemble members are considered interchangeable within the sample: any one of them might occur at the target date, so they provide information about the range and likelihood of possible outcomes according to this model. The best estimate, although in most case lying between the limits provided by the 10 th and 90 th percentile grid-point estimates, is in no direct way related to them. As before, the original grid-point values for these limits are then averaged over a 9-box area surrounding each location and plotted at all grid points). It is important to note that, unlike the maps illustrating best-estimate 12
13 changes, the maps of 10 th and 90 th percentile values do not represent patterns possible in the future, but simply a collection of individual grid-point percentile values presented on a map - that is, two neighbouring points on the map may not originate from the same ensemble member, and thus not be part of the same possible future scenario. As a consequence, based on the DePreSys ensemble, in an individual year there is up-to- 10% chance of the expected changes in annual-mean precipitation at each grid point to be of less than the predicted 10 th percentile value and up-to-10% chance of their being larger than the predicted 90 th percentile - and therefore 80% chance of the expected changes to lie between the two limits. However since, by design, this ensemble only accounts for part of the uncertainties expected in the predictions, and given that modelpredicted uncertainty bounds have the potential to be different from the uncertainties expected in the real world (even for prediction systems designed to sample uncertainties in a more comprehensive way), this interval is itself an estimate. 3 Annual means Figure 4 and Figure 6 map the best estimate expected changes, around 2020 and 2030 respectively, in annual mean amounts of precipitation, potentially indicating changes in the overall availability of water, all around the globe. The precise patterns and anomalies, although reasonably well smoothed by the spatial-averaging technique, are not to be counted on to the level of detail of individual grid boxes, because of the (coarse) resolution of the grid used in the prediction model. Also, the magnitude of the predicted changes should be considered indicative rather than precise, since only partial corrections have been made to the variance of the model output. It is recognised that in practice precise magnitude and location of anomalies are very important, but deriving such level of detail from coarse-resolution models is, at best, a complex task and it has not been attempted in this study. Following the IPCC approach, anomaly values are only plotted on the best estimate maps at points where at least 7 (of the total 10) ensemble members agree, in sign, with the ensemble-mean prediction (the sign agreement is on predictions of 9-year averages). In addition, a version of the maps is available with the anomaly values plotted only at points where all ensemble members agree, in sign, with the ensemble-mean prediction (to highlight the points where there is highest confidence, based on this ensemble prediction system, in the predicted sign of change) see Figure A1 in appendix. 3 Results presented in the section on model evaluation, based on a limited comparison, suggest that levels of variability in annual-mean precipitation changes are similar in DePreSys predictions and observations. 13
14 Figure 4 Changes in annual-mean precipitation (in mm/day, top panel, and as percentage of present-day climatology, bottom panel) predicted for the 2020s; the anomalies are averages over 9 years centred on the target date ( ) 14
15 Figure 5 10 th and 90 th percentiles of predictions of changes in annual-mean precipitation in individual years around 2020 (estimates based on 9 years centred on the target date; 9 grid-point averages plotted at each location) 15
16 Figure 6 Changes in precipitation (in mm/day, top panel, and as percentage of present-day climatology, bottom panel) predicted for the 2030s; the anomalies are averages over 9 years centred on the target date ( ) 16
17 Figure 7 10 th and 90 th percentiles of predictions of changes in annual-mean precipitation in individual years around 2030 (estimates based on 9 years centred on the target date; 9 grid-point averages plotted at each location) 17
18 Broadly speaking, the predictions for the two target periods are similar in sign over land areas. The expected changes appear to be spatially coherent, over land, and mainly large scale. More than 66% of ensemble members are in agreement on the reduction in annual mean precipitation in northern South America (with all ensemble members predicting such reduction in northeastern Brazil Figure A1 in appendix), where these changes would constitute more than 10% of the current annual precipitation amounts; this reduction is predicted to exacerbate in time. It is also predicted that parts of southern Africa will experience a reduction in annual precipitation amounts, while areas in western and central Africa could see an increase in the total precipitation amounts. India and the area immediately to the north is predicted to expect an increase in annual precipitation amounts, which would constitute up to 25% increase relative to current amounts, in many places. In the northern extratropics the predicted change is towards increase in the annual mean precipitation, with good agreement between the ensemble members - the increases by 2030 representing between 5% and 25% of current amounts. The same is true for much of eastern Asia. Over the central and southern parts of North America the predictions are less robust, apart from in parts of the western United States where a decrease in total precipitation amounts is predicted to occur around 2020 and persist beyond. Little change in amounts is predicted over the Mediterranean basin, northern Africa and central and southwestern Asia however, even such small amounts represent 5%-25% decrease on the current climatological amounts in the Arabian peninsula and parts of the Mediterranean region. The changes predicted over most of Indonesia, although seemingly sizeable in amounts, represent no more than 5% of the present-day climatology over most of the area (predictions for this area should be viewed with caution: here, the differences between modelled and observed climatologies are relatively large Figure 2, pointing to possibly large model errors). The areas of land with largest predicted relative (to present day) changes by 2030 are parts of northestern Brazil (more than 25% reduction in precipitation) and an area to the northwest of the Indian peninsula (more than 25% increase in precipitation). According to the model used in this study, these changes are robust, occurring in all 10 ensemble members (see Figure A1). Large changes are also predicted over the oceans, mostly in the tropics it is likely that these changes are due to a change (predicted by the model) in the average position of the intertropical convergence zone, which modulates the precipitation in the region. Although at many grid points agreement between the ensemble members on the sign of predicted changes in 9-year means is good, the range of variability in the predictions for individual years remains large. The 10%-90% confidence interval estimated according to the method described above encompasses zero at almost all points on the globe (see Figure 5 and Figure 7). That means that, based on this ensemble of predictions, at all these points changes of the opposite sign to that shown as best estimate cannot be ruled out for individual years (as they are estimated to have at least 10% chance of occurring). Timeseries illustrating predicted year-to-year variations in annual means for large-area averages are presented for the Giorgi regions described in the previous section. Figure 8 illustrates, for each of these regions, the ensemble-mean prediction in black, with the full range predicted by the ensemble in black vertical lines: the thick section of the vertical line covers predictions from 8 of the 10 members, with the ends of the thin black 18
19 vertical line representing the extreme member prediction at each end of the range for the given year (note that the identity of the members is not preserved in this plot for example, it is not necessarily the same member which predicts the largest change in precipitation amount for all years). The read line, for each region, illustrates the 9-year running means centred on the respective year. Individual member predictions for the Giorgi regions, which illustrate the year-to-year variability as represented by the model, are also available (Figure A10). From either of these representations it is clear that the uncertainty in the predictions is large, compared to the ensemble-mean changes. For some regions, the predictions exhibit trends over the forecast period (noticeable in the smoothed timeseries) e.g., Alaska and East Asia increasing trend, the Amazon basin and Southern Africa decreasing trend. However, with very few exceptions, anomalies of opposite sign to that of the long-term trend cannot be ruled out in individual years. One disadvantage of the Giorgi regions is that they may encompass areas where predicted changes are of opposite sign. The west-african region is an example: Figure 4 and Figure 6 show predicted increases in the north of the region and decreases in the south; as a result, the area-average changes throughout the period are small. 19
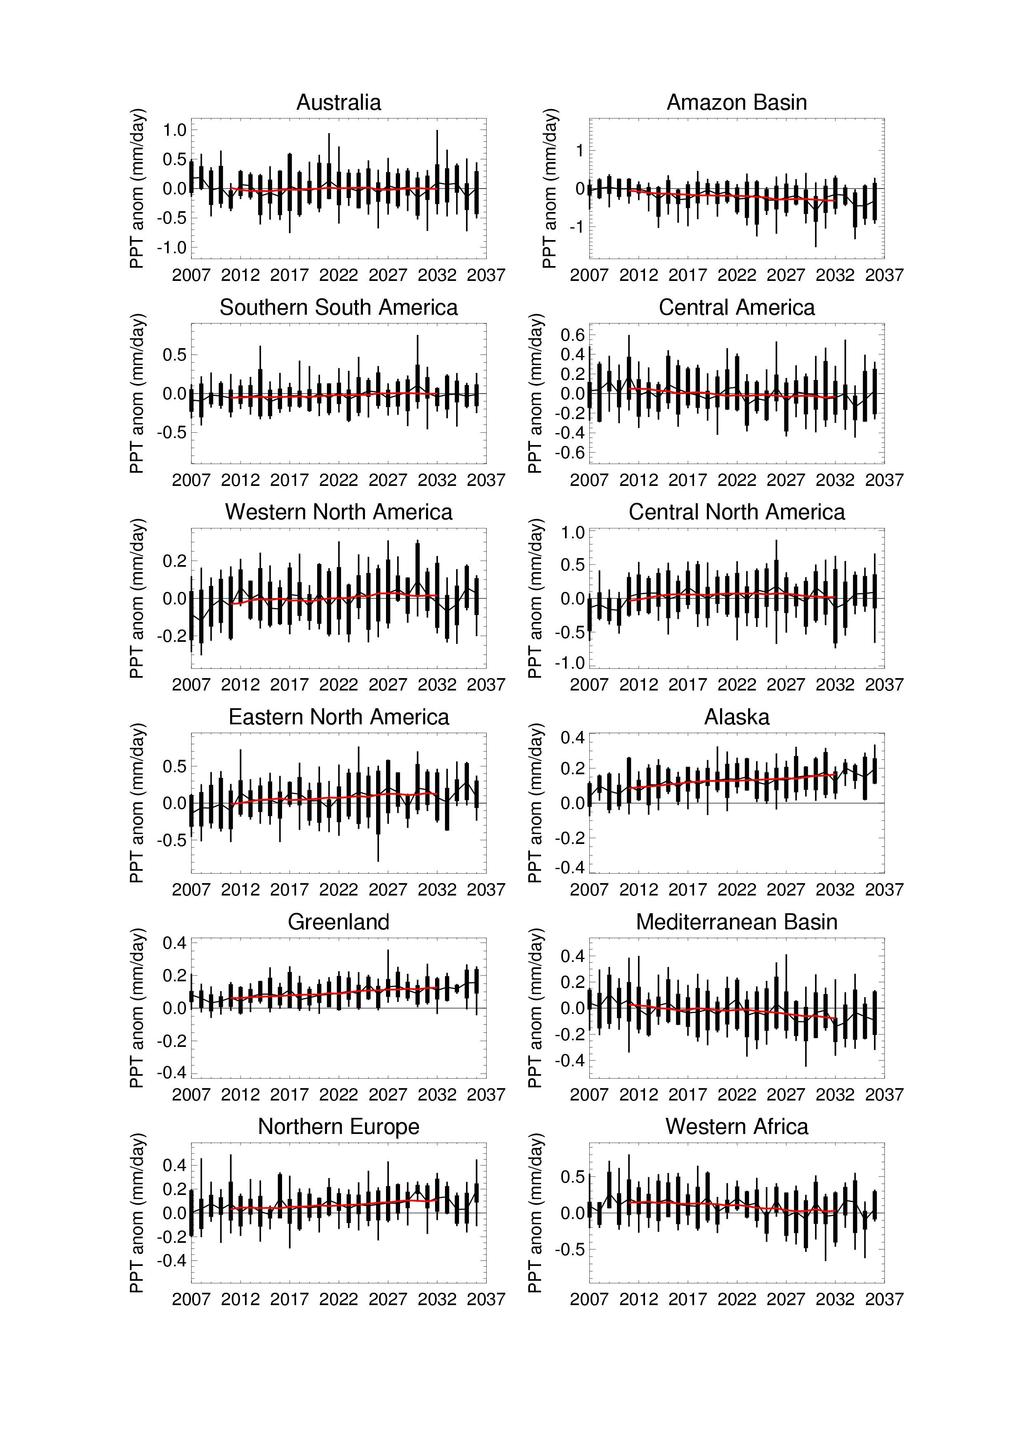
20 20
21 Figure 8 Predictions for annual-mean precipitation changes over each Giorgi region: vertical lines range of predictions (thick part covers 80% of predictions, thin parts either side extend to cover 10% of remaining predictions each), horizontal black lines ensemble-mean predictions for individual years, red lines ensemblemean predictions for 9-year means centred on each year 21
22 Seasonal means A breakdown of the predicted changes by season is illustrated in Figures A2-A5 (appendix), where twelve 3-month seasons are analysed separately. This presentation of the data is useful for relatively in-depth regional information e.g. are changes predicted to happen uniformly through the year, or predominantly in the rainy season, in places where rain is a seasonal occurrence? Analysis of all possible 3-month seasons is necessary, since the annual cycle of seasonal precipitation can be very different in different parts of the world. It is easily noticeable that the agreement within the prediction ensemble is less widespread than in the case of the annual averages. Changes in relatively short-period averages (seasonal and monthly), or over relatively small areas, are likely to be influenced by unpredictable, fast, variations in atmospheric conditions to a larger extent than larger-area or longer-term averages; the latter are more likely to change as a result of slow-varying, and therefore more predictable, oceanic conditions. Analysing the changes season-by-season highlights regions where changes are predicted to happen uniformly through the year (at least to the extent of the sign of the change); northeastern Brazil, western North America and southern Africa to some extent, are all predicted to experience drying in all seasons. It also becomes apparent that there are regions where changes of opposite sign are predicted to happen at different times of year, which cancel out in annual averages for example eastern Africa (April-June and July- September in 2030) and the northwestern edges of South America (March-May and August-October); see Figures A2 and A4 in appendix. These changes may not be important for overall water availability, but arguably will be important for managing water resources within the year. Monthly means The breakdown of the changes into monthly means adds an extra level of detail, though at the expense of decrease in agreement within the ensemble (the number of points at which changes are plotted, where the sign of change predicted by the ensemble mean is the same as that predicted by more than 66% of individual members, is smaller than that on the maps of seasonal means, which in turn is smaller than that in the maps of annual means). For example (see Figure A8 in appendix), information on changes in monthly means confirms the expectation that the increase in annual-mean precipitation over India in 2030 is due to increased rainfall predicted for the summer and autumn months, while very little change is expected in the rest of the year. For some areas, however, this level of information is not available if a degree of robustness in the predictions similar to that imposed here (good agreement between individual predictions) is required. Predictions of changes in monthly means provide a compromise between robust estimates (long-period averages) and practical need for information on extremes (highfrequency data, which affect the potential for flooding or drought). Figures A3, A5, A7, A9 (appendix), which show ranges in seasonal and monthly means in individual years, bring little supplementary information by comparison with the similar plots for annual means. There are virtually no land areas where the changes (in the seasonal or monthly means) are confined to one sign by the 80% range bound by the 10 th and 90 th percentiles of the ensemble predictions. Not surprisingly, the range of possible changes to 22
23 be expected in individual years, illustrated by the 10 th and 90 th percentiles of ensemble predictions, is larger for monthly and seasonal averages than for annual averages, especially in place where precipitation is predominantly seasonal or where changes are expected not to occur uniformly through the year Predicted changes in short-period precipitation extremes Certain types of water supply and sanitation technologies in wide use are sensitive to periods of intense rainfall over a few days. For example, water in open wells is prone to contamination under flood conditions. Potential changes in such extremes cannot be discerned from the predicted long-period-average changes discussed above. In this section we investigate predicted changes in extreme rainfall by directly assessing changes in the intensity of very-wet 5-day periods. The 5-day time span used is somewhat arbitrary, but has been chosen in order to capture intense rainfall spells long enough to increase risk of flooding, but short enough to exclude cases where intervening dry days may allow some natural drainage (thus decreasing the flood risk). We also examine changes in the frequency of 10-day continuous dry spells, on the assumption that increases in frequency of such events will have greater impact than a more uniform lessening of rainfall even when resulting annual mean changes are similar in both cases. More extreme events (with potential for more severe impacts), like intense 1-day precipitation events, or periods of no rain longer than 10 consecutive days, are not assessed here. As potential for increased flood risk is likely to be better gauged from predicted changes to absolute amounts associated with very wet 5-day periods than from percentage changes (as percentage changes can be large even when amount change are relatively small), we focus here on predicted absolute changes. It must be emphasised that the predicted changes are changes to averages over the large geographical areas represented by each grid box. Thus the extreme events addressed here are essentially large-scale extreme events, and the numerical values cannot be used directly to judge potential increases in the localised extreme events which will more frequently be the cause of adverse impacts. Nevertheless it can be assumed that increased intensity of the large-scale extreme events implies increased intensity of localised events. Downscaling the predictions has been beyond the scope of this study, but would be useful to obtain information on likely impacts at local scales. The predicted changes to large-scale extreme events add illustrative detail to the changes in annual, seasonal and monthly totals. Because the same prediction model is used, we can expect the changes to extremes to be broadly consistent with those found for seasonal and annual periods. However, there is much less potential for validation of predicted changes to extremes, than predicted monthly, seasonal or annual changes. This is because there is less observed ground truth on daily precipitation climatology, and few similar prediction studies with other models which might enable a qualitative comparison of results. Moreover, the 9-year windows used to represent present-day and 2030 conditions may be too short to provide robust climatologies of extreme rainfall. As an indication of the model s ability to reproduce 5-day precipitation amounts, Figure 9 illustrates a comparison of observed and predicted total precipitation amounts during the wettest 5-day period during , at each grid point (as they are averages over the 23
,")
24 area of a grid box, each of these amounts are only indicative of the true local extreme rainfall). The observed values plotted on the map are from the CMAP dataset described in section 3; the model values are a mean of 8 ensemble members from DePreSys hindcasts, (4 started in 1984 and 4 in 1985), the same hindcasts used as baseline for estimating the changes around Figure 9 Amount of rainfall (mm/day) in wettest 5-day period during ; top panel - observations, bottom panel model The correspondence is reasonably good, especially over land, with broad-scale similarity in the patterns, if not always in the magnitude, of the most intense 5-day rainfall events. The differences are an indication of model biases and of sampling issues, though uncertainties in the observed data are likely to be important, as well. This comparison provides some indication that the model can produce events with intensity comparable to observations in approximately the right places. For applications at particular locations, more detailed comparison would be needed, provided suitable observations were available. For the various reasons discussed above, the results presented below must be considered to represent possible changes to large-scale extreme rainfall events that are 24
25 consistent with the signals for longer-period-average changes presented previously. Because of the indicative nature of the results, only the 2030 window is addressed. Procedure for very wet 5-day events The procedure used follows a two-step approach. Firstly, a reference for the present day intensity and frequency of very wet 5-day periods is generated using 8 ensemble members from hindcasts for the 9-year period centred on 1989 ( ; chosen because of availability of large enough sample of daily hindcast data). For each ensemble member, and at each grid box, the entire 9-year sequence is divided into non-overlapping 5-day periods. The 5-day periods are then ranked in decreasing order of magnitude, such that rank 1 corresponds to the wettest 5-day period in the sequence. The 5-day rainfall totals corresponding to matching ranks in the 8 ensemble members are then averaged, providing an ensemble-mean reference for the wettest, second wettest etc, 5-day periods under current (1989) climatology. Secondly, a similar ranking process is conducted for 5-day rainfall totals in each of the 10 ensemble members in the DePreSys prediction, using the 9-year sequences for For each ensemble member differences are calculated between the predicted 5-day totals and the totals of the matching rank in current (model) climatology calculated in the first step, to remove the mean model bias. Thus a sample of 10 potential changes to the intensity of the wettest, second wettest etc. 5-day periods is obtained. The sample provides a measure of the uncertainty in the predicted changes and is used to estimate the 10 th and 90 th percentile of changes (for brevity, referred to as the upper and lower estimates). These uncertainty estimates are the best objective measures available with the current method, but for the reasons stated above are almost certainly underestimates of the true uncertainty range. Results for very wet 5-day events Lower and upper estimates of absolute changes in the wettest (rank 1) and 9 th wettest (rank 9) 5-day periods, representative for 2030, are provided in Figure 10. The rank-1 event occurs once in the 9-year sample and in simple terms has return period of 9 years. Rank -9 or wetter events occur 9 times in 9 years, and thus have a return period of 1 year. There is consistency in the changes for rank 1 and rank 9, as well as for less extreme ranks (not shown). The similarity in sign of change for neighbouring ranks indicates that results are not over-sensitive to small changes in the rank, suggesting that the distribution for a given rank is less likely to be the result of random extremes than that of organised large-scale changes captured by the ensemble, and adding confidence to the robustness of the analysis. It is also notable that, in most regions, the sign of the change differs between the lower and the upper estimate, indicating that there is relatively large spread in the ensemble. Exceptions are small areas in northeastern South America and the Arabian peninsula, where the 80% range appears to confine the predicted changes to a range between no change and reduction in the amount received during the wettest events, and parts of central Africa, where changes (in 80% of the predictions) range between no change and small increase (of up to 30mm in 5 days at grid-box scale) in the wettest events. Predicted changes are small in less extreme wet ranks (of which only rank 9 is shown here), with the range of changes, in most places, predicted to be between decrease and increase of up-to 15mm/pentad (at grid-box scale). 25
26 Figure 10 Predicted 2030 change in total rainfall associated with (a) the rank 9 and (b) the rank 1 wet 5-day periods, in mm/pentad. Left/right hand plots show the 10 th /90 th percentile changes (calculated as average of predictions from 1 st and 2 nd /9 th and 10 th member) respectively, at each grid point; 8 of the 10 memberpredictions fall within the range between the lower and upper estimate. Changes are based on differences in 9- year samples centred on 2030 and 1989 (for present day climate). See text for further details. For the assessment of the impact of changes in wet extremes on the vulnerability of water supply and sanitation technologies, an estimate of the most likely predicted changes at each location is required. It is recognised that the most important threat for many of the technologies addressed here is likely to be the increase of the potential for flooding. To the extent to which an increase (of any severity) in amounts of precipitation received in 5 consecutive days increases the risk of flooding (and assuming that such increases will be reflected in values of grid-box averages), the proportion of ensemble members predicting increases in 5-day amounts is provided for this purpose (and illustrated in Figure 11). This is intended as an indication of the confidence in the predictions of increases, without detail about the severity of the increase bounds on the magnitude of the potential changes are provided by the 10 th and 90 th percentile estimates. These maps of grid-point values clearly indicate whether the more likely outcome predicted by the DePreSys ensemble for each location is of reduction (where fewer members predict increases than decreases) or of increase in 5-day precipitation amounts. For top-rank events the predictions show relatively few places with, confident changes (the most notable being small parts of northeastern Africa and the Arabian peninsula); for rank-9 events the pattern highlights larger areas where the predictions indicate low risk of increase in wet-event intensity (e.g. northeastern Africa, the Middle East and the 26
27 Mediterranean basin, parts of northwestern Africa, western parts of southern Africa, eastern Australia and northeastern Brazil). Areas where the ensemble predicts sizeable risk of increase in intensity over land are mostly in the northern hemisphere, away from the tropics. Figure 11 Uncertainty in predicted increases in 5-day precipitation amounts: each colour represents a number of ensemble members indicating increases, white covers the places where 4, 5, or 6 members predict increases. Further analysis for a region of western Africa, centred at 0 E, 10 N, and a region of southern Africa, centred at 20 E, 25 S, is presented in Figure 12 as example to highlight consistency of changes through the top ranks of the 9-year sequences. The changes in totals over 5-day wet events around 2030 are shown for the top-100-ranking events. Here, changes in the median, 10 th and 90 th percentiles are calculated using data from all 10 ensembles from a 3x3 grid array centred on the location (90 samples). Figure 12 Predicted changes in 2030 rainfall totals associated with the top-100-ranking wet 5-day events, extracted for a grid box location: 0 E, 10 N (in West Africa), left panel, and 20 E, 25 S (southern Africa), right panel. The median, 10 th and 90 th percentile changes are shown. Changes are based on differences between 9-year samples centred on 2030 and 1989 (for present day climate). See text for further details. For the location in western Africa the 10 th -90 th percentile range covers changes from decreases of around 15mm/pentad to increases of around 10mm/pentad (for the top few ranks). Changes predicted for less extreme ranks are smaller, but their ranges include zero. The relatively smooth nature of the dependency on rank suggests that results are not unduly sensitive to the precise rank selected (i.e. similar results are obtained for neighbouring ranks), and this adds confidence in the robustness of the analysis. 27
28 For the location in southern Africa decreases in rainfall totals associated with very wet 5- day events are indicated with confidence for all but the top 20 ranks. The upper estimate changes indicate the potential for increases of up to 10mm/pentad in the most extreme events. As for the location in western Africa, comparable changes are predicted for neighbouring ranks. Results for dry 10-day events Predicted changes to dry events have been assessed using the same reference and predicted 9-year sequences of daily rainfall used for the wet events. Here the analysis is based on changes in the number of dry events (rather than on the amount of rainfall change, as for the wet events). For the dry events, the sequences were divided up into 10-day non-overlapping periods. A dry 10-day period was defined as one in which total rainfall over the 10-day period does not exceed 1mm (this method masks periods of no rain longer than 10 days, potentially of more sever impact; also it does not take into account the seasonality of these occurrences, which in some places might be important). The number of dry 10-day periods is counted in each of the 8 ensemble members for the reference period (their ensemble mean is used as an estimate of the baseline) and in each of the 10 ensemble members for the predicted period. The individual memberpredictions for the future are expressed as differences from the baseline. Figure 13 Change in the number of dry 10-day periods (totals not exceeding 1mm) per year. Left/right hand plots show the 10 th /90 th percentile changes (calculated as average of predictions from 1 st and 2 nd /9 th and 10 th member) respectively, at each grid point; 8 of 10 member-predictions fall within the range between the lower and upper estimate. Changes are based on differences in 9-year samples centred on 2030 and 1989 (for present day climate). See text for further details. As in the case of the wet events, in most places on land the 10%-90% interval predicted by the model ranges from decreases to increases in the number of dry 10-day periods (Figure 13). Exceptions are areas in central and eastern South America, southern Africa, the Mediterranean basin and coastal areas of western North America all areas predicted to experience reduction (or no change) in annual-mean rainfall around Also, areas in northern high latitudes show small chance (less than 10%, based on this ensemble) of increase in the number of dry 10-day periods, consistent with predicted increases in annual-mean precipitation. Finally, it must be stressed that the method used here to select periods describing extreme events is likely to provide underestimates of true extremes: by pre-defining the 28
29 periods, and allowing no overlap, there is potential to miss extreme events (both wet and dry) which would occur over all or part of neighbouring such periods. The effect of this artefact on estimated changes in true extremes has not been evaluated. 5. Model evaluation For predictions to be a useful tool in the decision-making process, it is important to gauge the capacity of the system they are derived from to predict future changes in climate. There are many approaches to evaluating the capabilities and limitations of climate models and the perceived quality of the predictions based on them IPCC s 4 th assessment report presents an overview of the topic. Numerous studies have quantified various aspects of the performance of the Met Office Hadley Centre s climate model (HadCM3) which DePreSys uses. Here we bring some arguments in favour of the use of DePreSys for this set of predictions, as well as highlighting the limitations and caveats that inevitably have to accompany them. The scope of the present study does not extend to an exhaustive comparison between the several modelling systems potentially available for use, and thus the question of whether the predictions included here are the best possible estimates available at present cannot be answered rigorously. Instead, we investigate whether, broadly speaking, other prediction systems would have provided very different predictions from those obtained from DePreSys. Also, we briefly assess how well the model predicts changes in climate observed in the (recent) past. The obvious reason for using DePreSys as the system of choice for this study is its design : based on a well established climate prediction model (HadCM3), it contains enhancements which should, in principle, improve the prediction skill for the near future. It is unclear whether the addition in predictive skill (noted by Smith et al, 2007) extends up to 30 years into the future, or whether the skill identified in predictions for large-scale, long-term variations in temperature translates into improved skill at regional level, for shorter-period averages (or for extremes) in precipitation. It is generally accepted that, broadly speaking, predictability decreases with the decrease in spatial and temporal scale. To set the DePreSys predictions into a wider context, Figure 14 shows a comparison between the DePreSys predictions and predictions for the same period derived from the IPCC s AR4 multi-model ensemble and the QUMP ensemble (both described in the section on data and methods). 29


30 Figure 14 Predictions of relative changes in annual-mean precipitation in 2020 (left column) and 2030 (right column); top: AR4 multi-model ensemble, middle: QUMP perturbed physics ensemble, bottom: DePreSys. Colours plotted where more than 66% of ensemble-member predictions agree in sign with the ensemble mean. There are similarities between the three sets of predictions: the changes are of the same sign over large areas in the mid-latitudes, both in the southern and northern hemisphere, as well as over southern Africa and areas of the Mediterranean basin around More similarities still are apparent between the predictions from the QUMP and DePreSys ensembles, notably over areas of northern South America, the Indian peninsula and parts of central Africa. The similarities in the predictions using the three different sources of information are encouraging, especially as the differences in the prediction systems are not all negligible 30
31 (this suggests that the anthropogenic effect, which should be common to all models, is a substantial part of the predicted change). There are three main differences between the prediction systems. Firstly, there is a difference in the concentrations of greenhouse gases used by the three prediction systems: while QUMP and AR4 use the A1B emissions scenario, DePreSys uses B2. The differences in global mean temperature predictions using different scenarios do not become significant until after 2030 and, to the extent to which regional precipitation is modulated by changes in global mean temperature, the differences due to the scenario used as external forcing are not important. More important may be the differences in the assumptions on aerosol concentrations used in the individual models, as well as the differences in the schemes used for modelling aerosol influences on the climate system. Secondly, the AR4 multi-model and the QUMP ensemble sample uncertainties due to differences in the physics of the component models, DePreSys does not. A good indication of the consequences this has on the predictions is the level of agreement within each ensemble: agreement (indicated by the number of coloured points in the plot) decreases from DePreSys, through QUMP, to AR4, indicating that fewer possible future alternatives are described by an ensemble (DePreSys) which uses the same underlying model. DePreSys appears to add confident information (in the convention adopted here) at points at which the other ensembles are too uncertain to offer it, but to which extent this is true information (rather than simply an artefact of under-sampling the true uncertainties) it is unclear. It is likely though that the uncertainty quantified by DePreSys underestimates the true climate-change uncertainty expected in the real world. Thirdly, at points in the future when the changes in the climate are believed to be due mainly to past external forcings (greenhouse gas emissions) and natural variability of the system as in the starting point of the prediction is likely to add important information to the prediction process, by bringing in a quantitative measure of these contributing factors. The DePreSys predictions, started from a reasonably comprehensive knowledge of the current state of the climate system, are different in this respect from the AR4 and QUMP projections. Arguably, the main differences in the predictions derived from the three different systems can be explained by the differences in the formulation of the physical processes represented in the models and the potentially different phase of natural variability the systems sample. As a consequence, the comparison provided here is useful to set the DePreSys predictions in the context of the currently available information on possible states of the climate system in , available at present. It does not provide a definitive answer to the problem of the relative merits of various prediction systems, as there is insufficient evidence to decide whether the more widespread agreement within the DePreSys ensemble is due to increased accuracy through better initialisation, or due to lack of variations in the physics of the members of the ensemble. In terms of comparison with observations, two diagnostics are provided here on a small sample of DePreSys predictions. Figure 15 shows a (deterministic) comparison between a DePreSys forecast initialised with conditions observed in June 2005 and corresponding observations, over the period 31
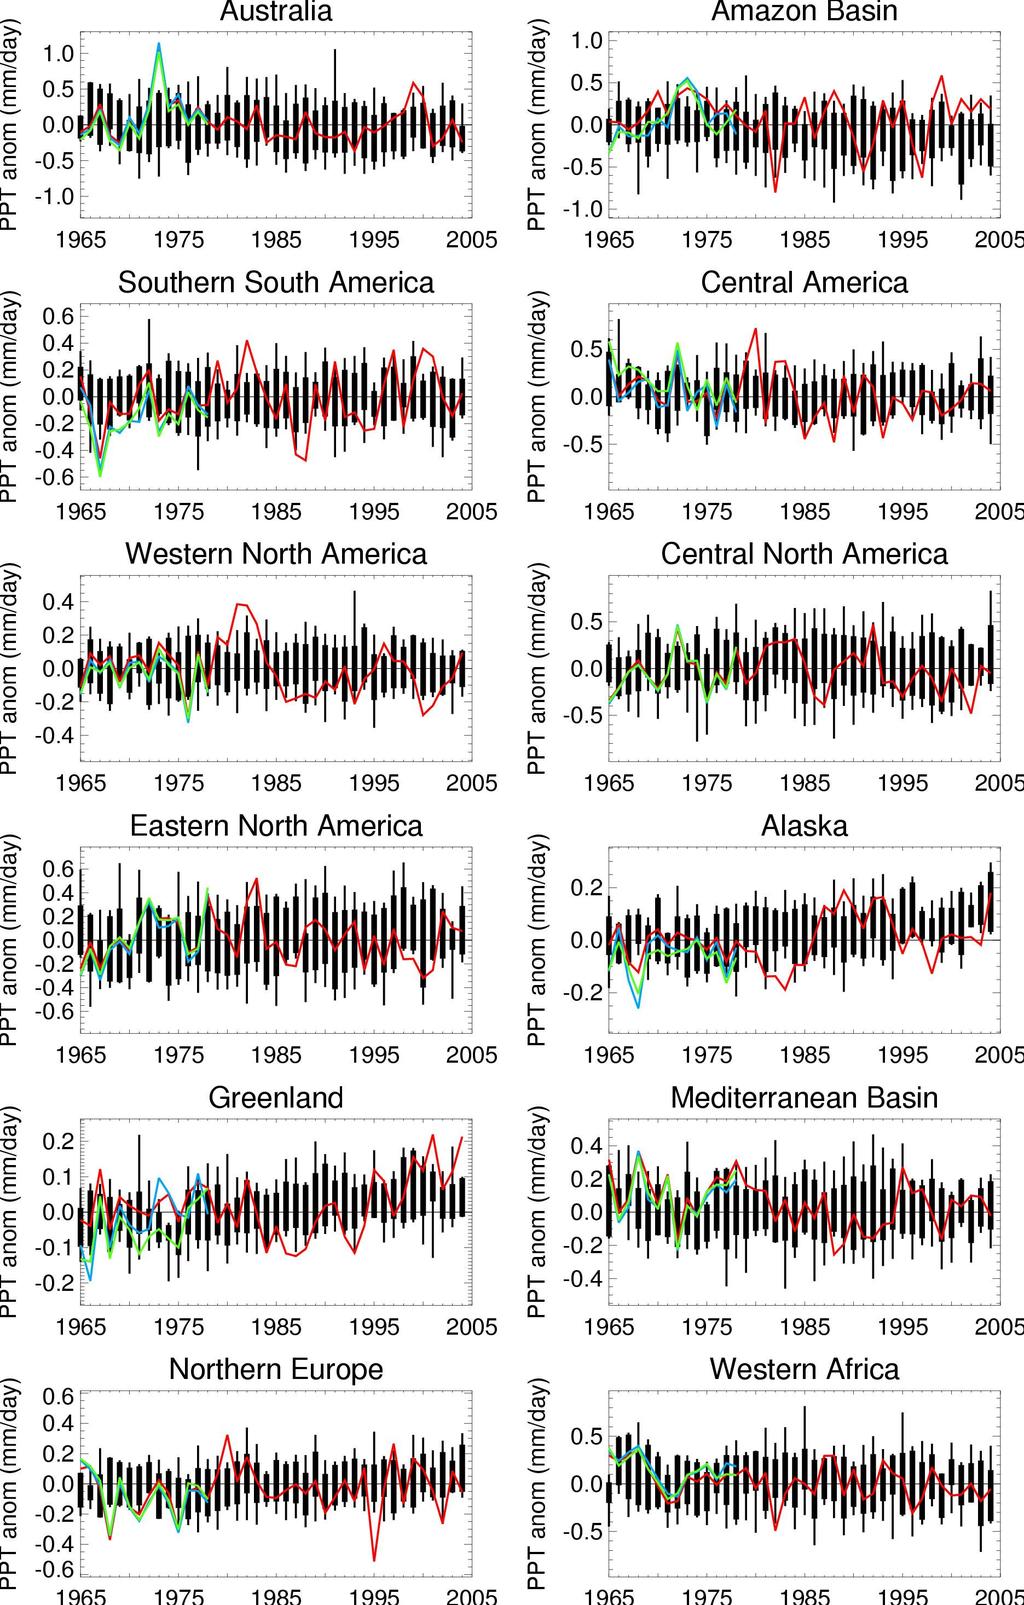
32 June 2005 to February 2008 (the period for which observed data was available at the time of the analysis). The lead time and verifying period are too short to provide indications on the credibility of forecasts to 2030, and the correspondence of one forecast and observations would in any case be insufficient to draw any statistically significant conclusions. However, the similarity in large scale patterns is encouraging despite areas of disagreement (e.g. southwestern Africa). Such a forecast is not expected to be right (in the deterministic sense) everywhere, especially when verifying relatively short (less than 3-year) averages, which are more sensitive to interannual variability influences than longer averages. Figure 15 Predicted (right) and observed (left) changes in precipitation over the period June 2005-February 2008, relative to climatology (expressed in percentages) Forecasts started from dates in the recent past have the advantage of being initialised with many good observations, of quantity and quality comparable to those a real-time forecast might be based on, but also the obvious disadvantage of short verification period. To investigate further the influence that starting conditions have on the ability of the model to represent observed changes, the two 30-year 10-member hindcasts initialised in 1965 and 1975 (and discussed above) are used. With the caveat that these forecasts are initialised with relatively fewer observations (especially the 1965 hindcast) than the forecasts started in 2007, they are expected to offer insight into the likely skill of the model in 30-year runs. The starting points for the two case studies were chosen to sample different conditions in the North Atlantic (believed to influence global precipitation changes on these timescales): conditions in 1975 were in a sense opposite to those in 2007, the start of the forecast used in this study (in 1975 the Labrador Sea was cold and fresh, in 2007 warm and salty); 1965 was chosen for being from a different decade. A set of hindcasts is currently being produced to systematically sample the period from 1960 to the present, but was not available to this study. Figure 16 shows, for each Giorgi region, a merged timeseries of predicted annual means, from both hindcasts, overlaid, in each case, with a timeseries of annual mean observed values (red line). 32
33 33

34 Figure 16 Range of changes in annual-mean precipitation predicted by two 10-member 30-year hindcasts started in 1965 and 1975 respectively. In black, 80% predicted range in thick lines, with 10% of predictions either side of the 80% interval; in colour, observations from several datasets The ensemble member predictions are plotted to emphasise the uncertainty in the prediction as described by this system, with 80% of predictions highlighted (in bold lines), leaving 10% of predictions either side of this interval. For the 20 years of overlap (
35 1994), the range is estimated using all 20 available members (the forecasts errors in the two hindcasts are comparable, so no distinction is made between them in this illustration). From 1979 to 2005 observations are derived from the GPCP dataset; for the preceding period three different datasets of observations are used and plotted, to highlight possible uncertainties in the observations record in the early part of the period (see details on data used in the section describing the data). There are variations from region to region in the degree to which the range predicted by the ensemble covers the respective observation. In particular, year-to-year variations are not very well represented. (As mentioned before, the system is not expected to predict individual years accurately; this example shows that the model predicts ranges of outcomes, rather than precise values.). For example, for the regions of western and southern Africa there is relatively good agreement between forecasts and observations, but in western North America and Southeast Asia multi-annual variations seem to be missed. An encouraging point is that DePreSys appears to contain levels of variability (in annual means) comparable to those observed. Illustrations based on the two 30-year hindcasts cannot lead to definitive, statistically significant conclusions about the overall skill of the prediction system; however, as case studies they bring insight into its potential capabilities. Although results presented in this section are encouraging indications that realistic precipitation predictions are achievable, much more is needed to fully quantify the credibility of these predictions and realise the full potential of the decadal prediction system. In particular, further analysis of long-lead-time predictions and estimates of statistical significance of the findings would add information on the level of detail the system, in its current form, is able to provide. No evaluation is attempted for the performance of the model in reproducing changes in extremes similar to those analysed in section 4.2, mainly because of poor availability of suitable verification data. 6. Concluding remarks It is expected that a prediction system initialised with observations, like DePreSys, will be better at representing near-future, relatively short-term averages than one not initialised. This is primarily because short-term-average conditions in the near future are expected to be influenced in good part by internal, natural variations of the climate system, which a system like DePreSys is designed to capture. To date, evidence is scarce on the capacity of DePreSys to predict such changes in precipitation in the recent past, or on its superiority in this respect when compared with predictions from uninitialised models, but a few case studies have been presented which offer support to the expectations. Additionally, the 10-member single-model ensemble the DePreSys predictions are based on is likely to underestimate the full range of uncertainty. With the above remarks in mind, the following conclusions can be summarised. Patterns of changes predicted for the period around 2020 appear spatially coherent, and are mainly large scale. They are broadly similar to the patterns of predictions for the 35
36 period around This is likely due to the fact that these changes are mainly caused by anthropogenic emissions. Another possible cause could be the fact that natural variability in the model is in the same phase over the two periods (e.g., same number of El Niño/La Niña events in each) this alternative is very unlikely, but has not been investigated, and therefore cannot be been ruled out. For both periods, the changes in period-means appear to have similar sign for entire bands of latitude: broadly speaking, the deep tropics are predicted to become wetter, the subtropics drier and the mid-to-high latitudes wetter than in the present-day climate. The regional changes in annual-mean precipitation predicted by the decadal prediction system can be grouped according to the degree of (model) consistency associated with them: changes supported by all models analysed here (IPCC models and Met Office Hadley Centre models): increases in the high latitudes, both in the northern and southern hemisphere already evident by 2020, predicted to continue to at least the 2030s, and decreases in Southern Africa, in parts of Central America and of the Mediterranean basin, predicted to become apparent around 2030; additional changes supported by all Met Office Hadley Centre models analysed here: decreases in northern South America and in some areas of Central America, apparent by the 2020s, exacerbating by the 2030s, and increases over parts of central Africa and South Asia, the latter also becoming apparent by the 2020s and persisting or increasing further by the 2030s; additional changes, which are confidently predicted by DePreSys (all 10 members of the forecast agree on the sign of the change): decreases in the coastal regions of western North America, starting in the 2020s and in the Mediterranean region around 2030, and increases in parts of the Sahel region of western Africa. It must be stressed that even the changes predicted with high confidence by one or several models remain subject to model error, and thus cannot be guaranteed. Changes are not predicted to happen uniformly through the year: a full set of maps is available (in the appendix), which illustrates the changes predicted by the decadal system for each month of the year and each of twelve 3-month seasons. These offer the possibility to estimate whether the predicted changes are expected to happen at a time of year when they would contribute to intensifying the currently observed annual cycle. Indications are that most of these predictions are uncertain, from the low level of agreement between models on the sign of change in many regions, in the IPCC or the QUMP models, to the wide range of possible outcomes identified as a 10%-90% range in the DePreSys ensemble prediction. There are virtually no land areas where the predicted changes (in the annual, seasonal or monthly means, in individual years) are confined to one sign by the 80% range bound by the 10 th and 90 th percentiles of the ensemble predictions. Precipitation amounts associated with large-scale extreme events, both wet and dry, occurring over periods of a few days are also predicted (by the decadal system) to change by These changes, though potentially more predictable by models, and undoubtedly of more interest in practice, have been less comprehensively assessed, 36
37 especially as far as assessing the realism of the model predictions goes. They are, however, an indication of the possible outcomes that could increase current vulnerability of water technologies to climate. Over most land areas, the range of potential changes in the intensity of large-scale 5-day wet events predicted by DePreSys ranges between decreases and increases. Estimates based on the number of members in the prediction ensemble indicating increases in such events occurring, on average, once a year indicate relatively few areas where the risk of increases in intensity are low; uncertainty in even the sign of the predicted change is large in most places. Areas of predicted low risk are northeastern and southwestern Africa and eastern Australia, as well as parts of the Middle East, northeastern Brazil and some coastal areas in western North America; areas in eastern Asia and parts of the northern extratropics show relatively large risk of increase in intensity of such events. Predicted changes in the number of continuous dry spells (of 10 day duration) also range, over most land areas, between decreases and increases. The more confident of these changes are well reflected in the best estimates of changes predicted for annual means, with increases in the number of dry 10-day periods per year predicted by 90% of ensemble members over parts of the Middle East and of southern Africa, central and eastern South America, areas of the Mediterranean basin and the coastal parts of western North America. Essentially, the present study offers a coherent, if very broad-scale, set of predictions, together with uncertainty estimates, for precipitation changes expected over the next 20 years. As such it provides a basis for supporting assessments of possible changes in vulnerability of water supply and sanitation technologies worldwide, and thus for informing evaluation of the risks and costs associated with achieving targets set in this area by the Millennium Development Goals, as well as the viability of the solutions adopted beyond the time set as target. There is potential to improve on the information provided in this study: in general terms, increased understanding of the capabilities of the model could inform assessments of the credibility of the predictions, and ultimately offer the possibility to combine sources of information to generate improved products. We suggest: extending model evaluation studies: evaluating, at least to the level of case studies, the model s capabilities to reproduce observed extremes, and also recently observed shifts in the climate of regions of interest, to predict variables and climate indices related to rainfall (using appropriate validation measures), as well as process-based assessment of past model predictions; improving post-processing of model output: evaluating other methods for deriving best estimates of changes relevant to the problems addressed, evaluating the statistical significance of the changes predicted and improving the estimates of uncertainty; refining and tailoring products to users needs: downscaling model output to scales relevant for applications and collaborating with users and local experts to combine the predictions with detailed understanding of the regional meteorology and of the strengths and limitations of climate models at regional scales. 37
38 References Adler, R.F., G.J. Huffman, A. Chang, R. Ferraro, P.P. Xie, J. Janowiak, B. Rudolf, U. Schneider, S. Curtis, D. Bolvin, A. Gruber, J. Susskind, P. Arkin, and E. Nelkin, 2003: The Version-2 Global Precipitation Climatology Project (GPCP) Monthly Precipitation Analysis (1979 Present). J. Hydrometeor., 4, Beck, C., J. Grieser and B. Rudolf, 2005: A New Monthly Precipitation Climatology for the Global Land Areas for the Period 1951 to Published in Climate Status Report 2004, pp , German Weather Service, Offenbach, Germany. Clark, R.T, Brown, S.J. and Murphy, J.M. 2006: Modelling northern hemisphere summer heat extreme changes and their uncertainties using a physics ensemble of climate sensitivity experiments. J. Climate, 19, Clark, R.T. and Brown, S.J. 2008: Model sensitivity of changes in precipitation extremes arising from CO2 doubling from physics ensemble sensitivity experiments (in preparation) Dai, A., I.Y. Fung, and A.D. Del Genio, 1997: Surface observed global land precipitation variations during J. Climate, 10, Giorgi, F., R. Francisco, 2000: Uncertainties in regional climate changes prediction: a regional analysis of ensemble simulations with the HadCM2 coupled AOGCM, Climate Dynamics, 16, Gordon, C, et al, 2000: The simulation of SST, sea ice extents and ocean heat transports in a version of the Hadley Centre coupled model without flux adjustments. Climate Dynamics, 16, Hulme, M., 1992: A global land precipitation climatology for the evaluation of General Circulation Models. Climate Dynamics, 7, IPCC, 2007: Climate Change 2007: The Physical Science Basis. Contribution. of Working Group I to the Fourth Assessment Report of the Intergovernmental Panel on Climate Change. Cambridge University Press, Cambridge, UK and New York, USA Murphy, J.M., et al, 2004: Quantification of modelling uncertainties in a large ensemble of climate change simulations. Nature, 429, Smith, D. M., S. Cusack, A. W. Colman, C. K. Folland, G. R. Harris and J. M. Murphy, 2007: Improved surface temperature prediction for the coming decade from a global climate model. Science 317, Xie, P., and P.A. Arkin, 1997: Global precipitation: A 17-year monthly analysis based on gauge observations, satellite estimates, and numerical model outputs. Bull. Amer. Meteor. Soc., 78,
39 Appendix Figure A 1 Predicted changes in annual-mean precipitation (ensemble mean), plotted at points where all ensemble members agree on the sign of change; see text for details 39
40 40
41 41
42 Figure A 2 Predicted changes in seasonal-mean precipitation in the 2020s ( ); see text for details 42
43 43
44 44
45 Figure A 3 Predicted 10%-90% range of seasonal-mean precipitation changes in individual years around 2020 ( ); see text for details 45
46 46
47 47
48 Figure A 4 Predicted changes in seasonal-mean precipitation in the 2030s ( ); see text for details 48
49 49
50 50
51 Figure A 5 Predicted 10%-90% range of seasonal-mean precipitation changes in individual years around 2030 ( ); see text for details 51
52 52
53 53
54 Figure A 6 Predicted changes in monthly-mean precipitation in the 2020s ( ); see text for details 54
55 55
56 56
57 Figure A 7 Predicted 10%-90% range of monthly-mean precipitation changes in individual years around 2020 ( ); see text for details 57
58 58
59 59
60 Figure A 8 Predicted changes in monthly-mean precipitation in the 2030s ( ); see text for details 60
61 61
62 62
63 Figure A 9 Predicted 10%-90% range of monthly-mean precipitation changes in individual years around 2030 ( ); see text for details 63
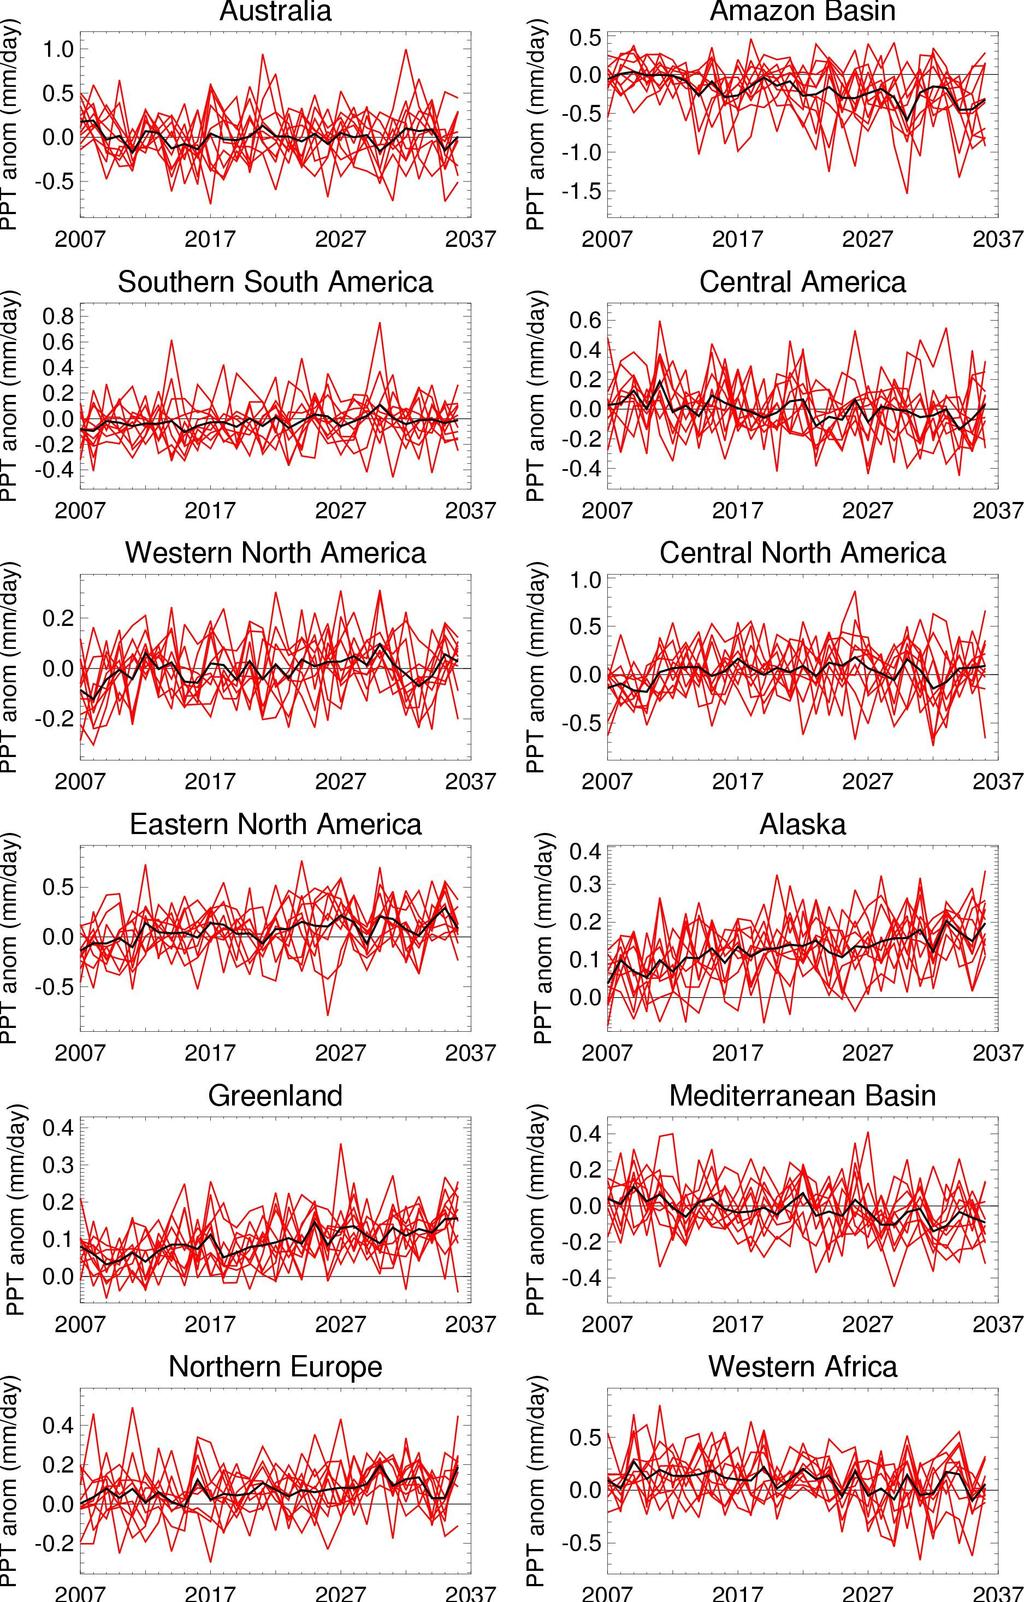
64 64

65 Figure A 10 Predictions for Giorgi-region averages of annual-mean precipitation; red lines predictions from individual ensemble members, black line ensemble mean; see text for more details 65
Seamless weather and climate for security planning
 Seamless weather and climate for security planning Kirsty Lewis, Principal Climate Change Consultant, Met Office Hadley Centre 28 June 2010 Global Climate Models Mitigation timescale changes could be avoided
El Niño 2015/2016 Impact Analysis Monthly Outlook February 2016
 El Niño 2015/2016 Impact Analysis Monthly Outlook February 2016 Linda Hirons, Nicolas Klingaman This report has been produced by University of Reading for Evidence on Demand with the assistance of the
Climate Change 2007: The Physical Science Basis
 Climate Change 2007: The Physical Science Basis Working Group I Contribution to the IPCC Fourth Assessment Report Presented by R.K. Pachauri, IPCC Chair and Bubu Jallow, WG 1 Vice Chair Nairobi, 6 February
Climate change and variability -
 Climate change and variability - Current capabilities - a synthesis of IPCC AR4 (WG1) Pete Falloon, Manager Impacts Model Development, Met Office Hadley Centre WMO CaGM/SECC Workshop, Orlando, 18 November
Mozambique. General Climate. UNDP Climate Change Country Profiles. C. McSweeney 1, M. New 1,2 and G. Lizcano 1
 UNDP Climate Change Country Profiles Mozambique C. McSweeney 1, M. New 1,2 and G. Lizcano 1 1. School of Geography and Environment, University of Oxford. 2.Tyndall Centre for Climate Change Research http://country-profiles.geog.ox.ac.uk
The ENSEMBLES Project
 The ENSEMBLES Project Providing ensemble-based predictions of climate changes and their impacts by Dr. Chris Hewitt Abstract The main objective of the ENSEMBLES project is to provide probabilistic estimates
Climate Modeling: From the global to the regional scale
 Climate Modeling: From the global to the regional scale Filippo Giorgi Abdus Salam ICTP, Trieste, Italy ESA summer school on Earth System Monitoring and Modeling Frascati, Italy, 31 July 11 August 2006
Operational event attribution
 Operational event attribution Peter Stott, NCAR, 26 January, 2009 August 2003 Events July 2007 January 2009 January 2009 Is global warming slowing down? Arctic Sea Ice Climatesafety.org climatesafety.org
The importance of sampling multidecadal variability when assessing impacts of extreme precipitation
 The importance of sampling multidecadal variability when assessing impacts of extreme precipitation Richard Jones Research funded by Overview Context Quantifying local changes in extreme precipitation
Appendix 1: UK climate projections
 Appendix 1: UK climate projections The UK Climate Projections 2009 provide the most up-to-date estimates of how the climate may change over the next 100 years. They are an invaluable source of information
Climate change and variability -
 Climate change and variability - Current capabilities - a synthesis of IPCC AR4 (WG1) Pete Falloon, Manager Impacts Model Development, Met Office Hadley Centre WMO CaGM/SECC Workshop, Orlando, 18 November
Baseline Climatology. Dave Parker ADD PRESENTATION TITLE HERE (GO TO: VIEW / MASTER / SLIDE MASTER TO AMEND) ADD PRESENTER S NAME HERE / ADD DATE HERE
 ADD PRESENTER S NAME HERE / ADD DATE HERE") Baseline Climatology Dave Parker ADD PRESENTATION TITLE HERE (GO TO: VIEW / MASTER / SLIDE MASTER TO AMEND) ADD PRESENTER S NAME HERE / ADD DATE HERE Copyright EDF Energy. All rights reserved. Introduction
Baseline Climatology Dave Parker ADD PRESENTATION TITLE HERE (GO TO: VIEW / MASTER / SLIDE MASTER TO AMEND) ADD PRESENTER S NAME HERE / ADD DATE HERE Copyright EDF Energy. All rights reserved. Introduction
Will a warmer world change Queensland s rainfall?
 Will a warmer world change Queensland s rainfall? Nicholas P. Klingaman National Centre for Atmospheric Science-Climate Walker Institute for Climate System Research University of Reading The Walker-QCCCE
What is the IPCC? Intergovernmental Panel on Climate Change
 IPCC WG1 FAQ What is the IPCC? Intergovernmental Panel on Climate Change The IPCC is a scientific intergovernmental body set up by the World Meteorological Organization (WMO) and by the United Nations
Zambia. General Climate. Recent Climate Trends. UNDP Climate Change Country Profiles. Temperature. C. McSweeney 1, M. New 1,2 and G.
 UNDP Climate Change Country Profiles Zambia C. McSweeney 1, M. New 1,2 and G. Lizcano 1 1. School of Geography and Environment, University of Oxford. 2. Tyndall Centre for Climate Change Research http://country-profiles.geog.ox.ac.uk
Current and future climate of the Cook Islands. Pacific-Australia Climate Change Science and Adaptation Planning Program
 Pacific-Australia Climate Change Science and Adaptation Planning Program Penrhyn Pukapuka Nassau Suwarrow Rakahanga Manihiki N o r t h e r n C o o k I s l a nds S o u t h e Palmerston r n C o o k I s l
Annex I to Target Area Assessments
 Baltic Challenges and Chances for local and regional development generated by Climate Change Annex I to Target Area Assessments Climate Change Support Material (Climate Change Scenarios) SWEDEN September
El Niño 2015/2016: Impact Analysis
 El Niño /26: Impact Analysis March 26 Dr Linda Hirons, Dr Nicholas Klingaman This work was funded by the Department for International Development (DFID) 2 Table of Contents. Introduction 4. Update of current
Climate Risk Profile for Samoa
 Climate Risk Profile for Samoa Report Prepared by Wairarapa J. Young Samoa Meteorology Division March, 27 Summary The likelihood (i.e. probability) components of climate-related risks in Samoa are evaluated
A Study of the Uncertainty in Future Caribbean Climate Using the PRECIS Regional Climate Model
 A Study of the Uncertainty in Future Caribbean Climate Using the PRECIS Regional Climate Model by Abel Centella and Arnoldo Bezanilla Institute of Meteorology, Cuba & Kenrick R. Leslie Caribbean Community
Cuba. General Climate. Recent Climate Trends. UNDP Climate Change Country Profiles. Temperature. C. McSweeney 1, M. New 1,2 and G.
 UNDP Climate Change Country Profiles Cuba C. McSweeney 1, M. New 1,2 and G. Lizcano 1 1. School of Geography and Environment, University of Oxford. 2. Tyndall Centre for Climate Change Research http://country-profiles.geog.ox.ac.uk
Intraseasonal Characteristics of Rainfall for Eastern Africa Community (EAC) Hotspots: Onset and Cessation dates. In support of;
 Hotspots: Onset and Cessation dates. In support of;") Intraseasonal Characteristics of Rainfall for Eastern Africa Community (EAC) Hotspots: Onset and Cessation dates In support of; Planning for Resilience in East Africa through Policy, Adaptation, Research
Intraseasonal Characteristics of Rainfall for Eastern Africa Community (EAC) Hotspots: Onset and Cessation dates In support of; Planning for Resilience in East Africa through Policy, Adaptation, Research
UPDATE OF REGIONAL WEATHER AND SMOKE HAZE (May 2017)
") UPDATE OF REGIONAL WEATHER AND SMOKE HAZE (May 2017) 1. Review of Regional Weather Conditions in April 2017 1.1 Inter monsoon conditions, characterised by afternoon showers and winds that are generally
UPDATE OF REGIONAL WEATHER AND SMOKE HAZE (May 2017) 1. Review of Regional Weather Conditions in April 2017 1.1 Inter monsoon conditions, characterised by afternoon showers and winds that are generally
Regional climate downscaling for the Marine and Tropical Sciences Research Facility (MTSRF) between 1971 and 2000
 between 1971 and 2000") Regional climate downscaling for the Marine and Tropical Sciences Research Facility (MTSRF) between 1971 and 2000 M. Thatcher, J. McGregor and K. Nguyen September 2007 Supported by the Australian Government
Regional climate downscaling for the Marine and Tropical Sciences Research Facility (MTSRF) between 1971 and 2000 M. Thatcher, J. McGregor and K. Nguyen September 2007 Supported by the Australian Government
Malawi. General Climate. UNDP Climate Change Country Profiles. C. McSweeney 1, M. New 1,2 and G. Lizcano 1
 UNDP Climate Change Country Profiles Malawi C. McSweeney 1, M. New 1,2 and G. Lizcano 1 1. School of Geography and Environment, University of Oxford. 2. Tyndall Centre for Climate Change Research http://country-profiles.geog.ox.ac.uk
Projections of future climate change
 Projections of future climate change Matthew Collins 1,2 and Catherine A. Senior 2 1 Centre for Global Atmospheric Modelling, Department of Meteorology, University of Reading 2 Met Office Hadley Centre,
Regional probabilities of precipitation change: A Bayesian analysis of multimodel simulations
 GEOPHYSICAL RESEARCH LETTERS, VOL. 31, L24213, doi:10.1029/2004gl021276, 2004 Regional probabilities of precipitation change: A Bayesian analysis of multimodel simulations C. Tebaldi, 1 L. O. Mearns, 1
Seasonal Climate Watch July to November 2018
 Seasonal Climate Watch July to November 2018 Date issued: Jun 25, 2018 1. Overview The El Niño-Southern Oscillation (ENSO) is now in a neutral phase and is expected to rise towards an El Niño phase through
Training: Climate Change Scenarios for PEI. Training Session April Neil Comer Research Climatologist
 Training: Climate Change Scenarios for PEI Training Session April 16 2012 Neil Comer Research Climatologist Considerations: Which Models? Which Scenarios?? How do I get information for my location? Uncertainty
2015: A YEAR IN REVIEW F.S. ANSLOW
 2015: A YEAR IN REVIEW F.S. ANSLOW 1 INTRODUCTION Recently, three of the major centres for global climate monitoring determined with high confidence that 2015 was the warmest year on record, globally.
 Page 1 of 5 Home research global climate enso effects Research Effects of El Niño on world weather Precipitation Temperature Tropical Cyclones El Niño affects the weather in large parts of the world. The
The North Atlantic Oscillation: Climatic Significance and Environmental Impact
 1 The North Atlantic Oscillation: Climatic Significance and Environmental Impact James W. Hurrell National Center for Atmospheric Research Climate and Global Dynamics Division, Climate Analysis Section
NZCLIMATE TRUTH NEWSLETTER NO 325 JANUARY 30th 2014
 NZCLIMATE TRUTH NEWSLETTER NO 325 JANUARY 30th 2014 CLIMATE CHANGE Climate Change was defined by the 1992 Framework Convention on Climate Change (FCCC) in Article 1, as follows: a change of climate which
The South Eastern Australian Climate Initiative
 The South Eastern Australian Climate Initiative Phase 2 of the South Eastern Australian Climate Initiative (SEACI) is a three-year (2009 2012), $9 million research program investigating the causes and
Will it rain? Predictability, risk assessment and the need for ensemble forecasts
 Will it rain? Predictability, risk assessment and the need for ensemble forecasts David Richardson European Centre for Medium-Range Weather Forecasts Shinfield Park, Reading, RG2 9AX, UK Tel. +44 118 949
University of Reading, Reading, United Kingdom. 2 Hadley Centre for Climate Prediction and Research, Meteorological Office, Exeter, United Kingdom.
 9.1 RUNNING A CLIMATE MODEL IN FORECAST MODE TO IDENTIFY THE SOURCE OF TROPICAL CLIMATE ERRORS: WITH SPECIFIC REFERENCE TO THE DRY BIAS OVER THE MARITIME CONTINENT IN AN ATMOSPHERE ONLY GCM 1 Jane Strachan,
Seasonal Climate Outlook for South Asia (June to September) Issued in May 2014
 Issued in May 2014") Ministry of Earth Sciences Earth System Science Organization India Meteorological Department WMO Regional Climate Centre (Demonstration Phase) Pune, India Seasonal Climate Outlook for South Asia (June
Ministry of Earth Sciences Earth System Science Organization India Meteorological Department WMO Regional Climate Centre (Demonstration Phase) Pune, India Seasonal Climate Outlook for South Asia (June
Cape Verde. General Climate. Recent Climate. UNDP Climate Change Country Profiles. Temperature. Precipitation
 UNDP Climate Change Country Profiles C. McSweeney 1, M. New 1,2 and G. Lizcano 1 1. School of Geography and Environment, University of Oxford. 2. Tyndall Centre for Climate Change Research http://country-profiles.geog.ox.ac.uk
Was the Amazon Drought of 2005 Human-Caused? Peter Cox Met Office Chair in Climate System Dynamics. Outline
 Was the Amazon Drought of 2005 Human-Caused? Peter Cox Met Office Chair in Climate System Dynamics With thanks to : Phil Harris, Chris Huntingford, Chris Jones, Richard Betts, Matthew Collins, Jose Marengo,
8.1.2 Climate Projections
 Chapter 8 Nauru 167 8.1 Climate Summary 8.1.1 Current Climate Over the past half century it is likely that there has been a warming air temperature trend at Nauru which is partly associated with warming
1990 Intergovernmental Panel on Climate Change Impacts Assessment
 1990 Intergovernmental Panel on Climate Change Impacts Assessment Although the variability of weather and associated shifts in the frequency and magnitude of climate events were not available from the
Antigua and Barbuda. General Climate. Recent Climate Trends. UNDP Climate Change Country Profiles. Temperature
 UNDP Climate Change Country Profiles Antigua and Barbuda C. McSweeney 1, M. New 1,2 and G. Lizcano 1 1. School of Geography and Environment, University of Oxford. 2. Tyndall Centre for Climate Change Research
International Journal of Scientific and Research Publications, Volume 3, Issue 5, May ISSN
 International Journal of Scientific and Research Publications, Volume 3, Issue 5, May 2013 1 Projection of Changes in Monthly Climatic Variability at Local Level in India as Inferred from Simulated Daily
Does the model regional bias affect the projected regional climate change? An analysis of global model projections
 Climatic Change (21) 1:787 795 DOI 1.17/s1584-1-9864-z LETTER Does the model regional bias affect the projected regional climate change? An analysis of global model projections A letter Filippo Giorgi
Australian Meteorological and Oceanographic Society (AMOS) Statement on Climate Change
 Statement on Climate Change") Australian Meteorological and Oceanographic Society (AMOS) Statement on Climate Change This statement provides a summary of some aspects of climate change and its uncertainties, with particular focus on
Australian Meteorological and Oceanographic Society (AMOS) Statement on Climate Change This statement provides a summary of some aspects of climate change and its uncertainties, with particular focus on
Why Has the Land Memory Changed?
 3236 JOURNAL OF CLIMATE VOLUME 17 Why Has the Land Memory Changed? QI HU ANDSONG FENG Climate and Bio-Atmospheric Sciences Group, School of Natural Resource Sciences, University of Nebraska at Lincoln,
Climate Dynamics (PCC 587): Hydrologic Cycle and Global Warming
: Hydrologic Cycle and Global Warming") Climate Dynamics (PCC 587): Hydrologic Cycle and Global Warming D A R G A N M. W. F R I E R S O N U N I V E R S I T Y O F W A S H I N G T O N, D E P A R T M E N T O F A T M O S P H E R I C S C I E N C
Climate Dynamics (PCC 587): Hydrologic Cycle and Global Warming D A R G A N M. W. F R I E R S O N U N I V E R S I T Y O F W A S H I N G T O N, D E P A R T M E N T O F A T M O S P H E R I C S C I E N C
Climate Change in the Pacific: Scientific Assessment and New Research Volume 1: Regional Overview
 Climate Change in the Pacific: Scientific Assessment and New Research Volume 1: Regional Overview Australian Bureau of Meteorology and Commonwealth Scientific and Industrial Research Organisation (CSIRO)
Implementation of global surface index at the Met Office. Submitted by Marion Mittermaier. Summary and purpose of document
 WORLD METEOROLOGICAL ORGANIZATION COMMISSION FOR BASIC SYSTEMS OPAG on DPFS MEETING OF THE CBS (DPFS) TASK TEAM ON SURFACE VERIFICATION GENEVA, SWITZERLAND 20-21 OCTOBER 2014 DPFS/TT-SV/Doc. 4.1a (X.IX.2014)
European and Global. Change Projections. ClimateCost. Briefing Note
 an and Global Technical Climate Policy Change Projections Briefing Note an and Global Climate Change Projections Discussion of Climate Change Model Outputs, Scenarios and Uncertainty in the EC RTD ClimateCost
Seasonal to decadal climate prediction: filling the gap between weather forecasts and climate projections
 Seasonal to decadal climate prediction: filling the gap between weather forecasts and climate projections Doug Smith Walter Orr Roberts memorial lecture, 9 th June 2015 Contents Motivation Practical issues
Climate Outlook for March August 2018
 The APEC CLIMATE CENTER Climate Outlook for March August 2018 BUSAN, 26 February 2018 The synthesis of the latest model forecasts for March to August 2018 (MAMJJA) from the APEC Climate Center (APCC),
ENSO-DRIVEN PREDICTABILITY OF TROPICAL DRY AUTUMNS USING THE SEASONAL ENSEMBLES MULTIMODEL
 1 ENSO-DRIVEN PREDICTABILITY OF TROPICAL DRY AUTUMNS USING THE SEASONAL ENSEMBLES MULTIMODEL Based on the manuscript ENSO-Driven Skill for precipitation from the ENSEMBLES Seasonal Multimodel Forecasts,
18. ATTRIBUTION OF EXTREME RAINFALL IN SOUTHEAST CHINA DURING MAY 2015
 18. ATTRIBUTION OF EXTREME RAINFALL IN SOUTHEAST CHINA DURING MAY 2015 Claire Burke, Peter Stott, Ying Sun, and Andrew Ciavarella Anthropogenic climate change increased the probability that a short-duration,
Regional Climate Simulations with WRF Model
 WDS'3 Proceedings of Contributed Papers, Part III, 8 84, 23. ISBN 978-8-737852-8 MATFYZPRESS Regional Climate Simulations with WRF Model J. Karlický Charles University in Prague, Faculty of Mathematics
Observed rainfall trends and precipitation uncertainty in the vicinity of the Mediterranean, Middle East and North Africa
 SCIENTIFIC WORKSHOP 16-17 ΜΑΥ 2018 Nicosia, Cyprus Observed rainfall trends and precipitation uncertainty in the vicinity of the Mediterranean, Middle East and North Africa George Zittis, Associate Research
2013 ATLANTIC HURRICANE SEASON OUTLOOK. June RMS Cat Response
 2013 ATLANTIC HURRICANE SEASON OUTLOOK June 2013 - RMS Cat Response Season Outlook At the start of the 2013 Atlantic hurricane season, which officially runs from June 1 to November 30, seasonal forecasts
PREDICTING DROUGHT VULNERABILITY IN THE MEDITERRANEAN
 J.7 PREDICTING DROUGHT VULNERABILITY IN THE MEDITERRANEAN J. P. Palutikof and T. Holt Climatic Research Unit, University of East Anglia, Norwich, UK. INTRODUCTION Mediterranean water resources are under
CHAPTER 1: INTRODUCTION
 CHAPTER 1: INTRODUCTION There is now unequivocal evidence from direct observations of a warming of the climate system (IPCC, 2007). Despite remaining uncertainties, it is now clear that the upward trend
Chapter 3 East Timor (Timor-Leste)
") Chapter 3 East Timor (Timor-Leste) 49 3.1 Climate Summary 3.1.1 Current Climate Despite missing temperature records for Dili Airport, it is probable that over the past half century there has been a warming
Chapter 3 East Timor (Timor-Leste) 49 3.1 Climate Summary 3.1.1 Current Climate Despite missing temperature records for Dili Airport, it is probable that over the past half century there has been a warming
By: J Malherbe, R Kuschke
 2015-10-27 By: J Malherbe, R Kuschke Contents Summary...2 Overview of expected conditions over South Africa during the next few days...3 Significant weather events (27 October 2 November)...3 Conditions
Precipitation processes in the Middle East
 Precipitation processes in the Middle East J. Evans a, R. Smith a and R.Oglesby b a Dept. Geology & Geophysics, Yale University, Connecticut, USA. b Global Hydrology and Climate Center, NASA, Alabama,
Oxford (Cape Town) programme on the attribution of weather risk
 programme on the attribution of weather risk") Oxford (Cape Town) programme on the attribution of weather risk Dáithí Stone, Neil Massey, Tolu Aina, Pardeep Pall, Myles Allen, Peter Stott Dáithí A. Stone (stoned@csag.uct.ac.za) 1 Cape Town, September
Oxford (Cape Town) programme on the attribution of weather risk Dáithí Stone, Neil Massey, Tolu Aina, Pardeep Pall, Myles Allen, Peter Stott Dáithí A. Stone (stoned@csag.uct.ac.za) 1 Cape Town, September
St Lucia. General Climate. Recent Climate Trends. UNDP Climate Change Country Profiles. Temperature. Precipitation
 UNDP Climate Change Country Profiles St Lucia C. McSweeney 1, M. New 1,2 and G. Lizcano 1 1. School of Geography and Environment, University of Oxford. 2. Tyndall Centre for Climate Change Research http://country-profiles.geog.ox.ac.uk
Suriname. General Climate. Recent Climate Trends. UNDP Climate Change Country Profiles. Temperature. C. McSweeney 1, M. New 1,2 and G.
 UNDP Climate Change Country Profiles Suriname C. McSweeney 1, M. New 1,2 and G. Lizcano 1 1. School of Geography and Environment, University of Oxford. 2. Tyndall Centre for Climate Change Research http://country-profiles.geog.ox.ac.uk
Lecture 28: Observed Climate Variability and Change
 Lecture 28: Observed Climate Variability and Change 1. Introduction This chapter focuses on 6 questions - Has the climate warmed? Has the climate become wetter? Are the atmosphere/ocean circulations changing?
Projected changes in drought occurrence under future global warming from multi-model, multi-scenario, IPCC AR4 simulations
 Clim Dyn DOI.7/s8-7--z Projected changes in drought occurrence under future global warming from multi-model, multi-scenario, IPCC AR simulations Justin Sheffield Æ Eric F. Wood Received: July 7 / Accepted:
Anthropogenic warming of central England temperature
 ATMOSPHERIC SCIENCE LETTERS Atmos. Sci. Let. 7: 81 85 (2006) Published online 18 September 2006 in Wiley InterScience (www.interscience.wiley.com).136 Anthropogenic warming of central England temperature
Using observations to constrain climate project over the Amazon - Preliminary results and thoughts
 Using observations to constrain climate project over the Amazon - Preliminary results and thoughts Rong Fu & Wenhong Li Georgia Tech. & UT Austin CCSM Climate Variability Working Group Session June 19,
Seasonal Climate Watch January to May 2016
 Seasonal Climate Watch January to May 2016 Date: Dec 17, 2015 1. Advisory Most models are showing the continuation of a strong El-Niño episode towards the latesummer season with the expectation to start
3. Carbon Dioxide (CO 2 )
") 3. Carbon Dioxide (CO 2 ) Basic information on CO 2 with regard to environmental issues Carbon dioxide (CO 2 ) is a significant greenhouse gas that has strong absorption bands in the infrared region and
3. Carbon Dioxide (CO 2 ) Basic information on CO 2 with regard to environmental issues Carbon dioxide (CO 2 ) is a significant greenhouse gas that has strong absorption bands in the infrared region and
Prediction of Snow Water Equivalent in the Snake River Basin
 Hobbs et al. Seasonal Forecasting 1 Jon Hobbs Steve Guimond Nate Snook Meteorology 455 Seasonal Forecasting Prediction of Snow Water Equivalent in the Snake River Basin Abstract Mountainous regions of
Predicting climate extreme events in a user-driven context
 www.bsc.es Oslo, 6 October 2015 Predicting climate extreme events in a user-driven context Francisco J. Doblas-Reyes BSC Earth Sciences Department BSC Earth Sciences Department What Environmental forecasting
Manfred A. Lange Energy, Environment and Water Research Center The Cyprus Institute. M. A. Lange 11/26/2008 1
 Manfred A. Lange Energy, Environment and Water Research Center The Cyprus Institute M. A. Lange 11/26/2008 1 Background and Introduction Mediterranean Climate Past and Current Conditions Tele-Connections
PRMS WHITE PAPER 2014 NORTH ATLANTIC HURRICANE SEASON OUTLOOK. June RMS Event Response
 PRMS WHITE PAPER 2014 NORTH ATLANTIC HURRICANE SEASON OUTLOOK June 2014 - RMS Event Response 2014 SEASON OUTLOOK The 2013 North Atlantic hurricane season saw the fewest hurricanes in the Atlantic Basin
Impacts of Climate Change on Autumn North Atlantic Wave Climate
 Impacts of Climate Change on Autumn North Atlantic Wave Climate Will Perrie, Lanli Guo, Zhenxia Long, Bash Toulany Fisheries and Oceans Canada, Bedford Institute of Oceanography, Dartmouth, NS Abstract
EXECUTIVE SUMMARY. Climate Models: An Assessment of Strengths and Limitations
 Climate Models: An Assessment of Strengths and Limitations EXECUTIVE SUMMARY Scientists extensively use mathematical models of Earth s climate, executed on the most powerful computers available, to examine
Effect of data coverage on the estimation of mean and variability of precipitation at global and regional scales
 JOURNAL OF GEOPHYSICAL RESEARCH: ATMOSPHERES, VOL. 118, 534 546, doi:10.1002/jgrd.50118, 2013 Effect of data coverage on the estimation of mean and variability of precipitation at global and regional scales
NIWA Outlook: October - December 2015
 October December 2015 Issued: 1 October 2015 Hold mouse over links and press ctrl + left click to jump to the information you require: Overview Regional predictions for the next three months: Northland,
Thai Meteorological Department, Ministry of Digital Economy and Society
 Thai Meteorological Department, Ministry of Digital Economy and Society Three-month Climate Outlook For November 2017 January 2018 Issued on 31 October 2017 -----------------------------------------------------------------------------------------------------------------------------
Probabilities for climate projections
 Probabilities for climate projections Claudia Tebaldi, Reinhard Furrer Linda Mearns, Doug Nychka National Center for Atmospheric Research Richard Smith - UNC-Chapel Hill Steve Sain - CU-Denver Statistical
El Niño / Southern Oscillation
 El Niño / Southern Oscillation Student Packet 2 Use contents of this packet as you feel appropriate. You are free to copy and use any of the material in this lesson plan. Packet Contents Introduction on
SUPPLEMENTARY INFORMATION
 SUPPLEMENTARY INFORMATION DOI: 10.1038/NGEO1854 Anthropogenic aerosol forcing of Atlantic tropical storms N. J. Dunstone 1, D. S. Smith 1, B. B. B. Booth 1, L. Hermanson 1, R. Eade 1 Supplementary information
Seasonal Climate Watch September 2018 to January 2019
 Seasonal Climate Watch September 2018 to January 2019 Date issued: Aug 31, 2018 1. Overview The El Niño-Southern Oscillation (ENSO) is still in a neutral phase and is still expected to rise towards an
Climate Projections and Energy Security
 NOAA Research Earth System Research Laboratory Physical Sciences Division Climate Projections and Energy Security Andy Hoell and Jim Wilczak Research Meteorologists, Physical Sciences Division 7 June 2016
Grenada. General Climate. Recent Climate Trends. UNDP Climate Change Country Profiles. Temperature. Precipitation
 UNDP Climate Change Country Profiles C. McSweeney 1, M. New 1,2 and G. Lizcano 1 1. School of Geography and Environment, University of Oxford. 2. Tyndall Centre for Climate Change Research http://country-profiles.geog.ox.ac.uk
Climate Change and the East Midlands Economy Executive Summary
 Climate Change and the East Midlands Economy Executive Summary A report prepared for emda Met Office Consultancy August 2010 This work, with the exception of logos, photographs and images and any other
Chapter outline. Reference 12/13/2016
 Chapter 2. observation CC EST 5103 Climate Change Science Rezaul Karim Environmental Science & Technology Jessore University of science & Technology Chapter outline Temperature in the instrumental record
Summary and Conclusions
 241 Chapter 10 Summary and Conclusions Kerala is situated in the southern tip of India between 8 15 N and 12 50 N latitude and 74 50 E and 77 30 E longitude. It is popularly known as Gods own country.
Hadley Centre for Climate Prediction and Research, Met Office, FitzRoy Road, Exeter, EX1 3PB, UK.
 Temperature Extremes, the Past and the Future. S Brown, P Stott, and R Clark Hadley Centre for Climate Prediction and Research, Met Office, FitzRoy Road, Exeter, EX1 3PB, UK. Tel: +44 (0)1392 886471 Fax
Chapter 7 Projections Based on Downscaling
 Damage caused by Tropical Cyclone Pat, Cook Islands, February 2010. Photo: National Environment Service, Government of the Cook Islands Chapter 7 Projections Based on Downscaling 181 Summary Downscaled
The scientific basis for climate change projections: History, Status, Unsolved problems
 The scientific basis for climate change projections: History, Status, Unsolved problems Isaac Held, Princeton, Feb 2008 Katrina-like storm spontaneously generated in atmospheric model Regions projected
Nonlinear atmospheric response to Arctic sea-ice loss under different sea ice scenarios
 Nonlinear atmospheric response to Arctic sea-ice loss under different sea ice scenarios Hans Chen, Fuqing Zhang and Richard Alley Advanced Data Assimilation and Predictability Techniques The Pennsylvania
NIWA Outlook: March-May 2015
 March May 2015 Issued: 27 February 2015 Hold mouse over links and press ctrl + left click to jump to the information you require: Overview Regional predictions for the next three months: Northland, Auckland,
Confronting Climate Change in the Great Lakes Region. Technical Appendix Climate Change Projections CLIMATE MODELS
 Confronting Climate Change in the Great Lakes Region Technical Appendix Climate Change Projections CLIMATE MODELS Large, three-dimensional, coupled atmosphere-ocean General Circulation Models (GCMs) of
3. Climate Change. 3.1 Observations 3.2 Theory of Climate Change 3.3 Climate Change Prediction 3.4 The IPCC Process
 3. Climate Change 3.1 Observations 3.2 Theory of Climate Change 3.3 Climate Change Prediction 3.4 The IPCC Process 3.1 Observations Need to consider: Instrumental climate record of the last century or
Forced and internal variability of tropical cyclone track density in the western North Pacific
 Forced and internal variability of tropical cyclone track density in the western North Pacific Wei Mei 1 Shang-Ping Xie 1, Ming Zhao 2 & Yuqing Wang 3 Climate Variability and Change and Paleoclimate Working
Extremes of Weather and the Latest Climate Change Science. Prof. Richard Allan, Department of Meteorology University of Reading
 Extremes of Weather and the Latest Climate Change Science Prof. Richard Allan, Department of Meteorology University of Reading Extreme weather climate change Recent extreme weather focusses debate on climate
Projected changes in rainfall and temperature over Greater Horn of Africa (GHA) in different scenarios. In Support of:
 in different scenarios. In Support of:") Projected changes in rainfall and temperature over Greater Horn of Africa (GHA) in different scenarios In Support of: Planning for Resilience in East Africa through Policy, Adaptation, Research, and Economic
Projected changes in rainfall and temperature over Greater Horn of Africa (GHA) in different scenarios In Support of: Planning for Resilience in East Africa through Policy, Adaptation, Research, and Economic
Analytical Report. Drought in the Horn of Africa February Executive summary. Geographical context. Likelihood of drought impact (LDI)
") Executive summary The current drought in the Horn of Africa is affecting especially Somalia, among other countries, in particular the central and southern regions, where most population is located. Overall,
Executive summary The current drought in the Horn of Africa is affecting especially Somalia, among other countries, in particular the central and southern regions, where most population is located. Overall,