Virginia Eastern Shore Coastal Resilience Mapping & Decision Support Tool
|
|
|
- Derrick Snow
- 6 years ago
- Views:
Transcription


1 Virginia Eastern Shore Coastal Resilience Mapping & Decision Support Tool Introductory Workshop & Training Manual February 11 & 12, 2016 Eastern Shore Community College, Melfa, VA A project funded by the Department of Interior Hurricane Sandy Coastal Resilience Fund
2 Cover Photo: Aerial view of the sand bar off Savage Neck near Cape Charles, VA. Photograph 2015 Gordon Campbell/At Altitude Photography Following Page Photo: Fowling Point, Hog Island Bay Photograph 2015 Gordon Campbell/At Altitude Photography

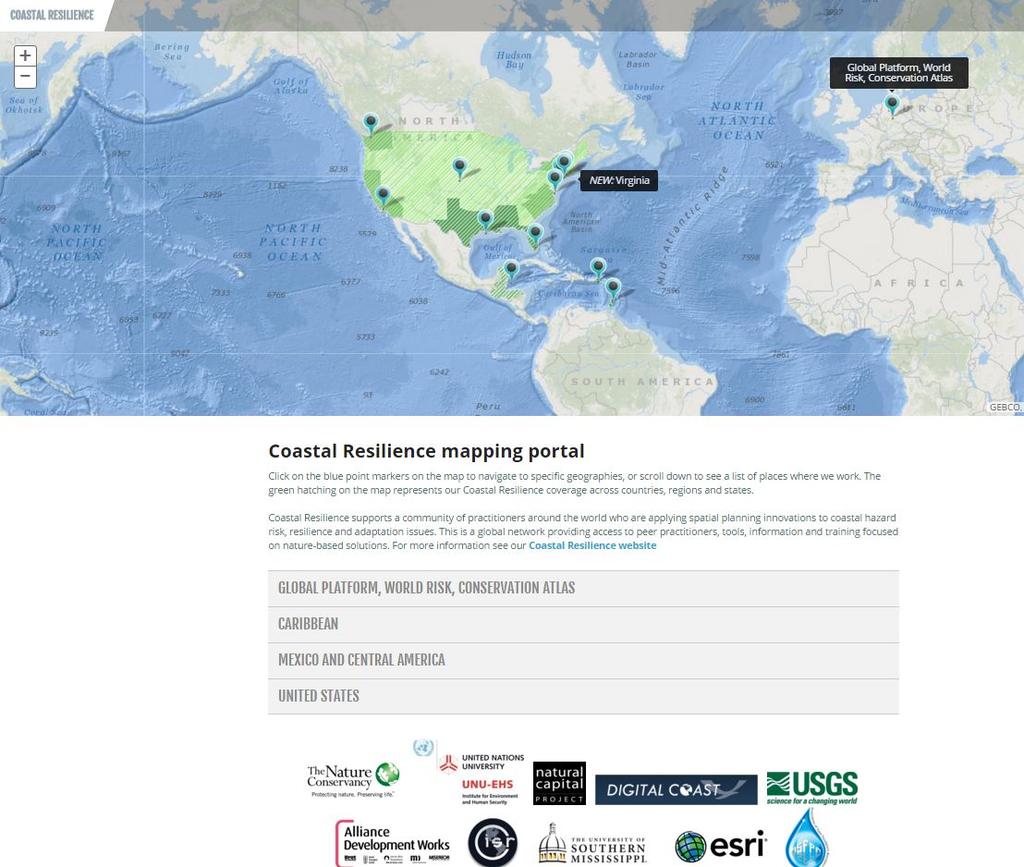
3 Virginia Eastern Shore Coastal Resilience Tool Introductory Workshop and Training Manual With input from the Community Leader Workshop held in November 2014, the customized Virginia Eastern Shore Coastal Resilience online mapping and decisions support tool for visualizing and assessing regional vulnerability to storm surge, sea-level rise, and changes in coastal habitats can be found at. Please visit the project webpage for more information at coastalresilience.org/virginia. Training Team Deborah Brosnan, Brosnan Center Gwynn Crichton, The Nature Conservancy Jenny Miller Garmendia, Brosnan Center Jill Bieri, The Nature Conservancy Jim McGowan, The Nature Conservancy Joyce Winterton, NASA Laura Flessner, The Nature Conservancy Karen A Duhring, Virginia Institute of Marine Science Michael Bonsteel, NASA Chris Bruce, The Nature Conservancy John Porter, University Of Virginia Curtis Smith, A-NPDC Shannon Alexander, A-NPDC Please contact us with your questions and input: vacoastalresilience@tnc.org
4
5 Virginia Eastern Shore Coastal Resilience Tool Introductory Workshop & Training Manual Table of Contents I. Training Agenda II. III. IV. Coastal Resilience Skills and Training Exercises Coastal Resilience Glossary of Terms Coastal resilience Hints and Tips V. Instruction Guidelines for Conducting a Coastal Resilience Training Workshop VI. Virginia Eastern Shore Coastal Resilience Project Fact Sheet & URLs
6

7 Coastal Resilience Tool Introductory Workshop & Training Schedule A project funded by the Department of Interior Hurricane Sandy Coastal Resilience Fund Thursday, February 11, 2016 Eastern Shore Community College, Lankford Highway, Melfa, Virginia Training Objectives 1. Brief participants on the Coastal Resilience approach and tool in the context of the larger NFWF Hurricane Sandy Coastal Resilience grant project. 2. Demonstrate how to use the Coastal Resilience tool and apps through hands-on, structured exercises. 3. Gather feedback on the look, feel, function, and usability of the Coastal Resilience tool. 4. Solicit input on content and substance of apps and information presented in the tool. 5. Equip participants with skills to be able to train others to use the Coastal Resilience tool. Training Manual Page 1 of 29
8 Coastal Resilience Tool Introductory Workshop & Training Schedule Eastern Shore Community College Lankford Hwy, Melfa, VA Schedule Thursday, February 11 Opening Themes & Setting 12:30 pm Registration 1:00 pm Welcome and introductions Jill Bieri, The Nature Conservancy 1:05 pm Overview of Coastal Resilience approach and mapping portal Gwynn Crichton, TNC 1:10 pm Potential uses and applications for Coastal Resilience tool for Eastern Shore communities - Curt Smith, ANPDC 1:15 pm Coastal Resilience training workshop purpose, objectives, agenda and underlying science for tool - Deborah Brosnan, Brosnan Institute for Risk Reduction Training & Exercises Jenny Miller Garmendia (Brosnan Institute for Risk Reduction) & Mike Bonsteel (LJT & Associates, Inc.) 1:30 pm Basic Skills Navigation & Apps Introduction to apps & training related to basic skills o Flood & Sea Level App Basic Inundation o Future Habitat App o Flood & Sea Level App Storm Surge 2:20 pm Break 2:30 pm Next Level Skills Additional Tools Training related to more advanced skills including search, Split View, Link, measuring, Save & Share, options, and tips and cautions about tool use 3:00 pm Exercises Application Participants will conduct specific exercises then have the opportunity to work on questions/exercises proposed by participants Conclusion 3:30 pm Tool Utility & Support for Decision-Making Discussion - Jenny Miller Garmendia (BIRR) & Mike Bonsteel (LJT) Examples & Discussion of using the tool to support decision-making Hand-out regarding teaching others 3:50 pm Survey & Evaluations Joyce Winterton, NASA Upcoming apps and trainings Chris Bruce, TNC 4:00 pm Closing - Gwynn Crichton, TNC Training Manual Page 2 of 29
9 Coastal Resilience Tool Introductory Workshop & Training Schedule A project funded by the Department of Interior Hurricane Sandy Coastal Resilience Fund Friday, February 12, 2016 Eastern Shore Community College, Lankford Highway, Melfa, Virginia Training Objectives 1. Brief participants on the Coastal Resilience approach and tool in the context of the larger NFWF Hurricane Sandy Coastal Resilience grant project. 2. Demonstrate how to use the Coastal Resilience tool and apps through hands-on, structured exercises. 3. Gather feedback on the look, feel, function, and usability of the Coastal Resilience tool. 4. Solicit input on content and substance of apps and information presented in the tool. 5. Equip participants with skills to be able to train others to use the Coastal Resilience tool. Training Manual Page 3 of 29
10 Coastal Resilience Tool Introductory Workshop & Training Schedule Eastern Shore Community College Lankford Hwy, Melfa, VA Schedule Thursday, February 12 Opening Themes & Setting 8:30 am Registration 9:00 am Welcome and introductions Jill Bieri, The Nature Conservancy 9:05 am Overview of Coastal Resilience approach and mapping portal Gwynn Crichton, TNC 9:10 am Potential uses and applications for Coastal Resilience tool for Eastern Shore communities - Curt Smith, ANPDC 9:15 am Coastal Resilience training workshop purpose, objectives, agenda and underlying science for tool - Deborah Brosnan, Brosnan Institute for Risk Reduction Training & Exercises Jenny Miller Garmendia (Brosnan Institute for Risk Reduction) & Mike Bonsteel (LJT & Associates, Inc.) 9:30 am Basic Skills Navigation & Apps Introduction to apps & training related to basic skills o Flood & Sea Level App Basic Inundation o Future Habitat App o Flood & Sea Level App Storm Surge 10:20 am Break 10:30 am Next Level Skills Additional Tools Training related to more advanced skills including search, Split View, Link, measuring, Save & Share, options, and tips and cautions about tool use 11:00 am Exercises Application Participants will conduct specific exercises then have the opportunity to work on questions/exercises proposed by participants Conclusion 11:30 am Tool Utility & Support for Decision-Making Discussion - Jenny Miller Garmendia (BIRR) & Mike Bonsteel (LJT) Examples & Discussion of using the tool to support decision-making Hand-out regarding teaching others 11:50 am Survey & Evaluations Joyce Winterton, NASA Upcoming apps and trainings Chris Bruce, TNC 12:00 pm Closing - Gwynn Crichton, TNC Training Manual Page 4 of 29
11 Virginia Eastern Shore Coastal Resilience Tool Introductory Workshop & Training Manual Skills & Exercises Learning Outcomes I. Desired Learning Outcomes Participants will be able to: 1. Briefly explain the purpose, use and limitations of the Coastal Resilience Tool to support decision-making. 2. Activate and use the Flood & Sea Level Rise app, including the following options and settings: a. Choose a Data Source for Basic Inundation or Storm Surge b. Scenario Year c. SLR (Sea Level Rise) d. Storm Type e. Additional Layers f. Opacity 3. Navigate around the map to Zoom in and out and Pan by: a. Zoom in and out using the +/- buttons or the mouse wheel b. Pan by clicking on the map, holding the mouse button down and dragging 4. Activate and use the Future Habitat app, including the following options and settings: a. Choose Parameters b. Scenario Year c. Draw a User Defined Area and Zoom to Selection d. Filter Results by Habitat(s) of Interest e. Find the analysis results in the Results & Chart tab and the Compare & Chart tab 5. Activate and use the Map Layers app and set the following parameters: a. Set the data points on the map within the following layer options: i. Base Data ii. Infrastructure iii. Coastal Management iv. Habitats v. Physical Features vi. Social and Economic b. Set the Opacity c. Use the layers in combination with other apps d. Use the Clear All function to remove all layers 6. See a demonstration of how the Launch Pad can be used to have a pre-set map ready to show others or use as a teaching example 7. Briefly explain the key points of the Flood & Sea Level Rise, Future Habitat, and Map Layers app as follows: Training Manual Page 5 of 29
12 a. The difference between Low, High, and Highest SLR (sea level rise) b. Scenario Years c. Inundation d. Storm Surge e. Opacity 8. Activate the Split View and Link tool to show two maps and use apps to compare data in two maps 9. Use the map tools to Search for an area, draw a User Defined Area, zoom in and pan around an area and use the apps on that particular area 10. Use the Save & Share function to save a map, copy the link and share it with others for later use a particular map Skills and Exercises Open the Coastal Resilience Tool for the Eastern Shore of Virginia: Click on Explore the Map in the Getting Started Launch Pad window. I. CR Tool Basic Skills Navigation & Apps a. Flood & Sea Level Rise App Basic Inundation Option Click on the Flood & Sea Level Rise App on left Click on Choose Data Source in the upper left corner Click on Basic Inundation Note that the Map Legend in the bottom right corner is now populated Look at the three sea level options under Choose SLR (Sea Level Rise) Click on the blue i for information on SLR Click on the X to close the I SLR info window Slide the bar to set SLR to High Look at the four options under Choose a Scenario Year Slide the bar to set Scenario Year to 2040 Look at the results Set Scenario Year to 2065 Set Scenario Year to 2100 set SLR to Highest Minimize the App by clicking on the Minimize button on the top right corner of the App window Click on App to reopen (note App button is blue when still active) Zoom in by clicking on the plus sign [+] on the left or using the mouse wheel Pan: move the map by dragging the screen: hold left mouse button down and move Zoom out by clicking on the minus sign [-] on the left or using the mouse wheel Click on the lower right corner and pull on App to expand view Training Manual Page 6 of 29
13 Close the Flood and Sea Level Rise App by clicking on the X in the top right corner Return the map to the full extent view by clicking on globe button on the left Press F5 (reload/refresh) to clear the map Click on Explore the Map in the Launch Pad SKILLS COMPLETED Choose Basic Inundation, set SLR to High and Scenario Year to 2040, 2065, 2100 Choose Basic Inundation, set SLR to Highest and Scenario Year to 2040, 2065, 2100 Click on the zoom in [+] and zoom out [-] tools, and pan around the map using the mouse Return map to the full extent main view NOTES: b. Future Habitat App Click on the Future Habitat App on left Click continue (you may need to check box to skip the opening picture Begin with the Choose Parameters tab Set the Scenario Year to 2065 Set the SLR to High Check the box for Salt Marsh under Filter the Results by Habitat of Interest Look under the Filter Results by a User Defined Area section Click on Click to Draw an Area - the cursor is now active and ready to draw a shape Draw a shape with at least three sides click once for each point and twice for the final point to end [don t hold the mouse button down as you draw] Zoom in by clicking on Zoom to Selection View the results [see legend] Click on Clear Filters to remove the Draw Area Close the app Return to full extent (click on the globe to the left) Press F5 to clear the map Click on Explore the Map in the Launch Pad SKILLS COMPLETED Choose Scenario Year 2065, set SLR to HIGH, click on Click to Draw an Area, create a box around a particular area, click on Zoom to Selection, and filter results by salt marsh NOTES: Training Manual Page 7 of 29
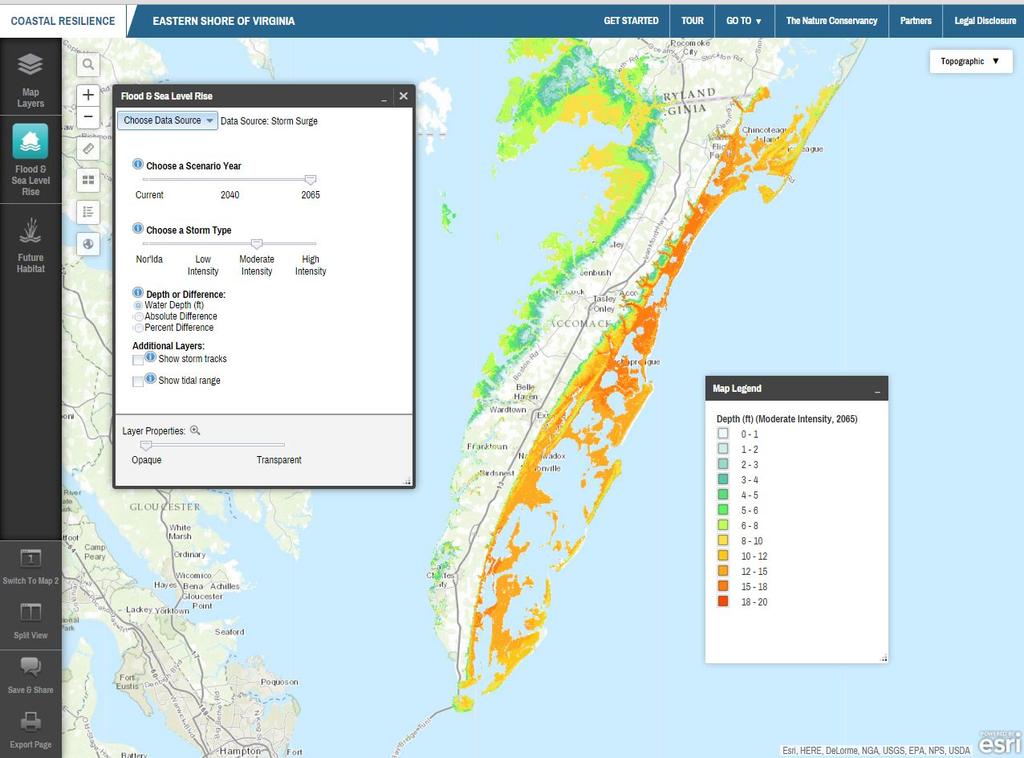
14 c. Flood and Sea Level Rise App - Storm Surge Option Click on the Flood & Sea Level Rise App on the left Click on Choose Data Source Click on Storm Surge Notice that the app shows Nor Ida impacts when opened Click on the blue i as needed Look at the three options under Choose a Scenario Year Slide bar to set Scenario Year to 2040 Look at the four options under Choose a Storm Type Slide bar to set Storm Type to Moderate Intensity Look at the options under Depth or Difference and notice that the app is automatically set to Water Depth (ft) Use the scroll bar at the right (if necessary) to view the Additional Layers below or expand the size of App by pulling on lower right corner Click on the Show tidal range option Hold a shift key and draw to zoom on an area to focus on Minimize the Legend for a clear view Re-open the Legend by clicking on the button on the left above the globe Close the app Return to full extent (click on the globe to the left) Press F5 to clear the map Click on Explore the Map in the Launch Pad SKILLS COMPLETED Choose Storm Surge, set Scenario Year to 2040, set Storm Type to Nor Ida, then to Moderate Intensity Choose Storm Surge, set Scenario Year to 2065, set Storm Type to Moderate Intensity, and set Depth or Difference to Water Depth Under Additional Layers, select Show Tidal Range NOTES: Training Manual Page 8 of 29
15 d. Map Layers App and Use with Future Habitat [NOTE: When using the Map Layers App with other Apps, always open the Map Layers App last] Click open the Future Habitat App Choose the Year 2065 Choose the SLR Scenario at High Click on the Map Layers App on the left Click on the plus signs (+) to open the menu for Virginia Click on plus sign to open each menu for: Base Data Infrastructure Coastal Management Habitats Physical Features Social and Economic Look at available options under each menu (roads, schools, populations, etc.) Click the checkboxes beside Infrastructure. Look at the options specific to roads. Click each checkbox for the Roads Vulnerable to 1 ft, 2 ft, and 3 ft Sea Level Rise [NOTE: This step allows the Map Layers to show over the Future Habitat App] Look for roads covered by water or marshes Use the zoom in [+] tool to get a closer look Click on Clear All to remove all layers Close the app Return to full extent (click on the globe to the left) Press F5 to clear the map Click on Explore the Map in the Launch Pad SKILLS COMPLETED Map Layers with Future Habitat App: Click on Map Layers. Under Infrastructure, click checkboxes for Roads vulnerable to 1 ft., 2 ft. and 3 ft. Sea Level Rise. Open Future Habitat and set Scenario Year to 2065 and SLR to High. Look at how the roads have been covered by water or marshes. Zoom in [+] for a better view. NOTES: Training Manual Page 9 of 29
16 II. Next Level Skills Additional Tools a. Search Tool, Imagery, Use of Split Screen, & Measuring SEARCH TOOL & IMAGERY To find a particular area on the map by name, use the search tool Click on the search tool (magnifying glass button) at the top left, type the name of the location into the search bar, and hit enter. Search for Brownsville, Virginia. Choose the correct location from the dropdown menu: Brownsville (historical) Virginia, United States Close the search function by clicking on the X icon twice Open the Flood & Sea Level Rise App on the left Click on Choose Data Source and select Basic Inundation Set Choose SLR to Low and set Scenario Year to 2100 Change the background layer type by mousing over the dropdown menu at the top right (currently says Topographic ). Click on the Imagery option. In the Flood & Sea Level Rise App window, find the Layer Properties slider bar. Set the Layer Properties bar to more transparent in order to see the background layer below the Flood & Sea Level Rise App layer SPLIT SCREEN TOOL & MEASURING Now you can split the screen to compare two maps Click on Split View on the bottom left Minimize open apps and legends so you have a clear view of both Maps Note that the second map (Map 2) does not start with the same background layer or apps as Map 1 Click on Link Maps at the bottom of the middle bar this locks the maps together so Map 2 follows any zoom or pan changes in Map 1 Click on the zoom out [-] tool in Map 1 and watch Map 2 respond This feature allows you to do a side-by-side comparison of scenarios Change the background layer for Map 2 to Imagery so it matches Map 1 Open the Flood & Sea Level Rise App in the middle bar (for Map 2) Click on Choose Data Source and select Basic Inundation Set Choose SLR to High and set Scenario Year to Minimize the App. Compare the two SLR scenarios between maps Adjust Opacity to be equal on both maps YOU ARE NOW COMPARING 2 MAPS IN THE YEAR 2100, ONE SHOWING LOW SLR AND ONE SHOWING HIGH SLR You may have to pan to get back to Brownsville Click on the measure tool (ruler symbol) on the left side of either map Measure the length of the narrow pond at the northwest edge of the Brownsville grounds by clicking once at the start point and double-clicking at the end. Note the information box with results, then click the X next to the tool to close the results window Training Manual Page 10 of 29
17 SAVE AND SHARE Click on Save and Share Copy the permalink at the top Paste the URL into a new browser window [opens to the same maps where you left off] You can send this URL to colleagues to view the same maps Close all apps (in both maps). Return to full extent (click on the globe to the left) Press F5 to clear the map SKILLS COMPLETED Search tool and imagery: Map 1: Type the location Brownsville, Virginia, into the search bar, open the Basic Inundation App, set Choose SLR to Low, set Scenario Year to 2100, select Imagery from the background layer dropdown menu, and change the Flood & Sea Level Rise Layer Properties slider to more transparent. Split screen and measuring: Map 2: Click on Split View, minimize open apps, click on Link Maps, change the background layer of Map 2 to Imagery, open the Basic Inundation App in Map 2, set Choose SLR to High, set Scenario Year to 2100, and minimize the app. Compare the inundation maps for Brownsville in the present and future conditions. Click on the measure tool and measure the length of the narrow pond at Brownsville by clicking once at the start and double-clicking at the end. Save and Share function Training Manual Page 11 of 29

18 III. Exercises a. Future Habitat App Use of the Brownsville, VA Map Search for Brownsville, Virginia. Choose the third ( historical ) option. Change the background layer to Imagery. Open the Future Habitat App, set the Scenario Year to 2025, and set the SLR Scenario to High Set the Layer Properties to completely transparent Under the Filter Results by a User Defined Area, click on Click to Draw an Area Draw a polygon starting with the fork in the road leading to Brownsville, then the Brownsville dock, followed by the northern point of the marsh east of the dock, and ending (double-click) at the point of the marsh almost directly south from there. Use the image below as a guide, clicking on points 1 through 3 in order, then double-clicking on point 4. Set the Layer Properties bar to completely opaque Click on the Compare & Chart tab (scroll down if necessary) View the results. These represent changes from current conditions Questions: How much tidal flat exists in 2025 under the High SLR scenario? What about transitional salt marsh? How have these values changed from current conditions? Advanced Question: Now split the screen into two maps, link the maps, and recreate the steps above, but set the Scenario Year to 2065 and SLR to High. How do the results for regularly flooded salt marsh compare between years? Close apps and return to full extent (click on the globe to the left) Press F5 to clear the map Training Manual Page 12 of 29
19 b. Map Layers App Cape Charles Set the background layer to Topographic Search for Cape Charles, Virginia (choose the first option) Zoom and pan so Cape Charles fills the screen, but you can still see Kings Creek to the north Open the Map Layers App and choose Coastal Management, and Flood Hazard Areas Also activate the Social and Economic layer, Persons per Square Mile Click on the round, orange i icon beside Social and Economic and adjust layer transparency to see overlap Note the overlap of the Flood Hazard Area and the concentration of people per square mile Zoom in to Cape Charles, notice the rectangle in the center. That is Central Park. Questions 1: What Flood Hazard Area affects Cape Charles Central Park? How many people per square mile does this affect? What about the rest of Cape Charles? In the Map Layers App, unclick the Persons per Square Mile layer under Social and Economic Activate the Flood & Sea Level Rise App and select Storm Surge data. Set the Scenario Year to 2065 and the Storm Type to Moderate Intensity. Adjust opacity to slightly less than mid-range. Note how the layers overlap, using the legend to compare data (scroll down if necessary) Questions 2: What storm surge levels line up with the 0.2 Pct Annual Chance Hazard Flood Hazard ( 500-year storm )? What does this tell you about the likelihood of this level of storm in 2065? Advanced questions: What road in Cape Charles could become impassible in the case of four feet of SLR or a major flood event? Hint: it is in an AE Flood Hazard Area. Also, based on aerial imagery, what businesses would likely be impacted if this road was blocked by SLR or flood waters? Close apps and return to full extent (click on the globe to the left) Press F5 to clear the map Training Manual Page 13 of 29
20 c. Flood & Sea Level Rise Storm Surge App Quinby, Virginia Search or pan and zoom to Quinby, Virginia Notice the Quinby Bridge and causeway, listed as Route 182 Open the Flood & Sea Level Rise App Storm Surge option and adjust opacity to mid-range Compare Nor Ida scenarios across Scenario Years Questions 1: How much flooding (feet of storm surge) would the Quinby Bridge and causeway experience in a 2040 Nor Ida event? Zoom in if necessary and use the legend to find your answer. Activate the Map Layers App and the Infrastructure layer. Click through the Roads Vulnerable to Sea Level Rise options until you see one that affects the Quinby Bridge and Causeway. Questions 2: Which vulnerability to SLR checkbox applies to the Quinby Bridge and causeway? Based on this information, can you estimate the elevation of the Quinby Bridge and causeway? What percent of people in Quinby affected by closing the bridge during a Nor Ida storm in 2040 are employed in agriculture, fishing, or forestry? Hint: use additional Map Layer App options. Advanced Question: In the same year in which the Quinby Bridge and causeway become impassible due to SLR, will people be able to access the town using other, existing infrastructure? Close apps and return to full extent (click on the globe to the left) Press F5 to clear the map IV. Exercises from Participants a. Examples from the group b. Extra example: Future Habitat App Saxis and Onancock, VA Search or zoom and pan to Saxis, Virginia Open the Future Habitat App and adjust opacity to mid-range Examine how habitat types change across Scenario Years and the low and high SLR Scenarios Questions 1: What is the directional trend for habitat change in Saxis? Is it mainly north-south, east-west, etc.? Open the Flood & Sea Level Rise App, Basic Inundation data. Examine how sea level rise changes across Scenario Years and the low and high SLR Scenarios Questions 2: How does the directional trend of inundation compare to what you saw in the Future Habitat App? Close both Apps Training Manual Page 14 of 29
21 Click on Split View on the bottom left In Map 1, pan so that Saxis is in the middle of the map, or use the search option to center the map on it. Open the Flood & Sea Level Rise App and select the Basic Inundation data source. In Map 2, search for or zoom and pan to Onancock, Virginia In Map 2, open the Flood & Sea Level Rise App and select the Basic Inundation data source In the Flood & Sea Level Rise App in both maps, set SLR to high and the Scenario Year to 2040 Minimize apps for a better view of the two maps Questions 3: How do the towns differ in terms of impacts from sea level rise? In the Flood & Sea Level Rise App in both maps, adjust the Scenario Year to 2065 Questions 4: What developed areas are most affected in each town? How are infrastructure features such as roads and marinas affected? Hint: use imagery to answer this question. In both maps, activate the Map Layers App and the Social and Economic, Percent population age 65 and over layer. Compare the results between maps, adjusting opacity if necessary. Questions 5: Between these two towns, which age group(s) are most affected by sea level rise? Advanced Questions: Using additional Map Layers App data, and assuming that tidal range (under Base Data) remains the same, how much SLR is necessary before Dennis Drive in Saxis is flooded by high tides? What about Chandler Street in Onancock? Hint: Close any other apps. You may have to zoom in to see the street name. Close apps and return to full extent Press F5 to clear the map V. Use of Tool in Decision-Making a. Comparison - which fire station floods first? Open the Flood & Sea Level Rise App, Basic Inundation data Open the Map Layers App and the Infrastructure, Fire and Rescue Stations layer Change to Imagery Questions: Which of the Fire and Rescue Station in Accomack County floods first and when? What about Northampton County? Questions 2: What is the rough distance between those Fire and Rescue Stations that flood first in each county and the nearest station that is still dry? Hint: use the measure tool to find your answers. Close apps and return to full extent Press F5 to clear the map Training Manual Page 15 of 29
22 b. Group suggestions for locations, settings c. Individuals or groups working on additional examples - Which Eastern Shore of Virginia schools will be most impacted by SLR in the next 50 to 100 years? - What level of Storm Surge may be experienced by homes in Captain s Cove? - Which access routes to coastal island communities are most vulnerable to SLR, and for how long are these communities predicted to remain as uplands? - Which of the two Eastern Shore of Virginia counties will experience the most habitat change (disregarding barrier islands), and which is most impacted in terms of developed dry land? Additional Resources: Send any questions, feedback, or suggestions to vacoastalresilience.org@tnc.org For a quick review, click on the Tour menu while in. Coastal Resilience website: coastalresilience.org Coastal Resilience Training Page: coastalresilience.org/training Coastal Resilience Mapping Portal General Navigation: Coastal Resilience Introduction to Scenario Planning: Coastal Resilience Flood & Sea Level Rise Try Me Video: astal_hazards_tryme.htm Coastal Resilience Future Habitat App: NOTE: Export Page In future you will be able to generate printed maps: Click on the Export Page at the bottom left of the screen Enter a title for a map Check the show legend box Click Generate Map button - a link to a pdf is generated that you can share or print Training Manual Page 16 of 29
23 Virginia Eastern Shore Coastal Resilience Tool Introductory Workshop & Training Manual Glossary of Terms (alphabetical) Locations where these terms occur are noted in [brackets]: Flood & Sea Level Rise = [F&SLR] Future Habitat = [FH] Map Layers = [ML] Map Viewer = [Map Viewer] Absolute Difference:...A measure in feet of the difference current water levels and those during modeled storm events. [F&SLR] Base Data:...A background map layer which shows boundaries, parcels, and roads. [ML] Basic Inundation:...A data source within the Flood & Sea Level Rise App which displays predicted sea level rise for several sea level rise scenarios and scenario years. [F&SLR] Choose Parameters:...A tab in the Future Habitat App window which allows the user to select the Scenario Year and SLR Scenario, affecting the data displayed in the map viewer. Clear All...Clicking this button ( ) clears all selected layers in the Map Layers App. [ML] Clear Filters:...Clicking this button ( ) resets the visible data to its original state, removing drawn areas and other filters that narrow results. [FH] Click to Draw an Area:...Clicking this button ( ) allows the user to draw an area of interest which will exclude all other data. [FH] Compare & Chart:...A tab in the Future Habitat App window which allows the user to view changes between the current inventory of habitat area and the predicted condition. Note that data is only displayed if a future Scenario Year (e.g., 2025) is selected. [FH] Download data:...clicking this button ( ) allows the user to download the current map and data configuration in an ESRI geodatabase format. [FH] Coastal Management:...A background map layer which shows public access sites, boat ramps, streams, flood hazard areas, protected lands, and Virginia Ecological Value Assessment. [ML] Choose Data Source:...A dropdown menu in the Flood & Sea Level Rise App that allows the user to choose which data they would like to view: Basic Inundation or Storm Surge. [F&SLR] Dropdown menu:...a vertical menu of options which is opened by clicking on it. [Map viewer - ] [F&SLR - ] Ecosystem:...A system of biological components (species) and physical components (geography and resources). [FH] Erosion:...Degradation of features such as shorelines or structures, usually by the action of water or wind. [FH] Export Page:...Clicking this button ( ) allows the user to export the current view as an Adobe Acrobat document. The map may also be exported by Training Manual Page 17 of 29
24 clicking the printer icon ( ) in the upper right of the Map Layers App window. [Map viewer] [ML] Filter by Habitat(s) of Interest:.A section of the Future Habitat App which allows the user to reduce the data being displayed to only salt marsh, only other wetlands, or to an area drawn by the user. [FH] Flood & Sea Level Rise App:...An app ( ) which shows the predicted effects of sea level rise and storm surge on the Eastern Shore of Virginia. Includes two datasets: Basic Inundation (focuses on the effects of sea level rise) and Storm Surge (displays predictions for storm surge from hurricanes and tropical storms). [Map viewer] Full Extent:...Clicking this button ( ) returns the view to the entire Eastern Shore of Virginia. [Map viewer] Full Map:...Clicking this button ( or ) will leave the Split View and show only one map in the browser. Future Habitat App:...An app ( ) which shows changes in habitat type in response to predicted sea level rise. [Map viewer] Get Started:...Clicking this text ( ) opens the Launchpad. [Map viewer] Habitat:...The biological and physical settings in which species exist. Also, a background map layer which shows commercial shellfish aquaculture, public oyster grounds and tidal marshes. [ML] Imagery:...Aerial imagery of the Eastern Shore of Virginia. [Map viewer] Infographic:...A simple graphic meant to quickly illustrate the purpose or main concepts of an app. The infographic for the Future Habitat App is accessible by clicking the question mark icon ( ) in the upper right corner of the app window. [FH] Infrastructure:...A background map layer which shows schools, fire stations, roads and evacuations routes. [ML] Inundation:...Flooding of upland areas. [FH] Land Accretion:...Increase in elevation or area of land due to sediment deposition. [FH] Launch Pad:...A collection of geographies (locations) and one-click interactive maps (pre-set data views). [Map viewer] Legend:...A window which shows the list of active layers and their symbology. This can be toggled on and off with the legend button ( ). [Map viewer] Link Maps:...Click this button ( ) when Split View is active in order to tie the map views of Map 1 and Map 2 together, such that zooming in or out or panning in one map will also occur in the other. Initially, Map 2 will Training Manual Page 18 of 29
25 move to the same scale and location as Map 1. Note that app data and other map options are not linked. [Map viewer - CENTER] Map Layers App:...An app ( ) which includes information data layers including schools, roads, tidal range, protected lands, and wetlands. [Map viewer] Measure:...A tool used to measure distance and area. It is activated by clicking the measure button ( ). [Map viewer] Methodology:...A description of the methods used to develop data layers. [F&SLR] [FH] National Geographic:...A background map layer developed by National Geographic. [Map viewer] Nor Ida:...A nor easter that impacted the mid-atlantic in November [F&SLR] Ocean:...A background map layer developed by the National Oceanic and Atmospheric Administration. [Map viewer] Opacity:...The extent to which an image is not transparent. [ML] Opaque:...The opposite of transparent. Appears in transparency slider bars ( ). [F&SLR] [FH] Pan:...Moving the map by clicking, holding, and dragging the mouse. [Map viewer] Percent Difference:...A measure in percentage of the difference between current water levels and those during modeled storm events. [F&SLR] Physical Features:...A background map layer which shows physical geography. [ML] Results & Chart...A tab in the Future Habitat App window which allows the user to view a pie chart and chart explaining acreage of habitat types in the total dataset or a user-defined area for the selected Scenario Year and SLR Scenario. [FH] Save & Share:...Clicking this button ( ) allows the user to save the map view and active datasets in order to return to the map or share it with others. [Map viewer] Scenario Year:...The year for which predictions (sea level rise, storm surge, or habitat change) were calculated. [F&SLR] [FH] Sea Level Rise (SLR):...The predicted increase in the elevation of sea water over time. [F&SLR] [FH] [ML] Shaded Relief:...A background layer which shows elevation of uplands. [Map viewer] Social and Economic:...A background map layer which shows persons by age, area and certain types of employment. [ML] Spatial Model Outputs:...Data generated by models which, in this case, estimate changes in marsh extent due to sea level rise. [FH] Split View:...Clicking this button ( ) will split the browser window into two map views, each with its own apps, legend, and options. Note that there is a separate Export Page option for each map. [Map viewer] Training Manual Page 19 of 29
26 Storm Surge:...Increased water height due to storm dynamics. Also a data source in the Flood & Sea Level Rise App. [F&SLR] Storm Tracks:...Paths taken by hurricanes and tropical storms which were used as the basis for modeling storm surge. [F&SLR] Storm Type:...A classification format for modeled hurricane impacts in the Flood & Sea Level Rise App Storm Surge dataset. Impacts from low Intensity storms were based on three theoretical Category 1 hurricanes with maximum winds of 80 miles per hour (mph). Impacts from Moderate Intensity storms were based on six theoretical Category 1 and 2 hurricanes with maximum winds between 85 and 110 mph. Impacts from High Intensity storms were based on seven Category 2 and 3 hurricanes with maximum winds between 95 and 115 mph. Impacts from Nor Ida are based on the storm surge generated by that particular storm. Impacts from each of these Storm Types are shown for current conditions and two future Scenario Years in which the sea level has risen. [F&SLR] Streets:...A background map layer which shows roadways. [Map viewer] Switch to Map 1 (or Map 2):...Click this button ( or ) to switch between single views of two separate map views. [Map viewer] Terrain:...A background map layer which shows differences in terrain. [Map viewer] Tidal Range (ft):...data regarding the typical variability in water level due to tides. [F&SLR] [ML] Topographic:...A background map layer which shows roads, waterways, elevation, forested land, and wetlands. [Map viewer] Tour:...Clicking this text ( ) opens a quick reference for the parts of the Coastal Resilience tool map viewer. [Map viewer] Transparent:...Allowing light or background images to be seen, as through glass. [F&SLR] [FH] Unlink Maps:...Clicking this button ( ) unlinks the maps in Split View, such that changes in scale and location in one map will not be reflected in the other. [Map viewer - CENTER] Water Depth (ft):...a measure of the predicted depth of water in feet due to storm surge. [F&SLR] View Methodology:...Clicking this button ( ) will load a document which explains the methods used to develop data for the subject app. [F&SLR] [FH] Zoom:...To change the scale of the map viewer. Click on the zoom in button ( ) for a narrower view or the zoom out button ( ) for a wider view. [Map viewer] Zoom to Selection:...Clicking this button ( ) will zoom to the area drawn by the user using the Click to Draw an Area option. [FH] Training Manual Page 20 of 29
27 Virginia Eastern Shore Coastal Resilience Tool Introductory Workshop & Training Manual Hints and Tips 1. The Coastal Resilience tool is web-based. Make sure your internet connection is working before use. 2. The Coastal Resilience tool can be used in most Internet browsers, including Chrome, Internet Explorer, Firefox, and Safari. However, be sure your browser is up-to-date to avoid issues. 3. It is a good practice to reboot your device before using the tool to ensure that you have sufficient memory available to use it. 4. It may be helpful to periodically refresh the browser window (refresh button or F5 key) in which you are viewing the Coastal Resilience tool in order to prevent errors from occurring. Keep in mind that refreshing will return the Coastal Resilience tool to its beginning state. 5. Refresh your browser window if the Coastal Resilience tool seems laggy, if layers are stuck or not showing, or if features seem to be acting strangely. Again, this will return the Coastal Resilience tool to its beginning state. The F5 key is your friend! 6. If the Coastal Resilience tool really seems to be stuck, try clearing the local cache in your browser by pressing Control + F5 (you may want to press this several times to fully clear the system). On an Apple machine the command is Command + R. You can also close the browsing window or tab and open it again to fully flush the site. 7. Another option to avoid issues caused by web browser history is to open the Coastal Resilience tool in a window which does not retain cookies or other browsing data. This is known by different names in different web browsers. For example: o Chrome: incognito window o Internet Explorer: InPrivate Browsing o Firefox and Safari: private browsing window 8. The Coastal Resilience tool is optimized to work on desktops and laptops, and may experience issues when open in a tablet or hand-held devices. Additionally, the Coastal Resilience tool map viewer may seem crowded when viewed on a laptop. 9. If a background map layer does not load (grey screen displayed), try choosing another layer or changing the zoom level. Some layers do not appear when zoomed in extensively. 10. For a quick run-down on the functions of the tool click on Tour this will point to the different elements of the tool and give a short explanation of them. 11. When you open an app the icon changes color and appears like an app on your phone. When done using the app you can either use the close ( x ) button in the upper right hand corner to remove it from being active, and will remove data from the map, or the minimize ( _ ) button Training Manual Page 21 of 29
28 to have it remain active and therefore keep data on the map. You can have multiple apps open minimizing the apps helps maximize how much of the map is shown. Keep in mind that opening the Map Layers App will minimize other open apps. 12. Likewise, the Map Legend can be minimized ( _ ) to get the legend back you will find a white button on the left side of the map. Hover your cursor over these button and they will tell you what they do. 13. Most of the windows that appear on the map (i.e. app windows, map legend) can be dragged around by clicking down on your mouse when the cursor is hovering over the top black bar. They can also be resized and may need to be, depending on your browser, platform (computer, tablet, etc.), and the amount of data being shown (Map Legend, for example). Click and drag the bottom right corner of the window to resize it, or simply scroll up or down in the window to view additional data. 14. App data displays in the order in which you access it. For example, if you open the Flood & Sea Level Rise App first, then the Future Habitat App, future habitat data will be layered on top. For this reason, we recommend opening the Map Layer App last if you wish to use it. 15. Clicking on data that appears on the map will open an Identify window showing the attributes of the data layer. If the Identify box is too big and goes off the map then pan the map (click and hold mouse down, then drag) until you see the entire window; the Identify window does not move. 16. You can also hold the Shift key down and click and hold the mouse to draw a box map for zooming into a particular area. 17. Using Split View creates two maps. The left map is Full Map 1, the right map is Full Map 2. When you want to go back to viewing a single map you can choose Map 1 or Map 2 and switch between them without having to go back to Split View. 18. We do not recommend using the Coastal Defense app in Split View given the size of the input app window. 19. Remember that the Coastal Resilience tool is a work in progress! If you find obvious errors, feel free to report them to vacoastalresilience@tnc.org. Thank you very much for using the Coastal Resilience tool! If you have any feedback, please submit it in the form of our Post-Workshop Survey, or speak with a member of our training team. Training dates for our Coastal Defense and Barrier Island Apps will be released soon! Training Manual Page 22 of 29
29 Virginia Eastern Shore Coastal Resilience Tool Introductory Workshop & Training Manual Instruction Guidelines Overview This is a brief guide to help you show others how to use the Coastal Resilience Tool for the Eastern Shore of Virginia. You will need copies of the following for the participants: Skills & Exercise List Glossary of Terms Tips and Hints Below you will find the Learning Outcomes as a guide to what is covered in the Skills and Exercise List and what participants should be able to do once they have worked through that list with you. First complete the Learning Outcomes A. Participants will be able to: 1. Briefly explain the purpose, use and limitations of the Coastal Resilience Tool to support decision-making. 2. Activate and use the Flood & Sea Level Rise app and set the following parameters: a. Choose a Data Source for Basic Inundation or Storm Surge b. Scenario Year c. SLR (Sea Level Rise) d. Storm Type e. Additional Layers f. Opacity 3. Activate and use the Future Habitat app and set the parameters for: a. Choose Parameters b. Scenario Year c. Draw a User Defined Area and Zoom to Selection d. Choose a Habitat e. Filter by Habitat of Interest f. Find the analysis results in the Results & Chart tab and the Compare & Chart tab. 4. Activate and use the Map Layers app and set the parameters for: a. Set the data points on the map within the following layer options: i. Base Data ii. Infrastructure iii. Coastal Management iv. Habitats v. Physical Features vi. Social & Economic Training Manual Page 23 of 29
30 b. Set the Opacity c. Use the layers in combination with other apps d. Use the Clear All function to remove all layers 5. Briefly explain the Key Points of the Flood & Sea Level Rise, Future Habitat and Map Layers app as follows: a. The difference between Low, High, and Highest SLR (sea level rise) b. The Year Scenarios c. Inundation d. Storm Surge e. Opacity 6. Activate the Split Screen and Lock tool to show two maps and use apps to compare data in two maps. 7. Use the map tools to Search for an area, draw a User Defined Area, zoom in and pan around an area and use the apps on that particular area. 8. Use the Save and Share function to save a map, copy the link and share it with others for later use a particular map. Skills to Complete I. CR Tool Basic Skills Navigation & Apps Flood & Sea Level Rise App Basic Inundation Option SKILLS COMPLETED Choose Basic Inundation, set SLR to High and Scenario Year to 2040, 2065, 2100 Choose Basic Inundation, set SLR to Highest and Scenario Year to 2040, 2065, 2100 Click on the zoom in [+] and zoom out [-] tools, and pan around the map using the mouse Return map to the full extent main view Future Habitat App SKILLS COMPLETED Choose Scenario Year 2065, set SLR to HIGH, click on Click to Draw an Area, create a box around a particular area, click on Zoom to Selection, and filter results by salt marsh Flood and Sea Level Rise App - Storm Surge Option SKILLS COMPLETED Choose Storm Surge, set Scenario Year to 2040, set Storm Type to Nor Ida, then to Moderate Intensity Choose Storm Surge, set Scenario Year to 2065, set Storm Type to Moderate Intensity, and set Depth or Difference to Water Depth Under Additional Layers, select Show Tidal Range Training Manual Page 24 of 29
31 Map Layers App and Use with Future Habitat SKILLS COMPLETED Map Layers with Future Habitat App: Click on Map Layers. Under Infrastructure, click checkboxes for Roads vulnerable to 1 ft., 2 ft. and 3 ft. Sea Level Rise. Open Future Habitat and set Scenario Year to 2065 and SLR to High. Look at how the roads have been covered by water or marshes. Zoom in [+] for a better view. II. Next Level Skills Additional Tools Search Tool, Imagery, Use of Split Screen, & Measuring SKILLS COMPLETED Search tool and imagery: Map 1: Type the location Brownsville, Virginia, into the search bar, open the Basic Inundation App, set Choose SLR to Low, set Scenario Year to 2100, select Imagery from the background layer dropdown menu, and change the Flood & Sea Level Rise Layer Properties slider to more transparent. Split screen and measuring: Map 2: Click on Split View, minimize open apps, click on Link Maps, change the background layer of Map 2 to Imagery, open the Basic Inundation App in Map 2, set Choose SLR to High, set Scenario Year to 2100, and minimize the app. Compare the inundation maps for Brownsville in the present and future conditions. Click on the measure tool and measure the length of the narrow pond at Brownsville by clicking once at the start and double-clicking at the end. Save and Share function Exercises Work through the Exercises in the Skill and Exercise List. Once these are completed you can try examples of your own or suggested by the participants 1. Future Habitat App Use of the Brownsville, VA Map 2. Flood & Sea Level Rise Storm Surge App Quinby, Virginia 3. Future Habitat App Saxis and Onancock, VA Use of the Tool in Decision-Making Using the examples given or ones that apply to your area, discuss how the Tool can be used to support decision-making, as well as its limitations. Training Manual Page 25 of 29
32


33 Coastal Resilience on Virginia s Eastern Shore An unprecedented effort to reduce risks from sea-level rise and storms and identify nature-based solutions to enhance resilience. T he Eastern Shore of Virginia lies within one of the nation s most threatened coastal regions. Sea levels here are rising at three to four times the global average and storms are expected to intensify, both linked, in part, to climate change. Tens of millions of dollars have been spent in the past on piecemeal and reactive approaches to address the mounting challenges of climate-related hazards. Often these efforts have exacerbated the area s vulnerability. Founded in 2010, the Eastern Shore Climate Adaptation Working Group, coordinated by the Accomack-Northampton Planning District LANDSAT 7 TM image of the Delmarva Peninsula on the U.S. East Coast, 2009 Commission, is addressing this challenge through education, outreach, and providing information to local communities to plan for sea-level rise, recurrent flooding, and storm surge. These efforts have resulting in achieving a major new milestone: The U.S. Department of Interior has awarded $1.46 million from the Hurricane Sandy Coastal Resiliency Fund to The Nature Conservancy and Climate Adaptation Working Group partners to equip coastal communities with the tools and information urgently needed to reduce the risks posed by climate-related hazards and enhance the area s natural resilience. This will be accomplished through two major initiatives: Volunteers constructing oyster reef from Oyster Castles near Box Tree. Photo by Bowdoin Lusk 1. Create Eastern Shore Coastal Resilience Planning Tool. The Coastal Resilience tool incorporates the best available science, data, and state-of-the-art analytical tools for assessing risks of sea-level rise, storm surge, and changing habitats on people and the environment of the Eastern Shore using local information. The novelty of this tool is that it enables identification of nature-based solutions like oyster and wetland restoration to mitigate risk and enhance resilience. 2. Demonstrate Nature-Based Solutions. The Nature Conservancy and partners are restoring five oyster reefs that are being used to demonstrate and quantify how natural infrastructure can dampen wave energy and mitigate coastal erosion. Three of these reefs are being restored along eroded roads at Chincoteague National Wildlife Refuge and two have been built fronting a marsh near the Village of Oyster. Training Manual Page 26 of 29


34 Why the Eastern Shore Though rural in character, the Eastern Shore is an important economic engine in the Mid-Atlantic. The region is home to the nation s largest clam aquaculture industry, a premier NASA rocket launch facility, and extensive public lands available for recreational and ecotourism activities, including Chincoteague National Wildlife Refuge. The activities are all possible because of the Eastern Shore s unparalleled natural riches and coastal wilderness. Along its seaside runs the world s longest expanse of a naturally functioning barrier island ecosystem. This critical habitat for migratory birds and marine life has been the site of intensive scientific research over the last three decades by the University of Virginia s Virginia Coast Reserve Long-Term Ecological Research Project, which is funded by the National Science Foundation. Antares rocket launch from NASA-Wallops Flight Facility. Photo courtesy of NASA. The Future Working together with the Eastern Shore Climate Adaptation Working Group, The Nature Conservancy, Accomack- Northampton Planning District Commission, and UVA s Long- Term Ecological Research Project have an unprecedented opportunity to apply best available science to develop planning tools and natural infrastructure solutions that have the potential to mitigate risks of sea-level rise and storms while enhancing the Eastern Shore s unique natural resilience now and for future generations. Shoreline at Franklin City. Photo by Gwynn Crichton The Eastern Shore is not alone in its plight, yet it is poised to be a leader for communities facing similar challenges. The science and the support tools that emerge from this effort will transfer broadly to other coastal systems, transforming the Eastern Shore into a model of resilience for coastal communities around the globe. For More Information, please visit: coastalresilience.org/virginia Contact for questions, feedback, or suggestions: vacoastalresilience.org@tnc.org Training Manual Page 27 of 29

35 coastalresilience.org/virginia Training Manual Page 28 of 29
36 maps.coastalresilience.org/virginia Training Manual Page 29 of 29
Virginia Eastern Shore Coastal Resilience Mapping & Decision Support Tool
 Virginia Eastern Shore Coastal Resilience Mapping & Decision Support Tool Training Manual Version 3.0 (August 2017) Gordon Campbell A project funded by the Department of Interior Hurricane Sandy Coastal
Sea Level Affecting Marshes Model (SLAMM) for Coastal Long Island Sound:
 for Coastal Long Island Sound:") 2100 DATA VIEWER MANUAL Sea Level Affecting Marshes Model (SLAMM) for Coastal Long Island Sound: Using a Web Mapping Application Data Viewer to Examine Predicted Land Cover Change for 2100 AUTHOR: KEVIN
2100 DATA VIEWER MANUAL Sea Level Affecting Marshes Model (SLAMM) for Coastal Long Island Sound: Using a Web Mapping Application Data Viewer to Examine Predicted Land Cover Change for 2100 AUTHOR: KEVIN
Child Opportunity Index Mapping
 Child Opportunity Index Mapping A partnership project of How to Use and Interpret the Child Opportunity Index Maps How to Use the Child Opportunity Index Maps Getting Started: How to Find and Open a Child
BOUNDARY MAP USER GUIDE
 BOUNDARY MAP USER GUIDE Get Exploring. Boundaries. The Northern Ontario Boundary Map provides users with the ability to explore the many community, administrative and service provider boundaries in the
Module 10 Summative Assessment
 Module 10 Summative Assessment Activity In this activity you will use the three dimensions of vulnerability that you learned about in this module exposure, sensitivity, and adaptive capacity to assess
Map My Property User Guide
 Map My Property User Guide Map My Property Table of Contents About Map My Property... 2 Accessing Map My Property... 2 Links... 3 Navigating the Map... 3 Navigating to a Specific Location... 3 Zooming
Virginia Shoreline Mapping Tools
 Virginia Shoreline Mapping Tools December 15, 2017 Karen Duhring Center for Coastal Resources Management Virginia Institute of Marine Science College of William & Mary Virginia Shoreline Mapping Tools
OneStop Map Viewer Navigation
 OneStop Map Viewer Navigation» Intended User: Industry Map Viewer users Overview The OneStop Map Viewer is an interactive map tool that helps you find and view information associated with energy development,
ICAN Great Lakes 2010 Workshop
 ICAN Great Lakes 2010 Workshop Chris Cortina Maryland s Chesapeake & Coastal Program MD Department of Natural Resources Maryland s Coastal Atlas: What is it? The Coastal Atlas is an online mapping and
Introducing IMS. v) Select the Zoom to Full Extent tool. Did you return to the original view?
 Select the Zoom to Full Extent tool. Did you return to the original view?") Ocean/ENVIR 260, Winter 2006 Lab 1, Get to Know the Puget Sound Watershed Name Introducing IMS 1) Open your web browser and navigate to http://128.208.23.127/website/lab1. (This link can be found on the
Ocean/ENVIR 260, Winter 2006 Lab 1, Get to Know the Puget Sound Watershed Name Introducing IMS 1) Open your web browser and navigate to http://128.208.23.127/website/lab1. (This link can be found on the
Guide to Hydrologic Information on the Web
 NOAA s National Weather Service Guide to Hydrologic Information on the Web Colorado River at Lees Ferry Photo: courtesy Tim Helble Your gateway to web resources provided through NOAA s Advanced Hydrologic
An Instructional Module. FieldScope Unit 1. Introduction to National Geographic Society s FieldScope Program.
 An Instructional Module FieldScope Unit 1 www.budburst.org/fieldscope Introduction to National Geographic Society s FieldScope Program Unit Contents Overview 3 Learning Objectives Time Commitment Technical
Watershed Modeling Orange County Hydrology Using GIS Data
 v. 10.0 WMS 10.0 Tutorial Watershed Modeling Orange County Hydrology Using GIS Data Learn how to delineate sub-basins and compute soil losses for Orange County (California) hydrologic modeling Objectives
1) make sure folks know what s available in terms of geospatial data and resources that could contribute to their decision support toolkits;
 make sure folks know what s available in terms of geospatial data and resources that could contribute to their decision support toolkits;") Introduction 1 2001 It was born out of the recognition that several of the regions prominent resource management agencies have similar, if not shared, requirements for GIS data. Some of the underlying
Introduction 1 2001 It was born out of the recognition that several of the regions prominent resource management agencies have similar, if not shared, requirements for GIS data. Some of the underlying
(THIS IS AN OPTIONAL BUT WORTHWHILE EXERCISE)
") PART 2: Analysis in ArcGIS (THIS IS AN OPTIONAL BUT WORTHWHILE EXERCISE) Step 1: Start ArcCatalog and open a geodatabase If you have a shortcut icon for ArcCatalog on your desktop, double-click it to start
PART 2: Analysis in ArcGIS (THIS IS AN OPTIONAL BUT WORTHWHILE EXERCISE) Step 1: Start ArcCatalog and open a geodatabase If you have a shortcut icon for ArcCatalog on your desktop, double-click it to start
Introduction to Coastal GIS
 Introduction to Coastal GIS Event was held on Tues, 1/8/13 - Thurs, 1/10/13 Time: 9:00 am to 5:00 pm Location: Roger Williams University, Bristol, RI Audience: The intended audiences for this course are
Learning ArcGIS: Introduction to ArcCatalog 10.1
 Learning ArcGIS: Introduction to ArcCatalog 10.1 Estimated Time: 1 Hour Information systems help us to manage what we know by making it easier to organize, access, manipulate, and apply knowledge to the
SECOORA Data Portal Exercises
 SECOORA Data Portal Exercises Exercise #1: April 2018- Carolina Storm using Historic Real-time Sensor Exercise #2: Exploration of Data Trends for Estuarine Fish Abundance and Sea Surface Temperature Exercise
GIS Workshop UCLS_Fall Forum 2014 Sowmya Selvarajan, PhD TABLE OF CONTENTS
 TABLE OF CONTENTS TITLE PAGE NO. 1. ArcGIS Basics I 2 a. Open and Save a Map Document 2 b. Work with Map Layers 2 c. Navigate in a Map Document 4 d. Measure Distances 4 2. ArcGIS Basics II 5 a. Work with
Promoting Resilience to Changing Weather
 Promoting Resilience to Changing Weather Harpswell Neck Harpswell Sound Orr s Island Basin Cove Pott s Point Harpswell Conservation Commission March 30, 2017 What Does This Mean for Harpswell? Topography
Draft for Discussion 11/11/2016
 Coastal Risk Consulting (CRC) Climate Vulnerability Assessment for Village of Key Biscayne Deliverable 1.1 in Statement of Work. Preliminary Vulnerability Assessment Identifying Flood Hotspots Introduction...
Search for the Gulf of Carpentaria in the remap search bar:
 This tutorial is aimed at getting you started with making maps in Remap (). In this tutorial we are going to develop a simple classification of mangroves in northern Australia. Before getting started with
Coastal Emergency Risks Assessment - CERA Real-Time Storm Surge and Wave Visualization Tool
 Coastal Emergency Risks Assessment - CERA Real-Time Storm Surge and Wave Visualization Tool Introduction This document provides guidance for using the Coastal Emergency Risks Assessment (CERA) visualization
Lesson Plan 2 - Middle and High School Land Use and Land Cover Introduction. Understanding Land Use and Land Cover using Google Earth
 Understanding Land Use and Land Cover using Google Earth Image an image is a representation of reality. It can be a sketch, a painting, a photograph, or some other graphic representation such as satellite
In this exercise we will learn how to use the analysis tools in ArcGIS with vector and raster data to further examine potential building sites.
 GIS Level 2 In the Introduction to GIS workshop we filtered data and visually examined it to determine where to potentially build a new mixed use facility. In order to get a low interest loan, the building
Student Activity Sheet- Denali Topo Map
 Student Activity Sheet- Denali Topo Map Directions: Follow the steps in order and answer the associated questions as you proceed through the activity. The first part of the activity will be guided by your
GIS: Introductory Guide to MapPlace. Workshop Agenda. How the Maps Work. Geographic Information Systems. -The MapPlace is a web GIS application
 1 Introductory Guide to MapPlace Workshop 2007 Larry Jones MapPlace & Geoscience Databases Pat Desjardins Corporate GIS Gib McArthur Manager, Resource Information Kirk Hancock MINFILE Geologist Ward Kilby
Koenji. Using ARCGIS Online to explore a place
 Koenji Using ARCGIS Online to explore a place ArcGIS Online is a GIS program that can be opened at http://www.arcgis.com/home/ You can click on Sign-up now or Make a map to get started. It is free to use
ESCI 121 Physical Geology
 Observing Streams & Rivers in Google Earth Dr. Jennifer L. Piatek Dept. of Physics and Earth Sciences Central Connecticut State University 506 Copernicus Hall 1615 Stanley Street New Britain, CT 06050
How to Make or Plot a Graph or Chart in Excel
 This is a complete video tutorial on How to Make or Plot a Graph or Chart in Excel. To make complex chart like Gantt Chart, you have know the basic principles of making a chart. Though I have used Excel
NR402 GIS Applications in Natural Resources
 NR402 GIS Applications in Natural Resources Lesson 1 Introduction to GIS Eva Strand, University of Idaho Map of the Pacific Northwest from http://www.or.blm.gov/gis/ Welcome to NR402 GIS Applications in
Global Atmospheric Circulation Patterns Analyzing TRMM data Background Objectives: Overview of Tasks must read Turn in Step 1.
 Global Atmospheric Circulation Patterns Analyzing TRMM data Eugenio Arima arima@hws.edu Hobart and William Smith Colleges Department of Environmental Studies Background: Have you ever wondered why rainforests
User Guide. Affirmatively Furthering Fair Housing Data and Mapping Tool. U.S. Department of Housing and Urban Development
 User Guide Affirmatively Furthering Fair Housing Data and Mapping Tool U.S. Department of Housing and Urban Development December, 2015 1 Table of Contents 1. Getting Started... 5 1.1 Software Version...
Investigation 5: What happens when plates move sideways past each other?
 Tectonics Investigation 5: Teacher Guide Investigation 5: What happens when plates move sideways past each other? Plates move sideways past each other at transform boundaries. At these boundaries, the
M E R C E R W I N WA L K T H R O U G H
 H E A L T H W E A L T H C A R E E R WA L K T H R O U G H C L I E N T S O L U T I O N S T E A M T A B L E O F C O N T E N T 1. Login to the Tool 2 2. Published reports... 7 3. Select Results Criteria...
HURREVAC REFERENCE IMPORTANT INFORMATION TO KNOW WHEN A STORM IS APPROACHING
 HURREVAC REFERENCE IMPORTANT INFORMATION TO KNOW WHEN A STORM IS APPROACHING PART 1: Workspace Layout Program Header (1 Red) Includes tools that allow the user to manage program setup, update forecast
NEW HOLLAND IH AUSTRALIA. Machinery Market Information and Forecasting Portal *** Dealer User Guide Released August 2013 ***
 NEW HOLLAND IH AUSTRALIA Machinery Market Information and Forecasting Portal *** Dealer User Guide Released August 2013 *** www.cnhportal.agriview.com.au Contents INTRODUCTION... 5 REQUIREMENTS... 6 NAVIGATION...
City of Roswell, GA GIS VIEWER USER GUIDE
 City of Roswell, GA GIS VIEWER USER GUIDE Version 1.0 06/27/2018 GIS VIEWER USER GUIDE This user guide will introduce and outline the various tools available through the City of Roswell s Public GIS Viewer.
Studying Topography, Orographic Rainfall, and Ecosystems (STORE)
") Introduction Studying Topography, Orographic Rainfall, and Ecosystems (STORE) Lesson: Using ArcGIS Explorer to Analyze the Connection between Topography, Tectonics, and Rainfall GIS-intensive Lesson This
Introduction Studying Topography, Orographic Rainfall, and Ecosystems (STORE) Lesson: Using ArcGIS Explorer to Analyze the Connection between Topography, Tectonics, and Rainfall GIS-intensive Lesson This
The Geodatabase Working with Spatial Analyst. Calculating Elevation and Slope Values for Forested Roads, Streams, and Stands.
 GIS LAB 7 The Geodatabase Working with Spatial Analyst. Calculating Elevation and Slope Values for Forested Roads, Streams, and Stands. This lab will ask you to work with the Spatial Analyst extension.
Introducing the. a partnership of
 Introducing the a partnership of Background Need for online atlas identified by managers and researchers to make coastal data available Shoreline data Ocean and coastal resources Sea-level rise potential
Simulating Future Climate Change Using A Global Climate Model
 Simulating Future Climate Change Using A Global Climate Model Introduction: (EzGCM: Web-based Version) The objective of this abridged EzGCM exercise is for you to become familiar with the steps involved
Visualizing hurricanes
 Visualizing hurricanes NAME: DATE: Scientific visualization is an integral part of the process of simulating natural phenomena. In the computational sciences, the main goal is to understand the workings
Water Information Portal User Guide. Updated July 2014
 Water Information Portal User Guide Updated July 2014 1. ENTER THE WATER INFORMATION PORTAL Launch the Water Information Portal in your internet browser via http://www.bcogc.ca/public-zone/water-information
My Map Activity MINNESOTA SOCIAL STUDIES STANDARDS & BENCHMARKS
 My Map Activity OVERVIEW & OBJECTIVES Students will learn the basics of Google Maps while using geospatial data to create their neighborhood map with the places they spend time. They will also collect
Create Satellite Image, Draw Maps
 Create Satellite Image, Draw Maps 1. The goal Using Google Earth, we want to create and import a background file into our Adviser program. From there, we will be creating paddock boundaries. The accuracy
EOSC 110 Reading Week Activity, February Visible Geology: Building structural geology skills by exploring 3D models online
 EOSC 110 Reading Week Activity, February 2015. Visible Geology: Building structural geology skills by exploring 3D models online Geological maps show where rocks of different ages occur on the Earth s
Community Opportunity Map
 Community Opportunity Map User Guide and FAQs UPDATED FEBRUARY 2018 Contents User Guide... 2 Overview... 2 Choosing a location... 3 Search for a city or address... 4 Select a county or ZIP code... 4 Explore
Lightcloud Application
 Controlling Your Lightcloud System Lightcloud Application Lightcloud Application Navigating the Application Devices Device Settings Organize Control Energy Scenes Schedules Demand Response Power Up State
CREATING A REPORT ON FIRE (April 2011)
") CREATING A REPORT ON FIRE (April 2011) The Fire Report feature on the NAFI website lets you create simple summaries of fire activity for areas of land in far northern Australia (north of 20 degrees where
CREATING A REPORT ON FIRE (April 2011) The Fire Report feature on the NAFI website lets you create simple summaries of fire activity for areas of land in far northern Australia (north of 20 degrees where
The Coastal Change Analysis Program and the Land Cover Atlas. Rebecca Love NOAA Office for Coastal Management
 The Coastal Change Analysis Program and the Land Cover Atlas Rebecca Love NOAA Office for Coastal Management Natural Infrastructure = Greater Resilience NOAA C-CAP Regional Land Cover and Change coast.noaa.gov/digitalcoast/data/ccapregional
McIDAS-V Tutorial Displaying Point Observations from ADDE Datasets updated July 2016 (software version 1.6)
") McIDAS-V Tutorial Displaying Point Observations from ADDE Datasets updated July 2016 (software version 1.6) McIDAS-V is a free, open source, visualization and data analysis software package that is the
McIDAS-V Tutorial Displaying Point Observations from ADDE Datasets updated July 2016 (software version 1.6) McIDAS-V is a free, open source, visualization and data analysis software package that is the
Great Lakes Online Watershed Interface W. Elliot, Research Engineer USDA Forest Service Rocky Mountain Research Station, Moscow, ID March, 2016
 Great Lakes Online Watershed Interface W. Elliot, Research Engineer USDA Forest Service Rocky Mountain Research Station, Moscow, ID March, 2016 Guidelines for using the Web WEPP Watershed Tool to Support
Module 7, Lesson 1 Water world
 Module 7, Lesson 1 Water world Imagine that the year is 2100. Scientists have determined that the rapidly warming climate of the earth will cause the ice sheets of Antarctica to break apart and melt at
Welcome to NetMap Portal Tutorial
 Welcome to NetMap Portal Tutorial Potential Applications What Can you do with the Portal? At least 25 things! 1) Locate the best potential fish habitats. 2) Identify biological hotspots. 3) Map floodplain
Module 7, Lesson 2 In the eye of the storm
 Module 7, Lesson 2 In the eye of the storm October 21, 1998 A tropical storm is brewing in the Atlantic Ocean. It began as a tropical wave a few weeks earlier, off the coast of western Africa. Today it
NMR Predictor. Introduction
 NMR Predictor This manual gives a walk-through on how to use the NMR Predictor: Introduction NMR Predictor QuickHelp NMR Predictor Overview Chemical features GUI features Usage Menu system File menu Edit
Introduction to Google Earth
 Introduction to Google Earth Name Goals 1. To become proficient at using the basic features of Google Earth. 2. To recognize differences in coastal features between the east and west coast of North America.
Resilient Landscapes Fund
 Resilient Landscapes Fund Definitions and Map Guide 2017 This document includes definitions of key terms and instructions for developing maps for application to OSI s Resilient Landscapes Fund. INTRODUCTION
REPLACE DAMAGED OR MISSING TEXTBOOK BARCODE LABEL
 Destiny Textbook Manager allows users to create and print replacement barcode labels for textbooks. In this tutorial you will learn how to: Replace damaged textbook barcode label(s) Replace missing textbook
The 7th Annual SARGIS Workshop and Meeting. Welcome to SARGIS7!
 The 7th Annual SARGIS Workshop and Meeting Welcome to SARGIS7! The National Alliance for Public Safety GIS Foundation is a 501 (C) (3) not-forprofit organization» OUR VISION A Nation of emergency responders
Tutorial 8 Raster Data Analysis
 Objectives Tutorial 8 Raster Data Analysis This tutorial is designed to introduce you to a basic set of raster-based analyses including: 1. Displaying Digital Elevation Model (DEM) 2. Slope calculations
Geology Setting Management Options Management Structure
 Geology Setting Management Options Management Structure WFF = Wallops Flight Facility LST = Longshore sediment transport SLR = Sea level rise September 29, 2015 Accomack County/Accomack Northampton County
Gray Whale Migration and Feeding Introduction to Geographic Information System Use in Marine Biology
 Gray Whale Migration and Feeding Introduction to Geographic Information System Use in Marine Biology Developed by: Bert Pooth and Eric A. Sproles Before you begin using this module, you will need to know
Assignment #0 Using Stellarium
 Name: Class: Date: Assignment #0 Using Stellarium The purpose of this exercise is to familiarize yourself with the Stellarium program and its many capabilities and features. Stellarium is a visually beautiful
Week 8 Cookbook: Review and Reflection
 : Review and Reflection Week 8 Overview 8.1) Review and Reflection 8.2) Making Intelligent Maps: The map sheet as a blank canvas 8.3) Making Intelligent Maps: Base layers and analysis layers 8.4) ArcGIS
Write a report (6-7 pages, double space) on some examples of Internet Applications. You can choose only ONE of the following application areas:
 on some examples of Internet Applications. You can choose only ONE of the following application areas:") UPR 6905 Internet GIS Homework 1 Yong Hong Guo September 9, 2008 Write a report (6-7 pages, double space) on some examples of Internet Applications. You can choose only ONE of the following application
UPR 6905 Internet GIS Homework 1 Yong Hong Guo September 9, 2008 Write a report (6-7 pages, double space) on some examples of Internet Applications. You can choose only ONE of the following application
Digital Tax Maps Westport Island Project Summary
 Digital Tax Maps Westport Island Project Summary Presented to the: Mid-Coast Regional Planning Commission Creating GIS-Based Digital Tax Maps And Linked Assessment Records For Small Towns on a Budget Dennis
Introduction to ArcGIS 10.2
 Introduction to ArcGIS 10.2 Francisco Olivera, Ph.D., P.E. Srikanth Koka Lauren Walker Aishwarya Vijaykumar Keri Clary Department of Civil Engineering April 21, 2014 Contents Brief Overview of ArcGIS 10.2...
HURREVAC The software Tool used by emergency officials for hurricane evacuation assistance
 HURREVAC 2010 A Quick Reference enc e Guide The software Tool used by emergency officials for hurricane evacuation assistance www.hurrevac.com FinalHURREVAC2010Guide.indd 1 About HURREVAC HURREVAC is a
Using Web GIS to Build Consensus and Combat Wildland Fire Threats
 Using Web GIS to Build Consensus and Combat Wildland Fire Threats By Mike Price, Entrada/San Juan, Inc. What You Will Need ArcGIS 10.3 for Desktop (any license level) An ArcGIS Online account (one comes
Expanding Canada s Rail Network to Meet the Challenges of the Future
 Expanding Canada s Rail Network to Meet the Challenges of the Future Lesson Overview Rail may become a more popular mode of transportation in the future due to increased population, higher energy costs,
1. Open IDV. There is a desktop link, choose version 3.0u1 or 3.0u2. It can take a few minutes to open.
 Page 1 Objectives: Become familiar with using a software package (IDV) to view satellite images Understand the differences between Visible, IR, and Microwave Imagery Observe the influence of dry air and
Chapter 1. GIS Fundamentals
 1. GIS Overview Chapter 1. GIS Fundamentals GIS refers to three integrated parts. Geographic: Of the real world; the spatial realities, the geography. Information: Data and information; their meaning and
Create your own map for tidepooling, beach field trips, boating, camping, kayaking, fishing, and exploring the beaches in Southcentral Alaska.
 Create your own map for tidepooling, beach field trips, boating, camping, kayaking, fishing, and exploring the beaches in Southcentral Alaska. Here s an opportunity to download and customize your own free
Table-Top Exercise for Emergency Preparedness Evaluation: Little Anse, Isle Madame
 Table-Top Exercise for Emergency Preparedness Evaluation: Little Anse, Isle Madame Alexander Chung, M.Sc. Candidate C-Change Student Research Associate May 2013 The Community of Little Anse Coastal community
Electric Fields and Equipotentials
 OBJECTIVE Electric Fields and Equipotentials To study and describe the two-dimensional electric field. To map the location of the equipotential surfaces around charged electrodes. To study the relationship
Module 7, Lesson 1 Water world
 Module 7, Lesson 1 Water world Imagine that the year is 2100. Scientists have determined that the rapidly warming climate of the earth will cause the ice sheets of Antarctica to break apart and melt at
Your web browser (Safari 7) is out of date. For more security, comfort and the best experience on this site: Update your browser Ignore
 is out of date. For more security, comfort and the best experience on this site: Update your browser Ignore") Your web browser (Safari 7) is out of date. For more security, comfort and the best experience on this site: Update your browser Ignore Activitydevelop EXPLO RING PL ACE IN THE CHES APEAKE BAY WATERSHED
Your web browser (Safari 7) is out of date. For more security, comfort and the best experience on this site: Update your browser Ignore Activitydevelop EXPLO RING PL ACE IN THE CHES APEAKE BAY WATERSHED
Uta Bilow, Carsten Bittrich, Constanze Hasterok, Konrad Jende, Michael Kobel, Christian Rudolph, Felix Socher, Julia Woithe
 ATLAS W path Instructions for tutors Version from 2 February 2018 Uta Bilow, Carsten Bittrich, Constanze Hasterok, Konrad Jende, Michael Kobel, Christian Rudolph, Felix Socher, Julia Woithe Technische
Sharing GIS to Empower the End User David Wray, Roanoke County, Virginia
 Sharing GIS to Empower the End User David Wray, Roanoke County, Virginia Sharing GIS to Empower the End User Roanoke County, Virginia Roanoke County, Virginia Population: 92,901 Area: 251 Square Miles
Introduction After reviewing the classification of continental margins (not plate margins) in your textbook, answer the following questions:
 in your textbook, answer the following questions:") Investigating the continental margins of North America using GeoMapApp. This exercise is designed to familiarize you with the features of continental margins. Through the analysis of color-coded bathymetric
Investigating the continental margins of North America using GeoMapApp. This exercise is designed to familiarize you with the features of continental margins. Through the analysis of color-coded bathymetric
INDOT Office of Traffic Safety
 Intro to GIS Spatial Analysis INDOT Office of Traffic Safety Intro to GIS Spatial Analysis INDOT Office of Traffic Safety Kevin Knoke Section 130 Program Manager Highway Engineer II Registered Professional
Notes and Summary pages:
 Topographic Mapping 8.9C Interpret topographical maps and satellite views to identify land and erosional features and predict how these shapes may be reshaped by weathering ATL Skills: Communication taking
Google Maps and Beyond
 Google Maps and Beyond Aaron Paul First American Title apaul@firstam.com 2015 APRA Symposium Association of Professional Reserve Analysts May 2 nd, 2015 Google Maps and Beyond - Overview Business case
Lesson Plan 3 Google Earth Tutorial on Land Use for Middle and High School
 An Introduction to Land Use and Land Cover This lesson plan builds on the lesson plan on Understanding Land Use and Land Cover Using Google Earth. Please refer to it in terms of definitions on land use
Introduction to the College of DuPage NEXLAB Website
 Introduction to the College of DuPage NEXLAB Website The purpose of this lab is to familiarize yourself with our website so that you will have an easier time following along in class and will be able to
Application #: TEXT
 TOWN OF FORT MYERS BEACH 2008 PROPOSED COMPREHENSIVE PLAN AMENDMENTS Application #: 2008-13-TEXT Description: Modify the Coastal Management and Future Land Use Elements to reflect the state s new definition
Astronomy 101 Lab: Stellarium Tutorial
 Name: Astronomy 101 Lab: Stellarium Tutorial Please install the Stellarium software on your computer using the instructions in the procedure. If you own a laptop, please bring it to class. You will submit
SLR Calculator: Sea Level Rise (SLR) Inundation Surface Calculator Add-in for ArcGIS Desktop & 10.4
 Inundation Surface Calculator Add-in for ArcGIS Desktop & 10.4") 1 SLR Calculator: Sea Level Rise (SLR) Inundation Surface Calculator Add-in for ArcGIS Desktop 10.3.1 & 10.4 Florida Sea Level Scenario Sketch Planning Tool Version 1.6, July 2016 University of Florida
1 SLR Calculator: Sea Level Rise (SLR) Inundation Surface Calculator Add-in for ArcGIS Desktop 10.3.1 & 10.4 Florida Sea Level Scenario Sketch Planning Tool Version 1.6, July 2016 University of Florida
February 7, Jay Krafthefer, L.S.
 February 7, 2013 Jay Krafthefer, L.S. Introduction Background Web applications References Maps released on the Internet self-service not filed for record referenced by Commissioner s orders (Minn. Statute
OCN 201 LAB FALL 2003 POLYNESIAN AND WESTERN NAVIGATION
 Name: OCN 201 LAB FALL 2003 POLYNESIAN AND WESTERN NAVIGATION INTRODUCTION People have been sailing the seas for thousands of years, during most of which time they relied on the sun and the stars to navigate
Preliminary Vulnerability Assessment of Coastal Flooding Threats - Taylor County, Florida
 Preliminary Vulnerability Assessment of Coastal Flooding Threats - Taylor County, Florida North Central Florida Regional Planning Council Northeast Florida Regional Council April 28, 2016 BACKGROUND This
Advisory #35 Briefing 630 PM EDT Thursday October 06, 2016
 Advisory #35 Briefing 630 PM EDT Thursday October 06, 2016 Disclaimer: The information contained within this briefing is time-sensitive, do not use beyond 6 hours after the issuance Next Webinar Update:
Many Ways to Name a Place
 Your web browser (Safari 7) is out of date. For more security, comfort and Activityapply the best experience on this site: Update your browser Ignore Many Ways to Name a Place What are the names for the
Department of Natural Resources Geological Survey. Exploring the Geoscience Atlas
 Department of Natural Resources Geological Survey Exploring the Geoscience Atlas Updated November, 2015 Hyperlinked Contents Background: Browser Setup Browser Setup allow pop-ups Geoscience Online Geoscience
Pegaso map viewer workshop
 PEGASO / 05 Deliverable Plan 2010-12-23 Pegaso Project People for Ecosystem based Governance in Assessing Sustainable development of Ocean and coast Funded by the European Union under FP7 ENV.2009.2.2.1.4
Scottish Atlas of Variation
 Scottish Atlas of Variation User Guide March 2019 Contents Introduction... 3 Accessing the Atlas of Variation... 3 Dashboard... 4 Introduction... 4 Drop-down menus... 5 Explore icon... 5 Information icons...
The CSC Interface to Sky in Google Earth
 The CSC Interface to Sky in Google Earth CSC Threads The CSC Interface to Sky in Google Earth 1 Table of Contents The CSC Interface to Sky in Google Earth - CSC Introduction How to access CSC data with
Basic Training Battlemind to Home Symposium. Sept
 Basic Training Battlemind to Home Symposium Sept 2017 1 What is Measuring Communities? A social indicators project which allows users to obtain military-specific information about communities strengths