Geostrophic Current Analysis through the CenCal Box
|
|
|
- Adrian Strickland
- 5 years ago
- Views:
Transcription
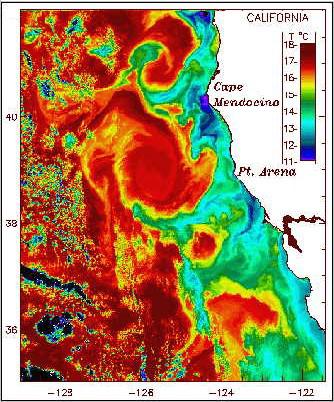
1 Geostrophic Current Analysis through the CenCal Box LT Sean P. Yemm OC357 Winter Quarter, 23 I. Introduction A. California Current System The California Current System is composed of numerous jets, filaments, eddies and three noteworthy currents. The California Current is the Eastern Boundary of the North Pacific Gyre. It is slow and broad compared to the Kuroshio Current on the Western Boundary of the Pacific Ocean. The California Current stretches from Washington, where it receives waters from the North Pacific Current, South, to the Baja Peninsula, where it turns to form the North Equatorial Current. The waters received from higher latitudes make the California Current cool and relatively fresh. Near the coast, however, the waters are more warm and saline due to the California Undercurrent. The California Undercurrent runs below and counter to the California Current, along the West Coast. Northwesterly summer winds force upwelling, which brings cooler, saltier waters directly adjacent to the Coast from greater depths. Southeasterly winter winds force downwelling, causing the California Undercurrent to rise to the surface and create the Davis Current, a poleward flowing, seasonal, surface current. Figure 1. is an infrared image depicting the California Current System's Sea Surface Temperature (SST). B. Purpose
2 The purpose of this project is to qualitatively and quantitatively analyze geostrophic current velocities through the box bordered by the Central California Coast, and California Cooperative Oceanic Fisheries Investigations (CalCOFI) Lines 67, 7, and 77. It is to that end that seawater characteristics on the perimeter of the box will be examined, calculated geostrophic current velocities will be compared with measured ADCP velocities. Line by line geostrophic current velocities will be correlated to corresponding seawater characteristics and geostrophic volume transport will be considered. II. Data Collection A. Research Cruise The Research Vessel Point Sur departed Moss Landing the morning of January 27, 23 to collect a variety of meteorologic and oceanographic data within the Central California Coastal box (CenCal box). During the period from January 27 until February 3 (Leg 1), The R/V Point Sur moored two ADCPs, "N" and "S" and visited Stations 1 along CalCOFI Line 67, Stations 12 along CalCOFI Line 7 and Stations 22-3 along CalCOFI Line 77. With the exception of one deep cast, CTD data was collected at each station to a pressure of 1dbar or max depth. This report will only concern itself with data collected from CTD and ADCP and only to a pressure level of 1dbar or max depth. Figure 2. depicts the locations of stations visited over the course of Leg 1 and includes a comprehensive list of data collected on station and enroute. B. Equipment
3 Sea-Bird Electronics 911plus CTD collected Continuous temperature, conductivity, and pressure data. Two Acoustic Doppler Current Profilers (ADCP) were used to measure current speeds along and across CalCOFI Lines 67, 7, and 77. III. Data Manipulation A. Equations 1. Geostrophic Velocity Geostrophic velocities between adjacent stations were calculated using the temperature, salinity and pressure data collected at each CTD cast. Geostrophic flow is characterized by the balance between Coriolis Force and Pressure Gradient Force: fv=-α p where f is the Coriolis Parameter (2 x Earth's speed of rotation (Ω) x the sine of latitude(sinϕ)), v is parcel velocity, α is specific volume and p is pressure. Temperature and Salinity measurements were converted to specific volume using the Equation of State. Further algebraic manipulation and integration of the Pressure Gradient Force with respect to pressure yields the practical forms of the Geostrophic Equation: V g =(V 1 -V 2 )= (δ B x p)- (δ A x p) fl or V g =(V 1 -V 2 )= Φ B - Φ A fl where V g is the geostrophic velocity between stations, V 1 is the velocity at depth, V 2 is the reference velocity at 1m, δ is the specific volume anomaly, L is the horizontal difference between stations and Φ is the geopotential anomaly. 2. Volume Transport
4 Volume transport between stations was calculated by taking the double integral of velocity between stations and 2dbar pressure levels: V g dxdz or V g dxdz B. Data Processing Geostrophic current velocities between stations at 2dbar intervals were calculated using CTD data, which had already been processed to include the geopotential anomaly and geographic coordinates station. This data was loaded into a MATLAB program which, in addition to the current velocities already mentioned, calculated the distance between adjacent stations and the cumulative distance from Moss Landing to Station 3. Depth and geopotential anomaly data was then entered into Microsoft Excel with the calculated distances between adjacent stations to recalculate geostrophic current velocities between stations as a means of checking previous calculations. Differences between MATLAB and Excel calculations were negligible and likely due to human error. MATLAB calculated geostrophic current velocities between stations were entered into Excel and used to calculate geostrophic volume transport through the CenCal box. C. Plotting Cumulative distances, measurement depths, and their associated velocities calculated by MATLAB were loaded into Surfer 8 for plotting. MATLAB was also used create plots of Temperature vs. Salinity. IV. Analysis A. Sea Water Characteristics
5 1. Temperature Temperature, particularly at relatively shallow depths, is one of the most important seawater characteristics. This is due, in part, to the relative ease with which it can be measured, but, more important, because of its use as a parameter in determining other seawater characteristics and its effect on dynamic processes. Figure 3 represents the 1m temperature profile in o C from Moss Landing, around the CalCOFI Lines, to Port St. Louis. Significant coastal upwelling can be discerned on either side of the plot from the Surface to 2m. Warm surface waters can be attributed to eddies or, possibly near the shore, the Davis current. Another feature to note is the deep upwelling situated roughly at the corners of the box, Stations 1 and Salinity Salinity is another important parameter in the determination of circulation. Figure 4 represents the 1m salinity profile from Moss Landing, around the CalCOFI Lines, to Port St. Louis. There is clearly upwelling of salty, deep waters on the coast from 2m to the surface, corresponding to the upwelling discerned on the temperature plot. Unlike temperature, however, there seems to be a salinity depression in the vicinity of stations 1 and 22 and salty upwelling along the CalCOFI Lines. 3. Temperature and Salinity Line by Line temperature data plotted against salinity (Figure 5, next page) further highlights the differences in measurements taken at stations closer and farther from shore. Most notable are the differences along Line 67, where deep measurements taken and Stations 9 and 1 are conspicuously colder and fresher than measurements taken at the 8 stations closer to shore. This separation seems to persist throughout the
6 CTD cast, into shallower waters. Stations along line 7 are fairly uniform in distance from the shore. Interestingly, there is a relatively wide spread near the surface between Station 19 and, almost adjacent, Station 22. Line 77 is homogeneous compared to the previously mentioned Lines. 4. Density In terms of geostrophic flow, density, especially its horizontal gradient, is the characteristic of greatest interest. It is with this horizontal density gradient that the direction of geostrophic flow will be checked. Figure 6 represents the 1m density anomaly profile in kg/m 3 from Moss Landing, around the CalCOFI Lines, to Port St. Louis. Much of the density anomaly profile mirrors the previously examined temperature and salinity profiles. Coastal density values, compared along the same pressure level, go from being lighter at 25dbar to heavier at the surface. The lightest water is at the surface, between stations 9 and 13, corresponding to the warm, fresh water identified earlier. B. Comparison of Calculated Geostrophic Current Velocity With ADCP Measured Currents 1. Similarities Some striking similarities exist between the calculated geostrophic flow out of the box and the flow measured by the ADCP. Figure 7 is a plot of ADCP Measured current out of the box from -3m. Figure 8 is a plot of calculated geostrophic current velocity. For both figures, blue shaded, negative contours represent flow into the box while green shaded, positive contours are outflow in cm/s. White areas are areas of no flow. Significant inflow side by side with significant outflow was both calculated and measured
7 from roughly 5 to 15km from Moss Landing. Surface inflow at 175km and 54km from Moss Landing, and outflow at 275km and 4km from Moss Landing are also attributes common to both plots. 2. Differences Fewer but no less significant differences also exist between the calculated geostrophic flow out of the box and the flow measured by the ADCP. The most striking difference is the ADCP inflow at 475km from -3m. There is some outflow at roughly the same distance from Moss Landing on the geostrophic current velocity plot, but it's not nearly as strong or deep. The geostrophic plot depicts inflow at 325km distance at 1cm/s. The ADCP plot depicts a strong surface inflow at 375km from Moss Landing. Other differences exist, but are on the order of 5cm/s not worthy of note. C. Seawater Characteristic Correlation 1. CalCOFI Line 67 Figure 9 shows plots of temperature, salinity, density anomaly, and geostrophic flow out of Line 67 from m. The deep upwelling of cold water at the corners and depression of fresh water at the same corners noted earlier tend to level the deep isopycnals, creating slower currents below 4m. Taking a closer look at the upper 3meters (Figure 1), however, strong gradients in temperature, salinity, and density and their effect on current are easily identifiable. Depressions of warm, fresh, "light" water 5km and km from Moss Landing produce strong, alternating in and out flow. Though not the strongest current, poleward outflow, flanking the coast, is consistent with the negative horizontal density gradient and the Davis Current. 2. CalCOFI Line 7
8 Figure 11 shows plots of temperature, salinity, density anomaly, and geostrophic flow out of Line 7 from m. As in Line 67, isotherms, turning up at the edges, juxtaposed with salinity isopleths, turning down, create straight, level isopycnals in deeper waters. In the upper 3meters (Figure 12), temperature, salinity and density contours fluctuate frequently under 5m. Each contour wave has a steep slope, however, the amplitude is small, so there isn't a strong enough gradient to produce a substantial current. Above 5 m, there is a more sizeable gradient at approximately 325km from Moss Landing, which corresponds to strong inflow at the same distance. The strongest flow across Line 7, though, is at 25km distance, where the gradient appears to be weakest. Interestingly, the ADCP plot (Figure 7) also demonstrates fairly strong outflow at 25km. 3. CalCOFI Line 77 Figure 13 shows plots of temperature, salinity, density anomaly, and geostrophic flow out of Line 77 from m. As in the previous two Line analyses, opposing temperature and salinity isopleths level out isopycnals in waters deeper than 4m. Geostrophic currents are understandably weak in this area. In the upper 3meters (Figure 14), outflow at 4km distance from Moss Landing corresponds to the negative density gradient between Stations 2 and 22 on Line 7 (Figure 12). At 5km distance surface outflow does not relate to any negatively oriented isopycnals. Near Port San Louis, poleward inflow is consistent with the density gradient, possibly the Davis Current. D. Volume Transport
9 Volume transport calculations, summarized in Tables 1, 2, and 3, generated a net transport of 5.44Sv out of the box. Line 67 Volume Tranport Station # Sum V m/s dz, m dx, m Vol. Out m 3 /s Vol. Out (Sv) Total Line 67 Volume Out (Sv) = Table 1 Line 7 Volume Tranport Station # Sum V m/s dz, m dx, m Vol. Out m 3 /s Vol. Out (Sv) Total Line 7 Volume Out (Sv) = Table 2 Line 77 Volume Tranport Station # Sum V m/s x dz, m x dx, m Vol. Out m 3 /s Vol. Out (Sv) Total Line 77 Volume Out (Sv) =
10 V. Conclusion Total Volume Transport Out of the Box (Sv) = Table 3 Examination of seawater characteristics along the perimeter of the CenCal box and the impact those characteristics have on circulation, demonstrate the complexity of the California Current System. Despite this complexity, calculated geostrophic current velocities proved comparable to measured ADCP velocities. There was some disagreement between the two, but these differences were of a much smaller magnitude to the points of harmony. Line by line, geostrophic current velocities coupled nicely with seawater characteristics at the same general location. Like the ADCP comparison, there were occasions of conflict, however, again, like the ADCP comparison, moments of discord were minor compared with the overall harmony. Geostrophic volume transport, on the other hand was considerably higher than expected. This is probably due to high winds creating Ekman convergence and/or inward flow from coastal upwelling below the 1m maximum shared depth. VI. Acknowledgement Thanks to Doctor Collins and Tarry Rago for the 11th hour assist.
11 VI. References Collins, C.A., geovel_sw.m Neander, D.O., 21, The California Current System Comparison of Geostrophic Currents, ADCP Currents and Satellite Altimetry, OC357, Summer 21 Ong, A.C., 22, Geostrophic, Ekman, and ADCP Volume Transports through CalCOFI Lines 67, 77, and Line 77, OC357, Summer 22 Pickard, G.L., and W.J. Emery, Descriptive Physical Oceanography; An Introduction, 5 th Ed., pp 25256, Butterworth/Heinemann. Pond, S., and G.L. Pickard, Introductory Dynamical Oceanography, 2 nd Ed., pp 68-77, Butterworth/Heinemann. Rago, T., assemble_arcraster.m
12 Figure 1.
13 OC357, 27 Jan.-3 Feb. 23 Leg I North Latitude ,X84 11,X85 S4 12,X ,X82 8,X81 7,X8 13,X ,X79 5,X78,S3 14,X88 15,X89 4,X77 Pegasus 3,X76 16,X9 S5 17,X91 21,X95 18,X ,X93 2,X94 S6 22,X96 2,X75 23,X ,X N,S Wave,S1 25,X99 26,X1 27 R98 S , 1, 2, 3, and 4m isobaths shown ,KS8,BKS9 3 Drifter 12.5 West Longitude Figure 2 = CTD + Nutrients = CTD = XBT = Rawinsonde = Kite Sonde = Kite Sonde (from small boat) = Mooring = Brightwater Drifter = Pegasus = Rafos
14 Temperature around Box, C C.I.=1C Sequential Figure 3 Salinity around Box, ppm C.I.=.1 Pressure, Mpa Figure 4
15 Figure 5
16 Density Anomaly around Box, kg/m^3 C.I.=.2 kg/m^ Figure 6
17 ADCP Flow out of Box, cm/s -3m -5 Depth, m Distance from Moss Landing, km Figure 7 Geostrophic Flow out of Box, cm/s -3m -5 Depth, dam Distance from Moss Landing, km Figure 8
18 Line 67, 1m Temperature around Box, C C.I.=1C Salinity around Box, ppm C.I.=.1ppm Pressure, Mpa Density Anomaly around Box, kg/m^3 C.I.=.2 kg/m^3 Geostrophic Flow out of the Box, cm/s C.I.= 5cm/s Depth, dam Figure Distance from Moss Landing, km
19 Line 67, Upper 3m Temperature around Box, C C.I.=1C Salinity around Box, ppm C.I.=.1ppm Pressure, Mpa Sequential Density Anomaly around Box, kg/m^3 C.I.=.2 kg/m^3 Geostrophic Flow out of the Box, cm/s C.I.= 5cm/s Depth, dam Figure Distance from Moss Landing, km
20 Line 7, 1m Temperature around Box, C C.I.=1C Salinity around Box, ppm C.I.=.1ppm Pressure, Mpa Density Anomaly around Box, kg/m^3 C.I.=.2 kg/m^3 Geostrophic Flow out of the Box, cm/s C.I.= 5cm/s Depth, dam Figure Distance from Moss Landing, km
21 Line 7, Upper 3m Temperature around Box, C C.I.=1C Salinity around Box, ppm C.I.=.1ppm Pressure, Mpa Sequential Density Anomaly around Box, kg/m^3 C.I.=.2 kg/m^3 Geostrophic Flow out of the Box, cm/s C.I.= 5cm/s Depth, dam Figure Distance from Moss Landing, km
22 Line 77, 1m Temperature around Box, C C.I.=1C Salinity around Box, ppm C.I.=.1ppm Pressure, Mpa Density Anomaly around Box, kg/m^3 C.I.=.2 kg/m^3 Geostrophic Flow out of the Box, cm/s C.I.= 5cm/s Depth, dam Figure Distance from Moss Landing, km
23 Line 77, Upper 3m Temperature around Box, C C.I.=1C Salinity around Box, ppm C.I.=.1ppm Pressure, Mpa Sequential Density Anomaly around Box, kg/m^3 C.I.=.2 kg/m^3 Geostrophic Flow out of the Box, cm/s C.I.= 5cm/s Depth, dam Figure Distance from Moss Landing, km
The California current is the eastern boundary current that lies to the west of
 I. INTORDUCTION A. California Current System The California current is the eastern boundary current that lies to the west of North America. The California current flows from north, Washington, to south,
The California Current System: Comparison of Geostrophic Currents, ADCP Currents and Satellite Altimetry
 The California Current System: Comparison of Geostrophic Currents, ADCP Currents and Satellite Altimetry LCDR David O. Neander, NOAA OC3570 Summer Cruise, August 2-5, 2001 I. INTRODUCTION The large-scale
CHAPTER 7 Ocean Circulation Pearson Education, Inc.
 CHAPTER 7 Ocean Circulation 2011 Pearson Education, Inc. Types of Ocean Currents Surface currents Deep currents 2011 Pearson Education, Inc. Measuring Surface Currents Direct methods Floating device tracked
isopycnal outcrop w < 0 (downwelling), v < 0 L.I. V. P.
, v < 0 L.I. V. P.") Ocean 423 Vertical circulation 1 When we are thinking about how the density, temperature and salinity structure is set in the ocean, there are different processes at work depending on where in the water
Ocean 423 Vertical circulation 1 When we are thinking about how the density, temperature and salinity structure is set in the ocean, there are different processes at work depending on where in the water
General Comment on Lab Reports: v. good + corresponds to a lab report that: has structure (Intro., Method, Results, Discussion, an Abstract would be
 General Comment on Lab Reports: v. good + corresponds to a lab report that: has structure (Intro., Method, Results, Discussion, an Abstract would be a bonus) is well written (take your time to edit) shows
Ocean surface circulation
 Ocean surface circulation Recall from Last Time The three drivers of atmospheric circulation we discussed: Differential heating Pressure gradients Earth s rotation (Coriolis) Last two show up as direct
Surface Circulation. Key Ideas
 Surface Circulation The westerlies and the trade winds are two of the winds that drive the ocean s surface currents. 1 Key Ideas Ocean water circulates in currents. Surface currents are caused mainly by
SIO 210 Final examination Wednesday, December 12, :30-2:30 Eckart 227 Name:
 SIO 210 Final examination Wednesday, December 12, 2018 11:30-2:30 Eckart 227 Name: Please put your initials or name on each page, especially if you pull pages apart. Turn off all phones, ipods, etc. and
Basic Ocean Current Systems. Basic Ocean Structures. The State of Oceans. Lecture 6: The Ocean General Circulation and Climate. Temperature.
 Lecture 6: The Ocean General Circulation and Climate Basic Ocean Current Systems Upper Ocean surface circulation Basic Structures Mixed Layer Wind-Driven Circulation Theories Thermohaline Circulation Ocean
Red Sea - Dead Sea Water Conveyance Study Program Additional Studies
 Red Sea - Dead Sea Water Conveyance Study Program Additional Studies Red Sea Study Final Report Annex 1 Field and laboratory activities carried out during the study and their results July 213 TABLE OF
Ocean Dynamics. The Great Wave off Kanagawa Hokusai
 Ocean Dynamics The Great Wave off Kanagawa Hokusai LO: integrate relevant oceanographic processes with factors influencing survival and growth of fish larvae Physics Determining Ocean Dynamics 1. Conservation
A characterization of the Equatorial Undercurrent between W and W
 K. Odle 1 A characterization of the Equatorial Undercurrent between 92 00 W and 91 20 W Kevin Lee Odle School of Oceanography 04 March 2006 University of Washington Seattle, WA 98105 Running Title: The
Ocean Mixing and Climate Change
 Ocean Mixing and Climate Change Factors inducing seawater mixing Different densities Wind stirring Internal waves breaking Tidal Bottom topography Biogenic Mixing (??) In general, any motion favoring turbulent
Winds and Global Circulation
 Winds and Global Circulation Atmospheric Pressure Winds Global Wind and Pressure Patterns Oceans and Ocean Currents El Nino How is Energy Transported to its escape zones? Both atmospheric and ocean transport
Module Contact: Dr Xiaoming Zhai, ENV Copyright of the University of East Anglia Version 2
 UNIVERSITY OF EAST ANGLIA School of Environmental Sciences Main Series UG Examination 2017-2018 OCEAN CIRCULATION ENV-5016A Time allowed: 2 hours Answer THREE questions Write each answer in a SEPARATE
Lecture 4:the observed mean circulation. Atmosphere, Ocean, Climate Dynamics EESS 146B/246B
 Lecture 4:the observed mean circulation Atmosphere, Ocean, Climate Dynamics EESS 146B/246B The observed mean circulation Lateral structure of the surface circulation Vertical structure of the circulation
ESCI 485 Air/sea Interaction Lesson 5 Oceanic Boundary Layer
 ESCI 485 Air/sea Interaction Lesson 5 Oceanic Boundar Laer References: Descriptive Phsical Oceanograph, Pickard and Emer Introductor Dnamical Oceanograph, Pond and Pickard Principles of Ocean Phsics, Apel
Lecture 25: Ocean circulation: inferences from geostrophic and thermal wind balance
 Lecture 25: Ocean circulation: inferences from geostrophic and thermal wind balance November 5, 2003 Today we are going to study vertical sections through the ocean and discuss what we can learn about
Homework 5: Background Ocean Water Properties & Stratification
 14 August 2008 MAR 110 HW5: Ocean Properties 1 Homework 5: Background Ocean Water Properties & Stratification The ocean is a heterogeneous mixture of water types - each with its own temperature, salinity,
Currents & Gyres Notes
 Currents & Gyres Notes Current A river of water flowing in the ocean. 2 Types of Currents Surface Currents wind-driven currents that occur in the top 100m or less Deep Currents density-driven currents
EXPORT PATHWAYS FROM THE SUBPOLAR NORTH ATLANTIC OCEAN
 CRUISE REPORT EXPORT PATHWAYS FROM THE SUBPOLAR NORTH ATLANTIC OCEAN R/V Oceanus Cruise OC 395-2 July 9-23, 2003 1. Introduction and Objectives The importance of the pathways of the ocean s meridional
( ) = 1005 J kg 1 K 1 ;
 = 1005 J kg 1 K 1 ;") Problem Set 3 1. A parcel of water is added to the ocean surface that is denser (heavier) than any of the waters in the ocean. Suppose the parcel sinks to the ocean bottom; estimate the change in temperature
Problem Set 3 1. A parcel of water is added to the ocean surface that is denser (heavier) than any of the waters in the ocean. Suppose the parcel sinks to the ocean bottom; estimate the change in temperature
Upper Ocean Circulation
 Upper Ocean Circulation C. Chen General Physical Oceanography MAR 555 School for Marine Sciences and Technology Umass-Dartmouth 1 MAR555 Lecture 4: The Upper Oceanic Circulation The Oceanic Circulation
Ocean Boundary Currents Guiding Question: How do western boundary currents influence climate and ocean productivity?
 Name: Date: TEACHER VERSION: Suggested Student Responses Included Ocean Boundary Currents Guiding Question: How do western boundary currents influence climate and ocean productivity? Introduction The circulation
Atmospheric Sciences 321. Science of Climate. Lecture 20: More Ocean: Chapter 7
 Atmospheric Sciences 321 Science of Climate Lecture 20: More Ocean: Chapter 7 Community Business Quiz discussion Next Topic will be Chapter 8, Natural Climate variability in the instrumental record. Homework
SIO 210 Introduction to Physical Oceanography Mid-term examination Wednesday, November 2, :00 2:50 PM
 SIO 210 Introduction to Physical Oceanography Mid-term examination Wednesday, November 2, 2005 2:00 2:50 PM This is a closed book exam. Calculators are allowed. (101 total points.) MULTIPLE CHOICE (3 points
SIO 210 Problem Set 2 October 17, 2011 Due Oct. 24, 2011
 SIO 210 Problem Set 2 October 17, 2011 Due Oct. 24, 2011 1. The Pacific Ocean is approximately 10,000 km wide. Its upper layer (wind-driven gyre*) is approximately 1,000 m deep. Consider a west-to-east
Modeling the Columbia River Plume on the Oregon Shelf during Summer Upwelling. 2 Model
 Modeling the Columbia River Plume on the Oregon Shelf during Summer Upwelling D. P. Fulton August 15, 2007 Abstract The effects of the Columbia River plume on circulation on the Oregon shelf are analyzed
Applications of an ensemble Kalman Filter to regional ocean modeling associated with the western boundary currents variations
 Applications of an ensemble Kalman Filter to regional ocean modeling associated with the western boundary currents variations Miyazawa, Yasumasa (JAMSTEC) Collaboration with Princeton University AICS Data
Observation of Oceanic Structure around Tosa-Bae Southeast of Shikoku
 Journal of Oceanography Vol. 50, pp. 543 to 558. 1994 Observation of Oceanic Structure around Tosa-Bae Southeast of Shikoku YOSHIHIKO SEKINE, HARUKI OHWAKI and MOTOYA NAKAGAWA Institute of Oceanography,
Size matters: another reason why the Atlantic is saltier than the Pacific C.S. Jones and Paola Cessi
 Size matters: another reason why the Atlantic is saltier than the Pacific C.S. Jones and Paola Cessi Scripps Institution of Oceanography University of California, San Diego Proposed reasons for Atlantic
Coastal Oceanography. Coastal Oceanography. Coastal Waters
 Coastal Oceanography Coastal Oceanography 95% of ocean life is in coastal waters (320 km from shore) Estuaries and wetlands are among most productive ecosystems on Earth Major shipping routes, oil and
SIO 210 Final Exam Dec Name:
 SIO 210 Final Exam Dec 8 2006 Name: Turn off all phones, pagers, etc... You may use a calculator. This exam is 9 pages with 19 questions. Please mark initials or name on each page. Check which you prefer
SIO 210 Final Exam December 10, :30 2:30 NTV 330 No books, no notes. Calculators can be used.
 SIO 210 Final Exam December 10, 2003 11:30 2:30 NTV 330 No books, no notes. Calculators can be used. There are three sections to the exam: multiple choice, short answer, and long problems. Points are given
Lecture 14. Equations of Motion Currents With Friction Sverdrup, Stommel, and Munk Solutions Remember that Ekman's solution for wind-induced transport
 Lecture 14. Equations of Motion Currents With Friction Sverdrup, Stommel, and Munk Solutions Remember that Ekman's solution for wind-induced transport is which can also be written as (14.1) i.e., #Q x,y
The fieldwork during the Polarstern cruise ANT XVI/2 as a contribution to the study of bottom water formation and sea ice transport in the Weddell Sea
 The fieldwork during the Polarstern cruise ANT XVI/2 as a contribution to the study of bottom water formation and sea ice transport in the Weddell Sea Fahrbach, E 1, S. Harms 2, H. Hellmer 1, A. Jenkins
Surface Circulation Ocean current Surface Currents:
 All Write Round Robin G1. What makes up the ocean water? G2. What is the source of the salt found in ocean water? G3. How does the water temperature affect the density of ocean water? G4. How does the
A role of eddies in formation and transport of North Pacific Subtropical Mode Water
 1 A role of eddies in formation and transport of North Pacific Subtropical Mode Water Hiroki Uehara 1, Toshio Suga 1,2, Kimio Hanawa 1 and Nobuyuki Shikama 2 1 Department of Geophysics, Graduate School
Weather & Ocean Currents
 Weather & Ocean Currents Earth is heated unevenly Causes: Earth is round Earth is tilted on an axis Earth s orbit is eliptical Effects: Convection = vertical circular currents caused by temperature differences
North Pacific Climate Overview N. Bond (UW/JISAO), J. Overland (NOAA/PMEL) Contact: Last updated: September 2008
, J. Overland (NOAA/PMEL) Contact: Last updated: September 2008") North Pacific Climate Overview N. Bond (UW/JISAO), J. Overland (NOAA/PMEL) Contact: Nicholas.Bond@noaa.gov Last updated: September 2008 Summary. The North Pacific atmosphere-ocean system from fall 2007
North Pacific Climate Overview N. Bond (UW/JISAO), J. Overland (NOAA/PMEL) Contact: Nicholas.Bond@noaa.gov Last updated: September 2008 Summary. The North Pacific atmosphere-ocean system from fall 2007
Earth s Environmental System: Climate V2100. Midterm Exam. Wednesday March 12, 2003
 Earth s Environmental System: Climate V2100 Midterm Exam Wednesday March 12, 2003 Please put your name at the top of each page If you sketch something, make it big and clear and label your axes Explain
What makes the Arctic hot?
 1/3 total USA UN Environ Prog What makes the Arctic hot? Local communities subsistence Arctic Shipping Routes? Decreasing Ice cover Sept 2007 -ice extent (Pink=1979-2000 mean min) Source: NSIDC Oil/Gas
1. Oceans. Example 2. oxygen.
 1. Oceans a) Basic facts: There are five oceans on earth, making up about 72% of the planet s surface and holding 97% of the hydrosphere. Oceans supply the planet with most of its oxygen, play a vital
Actual bathymetry (with vertical exaggeration) Geometry of the ocean 1/17/2018. Patterns and observations? Patterns and observations?
 Geometry of the ocean 1/17/2018. Patterns and observations? Patterns and observations?") Patterns and observations? Patterns and observations? Observations? Patterns? Observations? Patterns? Geometry of the ocean Actual bathymetry (with vertical exaggeration) Continental Continental Basin
Patterns and observations? Patterns and observations? Observations? Patterns? Observations? Patterns? Geometry of the ocean Actual bathymetry (with vertical exaggeration) Continental Continental Basin
Arctic oceanography; the path of North Atlantic Deep Water
 Chapter 7 Arctic oceanography; the path of North Atlantic Deep Water The importance of the Southern Ocean for the formation of the water masses of the world ocean poses the question whether similar conditions
Results of oceanographic analyses conducted under JARPA and possible evidence of environmental changes.
 SC/D06/J30 Results of oceanographic analyses conducted under JARPA and possible evidence of environmental changes. Tomowo Watanabe*, Takashi Yabuki**, Toshio Suga**, Kimio Hanawa**, Koji Matsuoka*** and
Baltic Sea Research Institute
 Baltic Sea Research Institute Warnemuende (IOW) Cruise Report No. 44/96/ 04 R/V "A.v.Humboldt" MESODYN Cruise 01 to 12 March 1996 Stolpe Furrow / Baltic Sea This report is based on preliminary data and
Chapter 6. Antarctic oceanography
 Chapter 6 Antarctic oceanography The region of the world ocean bordering on Antarctica is unique in many respects. First of all, it is the only region where the flow of water can continue all around the
The Planetary Circulation System
 12 The Planetary Circulation System Learning Goals After studying this chapter, students should be able to: 1. describe and account for the global patterns of pressure, wind patterns and ocean currents
Water mass formation, subduction, and the oceanic heat budget
 Chapter 5 Water mass formation, subduction, and the oceanic heat budget In the first four chapters we developed the concept of Ekman pumping, Rossby wave propagation, and the Sverdrup circulation as the
C
 C 0.8 0.4 0.2 0.0-0.2-0.6 Fig. 1. SST-wind relation in the North Pacific and Atlantic Oceans. Left panel: COADS SST (color shade), surface wind vectors, and SLP regressed upon the Pacific Decadal Oscillation
Wind: Global Systems Chapter 10
 Wind: Global Systems Chapter 10 General Circulation of the Atmosphere General circulation of the atmosphere describes average wind patterns and is useful for understanding climate Over the earth, incoming
Name Period Part I: INVESTIGATING OCEAN CURRENTS: PLOTTING BUOY DATA
 Name Period Part I: INVESTIGATING OCEAN CURRENTS: PLOTTING BUOY DATA INTRODUCTION: Ocean currents are like huge rivers in the sea. They carry drifting organisms, vital dissolved chemical nutrients and
IPCC AR5 WG1 - Climate Change 2013: The Physical Science Basis. Nandini Ramesh
 IPCC AR5 WG1 - Climate Change 2013: The Physical Science Basis Nandini Ramesh Seminar in Atmospheric Science 21 st February, 2014 1. Introduc,on The ocean exchanges heat, freshwater, and C with the atmosphere.
Lecture 1. Amplitude of the seasonal cycle in temperature
 Lecture 6 Lecture 1 Ocean circulation Forcing and large-scale features Amplitude of the seasonal cycle in temperature 1 Atmosphere and ocean heat transport Trenberth and Caron (2001) False-colour satellite
1. Introduction 2. Ocean circulation a) Temperature, salinity, density b) Thermohaline circulation c) Wind-driven surface currents d) Circulation and
 Temperature, salinity, density b) Thermohaline circulation c) Wind-driven surface currents d) Circulation and") 1. Introduction 2. Ocean circulation a) Temperature, salinity, density b) Thermohaline circulation c) Wind-driven surface currents d) Circulation and climate change e) Oceanic water residence times 3.
1. Introduction 2. Ocean circulation a) Temperature, salinity, density b) Thermohaline circulation c) Wind-driven surface currents d) Circulation and climate change e) Oceanic water residence times 3.
Cruise Report R.V. Oceania, AREX2004
 Powstaców Warszawy, PL - 81-71 Sopot, P.O. Box 68 November 16. 4 Cruise Report R.V. Oceania, AREX4 Ship: Cruise: R.V. Oceania Arex4 Dates: 8.6.4 19.7.4 Port Calls: Sopot (Poland) Longyearbyen (Spitsbergen)
Cruise Report R/V Oceania, AREX 2007
 Powstańców Warszawy 55, PL - 81-712 Sopot, P.O. Box 68 March 15, 2008 Cruise Report R/V Oceania, AREX 2007 Ship: R/V Oceania Cruise: AREX 2007 Dates: 19.06.2007 05.08.2007 Port Calls: Gdansk (Poland) Longyearbyen
Coastal Ocean Circulation Experiment off Senegal (COCES)
") DISTRIBUTION STATEMENT A. Approved for public release; distribution is unlimited. Coastal Ocean Circulation Experiment off Senegal (COCES) Pierre-Marie Poulain Istituto Nazionale di Oceanografia e di Geofisica
DISTRIBUTION STATEMENT A. Approved for public release; distribution is unlimited. Coastal Ocean Circulation Experiment off Senegal (COCES) Pierre-Marie Poulain Istituto Nazionale di Oceanografia e di Geofisica
Mesoscale Meteorology Assignment #3 Q-G Theory Exercise. Due 23 February 2017
 Mesoscale Meteorology Assignment #3 Q-G Theory Exercise 1. Consider the sounding given in Fig. 1 below. Due 23 February 2017 Figure 1. Skew T-ln p diagram from Tallahassee, FL (TLH). The observed temperature
Where is all the water?
 Where is all the water? The distribution of water at the Earth's surface % of total Oceans 97.25 Ice caps and glaciers 2.05 Groundwater 0.68 Lakes 0.01 Soils 0.005 Atmosphere (as vapour) 0.001 Rivers 0.0001
psio 210 Introduction to Physical Oceanography Mid-term examination November 3, 2014; 1 hour 20 minutes Answer key
 NAME: psio 210 Introduction to Physical Oceanography Mid-term examination November 3, 2014; 1 hour 20 minutes Answer key Closed book; one sheet of your own notes is allowed. A calculator is allowed. (100
Buoyancy-forced circulations in shallow marginal seas
 Journal of Marine Research, 63, 729 752, 2005 Buoyancy-forced circulations in shallow marginal seas by Michael A. Spall 1 ABSTRACT The properties of water mass transformation and the thermohaline circulation
SIO 210 Final examination Answer Key for all questions except Daisyworld. Wednesday, December 10, PM Name:
 SIO 210 Final examination Answer Key for all questions except Daisyworld. Wednesday, December 10, 2008 3-6 PM Name: This is a closed book exam. You may use a calculator. There are two parts: Talley (weighted
Skewed Occurrence Frequency of Water Temperature and Salinity in the Subarctic Regions
 Journal of Oceanography, Vol. 59, pp. 9 to 99, 3 Skewed Occurrence Frequency of Water Temperature and Salinity in the Subarctic Regions SACHIKO OGUMA *, TORU SUZUKI, SYDNEY LEVITUS and YUTAKA NAGATA Marine
Characterizing the Physical Oceanography of Coastal Waters Off Rhode Island
 Characterizing the Physical Oceanography of Coastal Waters Off Rhode Island Dan Codiga and Dave Ullman Graduate School of Oceanography University of Rhode Island RI OSAMP Stakeholder Meeting January 5,
Cruise Report. RV Oceania, AREX2011. Institute of Oceanology Polish Academy of Sciences. the Norwegian, Greenland and Barents Seas
 w Warszawy 55, 81-712 Sopot, Poland, P.O. Box 68 10 December, 2011 Cruise Report RV Oceania, AREX2011 Institution Ship Name Cruise Name Institute of Oceanology Polish Academy of Sciences RV Oceania AREX2011
Please be ready for today by:
 Please be ready for today by: 1. HW out for a stamp 2. Paper and pencil/pen for notes 3. Be ready to discuss what you know about El Nino after you view the video clip What is El Nino? El Nino Basics El
Chapter 24 Tropical Cyclones
 Chapter 24 Tropical Cyclones Tropical Weather Systems Tropical disturbance a cluster of thunderstorms about 250 to 600 km in diameter, originating in the tropics or sub-tropics Tropical depression a cluster
Seasonal variations of vertical structure in the deep waters of the Southern Caspian Sea
 278 Research in Marine Sciences Volume 3, Issue 1, 2018 Pages 278-286 Seasonal variations of vertical structure in the deep waters of the Southern Caspian Sea Somayeh Nahavandian 1,*, and Alireza Vasel
Depth Distribution of the Subtropical Gyre in the North Pacific
 Journal of Oceanography, Vol. 58, pp. 525 to 529, 2002 Short Contribution Depth Distribution of the Subtropical Gyre in the North Pacific TANGDONG QU* International Pacific Research Center, SOEST, University
Studying the Ocean Using Live Data
 Studying the Ocean Using Live Data Overview The Argo buoy project is a major oceanographic study that harnesses the power of automated unmanned buoys traveling the world s oceans (http://www.argo.ucsd.edu/).
,/college of Oceanography) Oregon State University1 Corvallis, Oregon 97331
 Oregon State University1 Corvallis, Oregon 97331") CENTRAL CALIFORNIA COASTAL CIRCULATION STUDY CTD OBSERVATIONS CRUISE 8404, OCTOBER 1984 by Dudley B. Chelton P. Michael Kosro /,/college of Oceanography) Oregon State University1 Corvallis, Oregon 97331
CENTRAL CALIFORNIA COASTAL CIRCULATION STUDY CTD OBSERVATIONS CRUISE 8404, OCTOBER 1984 by Dudley B. Chelton P. Michael Kosro /,/college of Oceanography) Oregon State University1 Corvallis, Oregon 97331
Regional Stratification and Shear of the Various Streams Feeding the Philippine Straits ESR Component
 Regional Stratification and Shear of the Various Streams Feeding the Philippine Straits ESR Component Amy Ffield Earth & Space Research, 290 Clausland Mountain Road, Upper Grandview, NY 10960-4113 phone:
Ocean and Climate I.
 Ocean and Climate I http://www.gerhardriessbeck.de/ Physical Characteristics of the Ocean Surface area: 3.61 10 14 m 2 Mean depth: 3.7 km Ocean volume: 3.2 10 17 m 3 Mean density: 1.035 10 3 kg/m 3 Ocean
Answer the following questions using letters A through H :
 SIO 210 Problem Set 3 November 10, 2014 Due Nov. 24, 2014 Answer key 1. 10 total 6 points (a) The following kinds of wave motion were mentioned in class A. light 3 x 10 9 m/sec B. sound in air (340 m/sec)
(chose the sign to ensure that it is evaporative)
") SIO 210 (2-3:20 class) Problem Set 2 ANSWER KEY October 17, 2016 Due October 31, 2016 (10 points) 1. The salinity of the inflow to the Mediterranean Sea at the Strait of Gibraltar is about 36.1. The salinity
SIO 210 (2-3:20 class) Problem Set 2 ANSWER KEY October 17, 2016 Due October 31, 2016 (10 points) 1. The salinity of the inflow to the Mediterranean Sea at the Strait of Gibraltar is about 36.1. The salinity
Midterm 2: Nov. 20 (Monday)
") Introduction to Oceanography Lecture 18, Current 2 Surface Ocean Currents. Video by Chris Henze, NASA Ames, Public Domain Midterm 2: Nov. 20 (Monday) Review Session & Video Screenings TBA Image from Sverdrup,
Introduction to Oceanography Lecture 18, Current 2 Surface Ocean Currents. Video by Chris Henze, NASA Ames, Public Domain Midterm 2: Nov. 20 (Monday) Review Session & Video Screenings TBA Image from Sverdrup,
APPENDIX B PHYSICAL BASELINE STUDY: NORTHEAST BAFFIN BAY 1
 APPENDIX B PHYSICAL BASELINE STUDY: NORTHEAST BAFFIN BAY 1 1 By David B. Fissel, Mar Martínez de Saavedra Álvarez, and Randy C. Kerr, ASL Environmental Sciences Inc. (Feb. 2012) West Greenland Seismic
CHAPTER 9 ATMOSPHERE S PLANETARY CIRCULATION MULTIPLE CHOICE QUESTIONS
 CHAPTER 9 ATMOSPHERE S PLANETARY CIRCULATION MULTIPLE CHOICE QUESTIONS 1. Viewed from above in the Northern Hemisphere, surface winds about a subtropical high blow a. clockwise and inward. b. counterclockwise.
DEPARTMENT OF GEOSCIENCES SAN FRANCISCO STATE UNIVERSITY. Metr Fall 2012 Test #1 200 pts. Part I. Surface Chart Interpretation.
 DEPARTMENT OF GEOSCIENCES SAN FRANCISCO STATE UNIVERSITY NAME Metr 356.01 Fall 2012 Test #1 200 pts Part I. Surface Chart Interpretation. Figure 1. Surface Chart for 1500Z 7 September 2007 1 1. Pressure
2/15/2012. Earth System Science II EES 717 Spring 2012
 Earth System Science II EES 717 Spring 2012 1. The Earth Interior Mantle Convection & Plate Tectonics 2. The Atmosphere - Climate Models, Climate Change and Feedback Processes 3. The Oceans Circulation;
Arnold L. Gordon Retroflections and Bifurcations Johann Lutjeharms Memorial Lecture
 The Agulhas System and its Role in Changing Ocean Circulation, Climate & Marine Ecosystems Spier Hotel, Stellenbosch, Western Cape, South Africa 8 12 October 2012 Brazil/Malvinas Agulhas Retroflection
Coastal ocean variability in the U.S. Pacific Northwest region: Seasonal patterns, winter
 1 2 Coastal ocean variability in the U.S. Pacific Northwest region: Seasonal patterns, winter circulation and the influence of the 2009-2010 El Niño 3 4 5 6 by S. M. Durski, A. L. Kurapov, J. S. Allen,
Circulation in the South China Sea in summer of 1998
 Circulation in the South China Sea in summer of 1998 LIU Yonggang, YUAN Yaochu, SU Jilan & JIANG Jingzhong Second Institute of Oceanography, State Oceanic Administration (SOA), Hangzhou 310012, China;
climate system and its subcomponents: the atmosphere, ocean, land surface, Prof. Jin-Yi Yu ESS200A A general description of the Earth
 Earth System Climate () Course Time Lectures: Tu, Th 9:30-10:20 Discussion: 3315 Croul Hall Text Book The Earth System, Kump, Kasting, and Crane, Prentice-Hall Global Physical Climatology, Hartmann; Academic
Formation Mechanisms for North Pacific Central and Eastern Subtropical Mode Waters
 868 JOURNAL OF PHYSICAL OCEANOGRAPHY VOLUME 30 Formation Mechanisms for North Pacific Central and Eastern Subtropical Mode Waters CAROL LADD AND LUANNE THOMPSON School of Oceanography, University of Washington,
Ocean Circulation- PART- I: In Class. Must be done inclass, and turned in before you leave for credit.
 Name: Section/ TA: Ocean Circulation- PART- I: In Class. Must be done inclass, and turned in before you leave for credit. Activity 1: The Sverdrup In our homes, we are used to calculating water volumes
Ocean Sciences 101 The Marine Environment OCEA 101 THE MARINE ENVIRONMENT MID-TERM EXAM
 OCEA 101 THE MARINE ENVIRONMENT MID-TERM EXAM Part I. Multiple Choice Questions. Choose the one best answer from the list, and write the letter legibly in the blank to the left of the question. 2 points
A Study on Residual Flow in the Gulf of Tongking
 Journal of Oceanography, Vol. 56, pp. 59 to 68. 2000 A Study on Residual Flow in the Gulf of Tongking DINH-VAN MANH 1 and TETSUO YANAGI 2 1 Department of Civil and Environmental Engineering, Ehime University,
True or false: The atmosphere is always in hydrostatic balance. A. True B. False
 Clicker Questions and Clicker Quizzes Clicker Questions Chapter 7 Of the four forces that affect the motion of air in our atmosphere, which is to thank for opposing the vertical pressure gradient force
Ocean dynamics: the wind-driven circulation
 Ocean dynamics: the wind-driven circulation Weston Anderson March 13, 2017 Contents 1 Introduction 1 2 The wind driven circulation (Ekman Transport) 3 3 Sverdrup flow 5 4 Western boundary currents (western
The North Atlantic Oscillation: Climatic Significance and Environmental Impact
 1 The North Atlantic Oscillation: Climatic Significance and Environmental Impact James W. Hurrell National Center for Atmospheric Research Climate and Global Dynamics Division, Climate Analysis Section
Cruise and Data Report: R/V Shana Rae operations in support of April 2015 AirSWOT campaign, April 17-20, 2015
 Cruise and Data Report: R/V Shana Rae operations in support of April 2015 AirSWOT campaign, April 17-20, 2015 J. Thomas Farrar, Benjamin Hodges, Sebastien Bigorre Physical Oceanography Department Woods
I. Ocean Layers and circulation types
 OCEAN Title CIRCULATION slide I. Ocean Layers and circulation types 1) Ocean Layers Ocean is strongly Stratified Consists of distinct LAYERS controlled by density takes huge amounts of energy to mix up
Variability of Currents off the Northern Coast of New Guinea
 Journal of Oceanography, Vol. 56, pp. 103 to 116. 2000 Variability of Currents off the Northern Coast of New Guinea YOSHIFUMI KURODA Ocean Research Department, Japan Marine Science and Technology Center,
Analysis of Physical Oceanographic Data from Bonne Bay, September 2002 September 2004
 Physics and Physical Oceanography Data Report -1 Analysis of Physical Oceanographic Data from Bonne Bay, September September Clark Richards and Brad deyoung Nov. 9 Department of Physics and Physical Oceanography
Isopycnal Analysis of Near-surface Waters in the Norwegian-Barents Sea Region. by Tom Rossby, Vladimir Ozhigin, Victor Ivshin, and Sheldon Bacon
 INTERNATIONAL COUNCIL FOR THE EXPLORATION OF THE SEA ICES CM 2006/C:14 Use of isopycnal water mass to distinguish between variability due to the heaving of, and property change on density surfaces. Isopycnal
Eddy and Chlorophyll-a Structure in the Kuroshio Extension Detected from Altimeter and SeaWiFS
 14th Symposium on Integrated Observing and Assimilation Systems for the Atmosphere, Oceans, and Land Surface (IOAS-AOLS), AMS Atlanta, January 17-21, 21 Eddy and Chlorophyll-a Structure in the Kuroshio
Preliminary Cruise Report PIRATA Northeast Extension 2006 / AMMA / Sahara Dust Cruise NOAA Ship Ronald H. Brown
 Preliminary Cruise Report PIRATA Northeast Extension 2006 / AMMA / Sahara Dust Cruise NOAA Ship Ronald H. Brown Leg 1: May 27-June 18, 2006 San Juan, Puerto Rico to Recife, Brazil Leg 2: June 22 - July