ADELA PAȘCA, TEODOR RUSU. Bucharest, June 2018
|
|
|
- Magdalene Barker
- 5 years ago
- Views:
Transcription


1 GIS INTEGRATION OF CLIMATE CHANGE THROUGH FAST CALCULATION OF TEMPERATURE AND PRECIPITATION MAPS FOR USE IN AGRICULTURAL LAND QUALITATIVE ASSESSMENT. CASE STUDY: ICLOD COMMUNE, CLUJ COUNTY, ROMANIA ADELA PAȘCA, TEODOR RUSU Bucharest, June 2018
2 INTRODUCTION In Romania, agricultural land quality classification is made depending on crop production potential, which is appreciated based on rating marks in natural conditions for arable use (Zisu, 2016). The most dynamic factors taken into account when a land evaluation is performed are climate resources, namely temperature and precipitation. Although land evaluation maps are constantly being updated, the national land evaluation methodology uses averages of temperature and precipitation over the past years (OSPA Cluj, 2014). The current tendencies of climate variability are not being taken into account, thus giving a reason to run climatic scenarios for accurate land evaluation of Iclod`s Commune agricultural fields. The use of current temperature and precipitation distribution in land evaluation is a common practice in the past years (Mitrică et al., 2015; Niacșu et al., 2015; Roșca et al., 2015; Moldovan, et al., 2016; Bilașco, et. al., 2016; Oprea et al., 2016).
3 Study area location Iclod Commune is located in north western Romania, near Cluj Napoca municipality, in Cluj County. Most of its land is currently being occupied by field crops.
4 MATERIALS AND METHODS The climate data was extracted from WorldClim monthly temperature and precipitation distribution maps (Fick & Hijmans, 2017) and Meteoblue History+ (2018) daily temperature and precipitation acquired tabular data. For slope and aspect calculations, the SRTM s 30m maps were used. According to WorldClim version 2 for the interval the yearly temperature for Iclod is 9.3 and the yearly rainfall is 600 mm. In the Meteoblue History+ the yearly temperature and rainfall values vary according to the chosen intervals. Temp. ( C) Precip. (mm) Temperature and precipitation averages
5 The highest yearly rainfall amount of 717 mm was recorded in 2004, while the lowest quantity of 308 mm was registered in The highest yearly temperature of was recorded in 2002 and the lowest of was recorded in For 2017 the average rainfall amount was 373 mm, and the average temperature was From the 30-year interval to the last 5 year averages the temperatures increases while the precipitation decreases as shown in the figure.
 and slope steepness and soil texture for rainfall (Figure 2).")
 Figure")
6 Temperature and precipitation corrections were applied on slope steepness and aspect in the case of temperature (Figure 1) and slope steepness and soil texture for rainfall (Figure 2). Figure 1. Average corrected temperature distribution in Iclod commune (after Worldclim version 2) Figure 2. Average corrected precipitation distribution in Iclod commune (after Worldclim version 2)
7 Precipitation (left) and temperature (right) distribution in the first scenario
8 Precipitation (left) and temperature (right) distribution in the second scenario
 and")

9 Precipitation (left) and temperature (right) distribution in the third scenario
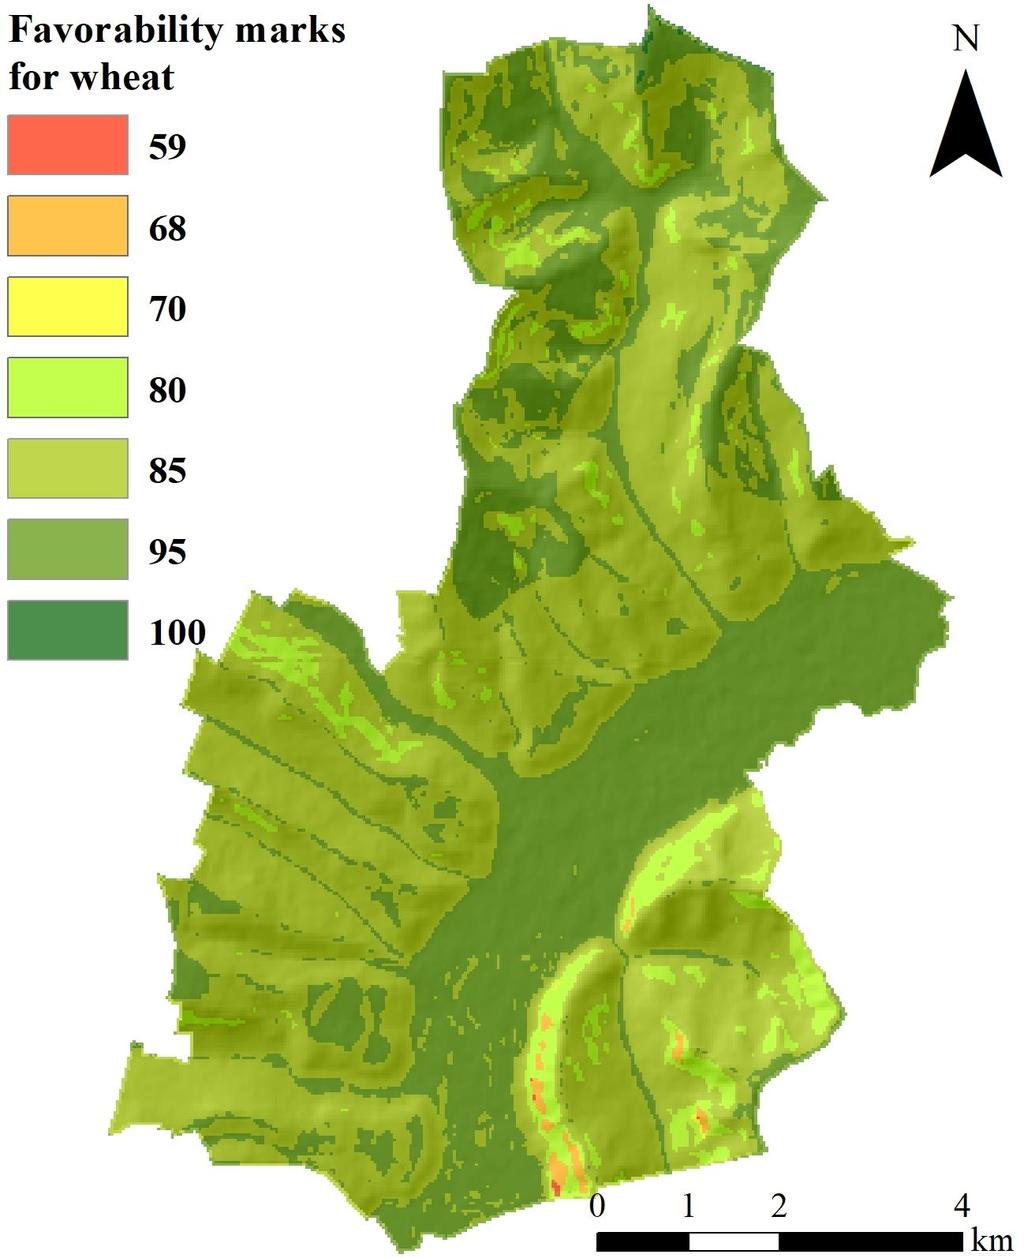
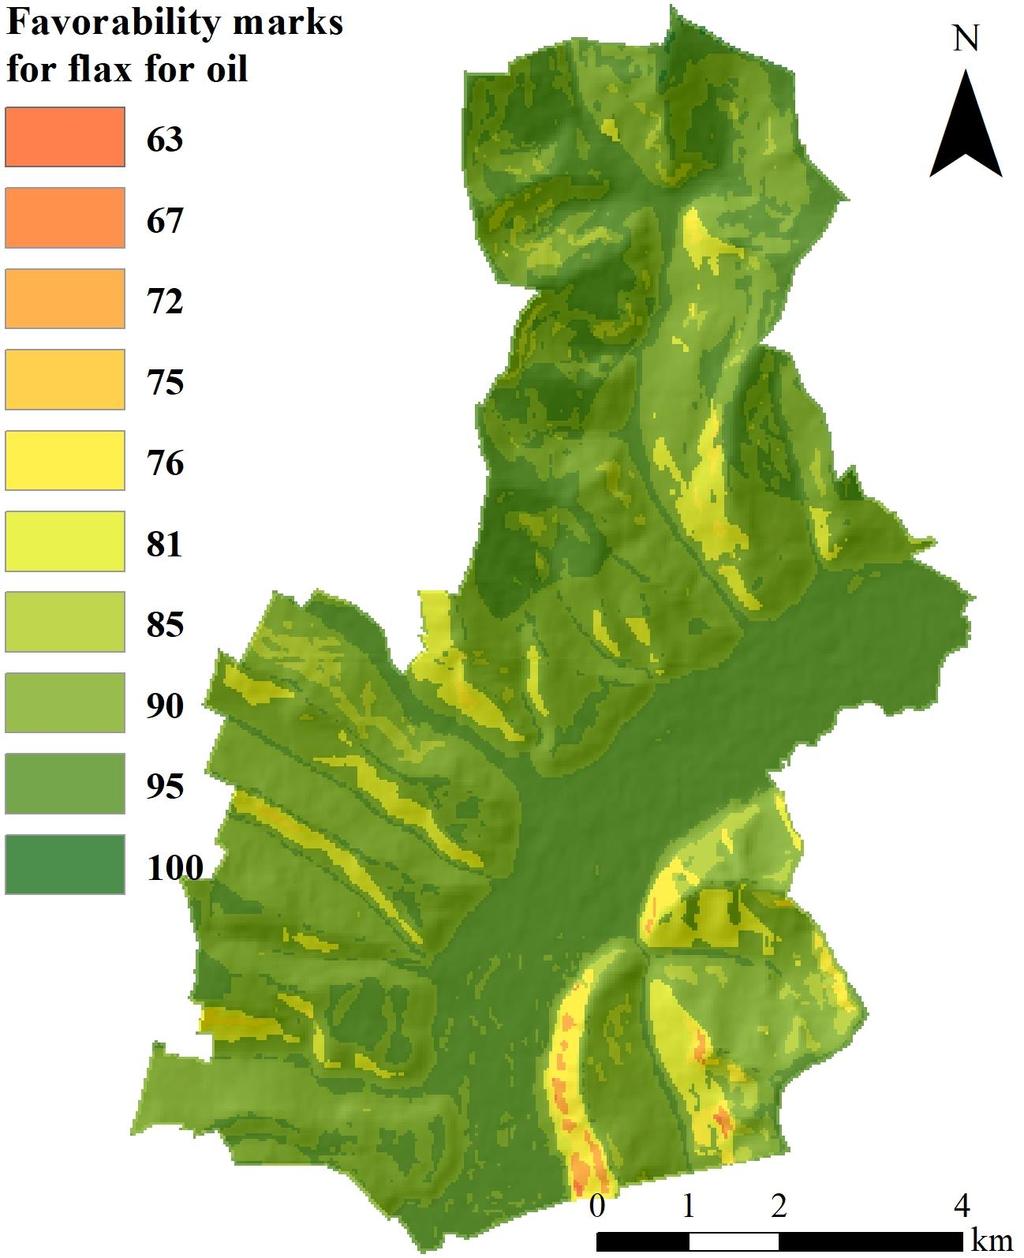
10 RESULTS AND DISCUSSIONS Based on temperature and precipitation trend values, three scenarios were compiled. The first scenario uses the last thirty years average temperatures: 11 degrees C and the last ten years average rainfall: 475mm. For the second scenario a temperature of 11,5 degrees C (last 10 years average) and a rainfall amount of 425mm (last 5 years average) were used. The last scenario uses the highest recorded temperature of 12 degrees C and an average of the most arid two years (in the analysed interval) of 350mm. The first step was to correlate the Meteoblue History+ tabular data with WorldClim version 2 spatial distribution maps. In ArcGIS Raster Calculator a constant was added or subtracted to the corrected temperature and precipitation maps depending on the scenario used. For the 1st scenario 1,7 degrees C were added, and 125mm was subtracted, for the 2nd scenario 2,2 degrees C were added, and 175mm was subtracted, and for the 3rd scenario 2,7 degrees C were added, and 250mm were subtracted. The second step was the identification of the most suitable crops for the climatic scenarios, obtained by multiplying temperature with precipitation in raster calculator. Although quite a few crops are suitable for the three scenarios (such as: peas/beans, alfalfa, sunflower, apricot tree, vineyard for wine, beetroot or soy) only four reach the highest degree of suitability: wheat, flax, vegetables, and barley.
11
12

13 In the national land evaluation methodology the most suitable four crops are being taken into account when calculating the arable land quality rating marks, which is an average of the four. The climate marks distribution maps for the four crops were calculated for each scenario. Their multiplication within each scenario gave the arable land climate quality rating marks distribution maps, which after reclassification gave the arable land climate favorability classes. 1 st scenario. Arable land favorability in first scenario

14 Arable land favorability in de second scenario Arable land favorability in the third scenario
15 CONCLUSIONS When used in conjunction, WorldClim version 2 spatial data and Meteoblue History+ tabular data show a quick and clear distribution of temperature and precipitation trends. The current climate trends in Iclod Commune show a significant increase in temperature and an acute decrease of precipitation amounts. The scenarios used show that even if other crops are used, the overall crop yields will decrease if the existing trends continue.
16 Thank you for your attention!
Identification of Areas With Natural Constraints Case Study Serbia
 Identification of Areas With Natural Constraints Case Study Serbia Dragana Vidojević of the Environmental Protection Agency, Ruže Jovanovića St. 27a, 11160 Belgrade, dragana.vidojevic@sepa.gov.rs; Jovica
CHAPTER VII FULLY DISTRIBUTED RAINFALL-RUNOFF MODEL USING GIS
 80 CHAPTER VII FULLY DISTRIBUTED RAINFALL-RUNOFF MODEL USING GIS 7.1GENERAL This chapter is discussed in six parts. Introduction to Runoff estimation using fully Distributed model is discussed in first
INTRODUCTION TO ARCGIS 10
 Department of Irrigation, Drainage and Landscape Engineering, Faculty of Civil Engineering, CTU Prague Institute of Hydraulics and Rural Water Management BOKU Vienna INTRODUCTION TO ARCGIS 10 MAIN WINDOW
USING GIS TECHNOLOGY IN HYDROGEOLOGICAL ANALYSIS
 USING GIS TECHNOLOGY IN HYDROGEOLOGICAL ANALYSIS CAMELIA SLAVE 1, IOANA VIZIREANU 2 1. University of Agronomic Sciences and Veterinary Medicine, Mărăști no 59, Bucharest 011464, Romania 2. National Institute
GeoPEARL_DE a Tool for Spatial Modelling of Pesticide Leaching Behaviour in Germany. Jörg Bangert
 GeoPEARL_DE a Tool for Spatial Modelling of Pesticide Leaching Behaviour in Germany Jörg Bangert Agenda Development of GeoPEARL_DE o Data sources o Spatial schematisation o Parameterisation Evaluation
THE MAXIMUM QUANTITIES OF RAIN-FALL IN 24 HOURS IN THE CRIŞUL REPEDE HYDROGRAPHIC AREA
 Analele Universităţii din Oradea, Fascicula: Protecţia Mediului, Vol. XIII, 8 THE MAXIMUM QUANTITIES OF RAIN-FALL IN 24 HOURS IN THE CRIŞUL REPEDE HYDROGRAPHIC AREA *University of Oradea, Faculty of Environmental
Extreme Phenomena in Dobrogea - Floods and Droughts
 Extreme Phenomena in Dobrogea - Floods and Droughts PhD eng. Carmen Maftei Ovidius University of Constanta (Partner no 4) OUTLINES Introduction Study area Drought Floods Conclusion What is the problem?
Delineation of high landslide risk areas as a result of land cover, slope, and geology in San Mateo County, California
 Delineation of high landslide risk areas as a result of land cover, slope, and geology in San Mateo County, California Introduction Problem Overview This project attempts to delineate the high-risk areas
Raster Analysis: An Example
 Raster Analysis: An Example Fires (1 or 4) Slope (1-4) + Geology (1-4) Erosion Ranking (3-12) 1 Typical Raster Model Types: Suitability Modeling: Where is optimum location? Distance Modeling: What is the
Landslide Susceptibility Model of Tualatin Mountains, Portland Oregon. By Tim Cassese and Colby Lawrence December 10, 2015
 Landslide Susceptibility Model of Tualatin Mountains, Portland Oregon By Tim Cassese and Colby Lawrence December 10, 2015 Landslide Closes Highway 30 at St. John's Bridge Introduction: Study Area: Tualatin
MODELING RUNOFF RESPONSE TO CHANGING LAND COVER IN PENGANGA SUBWATERSHED, MAHARASHTRA
 MODELING RUNOFF RESPONSE TO CHANGING LAND COVER IN PENGANGA SUBWATERSHED, MAHARASHTRA Abira Dutta Roy*, S.Sreekesh** *Research Scholar, **Associate Professor Centre for the Study of Regional Development,
ABSTRACT The first chapter Chapter two Chapter three Chapter four
 ABSTRACT The researches regarding this doctoral dissertation have been focused on the use of modern techniques and technologies of topography for the inventory and record keeping of land reclamation. The
Delineation of Groundwater Potential Zone on Brantas Groundwater Basin
 Delineation of Groundwater Potential Zone on Brantas Groundwater Basin Andi Rachman Putra 1, Ali Masduqi 2 1,2 Departement of Environmental Engineering, Sepuluh Nopember Institute of Technology, Indonesia
CropCast Europe Weekly Report
 CropCast Europe Weekly Report Kenny Miller Monday, June 05, 2017 Europe Hot Spots Abundant showers should ease dryness across northern and central UK as well as across western Norway and Sweden. Improvements
VCS MODULE VMD0018 METHODS TO DETERMINE STRATIFICATION
 VMD0018: Version 1.0 VCS MODULE VMD0018 METHODS TO DETERMINE STRATIFICATION Version 1.0 16 November 2012 Document Prepared by: The Earth Partners LLC. Table of Contents 1 SOURCES... 2 2 SUMMARY DESCRIPTION
GIS METHODOLOGY FOR THE CALCULATION OF PROBABLE PEAK DISCHARGE TIME OF CONCENTRATION IN SMALL DRAINAGE BASINS. CASE STUDY
 STUDIA UBB GEOGRAPHIA, LVI, 2, 2011 GIS METHODOLOGY FOR THE CALCULATION OF PROBABLE PEAK DISCHARGE TIME OF CONCENTRATION IN SMALL DRAINAGE BASINS. CASE STUDY ŞT. BILAŞCO 1 ABSTRACT. GIS Methodology for
Influence of Micro-Climate Parameters on Natural Vegetation A Study on Orkhon and Selenge Basins, Mongolia, Using Landsat-TM and NOAA-AVHRR Data
 Cloud Publications International Journal of Advanced Remote Sensing and GIS 2013, Volume 2, Issue 1, pp. 160-172, Article ID Tech-102 ISSN 2320-0243 Research Article Open Access Influence of Micro-Climate
Raster Analysis: An Example
 Raster Analysis: An Example Fires (1 or 4) Slope (1-4) + Geology (1-4) Erosion Ranking (3-12) 11/8/2016 GEO327G/386G, UT Austin 1 Typical Raster Model Types: Suitability Modeling: Where is optimum location?
Classification of Erosion Susceptibility
 GEO327G: GIS & GPS Applications in Earth Sciences Classification of Erosion Susceptibility Denali National Park, Alaska Zehao Xue 12 3 2015 2 TABLE OF CONTENTS 1 Abstract... 3 2 Introduction... 3 2.1 Universal
Precipitation. Standardized Precipitation Index. NIDIS Intermountain West Drought Early Warning System September 5, 2017
 9/6/2017 NIDIS Drought and Water Assessment NIDIS Intermountain West Drought Early Warning System September 5, 2017 Precipitation The images above use daily precipitation statistics from NWS COOP, CoCoRaHS,
Response on Interactive comment by Anonymous Referee #1
 Response on Interactive comment by Anonymous Referee #1 Sajid Ali First, we would like to thank you for evaluation and highlighting the deficiencies in the manuscript. It is indeed valuable addition and
Spatial Analyst. By Sumita Rai
 ArcGIS Extentions Spatial Analyst By Sumita Rai Overview What does GIS do? How does GIS work data models Extension to GIS Spatial Analyst Spatial Analyst Tasks & Tools Surface Analysis Surface Creation
GIS AND REMOTE SENSING FOR WATER RESOURCE MANAGEMENT
 GIS AND REMOTE SENSING FOR WATER RESOURCE MANAGEMENT G. GHIANNI, G. ADDEO, P. TANO CO.T.IR. Extension and experimental station for irrigation technique - Vasto (Ch) Italy. E-mail : ghianni@cotir.it, addeo@cotir.it,
Spatial Disaggregation of Land Cover and Cropping Information: Current Results and Further steps
 CAPRI CAPRI Spatial Disaggregation of Land Cover and Cropping Information: Current Results and Further steps Renate Koeble, Adrian Leip (Joint Research Centre) Markus Kempen (Universitaet Bonn) JRC-AL
LANLDSIDE HAZARD, SOCIAL-ECONOMIC VULNERABILITY AND PHYSICAL (BUILDINGS) RISK ASSESMENT SAGAREJO MUNICIPALITY CASE STUDY (PROJECT)
 RISK ASSESMENT SAGAREJO MUNICIPALITY CASE STUDY (PROJECT)") LANLDSIDE HAZARD, SOCIAL-ECONOMIC VULNERABILITY AND PHYSICAL (BUILDINGS) RISK ASSESMENT SAGAREJO MUNICIPALITY CASE STUDY (PROJECT) - 1 - 1. INTRODUCTION 3 2. USED DATA 4 3. METHODOLOGY 5 3.1 Work flow
LANLDSIDE HAZARD, SOCIAL-ECONOMIC VULNERABILITY AND PHYSICAL (BUILDINGS) RISK ASSESMENT SAGAREJO MUNICIPALITY CASE STUDY (PROJECT) - 1 - 1. INTRODUCTION 3 2. USED DATA 4 3. METHODOLOGY 5 3.1 Work flow
DROUGHT ASSESSMENT USING SATELLITE DERIVED METEOROLOGICAL PARAMETERS AND NDVI IN POTOHAR REGION
 DROUGHT ASSESSMENT USING SATELLITE DERIVED METEOROLOGICAL PARAMETERS AND NDVI IN POTOHAR REGION Researcher: Saad-ul-Haque Supervisor: Dr. Badar Ghauri Department of RS & GISc Institute of Space Technology
The MRCC and Monitoring Drought in the Midwest
 The and Monitoring Drought in the Midwest Steve Hilberg Director, Illinois State Water Survey Prairie Research Institute, University of Illinois The A partner of a national climate service program that
NIDIS Intermountain West Drought Early Warning System November 13, 2018
 NIDIS Intermountain West Drought Early Warning System November 13, 2018 Precipitation The images above use daily precipitation statistics from NWS COOP, CoCoRaHS, and CoAgMet stations. From top to bottom,
Effect of land use/land cover changes on runoff in a river basin: a case study
 Water Resources Management VI 139 Effect of land use/land cover changes on runoff in a river basin: a case study J. Letha, B. Thulasidharan Nair & B. Amruth Chand College of Engineering, Trivandrum, Kerala,
Soil surveys in Malaysia. Lecture 22-24
 Soil surveys in Malaysia Lecture 22-24 Map of Southeast Asia ENVIRONMENTAL SETTING A. Physiography ENVIRONMENTAL SETTING B. Physiography ENVIRONMENTAL SETTING C. Physiography WHAT IS SOIL SURVEY What Is
Global Climates. Name Date
 Global Climates Name Date No investigation of the atmosphere is complete without examining the global distribution of the major atmospheric elements and the impact that humans have on weather and climate.
Modelling Bluetongue vectors occurence using GIS and Remote Sensing techniques. Martins H., Nunes T., Boinas F.
 Modelling Bluetongue vectors occurence using GIS and Remote Sensing techniques Martins H., Nunes T., Boinas F. Introduction Objectives Spatial modelling of Culicoides imicola occurence Compare modelling
CONSIDERATIONS ABOUT THE INFLUENCE OF CLIMATE CHANGES AT BAIA MARE URBAN SYSTEM LEVEL. Mirela COMAN, Bogdan CIORUŢA
 SCIENTIFIC RESEARCH AND EDUCATION IN THE AIR FORCE AFASES2017 CONSIDERATIONS ABOUT THE INFLUENCE OF CLIMATE CHANGES AT BAIA MARE URBAN SYSTEM LEVEL Mirela COMAN, Bogdan CIORUŢA Faculty of Engineering,
The Development of the Slope Failure Management System
 FANG Ji, Akiyuki KAWASAKI, Satoru SADOHARA The Development of the Slope Failure Management System There are many incidents of slope failure across Japan. The measures are required. Recently soft-measures
Abstract: About the Author:
 REMOTE SENSING AND GIS IN LAND USE PLANNING Sathees kumar P 1, Nisha Radhakrishnan 2 1 1 Ph.D Research Scholar, Department of Civil Engineering, National Institute of Technology, Tiruchirappalli- 620015,
Seasonal Hydrological Forecasting in the Berg Water Management Area of South Africa
 Seasonal Hydrological Forecasting in the Berg Water Management Area of South Africa Trevor LUMSDEN and Roland SCHULZE University of KwaZulu-Natal, South Africa OUTLINE Introduction Objectives Study Area
Intro to GIS In Review
 Intro to GIS In Review GIS Analysis Winter 2016 GIS A quarter in review Geographic data types Acquiring GIS data Projections / Coordinate systems Working with attribute tables Data classification Map design
UNITED STATES AND SOUTH AMERICA SNAPSHOT REPORT Thursday, December 21, 2017
 T-storm Weather Summary A small but key corn and soybean area in western Argentina was wetter than expected overnight. T-storms affect varying areas of South America at varying times into January, but
Lecture 3A: Interception
 3-1 GEOG415 Lecture 3A: Interception What is interception? Canopy interception (C) Litter interception (L) Interception ( I = C + L ) Precipitation (P) Throughfall (T) Stemflow (S) Net precipitation (R)
COMMON GIS TECHNIQUES FOR VECTOR AND RASTER DATA PROCESSING. Ophelia Wang, Department of Geography and the Environment, University of Texas
 COMMON GIS TECHNIQUES FOR VECTOR AND RASTER DATA PROCESSING Ophelia Wang, Department of Geography and the Environment, University of Texas PART I: BASIC VECTOR TOOLS CLIP A FEATURE BASED ON THE EXTENT
Erosion Susceptibility in the area Around the Okanogan Fire Complex, Washington, US
 Erosion Susceptibility in the area Around the Okanogan Fire Complex, Washington, US 1. Problem Construct a raster that represents susceptibility to erosion based on lithology, slope, cover type, burned
Drought Assessment under Climate Change by Using NDVI and SPI for Marathwada
 Available online at www.ijpab.com ISSN: 2320 7051 Int. J. Pure App. Biosci. SPI: 6 (1): 1-5 (2018) Research Article Drought Assessment under Climate Change by Using NDVI and SPI for Marathwada A. U. Waikar
Remote sensing technique to monitoring the risk of soil degradation using NDVI
 Remote sensing technique to monitoring the risk of soil degradation using NDVI Ahmed Asaad Zaeen Remote sensing Unit, College of Science, University of Baghdad, Iraq ahmed_a_z@scbaghdad.com Abstract. In
Progress Report Year 2, NAG5-6003: The Dynamics of a Semi-Arid Region in Response to Climate and Water-Use Policy
 Progress Report Year 2, NAG5-6003: The Dynamics of a Semi-Arid Region in Response to Climate and Water-Use Policy Principal Investigator: Dr. John F. Mustard Department of Geological Sciences Brown University
IMPACT OF CLIMATE CHANGE OVER THE ARABIAN PENINSULA
 IMPACT OF CLIMATE CHANGE OVER THE ARABIAN PENINSULA By: Talal Alharbi June, 29 2017 1 Motivation: In arid and semi-arid regions of the world the demand for fresh water resources is increasing due to: increasing
Application of SWAT Model to Estimate the Runoff and Sediment Load from the Right Bank Valleys of Mosul Dam Reservoir
 Application of SWAT Model to Estimate the Runoff and Sediment Load from the Right Bank Valleys of Mosul Dam Reservoir Dr Mohammad Ezeel Deen Prof. Nadhir Al-Ansari Prof Sven Knutsson Figure 1.Map of Iraq
Multiple-Year Droughts In Nebraska
 University of Nebraska - Lincoln DigitalCommons@University of Nebraska - Lincoln Drought Mitigation Center Faculty Publications Drought -- National Drought Mitigation Center 2005 Multiple-Year Droughts
Shalaby, A. & Gad, A.
 Urban Sprawl Impact Assessment on the Fertile Agricultural Land of Egypt Using Remote Sensing and Digital Soil Database, Case study: Qalubiya Governorate Shalaby, A. & Gad, A. National Authority for Remote
Presented at the FIG Working Week 2017, May 29 - June 2, 2017 in Helsinki, Finland. Denny LUMBAN RAJA Adang SAPUTRA Johannes ANHORN
 Presented at the FIG Working Week 2017, May 29 - June 2, 2017 in Helsinki, Finland Denny LUMBAN RAJA Adang SAPUTRA Johannes ANHORN MAIN RESULTS Most of the surroundings of Cipongkor is dominated by very
Soil maps as data input for soil erosion models
 Soil maps as data input for soil erosion models Errors related to map scales Paul van Dijk Joëlle Sauter Elodie Hofstetter European Geosciences Union, General Assembly 2010, Vienna HS2.3/SSS47, May 6,
Raster Analysis; A Yellowstone Example 3/29/2018
 Fires (1 or 4) Typical Raster Model Types: Raster Analysis: An Example Suitability Modeling: Where is optimum location? Distance Modeling: What is the most efficient path from A to B? + Slope (1-4) Geology
EPIDEMIOLOGY FOR URBAN MALARIA MAPPING
 TELE-EPIDEMIOLOGY EPIDEMIOLOGY FOR URBAN MALARIA MAPPING @IRD/M Dukhan Vanessa Machault Observatoire Midi-Pyrénées, Laboratoire d Aérologie Pleiades days 17/01/2012 The concept of Tele-epidemiology The
Identifying Biomes from Climatograms
 Identifying Biomes from Welcome to your climatogram lab. In this lab you will investigate the between the amount of rainfall and the variance of temperature and the effect on the distribution of biomes
Raster Analysis; A Yellowstone Example 10/24/2013. M. Helper GEO327G/386G, UT Austin 2. M. Helper GEO327G/386G, UT Austin 4
 + Fires (1 or 4) Slope (1-4) Geology (1-4) Erosion Ranking (3-12) Raster Analysis: An Example Typical Raster Model Types: Suitability Modeling: Where is optimum location? Distance Modeling: What is the
FAO GAEZ Data Portal
 FAO GAEZ Data Portal www.fao.org/nr/gaez Renato Cumani Environment Officer Land and Water Division Natural Resources Management and Environment Department Food and Agriculture Organization of the UN October
Communicating Climate Change Consequences for Land Use
 Communicating Climate Change Consequences for Land Use Site: Prabost, Skye. Event: Kyle of Lochalsh, 28 th February 28 Further information: http://www.macaulay.ac.uk/ladss/comm_cc_consequences.html Who
Landslide susceptibility assessment over Europe according to the Tier 1 approach: Experiment and perspectives
 Landslide susceptibility assessment over Europe according to the Tier 1 approach: Experiment and perspectives Andreas Günther 1 & Paola Reichenbach 2 1 Bundesanstalt für Geowissenschaften und Rohstoffe
Assessment of solid load and siltation potential of dams reservoirs in the High Atlas of Marrakech (Moorcco) using SWAT Model
 using SWAT Model") Assessment of solid load and siltation potential of dams reservoirs in the High Atlas of Marrakech (Moorcco) using SWAT Model Amal Markhi: Phd Student Supervisor: Pr :N.Laftrouhi Contextualization Facing
Assessment of solid load and siltation potential of dams reservoirs in the High Atlas of Marrakech (Moorcco) using SWAT Model Amal Markhi: Phd Student Supervisor: Pr :N.Laftrouhi Contextualization Facing
Floodplain modeling. Ovidius University of Constanta (P4) Romania & Technological Educational Institute of Serres, Greece
 Romania & Technological Educational Institute of Serres, Greece") Floodplain modeling Ovidius University of Constanta (P4) Romania & Technological Educational Institute of Serres, Greece Scientific Staff: Dr Carmen Maftei, Professor, Civil Engineering Dept. Dr Konstantinos
Floodplain modeling Ovidius University of Constanta (P4) Romania & Technological Educational Institute of Serres, Greece Scientific Staff: Dr Carmen Maftei, Professor, Civil Engineering Dept. Dr Konstantinos
VENETO REGION PILOT AREA
 VENETO REGION PILOT AREA The pilot area is located in the north-east of Veneto region, located itself in the north-east of Italy. The area borders with Austria are in the northern part and run along high
Potential Impacts of Climate Change on Soil Erosion Vulnerability Across the Conterminous U.S.
 Potential Impacts of Climate Change on Soil Erosion Vulnerability Across the Conterminous U.S. Catalina Segura 1, Ge Sun 2, Steve McNulty 2, and Yang Zhang 1 1 2 1 Soil Erosion Natural process by which
Dealing with soil organic carbon mapping at different levels in Madagascar
 Dealing with soil organic carbon mapping at different levels in Madagascar N. Ramifehiarivo, A. Andriamananjara, H. Razafimahatratra, T. Razafimbelo, M. Rabenarivo, A.Rasolohery, N. Ranaivoson, C. Grinand,
Markville. CGC 1DL/PL Geography. Geography of Canada. Natural Environment Unit Test
 Markville CGC 1DL/PL Geography Geography of Canada Natural Environment Unit Test Name: Thinking /10 Knowledge /10 Application /10 Communication /10 Part A: Blanks (1 mark each) Thinking Choose the correct
Sediment- yield estimation, by M-PSIAC method in a GIS environment, case study:jonaghn river sub basin(karun basin)
") Sediment- yield estimation, by M-PSIAC method in a GIS environment, case study:jonaghn river sub basin(karun basin) Yavari-shahla *,Khdabakhsh-Saeed,Mohseni-Hasan, Rezai- Khalil Corresponding author: a
Sediment- yield estimation, by M-PSIAC method in a GIS environment, case study:jonaghn river sub basin(karun basin) Yavari-shahla *,Khdabakhsh-Saeed,Mohseni-Hasan, Rezai- Khalil Corresponding author: a
UNITED STATES AND SOUTH AMERICA SNAPSHOT REPORT Wednesday, December 20, 2017
 T-storm Weather Summary T-storms affect all growing areas of South America at one time or another over the next two weeks, but abovenormal rainfall is only likely for corn and soybeans in southern Brazil
Spatio-temporal models
 Spatio-temporal models Involve a least a three dimensional representation of one or more key attribute variation in planar (X-Y) space and through time. (a 4 th dimension could also be use, like Z for
NIDIS Intermountain West Drought Early Warning System July 18, 2017
 NIDIS Drought and Water Assessment NIDIS Intermountain West Drought Early Warning System July 18, 2017 Precipitation The images above use daily precipitation statistics from NWS COOP, CoCoRaHS, and CoAgMet
Pierce Cedar Creek Institute GIS Development Final Report. Grand Valley State University
 Pierce Cedar Creek Institute GIS Development Final Report Grand Valley State University Major Goals of Project The two primary goals of the project were to provide Matt VanPortfliet, GVSU student, the
Determination of flood risks in the yeniçiftlik stream basin by using remote sensing and GIS techniques
 Determination of flood risks in the yeniçiftlik stream basin by using remote sensing and GIS techniques İrfan Akar University of Atatürk, Institute of Social Sciences, Erzurum, Turkey D. Maktav & C. Uysal
KANSAS CLIMATE SUMMARY August 2015
 KANSAS CLIMATE SUMMARY August 2015 Cool and Dry August was drier than normal in most of the state. State-wide average precipitation was 2.80 inches or 85 percent of normal. The Northeast division of the
UNITED STATES AND SOUTH AMERICA OUTLOOK (FULL REPORT) Wednesday, April 18, 2018
 Wednesday, April 18, 2018") T-storm Weather Summary Coolness continues over the next week in much of the central U.S., most likely producing the coldest April since 1907 in the Corn Belt, but followed by seasonable to mild weather
T-storm Weather Summary Coolness continues over the next week in much of the central U.S., most likely producing the coldest April since 1907 in the Corn Belt, but followed by seasonable to mild weather
September 2018 Weather Summary West Central Research and Outreach Center Morris, MN
 September 2018 Weather Summary The mean temperature for September was 60.6 F, which is 1.5 F above the average of 59.1 F (1886-2017). The high temperature for the month was 94 F on September 16 th. The
Chapter-1 Introduction
 Modeling of rainfall variability and drought assessment in Sabarmati basin, Gujarat, India Chapter-1 Introduction 1.1 General Many researchers had studied variability of rainfall at spatial as well as
Evapotranspiration. Rabi H. Mohtar ABE 325
 Evapotranspiration Rabi H. Mohtar ABE 325 Introduction What is it? Factors affecting it? Why we need to estimate it? Latent heat of vaporization: Liquid gas o Energy needed o Cooling process Saturation
Agrometeorological activities in RHMSS
 Republic of Serbia Republic Hydrometeorological Service of Serbia Agrometeorological activities in RHMSS Department for applied climatology and agrometeorology www.hidmet.gov.rs Meteorological Observing
Predicting ectotherm disease vector spread. - Benefits from multi-disciplinary approaches and directions forward
 Predicting ectotherm disease vector spread - Benefits from multi-disciplinary approaches and directions forward Naturwissenschaften Stephanie Margarete THOMAS, Carl BEIERKUHNLEIN, Department of Biogeography,
Analyzing and Visualizing Precipitation and Soil Moisture in ArcGIS
 Analyzing and Visualizing Precipitation and Soil Moisture in ArcGIS Wenli Yang, Pham Long, Peisheng Zhao, Steve Kempler, and Jennifer Wei * NASA Goddard Earth Science Data and Information Services Center
Southern California Earthquake Center
 Southern California Earthquake Center By: Mark Slothower Geog 406 Final Report Dr. Sun Table of Contents Introduction Page 3 Hypothesis and research questions Page 3 Methods and flowchart Page 4 Data Page
CropCast Corn and Soybean Report Kenny Miller Friday, March 17, 2017
 Accumulated Rainfall (inches) Accumulated GDDs Temperature ( F)/Wind Speed (mph) Precipitation (inches) CropCast Corn and Soybean Report Kenny Miller Friday, March 17, 2017 Peoria, IL Regional Forecast
VILLAGE INFORMATION SYSTEM (V.I.S) FOR WATERSHED MANAGEMENT IN THE NORTH AHMADNAGAR DISTRICT, MAHARASHTRA
 FOR WATERSHED MANAGEMENT IN THE NORTH AHMADNAGAR DISTRICT, MAHARASHTRA") VILLAGE INFORMATION SYSTEM (V.I.S) FOR WATERSHED MANAGEMENT IN THE NORTH AHMADNAGAR DISTRICT, MAHARASHTRA Abstract: The drought prone zone in the Western Maharashtra is not in position to achieve the agricultural
VILLAGE INFORMATION SYSTEM (V.I.S) FOR WATERSHED MANAGEMENT IN THE NORTH AHMADNAGAR DISTRICT, MAHARASHTRA Abstract: The drought prone zone in the Western Maharashtra is not in position to achieve the agricultural
CropCast Corn and Soybean Report Kenny Miller Tuesday, March 14, 2017
 Accumulated Rainfall (inches) Accumulated GDDs Temperature ( F)/Wind Speed (mph) Precipitation (inches) CropCast Corn and Soybean Report Kenny Miller Tuesday, March 14, 2017 Peoria, IL Regional Forecast
Existing NWS Flash Flood Guidance
 Introduction The Flash Flood Potential Index (FFPI) incorporates physiographic characteristics of an individual drainage basin to determine its hydrologic response. In flash flood situations, the hydrologic
Meteorology. Chapter 15 Worksheet 1
 Chapter 15 Worksheet 1 Meteorology Name: Circle the letter that corresponds to the correct answer 1) The Tropic of Cancer and the Arctic Circle are examples of locations determined by: a) measuring systems.
The Relationship between Vegetation Changes and Cut-offs in the Lower Yellow River Based on Satellite and Ground Data
 Journal of Natural Disaster Science, Volume 27, Number 1, 2005, pp1-7 The Relationship between Vegetation Changes and Cut-offs in the Lower Yellow River Based on Satellite and Ground Data Xiufeng WANG
USING GIS FOR AVALANCHE SUSCEPTIBILITY MAPPING IN RODNEI MOUNTAINS
 USING GIS FOR AVALANCHE SUSCEPTIBILITY MAPPING IN RODNEI MOUNTAINS IOANA SIMEA 1 ABSTRACT. Using GIS for avalanche susceptibility mapping in Rodnei Mountains. This case study combines GIS methods with
CHAPTER 4 METHODOLOGY
 71 CHAPTER 4 METHODOLOGY 4.1 GENERAL Drought, a vague phenomenon, has been defined and analyzed in various ways. Drought assessment involves analysis of spatially and temporally varying water related data.
Site Suitability Analysis for Urban Development: A Review
 Site Suitability Analysis for Urban Development: A Review Santanu Kumar Misra Associate Professor (Dept. of CSE) Sikkim Manipal Institute of Technology Majitar, Sikkim misra_santanu@rediffmail.com Shrijana
Spectroscopy Applications
 Spectroscopy Applications Soil spectroscopy as a tool for the spatial assessment of soil erosion states in agricultural semi-arid Spain Sabine Chabrillat 1, Thomas Schmid 2, Robert Milewski 1, Manuel Rodriguez
Drought risk assessment using GIS and remote sensing: A case study of District Khushab, Pakistan
 15 th International Conference on Environmental Science and Technology Rhodes, Greece, 31 August to 2 September 2017 Drought risk assessment using GIS and remote sensing: A case study of District Khushab,
Microwave emissivity of land surfaces: experiments and models
 Microwave emissivity of land surfaces: experiments and models M. Brogioni, G.Macelloni, S.Paloscia, P.Pampaloni, S.Pettinato, E.Santi IFAC-CNR Florence, Italy Introduction Experimental investigations conducted
Climate outlook, longer term assessment and regional implications. What s Ahead for Agriculture: How to Keep One of Our Key Industries Sustainable
 Climate outlook, longer term assessment and regional implications What s Ahead for Agriculture: How to Keep One of Our Key Industries Sustainable Bureau of Meteorology presented by Dr Jeff Sabburg Business
Standardized Precipitation Index tool for drought monitoring
 Standardized Precipitation Index tool for drought monitoring - Examples from Slovenia - Sabina Bokal Drought Management Centre for Southeastern Europe, DMCSEE Contents What is Standardized Precipitation
CropCast Corn and Soybean Report Kenny Miller Monday, March 13, 2017
 Accumulated Rainfall (inches) Accumulated GDDs Temperature ( F)/Wind Speed (mph) Precipitation (inches) CropCast Corn and Soybean Report Kenny Miller Monday, March 13, 2017 Peoria, IL Regional Forecast
Flood Risk Map Based on GIS, and Multi Criteria Techniques (Case Study Terengganu Malaysia)
") Journal of Geographic Information System, 2015, 7, 348-357 Published Online August 2015 in SciRes. http://www.scirp.org/journal/jgis http://dx.doi.org/10.4236/jgis.2015.74027 Flood Risk Map Based on GIS,
Journal of Geographic Information System, 2015, 7, 348-357 Published Online August 2015 in SciRes. http://www.scirp.org/journal/jgis http://dx.doi.org/10.4236/jgis.2015.74027 Flood Risk Map Based on GIS,
An Internet-based Agricultural Land Use Trends Visualization System (AgLuT)
") An Internet-based Agricultural Land Use Trends Visualization System (AgLuT) Prepared for Missouri Department of Natural Resources Missouri Department of Conservation 07-01-2000-12-31-2001 Submitted by
An Internet-based Agricultural Land Use Trends Visualization System (AgLuT) Prepared for Missouri Department of Natural Resources Missouri Department of Conservation 07-01-2000-12-31-2001 Submitted by
Analysis of Rural-Urban Systems and Historic Climate Data in Mexico
 Analysis of Rural-Urban Systems and Historic Climate Data in Mexico Global Conference on Big Data for Official Statistics October 2015, Abu Dhabi, UAE RURAL-URBAN SYSTEMS Rural-Urban Systems: Functional
Variability of Reference Evapotranspiration Across Nebraska
 Know how. Know now. EC733 Variability of Reference Evapotranspiration Across Nebraska Suat Irmak, Extension Soil and Water Resources and Irrigation Specialist Kari E. Skaggs, Research Associate, Biological
Utility of National Spatial Data for Conservation Design Projects
 Utility of National Spatial Data for Conservation Design Projects Steve Williams Biodiversity and Spatial Information Center North Carolina State University PIF CDW St. Louis, MO April 11, 2006 Types of
CropCast Corn and Soybean Report Kyle Tapley Monday, March 20, 2017
 Accumulated Rainfall (inches) Accumulated GDDs Temperature ( F)/Wind Speed (mph) Precipitation (inches) CropCast Corn and Soybean Report Kyle Tapley Monday, March 20, 2017 Peoria, IL Regional Forecast
Analysis of Historical Pattern of Rainfall in the Western Region of Bangladesh
 24 25 April 214, Asian University for Women, Bangladesh Analysis of Historical Pattern of Rainfall in the Western Region of Bangladesh Md. Tanvir Alam 1*, Tanni Sarker 2 1,2 Department of Civil Engineering,