The Observational Climate Record
|
|
|
- Natalie Stevenson
- 5 years ago
- Views:
Transcription


1 The Observational Climate Record Deke Arndt NOAA s Asheville, NC, USA February 2018 National Oceanic and Atmospheric Administration NOAA Satellite and Information Service


2 National Centers for Environmental Information Asheville, NC 2
3 About Me I am a meteorologist by training, but I ve been in drought or climate since the late 1990s. I m not the lead expert in any of the following material. I use it operationally. 3
4 Objectives Long-term Goal (this and future engagements): - Inform your role as station scientist who gets many climate questions from many directions Today s Objectives: - Identify and address some common misconceptions or points of confusion about the observational record. - Point to peer-reviewed literature that more fully describes approaches and conclusion. I want you to be confident using this information to get your job(s) done. 4

5 Global Surface Temperature Difference From 20th Century Average, in F 2017: C / F above average; 3 rd warmest year of record Year % % % All others 1% Probability of Warmest Rank 5
 were warmer 21 st consecutive year warmer than 20 th century average Every CONUS state and AK had an above average (top one-third of history) or warmer year, for 3 rd consecutive year Record")
6 U.S. Temperature: 2017 CONUS: 54.6 F; 2.6 F above 20 th century avg; 3 rd warmest year 2012 (55.3 F) and 2016 (54.9 F) were warmer 21 st consecutive year warmer than 20 th century average Every CONUS state and AK had an above average (top one-third of history) or warmer year, for 3 rd consecutive year Record warm states: AZ, GA, NM, NC, SC - Arizona temp of 63.1ºF surpassed the previous record set in 2014 by 0.8ºF. T max and T min ranked as the 5 th and 4 th highest temps on record, respectively. 6

7 T min vs. T max relative to [their own] history 7
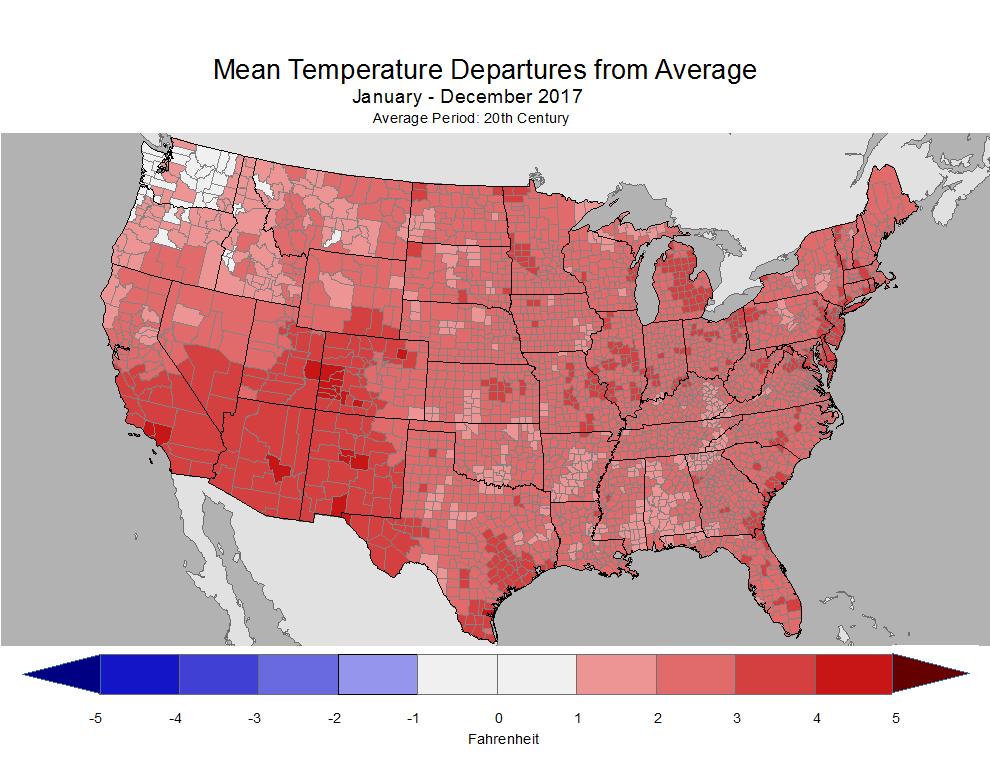
8 Temperature Anomalies by County 8
9 Individual Months: Mar 2010: NJ RI Apr 2010: CT IL MA ME MI NH NJ* RI May 2010: FL AK Jun 2010: DE LA* NC NJ IA MI Jul 2010: CT* DE* MA* RI* Aug 2010: LA* Sep 2010: MN Oct 2010: FL Dec 2010: FL UT Mar 2011: TX Apr 2011: IL IN KY MI* NY OH PA TN WV Jun 2011: LA TX NM Jul 2011: DE* MD* OK TX Aug 2011: AZ CO FL LA NM OK TX NH NJ NY VT Sep 2011: OR PA Nov 2011: RI Jan 2012: AK Mar 2012: CONUS AL AR CT GA IA IL IN KS KY MA MI MN MO MS NC ND NE NH NJ NY OH OK PA RI SC SD TN VA VT WI WV Jun 2012: CO FL UT* WY Jul 2012: DE MD VA Aug 2012: NV MS Sep 2012: CA MN MT ND SD Oct 2012: DE Nov 2012: NH WV Feb 2013: GA Apr 2013: ND IA MI May 2013: IA Jun 2013: NJ UT Jul 2013: CT MA RI FL Sep 2013: CO OR WA Oct 2013: AK Jan 2014: CA Jul 2014: AR Aug 2014: MT Feb 2015: AZ CA OR WA Apr 2015: FL May 2015: AK CT MA NH CONUS CO OK TX UT Jun 2015: CA ID OR UT* WA IL IN OH Jul 2015: KY Sep 2015: CO CT MA ME MI MN RI UT WI Oct 2015: WA SC Nov 2015: NJ AR MO Dec 2015: CONUS AL AR CT DE FL GA IA IL IN KS KY MA MD ME MI MN MO MS NH NJ NY NC OU OK PA RI SC TN VA VT WI WV CONUS IA NC OK WI Feb 2016: AK Mar 2016: LA Apr 2016: AK Jun 2016: AZ UT Jul 2016: FL NM Aug 2016: CT DE MA MD NJ NY PA RI LA Oct 2016: NM ID MT WA AK Nov 2016: WA FL Feb 2017: AR DE IL IN KY LA MD MO NC NJ NY OH PA TX VA WV Mar 2017: CO NM Apr 2017: DE MD NC NJ OH PA WV VA NC Aug 2017: CA OR WA TX Sep 2017: LA Oct 2017: CT MA ME NH RI VT MI Nov 2017: AZ CO NM UT Jun 2014: National AK MN Centers for Environmental Information Seasons: 1Q 2010: ME VT* MA RI Spr 2010: CT* DE* MA* ME MI* NH NJ* NY* RI VT* 2Q 2010: CT DE LA MA MD NC NH NJ RI VA VT Sum 2010: CT* DE GA MD MS NC NJ RI* SC TN VA WI 3Q 2010: CT* DE* FL* MA* 4Q 2010: NV UT FL CY 2010: ME NH* ND Spr 2011: ID IN KY MI MT NY OH OR PA VT WA WV WY AK TX 2Q 2011: WA TX IL IN KY MI MT NY OH NM Sum 2011: LA NM OK TX NJ TX 3Q 2011: NM TX MD NJ NY Aut 2011: CT* MA* ME* NH* RI VT OH PA 4Q 2011: CT* MA* NJ* RI* CY 2011: CT IN KY MA NJ NY OH PA VT 1Q 2012: CONUS AL AR CT DE GA IA IL IN KS KY MA MD MI MN MO ND NE NH NJ NY OH OK* PA RI SD TN VA VT WI WV CT RI 1Q 2014: AZ* CA* Win : CA* 2Q 2014: MN Sum 2014: AK Aut 2014: CA CY 2014: AK* AZ* CA NV Win : AZ CA NV UT 1Q 2015: NY AZ CA NV OR UT WA WY SD Spr 2015: FL TX 2Q 2015: FL WA TX Sum 2015: OR WA 3Q 2015: CT* ME NH RI * Aut 2015: CONUS* FL SC 4Q 2015: CONUS CT DE FL GA IN KS MA MD ME MI MN MS NH NJ NY NC OH PA RI SC TX* VA VR WI WV MO NC OK SC TX CY 2015: FL MT OR WA OK TX Win : CONUS CT MA ME NH RI VT IA 1Q 2016: AK Spr 2016: AK 2Q 2016: AK Sum 2016: CA* CT RI Spr 2012: CONUS AL AR CO CT DE FL* GA IA IL IN KS KY LA MA MD MI MN MO MS NC 3Q 2016: CT DE FL MD MA MI NC NJ NY OH NE NJ NY OH OK PA SC SD TN TX VA VT WI PA RI SC WV Aut 2016: CONUS CO IA KS MI MN NM TX 2Q 2012: CO KS AR UT WA Sum 2012: CO FL NE 4Q 2016: NM* TX 3Q 2012: AK MS MT NE SD CY 2016: AK GA* Aut 2012: NV Win : LA TX NV WY CY 2012: AR AZ* CO CT DE IA IL IN KS MA 1Q 2017: LA MS NM OK SC TX MD MI MO NE NH NJ NM* NY OK PA RI SD Sum 2017: CA NV MS TX VA VT WI WY NE WY Aut 2017: AZ CT MA ME NH NM AR 1Q 2013: CA 4Q 2017: AZ CO NM Spr 2013: IA CY 2017: AZ NM GA NC SC MI Sum 2013: DE GA SC 3Q 2013: CO OR IA Aut 2013: WY 4Q 2013: CA CY 2013: CA State records since 2010 COOLEST WARMEST WETTEST DRIEST Key to Seasons: CY: Calendar Yr (Jan-Dec) 1Q: 1 st qtr (Jan-Feb-Mar) Spr: Spring (Mar-Apr-May) * - record since broken Climate at a Glance 9

10 Contents How do we compute US and global temperatures? Station Siting Corrections In situ vs. Satellite-derived temperatures Precision Dealing with dropouts Where do I find this stuff? 10
11 First, good news The surface temperature record has been extensively scrutinized this past decade This led to improvements in network and station metadata, algorithms which detect and correct disruptions in time-series, and ultimately, a more robust and understood US and Global temperature time series. 11

12 Multiple indicators We could talk about: arctic amplification glaciers permafrost sea level rise rise in lake temps ocean heat content ocean acidification 12
13 What are temperature anomalies? For studying climate change, temperature departures, or anomalies, are often more important than absolute temperature. These are differences from an average, or baseline, temperature, often the normal. - Positive anomaly: observed temperature warmer than the the baseline - Negative anomaly: observed temperature cooler than the baseline. 13

14 Why use anomalies? Anomalies take advantage of the meteorological property of scale. Temperature patterns vs. normal are large and fairly consistent, even if the absolute temperatures within vary due to terrain, proximity to bodies of water, elevation, or other effects This is especially true on multiday time scales Using anomalies helps minimize problems when stations are added, removed, or missing from the monitoring network. 14

15 Globe derived from Grid boxes 15
 Gee, H thanks, NOAA!")
16 Grid box derived from stations, buoys, ships X X Normal monthly average temperature at station X Observed monthly average temperature at station X Anomaly (departure from normal) Step 1: Compute Station anomalies ß Cooler Warmer à G F E G A B F D C H E B H A C D Step 2: Keep anomalies; scrap obs (work in anomaly space ) Gee, H thanks, NOAA! A B C D E F G Step 3: Compute avg anomaly for grid box Step 4: Average grid boxes. Weight by latitude 16


17 Ocean data shared through a similar international system 17
18 Global + US + OK Temperature Anomalies since
19 Dealing with threats to data validity 19
20 Random error vs. bias Random, garden variety bad data, precision, etc. generally doesn t keep us up at night. Problems tend to bounce around the average. Over increasingly large time and space scales, these balance out. What keeps us up at night: detecting and correcting systematic biases. These show up as shifts in a long-term record that can be subtle or dramatic 20

21 Random error vs. bias We often get asked: - How can you tell the temperature of the planet down to 0.01C when the instruments only measure to 1.0C? - Great question, and straightforward answer: the power of large numbers, in particular the large number of obs. Follow up question: - But what about the instrument only being accurate within +/- 2.0C? - Great question, and straightforward answer: the power of large numbers, in particular the large number of obs. Think of it this way: - How can you tell LeBron James is a 33.2% three-point shooter, when we only measure whole makes or misses? Wow thanks Deke. Great point. 21
22 Random error vs. bias Random error forgives itself when the number of observations is sufficiently large (and the scale of analysis is sufficiently large to match) Random Error: - Ref said his toe was on the line! - He did/didn t get fouled! However: - What if they moved the three-point line during his career? - What about the effects of aging? Changing teams? - Other rule changes? Points to make here: 1. It s the bias, not the random error, that threatens largescale analysis based on many data points. 2. Bias keeps climate data people up at night. 3. The causes of bias are often changes in practice or instrumentation. 4. The pointers to bias lie in the metadata. 22
23 Major Known Causes of Station Shifts Time of observation ( TOB ) changes Changes in instrumentation Changes in station environment All of these can be documented or undocumented 23
24 Observation of Time of Observation, over Time We have become a nation of morning observers. This introduced a cool bias over time. TOB is a statistical correction for this effect. From Vose et al., 2003 Literature: Vose, R. S., C. N. Williams Jr., T. C. Peterson, T. R. Karl, and D. R. Easterling (2003), An evaluation of the time of observation bias adjustment in the U.S. Historical Climatology Network, Geophys. Res. Lett., 30, 2046, doi: /2003gl018111,


25 Changes in instrumentation and siting 1980s: Much of the network shifted from traditional shelters and liquid in glass to MMTS package Competing Effects: Brought stations closer to structures, but much cooler instrument package NOAA Photo Library Literature: Menne, M.J., C.N. Williams Jr., and R.S. Vose, 2009: The United States Historical Climatology Network monthly temperature data Version 2. Bulletin of the American Meteorological Society, 90, National Weather Service 25
26 Urbanization and Ruralization Reno, Nevada T min : comparison with neighbors Urban signal associated with 14%-21% of the rise in unadjusted T min since 1895 and 6%-9% since Homogenization effectively removes this urban signal from individual and aggregate station records such that it becomes insignificant during the last years. Literature: Z. Hausfather, M.J. Menne, C.N. Williams, T. Masters, R. Broberg, and D. Jones, "Quantifying the effect of urbanization on U.S. Historical Climatology Network temperature records", J. Geophys. Res. Atmos., vol. 118, pp ,
27 Effects of these issues on CONUS Changes in observation practice had different effect on T max vs T min trends Before any sort of homogenizaton: T max widespread shifts artificially cooled the true rate of change - Artificial cooling since 1950: changing time of observation - Artificial cooling (primarily mid-1980s): liquid-in-glass thermometers à MMTS electronic resistance thermistors T min these shifts work in opposition to each other. - Artificial cooling since 1950: changing time of observation - Some artificial cooling from : station moves to somewhat cooler microclimates (ruralization) - Artificial warming since the mid-1980s: associated with installation of MMTS. - Conclusion: raw T min data likely underestimate overall trend since 1950 (when time of obs shifts dominate) and overestimate overall trend since 1979 (when shifts associated with MMTS installation dominate). Literature: Menne, M. J., C. N. Williams, Jr., and M. A. Palecki, 2010: On the reliability of the U.S. surface temperature record. Journal of Geophysical Research, 115, D11108, doi: /2009jd
28 Checking Our Work How do we know we re getting it right? 28

29 How do we know corrections work? NCDC uses homogenization algorithm designed to account for shifts and reduce the error in trend calculations Benchmarking experiments broadly affirmed the approach Comparison with hourly reanalyses also indicate corrections are in correct direction Vose, R.S., S. Applequist, M.J. Menne, C.N. Williams Jr., and P. Thorne (2012), An intercomparison of temperature trends in the U.S. Historical Climatology Network and recent atmospheric reanalyses, Geophys. Res. Lett., 39, L10703, doi: /2012GL Williams, C.N., M.J. Menne, and P.W. Thorne, 2012: Benchmarking the performance of pairwise homogenization of surface temperatures in the United States. Journal of Geophysical Research- Atmospheres, 117, D5, doi: /2011jd Zhang, J., W. Zheng, and M.J. Menne, 2012: A Bayes factor model for detecting artificial discontinuities via pairwise comparisons. Journal of Climate, 25, , doi: /JCLI-D
30 Compared to Climate Reference Network USHCN: A network of ~1,200 stations used to calculate CONUS temperature until Now defunct ClimDiv: Uses about five times as many stations, gridded method to calculate CONUS (and now Alaska) temperature and precipitation. Became the operational set of choice in
31 Compared to Climate Reference Network 31
32 Why adjust the past? Rationale: adjusted datasets should reflect what the data would show with today s instrumentation and practices. Unadjusted data are perpetually publicly available. Unadjusted data are primary input for each monthly analysis (we don t just assume the corrections from last month s run) Dear Colleague: if you take anything away from today s presentation, please note that our corrections actually reduce the global temperature trend. Karl, T. R., and Coauthors, 2015: Possible artifacts of data biases in the recent global surface warming hiatus. Science, 348, , doi: /science.aaa5632. Vose, R.S., D.S. Arndt, V.F. Banzon, D.R. Easterling, B. Gleason, B. Huang, E. Kearns, J.H. Lawrimore, M.J. Menne, T.C. Peterson, R.W. Reynolds, T.M. Smith, C.N. Williams, Jr., and D.L. Wuertz, 2012: NOAA's merged land-ocean surface temperature analysis. Bull. Amer. Met. Soc., 93, , doi: / BAMS-D
 Matthews & Matthews (2013): Comparing historical and modern methods of sea surface")


33 SST corrections dominate the global signal None of the boundaries between these are sharp (with the exception of the WW2 years themselves) Matthews & Matthews (2013): Comparing historical and modern methods of sea surface temperature measurement. Ocean Sci., 9, Bucket Method: dominates pre-ww2 Kennedy, J.J., N.A. Rayner, R.O. Smith, D.E. Parker, and M. Saunby (2011), Reassessing biases and other uncertainties in sea surface temperature observations measured in situ since 1850: 2. Biases and homogenization, J. Geophys. Res., 116, D14104, doi: /2010jd Engine Room Intake: dominates last half of 20 th century Buoys: emergent late 20 th century; becoming dominant 33

34 SST observations, historically Big drop-off in bucket use during WW2 Rapid rebound in bucket use WW2, then replaced by cheaper, safer ERI. Results in warm bias generally over time. Journal of Geophysical Research: Atmospheres Volume 116, Issue D14, D14104, 22 JUL 2011 DOI: /2010JD
35 Other random stuff 35
36 T sfc vs. TLT: Related but not Equated Surface Temperature Represents: meteorological surface temperature (approx. 1.5m AGL) Measured by: thousands of insitu stations Familiar datasets: GHCN, nclimdiv, CRUTemp Challenges: environment drift, changing instruments Temp of Lower Trop ( satellite ) Represents: bulk temperature from sfc to about 8,000m (26,000 ft) Measured by: indirect; derived from radiances in microwave frequencies Familiar datasets: RSS, UAH Challenges: orbital drift, changing instruments, 36

37 Precision How do we come up with 0.1 or 0.01 values when individual stations measure in whole degrees? More samples = more statistical power NBA.com 37
38 Specific Questions 38
39 Some Specific Questions I'm most curious about the span of the record as we didn't have stations on many continents for the early years of the record, how were those years reconstructed? - Global-scale analysis still possible: the oceans, and Africa, were better sampled than you might think. - Some orgs analyze global temps back to mid 1800s; we start our official record at With that said, uncertainties are higher during the late 19 th century partly because of sparser coverage 39
40 Some Specific Questions How are future analyses looking? Leaning more on surface stations or satellite obs? - Sats will become more important over time as the period of record lengthens. This is especially true for variables that aren t in the in situ wheelhouse (i.e., those variables other than sfc temperature and somewhat precip) 40
? - Short version: Main difference lately is how aggressive or conservative we are in data sparse areas (Antarctic, Africa, Arctic).")

41 Some Specific Questions Without getting in the weeds, what are key differences between the NOAA monthly analyses and those of other labs (NASA, Hadley, JMA)? - Short version: Main difference lately is how aggressive or conservative we are in data sparse areas (Antarctic, Africa, Arctic). - Esp. the Arctic, which is warming at a substantially different rate than the rest of the planet. - Also, minor diffs in station composition, quality assurance, and how missing data are handled. - We also present vs. different base periods, which can bother people, although no effect on trend 41
42 Some Specific Questions Is there a way to know how much data (by percentage) is discarded or deemed inferior for the analyses? - Two ways to look at this: rejecting gardenvariety bad data, and identifying station discontinuities. - The flag rate for individual observations is about a quarter of a percent - The vast majority of stations have at least one detected break in their record 42
43 Resources 43
44 NCEI FAQ and Similar Resources About global temperature uncertainty: faq/global-precision.php About anomalies vs. absolute temperatures: faq/anomalies.php Shorter version of same: dyk/anomalies-vs-temperature 44
45 Data Specific to this Presentation Global, US temperature time series: - Climate at a Glance: - Also for states, climate divisions within states Raw and Adjusted HCN data: qcu files: unadjusted (raw) - qca files: adjusted Comparison CONUS temperature methods to CRN:
Your Galactic Address
 How Big is the Universe? Usually you think of your address as only three or four lines long: your name, street, city, and state. But to address a letter to a friend in a distant galaxy, you have to specify
Global Warming is Unequivocal: The Evidence from NOAA
 Global Warming is Unequivocal: The Evidence from NOAA Thomas R. Karl Past President, American Meteorological Society Interim Director, NOAA Climate Service Director, NOAA National Climatic Data Center,
NOAA s Temperature Records: A Foundation for Understanding Global Warming
 NOAA s Temperature Records: A Foundation for Understanding Global Warming Thomas R. Karl Past President, American Meteorological Society Interim Director, NOAA Climate Service Director, NOAA National Climatic
Lecture 26 Section 8.4. Mon, Oct 13, 2008
 Lecture 26 Section 8.4 Hampden-Sydney College Mon, Oct 13, 2008 Outline 1 2 3 4 Exercise 8.12, page 528. Suppose that 60% of all students at a large university access course information using the Internet.
Coverage bias in the HadCRUT4 temperature series and its impact on recent temperature trends. UPDATE COBE-SST2 based land-ocean dataset
 Coverage bias in the HadCRUT4 temperature series and its impact on recent temperature trends. UPDATE COBE-SST2 based land-ocean dataset Kevin Cowtan November 7th, 2017 1 1 COBE-SST2 based land-ocean dataset
Nursing Facilities' Life Safety Standard Survey Results Quarterly Reference Tables
 Nursing Facilities' Life Safety Standard Survey Results Quarterly Reference Tables Table of Contents Table 1: Summary of Life Safety Survey Results by State Table 2: Ten Most Frequently Cited Life Safety
Use your text to define the following term. Use the terms to label the figure below. Define the following term.
 Mapping Our World Section. and Longitude Skim Section of your text. Write three questions that come to mind from reading the headings and the illustration captions.. Responses may include questions about
Comparison of Global Mean Temperature Series
 ADVANCES IN CLIMATE CHANGE RESEARCH 2(4): 187 192, 2011 www.climatechange.cn DOI: 10.3724/SP.J.1248.2011.00187 REVIEW Comparison of Global Mean Temperature Series Xinyu Wen 1,2, Guoli Tang 3, Shaowu Wang
Forecasting the 2012 Presidential Election from History and the Polls
 Forecasting the 2012 Presidential Election from History and the Polls Drew Linzer Assistant Professor Emory University Department of Political Science Visiting Assistant Professor, 2012-13 Stanford University
Sample Statistics 5021 First Midterm Examination with solutions
 THE UNIVERSITY OF MINNESOTA Statistics 5021 February 12, 2003 Sample First Midterm Examination (with solutions) 1. Baseball pitcher Nolan Ryan played in 20 games or more in the 24 seasons from 1968 through
Analyzing Severe Weather Data
 Chapter Weather Patterns and Severe Storms Investigation A Analyzing Severe Weather Data Introduction Tornadoes are violent windstorms associated with severe thunderstorms. Meteorologists carefully monitor
Drought Monitoring Capability of the Oklahoma Mesonet. Gary McManus Oklahoma Climatological Survey Oklahoma Mesonet
 Drought Monitoring Capability of the Oklahoma Mesonet Gary McManus Oklahoma Climatological Survey Oklahoma Mesonet Mesonet History Commissioned in 1994 Atmospheric measurements with 5-minute resolution,
Global Temperature. James Hansen, Makiko Sato, Reto Ruedy, Ken Lo
 Global Temperature James Hansen, Makiko Sato, Reto Ruedy, Ken Lo November 3, 2005 This note responds to recent inquiries about 2005 global temperature, the inquiries stimulated by a 13 October Washington
Swine Enteric Coronavirus Disease (SECD) Situation Report June 30, 2016
 Situation Report June 30, 2016") Animal and Plant Health Inspection Service Veterinary Services Swine Enteric Coronavirus Disease (SECD) Situation Report June 30, 2016 Information current as of 12:00 pm MDT, 06/29/2016 This report provides
Animal and Plant Health Inspection Service Veterinary Services Swine Enteric Coronavirus Disease (SECD) Situation Report June 30, 2016 Information current as of 12:00 pm MDT, 06/29/2016 This report provides
Deriving Historical Temperature and Precipitation Time Series For Alaska Climate Divisions Via Climatologically Aided Interpolation
 Deriving Historical Temperature and Precipitation Time Series For Alaska Climate Divisions Via Climatologically Aided Interpolation Russell S. Vose, Mike Squires, Derek Arndt, Imke Durre, Chris Fenimore,
Measuring Global Temperatures: Satellites or Thermometers?
 Measuring Global Temperatures: Satellites or Thermometers? January 26, 2016 by Dr. Roy Spencer, http://www.cfact.org/2016/01/26/measuring-global-temperatures-satellites-orthermometers/ The University of
Jay Lawrimore NOAA National Climatic Data Center 9 October 2013
 Jay Lawrimore NOAA National Climatic Data Center 9 October 2013 Daily data GHCN-Daily as the GSN Archive Monthly data GHCN-Monthly and CLIMAT messages International Surface Temperature Initiative Global
What Measures Can Be Taken To Improve The Understanding Of Observed Changes?
 What Measures Can Be Taken To Improve The Understanding Of Observed Changes? Convening Lead Author: Roger Pielke Sr. (Colorado State University) Lead Author: David Parker (U.K. Met Office) Lead Author:
Sierra Weather and Climate Update
 Sierra Weather and Climate Update 2014-15 Kelly Redmond Western Regional Climate Center Desert Research Institute Reno Nevada Yosemite Hydroclimate Workshop Yosemite Valley, 2015 October 8-9 Percent of
Champaign-Urbana 2001 Annual Weather Summary
 Champaign-Urbana 2001 Annual Weather Summary ILLINOIS STATE WATER SURVEY 2204 Griffith Dr. Champaign, IL 61820 wxobsrvr@sws.uiuc.edu Maria Peters, Weather Observer January: After a cold and snowy December,
ESTIMATING TEMPERATURE NORMALS FOR USCRN STATIONS
 INTERNATIONAL JOURNAL OF CLIMATOLOGY Int. J. Climatol. 25: 1809 1817 (2005) Published online 7 October 2005 in Wiley InterScience (www.interscience.wiley.com). DOI: 10.1002/joc.1220 ESTIMATING TEMPERATURE
Accepted for publication in Journal of Geophysical Research - Atmospheres. Published 2010 American Geophysical Union. Further reproduction or
 Accepted for publication in Journal of Geophysical Research - Atmospheres. Published 2010 American Geophysical Union. Further reproduction or electronic distribution is not permitted. Not subject to U.S.
Parametric Test. Multiple Linear Regression Spatial Application I: State Homicide Rates Equations taken from Zar, 1984.
 Multiple Linear Regression Spatial Application I: State Homicide Rates Equations taken from Zar, 984. y ˆ = a + b x + b 2 x 2K + b n x n where n is the number of variables Example: In an earlier bivariate
Towards a Bankable Solar Resource
 Towards a Bankable Solar Resource Adam Kankiewicz WindLogics Inc. SOLAR 2010 Phoenix, Arizona May 20, 2010 Outline NextEra/WindLogics Solar Development Lessons learned TMY - Caveat Emptor Discussion 2
Swine Enteric Coronavirus Disease (SECD) Situation Report Sept 17, 2015
 Situation Report Sept 17, 2015") Animal and Plant Health Inspection Service Veterinary Services Swine Enteric Coronavirus Disease (SECD) Situation Report Sept 17, 2015 Information current as of 12:00 pm MDT, 09/16/2015 This report provides
Animal and Plant Health Inspection Service Veterinary Services Swine Enteric Coronavirus Disease (SECD) Situation Report Sept 17, 2015 Information current as of 12:00 pm MDT, 09/16/2015 This report provides
The ISTI: Land surface air temperature datasets for the 21st Century
 The ISTI: Land surface air temperature datasets for the 21st Century WRCP Extremes, Feb 2015 Kate Willett, with thanks to many Initiative participants The real world observing system is not perfect US
Inter-comparison of Historical Sea Surface Temperature Datasets
 Inter-comparison of Historical Sea Surface Temperature Datasets Sayaka Yasunaka 1, Kimio Hanawa 2 1 Center for Climate System Research, University of Tokyo, Japan 2 Graduate School of Science, Tohoku University,
Accepted for publication in Journal of Geophysical Research - Atmospheres. Published 2010 American Geophysical Union. Further reproduction or
 Accepted for publication in Journal of Geophysical Research - Atmospheres. Published 2010 American Geophysical Union. Further reproduction or electronic distribution is not permitted. Not subject to U.S.
Annual Performance Report: State Assessment Data
 Annual Performance Report: 2005-2006 State Assessment Data Summary Prepared by: Martha Thurlow, Jason Altman, Damien Cormier, and Ross Moen National Center on Educational Outcomes (NCEO) April, 2008 The
Description of the Temperature Observation and Averaging Methods Used at the Blue Hill Meteorological Observatory
 Description of the Temperature Observation and Averaging Methods Used at the Blue Hill Meteorological Observatory Michael J. Iacono Blue Hill Meteorological Observatory November 2015 The Blue Hill Meteorological
Observed Climate Variability and Change: Evidence and Issues Related to Uncertainty
 Observed Climate Variability and Change: Evidence and Issues Related to Uncertainty David R. Easterling National Climatic Data Center Asheville, North Carolina Overview Some examples of observed climate
Detecting Climate Change through Means and Extremes
 Detecting Climate Change through Means and Extremes New Mexico Supercomputing Challenge Final Report April 6, 2016 Team 55 Los Alamos Middle School Team Member: Lillian Petersen Teacher: Adam Drew Mentor:
Evolution Strategies for Optimizing Rectangular Cartograms
 Evolution Strategies for Optimizing Rectangular Cartograms Kevin Buchin 1, Bettina Speckmann 1, and Sander Verdonschot 2 1 TU Eindhoven, 2 Carleton University September 20, 2012 Sander Verdonschot (Carleton
Funding provided by NOAA Sectoral Applications Research Project CLIMATE. Basic Climatology Colorado Climate Center
 Funding provided by NOAA Sectoral Applications Research Project CLIMATE Basic Climatology Colorado Climate Center Remember These? Factor 1: Our Energy Source Factor 2: Revolution & Tilt Factor 3: Rotation!
Summary of Natural Hazard Statistics for 2008 in the United States
 Summary of Natural Hazard Statistics for 2008 in the United States This National Weather Service (NWS) report summarizes fatalities, injuries and damages caused by severe weather in 2008. The NWS Office
Global Average Surface Temperature Measurement Uncertainties
 Global Average Surface Temperature Measurement Uncertainties In this era of ever-improving technology and data systems, one would assume that measurements would be constantly improving. This is not the
History of Global Temperature Estimation Köppen to Satellites. Phil Jones CRU, ENV, UEA Norwich
 History of Global Temperature Estimation Köppen to Satellites Phil Jones CRU, ENV, UEA Norwich Summary Land Station Homogeneity Interpolation to Regular Grids Early compilations all land only, until the
C Further Concepts in Statistics
 Appendix C.1 Representing Data and Linear Modeling C1 C Further Concepts in Statistics C.1 Representing Data and Linear Modeling Use stem-and-leaf plots to organize and compare sets of data. Use histograms
An Overview of Atmospheric Analyses and Reanalyses for Climate
 An Overview of Atmospheric Analyses and Reanalyses for Climate Kevin E. Trenberth NCAR Boulder CO Analysis Data Assimilation merges observations & model predictions to provide a superior state estimate.
Maximum and minimum temperature trends for the globe: An update through 2004
 GEOPHYSICAL RESEARCH LETTERS, VOL. 32, L23822, doi:10.1029/2005gl024379, 2005 Maximum and minimum temperature trends for the globe: An update through 2004 Russell S. Vose, David R. Easterling, and Byron
March was 3rd warmest month in satellite record
 April 4, 2016 Vol. 25, No. 12 For Additional Information: Dr. John Christy, (256) 961-7763 john.christy@nsstc.uah.edu Dr. Roy Spencer, (256) 961-7960 roy.spencer@nsstc.uah.edu Global Temperature Report:
Champaign-Urbana 1999 Annual Weather Summary
 Champaign-Urbana 1999 Annual Weather Summary ILLINOIS STATE WATER SURVEY 2204 Griffith Dr. Champaign, IL 61820 wxobsrvr@sws.uiuc.edu Maria Peters, Weather Observer A major snowstorm kicked off the new
Appendix 5 Summary of State Trademark Registration Provisions (as of July 2016)
") Appendix 5 Summary of State Trademark Registration Provisions (as of July 2016) App. 5-1 Registration Renewal Assignments Dates Term # of of 1st # of Use # of Form Serv. Key & State (Years) Fee Spec. Use
Appendix 5 Summary of State Trademark Registration Provisions (as of July 2016) App. 5-1 Registration Renewal Assignments Dates Term # of of 1st # of Use # of Form Serv. Key & State (Years) Fee Spec. Use
ANALYSIS OF CLIMATIC CHANGES IN THE SAN JUAN MOUNTAIN (SJM) REGION DURING THE 20 TH CENTURY. Imtiaz Rangwala
 REGION DURING THE 20 TH CENTURY. Imtiaz Rangwala") ANALYSIS OF CLIMATIC CHANGES IN THE SAN JUAN MOUNTAIN (SJM) REGION DURING THE 20 TH CENTURY Imtiaz Rangwala imtiazr@envsci.rutgers.edu MTNCLIM 2008 1 Objectives (as proposed) Nature of climate change in
ANALYSIS OF CLIMATIC CHANGES IN THE SAN JUAN MOUNTAIN (SJM) REGION DURING THE 20 TH CENTURY Imtiaz Rangwala imtiazr@envsci.rutgers.edu MTNCLIM 2008 1 Objectives (as proposed) Nature of climate change in
Uncertainty in annual rankings from NOAA s global temperature time series
 GEOPHYSICAL RESEARCH LETTERS, VOL. 40, 5965 5969, doi:10.1002/2013gl057999, 2013 Uncertainty in annual rankings from NOAA s global temperature time series Anthony Arguez, 1 Thomas R. Karl, 1 Michael F.
Extreme Weather and Climate Change: the big picture Alan K. Betts Atmospheric Research Pittsford, VT NESC, Saratoga, NY
 Extreme Weather and Climate Change: the big picture Alan K. Betts Atmospheric Research Pittsford, VT http://alanbetts.com NESC, Saratoga, NY March 10, 2018 Increases in Extreme Weather Last decade: lack
TEMPERATURE TREND BIASES IN GRIDDED CLIMATE PRODUCTS AND THE SNOTEL NETWORK ABSTRACT
 TEMPERATURE TREND BIASES IN GRIDDED CLIMATE PRODUCTS AND THE SNOTEL NETWORK Jared W. Oyler 1, Solomon Z. Dobrowski 2, Ashley P. Ballantyne 2, Anna E. Klene 2 and Steven W. Running 2 ABSTRACT In the mountainous
Monthly Long Range Weather Commentary Issued: July 18, 2014 Steven A. Root, CCM, President/CEO
 Monthly Long Range Weather Commentary Issued: July 18, 2014 Steven A. Root, CCM, President/CEO sroot@weatherbank.com JUNE 2014 REVIEW Climate Highlights The Month in Review The average temperature for
Seasonal Climate Watch June to October 2018
 Seasonal Climate Watch June to October 2018 Date issued: May 28, 2018 1. Overview The El Niño-Southern Oscillation (ENSO) has now moved into the neutral phase and is expected to rise towards an El Niño
Climatography of the United States No
 Climate Division: AK 5 NWS Call Sign: ANC Month (1) Min (2) Month(1) Extremes Lowest (2) Temperature ( F) Lowest Month(1) Degree s (1) Base Temp 65 Heating Cooling 90 Number of s (3) Jan 22.2 9.3 15.8
Multiway Analysis of Bridge Structural Types in the National Bridge Inventory (NBI) A Tensor Decomposition Approach
 A Tensor Decomposition Approach") Multiway Analysis of Bridge Structural Types in the National Bridge Inventory (NBI) A Tensor Decomposition Approach By Offei A. Adarkwa Nii Attoh-Okine (Ph.D) (IEEE Big Data Conference -10/27/2014) 1 Presentation
Multiway Analysis of Bridge Structural Types in the National Bridge Inventory (NBI) A Tensor Decomposition Approach By Offei A. Adarkwa Nii Attoh-Okine (Ph.D) (IEEE Big Data Conference -10/27/2014) 1 Presentation
NOTES AND CORRESPONDENCE. Evaluation of Temperature Differences for Paired Stations of the U.S. Climate Reference Network
 15 MAY 2005 N O T E S A N D C O R R E S P O N D E N C E 1629 NOTES AND CORRESPONDENCE Evaluation of Temperature Differences for Paired Stations of the U.S. Climate Reference Network KEVIN P. GALLO* NOAA/NESDIS,
Monthly Long Range Weather Commentary Issued: May 15, 2014 Steven A. Root, CCM, President/CEO
 Monthly Long Range Weather Commentary Issued: May 15, 2014 Steven A. Root, CCM, President/CEO sroot@weatherbank.com APRIL 2014 REVIEW Climate Highlights The Month in Review The average temperature for
Presentation Overview. Southwestern Climate: Past, present and future. Global Energy Balance. What is climate?
 Southwestern Climate: Past, present and future Mike Crimmins Climate Science Extension Specialist Dept. of Soil, Water, & Env. Science & Arizona Cooperative Extension The University of Arizona Presentation
Swine Enteric Coronavirus Disease (SECD) Situation Report Mar 5, 2015
 Situation Report Mar 5, 2015") Animal and Plant Health Inspection Service Veterinary Services Swine Enteric Coronavirus Disease (SECD) Situation Report Mar 5, 2015 Information current as of 12:00 pm MDT, 03/04/2015 This report provides
Animal and Plant Health Inspection Service Veterinary Services Swine Enteric Coronavirus Disease (SECD) Situation Report Mar 5, 2015 Information current as of 12:00 pm MDT, 03/04/2015 This report provides
Early Period Reanalysis of Ocean Winds and Waves
 Early Period Reanalysis of Ocean Winds and Waves Andrew T. Cox and Vincent J. Cardone Oceanweather Inc. Cos Cob, CT Val R. Swail Climate Research Branch, Meteorological Service of Canada Downsview, Ontario,
AIR FORCE RESCUE COORDINATION CENTER
 AIR FORCE RESCUE COORDINATION CENTER 2006 ANNUAL REPORT 1 TABLE OF CONTENTS AFRCC CHARTER & MISSION STATEMENT 3 AFRCC ORGANIZATION 4 TABLE 1 10 YEAR LOOKBACK 5 TABLE 2 ACTIVITY BY MISSION TYPE 6 TABLE
Draft Report. Prepared for: Regional Air Quality Council 1445 Market Street, Suite 260 Denver, Colorado Prepared by:
 Draft Report Evaluation of Preliminary MM5 Meteorological Model Simulation for the June-July 2006 Denver Ozone SIP Modeling Period Focused on Colorado Prepared for: Regional Air Quality Council 1445 Market
ZUMWALT WEATHER AND CLIMATE ANNUAL REPORT ( )
") ZUMWALT WEATHER AND CLIMATE ANNUAL REPORT (26-29) FINAL DRAFT (9 AUGUST 21) J.D. HANSEN 1, R.V. TAYLOR 2, AND V.S. JANSEN 3 INTRODUCTION The Zumwalt Prairie in northeastern Oregon is a unique grassland
ZUMWALT WEATHER AND CLIMATE ANNUAL REPORT (26-29) FINAL DRAFT (9 AUGUST 21) J.D. HANSEN 1, R.V. TAYLOR 2, AND V.S. JANSEN 3 INTRODUCTION The Zumwalt Prairie in northeastern Oregon is a unique grassland
Weather Trends & Climate Normals
 26-28 April 2017 15th Itron Energy Forecasting Conference Presenter: Kristin Larson, Ph. D. Data Scientist Kristin.Larson@stormgeo.com Weather Trends & Climate Normals Our Resources Decision Support for
CLIMATE OF THE ZUMWALT PRAIRIE OF NORTHEASTERN OREGON FROM 1930 TO PRESENT
 CLIMATE OF THE ZUMWALT PRAIRIE OF NORTHEASTERN OREGON FROM 19 TO PRESENT 24 MAY Prepared by J. D. Hansen 1, R.V. Taylor 2, and H. Schmalz 1 Ecologist, Turtle Mt. Environmental Consulting, 652 US Hwy 97,
Uncertainty in Ranking the Hottest Years of U.S. Surface Temperatures
 1SEPTEMBER 2013 G U T T O R P A N D K I M 6323 Uncertainty in Ranking the Hottest Years of U.S. Surface Temperatures PETER GUTTORP University of Washington, Seattle, Washington, and Norwegian Computing
SEPTEMBER 2013 REVIEW
 Monthly Long Range Weather Commentary Issued: October 21, 2013 Steven A. Root, CCM, President/CEO sroot@weatherbank.com SEPTEMBER 2013 REVIEW Climate Highlights The Month in Review The average temperature
What Lies Beneath: A Sub- National Look at Okun s Law for the United States.
 What Lies Beneath: A Sub- National Look at Okun s Law for the United States. Nathalie Gonzalez Prieto International Monetary Fund Global Labor Markets Workshop Paris, September 1-2, 2016 What the paper
STATE OF THE CLIMATE IN 2017
 STATE OF THE CLIMATE IN 2017 Today s Presenters Jeff Rosenfeld Editor-In-Chief, Bulletin of the American Meteorological Society Boston, MA Deke Arndt Chief, Monitoring Branch, NOAA s National Centers for
Weather History on the Bishop Paiute Reservation
 Weather History on the Bishop Paiute Reservation -211 For additional information contact Toni Richards, Air Quality Specialist 76 873 784 toni.richards@bishoppaiute.org Updated 2//214 3:14 PM Weather History
EXST 7015 Fall 2014 Lab 08: Polynomial Regression
 EXST 7015 Fall 2014 Lab 08: Polynomial Regression OBJECTIVES Polynomial regression is a statistical modeling technique to fit the curvilinear data that either shows a maximum or a minimum in the curve,
Global Climates. Name Date
 Global Climates Name Date No investigation of the atmosphere is complete without examining the global distribution of the major atmospheric elements and the impact that humans have on weather and climate.
SAMPLE AUDIT FORMAT. Pre Audit Notification Letter Draft. Dear Registrant:
 Pre Audit Notification Letter Draft Dear Registrant: The Pennsylvania Department of Transportation (PennDOT) is a member of the Federally Mandated International Registration Plan (IRP). As part of this
State of the Climate: Recent Developments
 State of the Climate: Recent Developments Deke Arndt Chief, Climate Monitoring Branch NOAA s National Climatic Data Center 1 Outline Disclaimers, introductions, and other fun! Climate: it s complicated
Richard W. Reynolds * NOAA National Climatic Data Center, Asheville, North Carolina
 8.1 A DAILY BLENDED ANALYSIS FOR SEA SURFACE TEMPERATURE Richard W. Reynolds * NOAA National Climatic Data Center, Asheville, North Carolina Kenneth S. Casey NOAA National Oceanographic Data Center, Silver
Climatography of the United States No
 No. 2 1971-2 Asheville, North Carolina 2881 COOP ID: 46175 Climate Division: CA 6 NWS Call Sign: 3L3 Elevation: 1 Feet Lat: 33 Month (1) Min (2) Month(1) Extremes Lowest (2) Temperature ( F) Lowest Month(1)
Climatography of the United States No
 No. 2 1971-2 Asheville, North Carolina 2881 COOP ID: 42713 Climate Division: CA 7 NWS Call Sign: Elevation: -3 Feet Lat: 32 Month (1) Min (2) Month(1) Extremes Lowest (2) Temperature ( F) Lowest Month(1)
Daily Operations Briefing Tuesday, May 14, 2013 As of 8:30 a.m. EDT
 Daily Operations Briefing Tuesday, May 14, 2013 As of 8:30 a.m. EDT 1 Significant Activity: May 13-14 Significant Events: None Significant Weather: Rain & thunderstorms: Northern Plains to Mid-Atlantic;
HAIDA GWAII CLIMATE ASSESSMENT 2010 Special Report for MIEDS Franc Pridoehl
 HAIDA GWAII CLIMATE ASSESSMENT 2010 Special Report for MIEDS Franc Pridoehl INTRODUCTION Climatic conditions have varied considerably on Haida Gwaii over the past centuries and millennia (Hebda 2007).
Monthly Long Range Weather Commentary Issued: February 15, 2015 Steven A. Root, CCM, President/CEO
 Monthly Long Range Weather Commentary Issued: February 15, 2015 Steven A. Root, CCM, President/CEO sroot@weatherbank.com JANUARY 2015 Climate Highlights The Month in Review During January, the average
Daily Operations Briefing December 25, 2012 As of 6:30 a.m. EST
 Daily Operations Briefing December 25, 2012 As of 6:30 a.m. EST 1 Significant Activity: Dec 24-25 Significant Events: Possible Severe thunderstorms - Gulf Coast Sandy/Nor easter recovery Significant Weather:
Midwest and Great Plains Climate and Drought Update
 Midwest and Great Plains Climate and Drought Update June 20,2013 Laura Edwards Climate Field Specialist Laura.edwards@sdstate.edu 605-626-2870 2012 Board of Regents, South Dakota State University General
Climatography of the United States No
 No. 2 1971-2 Asheville, North Carolina 2881 COOP ID: 46646 Climate Division: CA 4 NWS Call Sign: 8W Month (1) Min (2) Month(1) Extremes Lowest (2) Temperature ( F) Lowest Month(1) Degree s (1) Base Temp
Climatography of the United States No
 No. 2 1971-2 Asheville, North Carolina 2881 COOP ID: 4792 Climate Division: CA 6 NWS Call Sign: Month (1) Min (2) Month(1) Extremes Lowest (2) Temperature ( F) Lowest Month(1) Degree s (1) Base Temp 65
SEASONAL AND ANNUAL TRENDS OF AUSTRALIAN MINIMUM/MAXIMUM DAILY TEMPERATURES DURING
 SEASONAL AND ANNUAL TRENDS OF AUSTRALIAN MINIMUM/MAXIMUM DAILY TEMPERATURES DURING 1856-2014 W. A. van Wijngaarden* and A. Mouraviev Physics Department, York University, Toronto, Ontario, Canada 1. INTRODUCTION
8.1 CHANGES IN CHARACTERISTICS OF UNITED STATES SNOWFALL OVER THE LAST HALF OF THE TWENTIETH CENTURY
 8.1 CHANGES IN CHARACTERISTICS OF UNITED STATES SNOWFALL OVER THE LAST HALF OF THE TWENTIETH CENTURY Daria Scott Dept. of Earth and Atmospheric Sciences St. Could State University, St. Cloud, MN Dale Kaiser*
Changing Hydrology under a Changing Climate for a Coastal Plain Watershed
 Changing Hydrology under a Changing Climate for a Coastal Plain Watershed David Bosch USDA-ARS, Tifton, GA Jeff Arnold ARS Temple, TX and Peter Allen Baylor University, TX SEWRU Objectives 1. Project changes
What is the difference between Weather and Climate?
 What is the difference between Weather and Climate? Objective Many people are confused about the difference between weather and climate. This makes understanding the difference between weather forecasts
Regional Precipitation and ET Patterns: Impacts on Agricultural Water Management
 Regional Precipitation and ET Patterns: Impacts on Agricultural Water Management Christopher H. Hay, PhD, PE Ag. and Biosystems Engineering South Dakota State University 23 November 2010 Photo: USDA-ARS
Lesson Adaptation Activity: Analyzing and Interpreting Data
 Lesson Adaptation Activity: Analyzing and Interpreting Data Related MA STE Framework Standard: 3-ESS2-1. Use graphs and tables of local weather data to describe and predict typical weather during a particular
Atmospheric circulation analysis for seasonal forecasting
 Training Seminar on Application of Seasonal Forecast GPV Data to Seasonal Forecast Products 18 21 January 2011 Tokyo, Japan Atmospheric circulation analysis for seasonal forecasting Shotaro Tanaka Climate
Class business PS is due Wed. Lecture 20 (QPM 2016) Multivariate Regression November 14, / 44
 Multivariate Regression November 14, / 44") Multivariate Regression Prof. Jacob M. Montgomery Quantitative Political Methodology (L32 363) November 14, 2016 Lecture 20 (QPM 2016) Multivariate Regression November 14, 2016 1 / 44 Class business PS
Multivariate Regression Prof. Jacob M. Montgomery Quantitative Political Methodology (L32 363) November 14, 2016 Lecture 20 (QPM 2016) Multivariate Regression November 14, 2016 1 / 44 Class business PS
Climatography of the United States No
 No. 2 1971-2 Asheville, North Carolina 2881 COOP ID: 43417 Climate Division: CA 4 NWS Call Sign: N Lon: 121 Month (1) Min (2) Month(1) Extremes Lowest (2) Temperature ( F) Lowest Month(1) Degree s (1)
Global temperature record reaches one-third century
 Dec. 16, 2011 Vol. 21, No. 7 For Additional Information: Dr. John Christy, (256) 961-7763 john.christy@nsstc.uah.edu Dr. Roy Spencer, (256) 961-7960 roy.spencer@nsstc.uah.edu Global temperature record
Smart Magnets for Smart Product Design: Advanced Topics
 Smart Magnets for Smart Product Design: Advanced Topics Today s Presenter Jason Morgan Vice President Engineering Correlated Magnetics Research 6 Agenda Brief overview of Correlated Magnetics Research
Climatography of the United States No
 No. 2 1971-2 Asheville, North Carolina 2881 COOP ID: 4795 Climate Division: CA 6 NWS Call Sign: SBA Month (1) Min (2) Month(1) Extremes Lowest (2) Temperature ( F) Lowest Month(1) Degree s (1) Base Temp
Seasonal Climate Watch April to August 2018
 Seasonal Climate Watch April to August 2018 Date issued: Mar 23, 2018 1. Overview The El Niño-Southern Oscillation (ENSO) is expected to weaken from a moderate La Niña phase to a neutral phase through
Mingyue Chen 1)* Pingping Xie 2) John E. Janowiak 2) Vernon E. Kousky 2) 1) RS Information Systems, INC. 2) Climate Prediction Center/NCEP/NOAA
* Pingping Xie 2) John E. Janowiak 2) Vernon E. Kousky 2) 1) RS Information Systems, INC. 2) Climate Prediction Center/NCEP/NOAA") J3.9 Orographic Enhancements in Precipitation: Construction of a Global Monthly Precipitation Climatology from Gauge Observations and Satellite Estimates Mingyue Chen 1)* Pingping Xie 2) John E. Janowiak
J3.9 Orographic Enhancements in Precipitation: Construction of a Global Monthly Precipitation Climatology from Gauge Observations and Satellite Estimates Mingyue Chen 1)* Pingping Xie 2) John E. Janowiak
Weather and Climate of the Rogue Valley By Gregory V. Jones, Ph.D., Southern Oregon University
 Weather and Climate of the Rogue Valley By Gregory V. Jones, Ph.D., Southern Oregon University The Rogue Valley region is one of many intermountain valley areas along the west coast of the United States.
Climate Variability. Eric Salathé. Climate Impacts Group & Department of Atmospheric Sciences University of Washington. Thanks to Nathan Mantua
 Climate Variability Eric Salathé Climate Impacts Group & Department of Atmospheric Sciences University of Washington Thanks to Nathan Mantua Northwest Climate: the mean Factors that influence local/regional
Third Grade Math and Science DBQ Weather and Climate/Representing and Interpreting Charts and Data
 Third Grade Math and Science DBQ Weather and Climate/Representing and Interpreting Charts and Data A document based question (DBQ) is an authentic assessment where students interact with content related
Drought and Climate Extremes Indices for the North American Drought Monitor and North America Climate Extremes Monitoring System. Richard R. Heim Jr.
 Drought and Climate Extremes Indices for the North American Drought Monitor and North America Climate Extremes Monitoring System Richard R. Heim Jr. NOAA/NESDIS/National Climatic Data Center Asheville,
On the reliability of the U.S. surface temperature record
 Click Here for Full Article JOURNAL OF GEOPHYSICAL RESEARCH, VOL. 115,, doi:10.1029/2009jd013094, 2010 On the reliability of the U.S. surface temperature record Matthew J. Menne, 1 Claude N. Williams Jr.,
Monthly Long Range Weather Commentary Issued: APRIL 18, 2017 Steven A. Root, CCM, Chief Analytics Officer, Sr. VP,
 Monthly Long Range Weather Commentary Issued: APRIL 18, 2017 Steven A. Root, CCM, Chief Analytics Officer, Sr. VP, sroot@weatherbank.com MARCH 2017 Climate Highlights The Month in Review The average contiguous