Summary of Actual 2008 Regulation
|
|
|
- Brian Hawkins
- 5 years ago
- Views:
Transcription


1 US Army Corps of Engineers Northwestern Division Missouri River Mainstem Reservoir System Summary of Actual 2008 Regulation Missouri River Basin Fort Peck Garrison Oahe Big Bend Gavins Point Ft. Randall U.S. Army Corps of Engineers Northwestern Division Missouri River Basin Water Management Division Omaha, Nebraska April 2009
2 MISSOURI RIVER MAINSTEM RESERVOIRS Summary of Actual 2008 Regulation List of Figures... ii List of Plates... ii List of Tables... iii List of Abbreviations and Acronyms... iv Definition of Terms... vi I. FOREWORD...1 II. REVIEW OF REGULATION FROM JANUARY - DECEMBER A. General...1 B. Precipitation and Water Supply Available in Plains Snowpack Mountain Snowpack Weather Conditions Calendar Year Runoff...14 C. System Regulation System Regulation Fort Peck Regulation Garrison Regulation Oahe and Big Bend Regulation Fort Randall Regulation Gavins Point Regulation...31 D. Non-Routine Regulation and Other Items Pertaining to System Regulation Lawsuits Master Manual Revision Fort Peck Mini-Test and Intrasystem Unbalancing Summary of Drought Impacts...35 E. Reservoir Releases and Storage...36 F. Summary of Results Flood Control Irrigation Water Supply and Water Quality Control Navigation Power Eastern Division, Pick-Sloan Missouri Basin Program (P-S MBP) Fish Management Endangered and Threatened Species Recreation and Resource Management Cultural Resources...62 i
3 LIST OF FIGURES 1 Mountain Snowpack Water Content, Winter Drought Severity Maps Percent Normal Precipitation Maps Annual Runoff above Sioux City, Iowa Monthly Runoff above Sioux City, Iowa A End-of-July Pool Elevations Fort Peck and Garrison B End-of-July Oahe Pool Elevation and Total System Storage Regulated and Unregulated Flows - Sioux City, Nebraska City and St. Joseph A Flood Damages Prevented Indexed to Flood Damages Prevented Original Cost A Total Navigation Tonnage Value 2008 Present Worth B Commercial Navigation Tonnage Value 2008 Present Worth Total Navigation Tonnage Flows at Sioux City, Nebraska City and Kansas City Mainstem Power Generation System Project Visits...64 LIST OF PLATES 1 Missouri River Basin Map 2 Summary of Engineering Data Missouri River Mainstem System 3 Rainfall Radar Image May 23, Rainfall Radar Image June 5, Rainfall Radar Image June 25, Rainfall Radar Image September 13, Rainfall Radar Image September 14, Garrison Dam / Lake Sakakawea Optimal Coldwater Habitat ii
4 LIST OF TABLES Calendar Year Runoff for Selected Reaches Calendar Year 2008 Runoff above Sioux City, IA March 2008 Spring Rise System Releases Fort Peck Inflows, Releases, and Elevations Garrison Inflows, Releases, and Elevations Oahe Inflows, Releases, and Elevations Big Bend Inflows, Releases, and Elevations Fort Randall Inflows, Releases, and Elevations Gavins Point Inflows, Releases, and Elevations Reservoir Levels and Storages July 31, Reservoir Levels and Storages December 31, Water Quality Issues and Concerns Missouri River Tonnage by Commodities Navigation Season Target Flows Missouri River Navigation - Tonnage and Season Length Gross Federal Power System Generation Historical Generation and Load Data - Peaks Historical Generation and Load Data - Total Least Tern Survey Data Piping Plover Survey Data Visitation at System Reservoirs in Visitor Hours...62 iii
5 LIST OF ABBREVIATIONS AND ACRONYMS ACHP Advisory Council on Historic Preservation AOP annual operating plan AF acre-feet B Billion BOR U.S. Bureau of Reclamation cfs cubic feet per second COE Corps of Engineers Council National Council Lewis and Clark Expedition Bicentennial CWA Clean Water Act CY calendar year (January 1 to December 31) EA Environmental Assessment EIS Environmental Impact Statement elev elevation ESA Endangered Species Act of 1973 ft feet ft msl feet above mean sea level FY fiscal year (October 1 to September 30) GIS Geographic Information System GWh gigawatt hour KAF 1,000 acre-feet Kcfs 1,000 cubic feet per second kw kilowatt kwh kilowatt hour M million MAF million acre-feet MRBA Missouri River Basin Association MRNRC Missouri River Natural Resources Committee MRBWM Missouri River Basin Water Management msl mean sea level MV motor vessel MW megawatt MWh megawatt hour M&I municipal and industrial NEPA National Environmental Policy Act OPPD Omaha Public Power District PA 2004 Programmatic Agreement plover piping plover pp powerplant P-S MBP Pick-Sloan Missouri Basin Program RM river mile ROD record of decision Service U.S. Fish and Wildlife Service iv
6 SHPO SRST SR-FTT SWE System tern THPO TMDL TRO tw USBR USGS VERS WCSC Western yr State Historic Preservation Officer Standing Rock Sioux Tribe Steady Release Flow-to-Target snow water equivalent Missouri River Mainstem Reservoir System interior least tern Tribal Historic Preservation Officer Total Maximum Daily Load temporary restraining order tailwater U.S. Bureau of Reclamation United States Geological Survey Visitation Estimation Reporting System Waterborne Commerce Statistics Center Western Area Power Administration year v
7 DEFINITION OF TERMS Acre-foot (AF, ac-ft) is the quantity of water required to cover 1 acre to a depth of 1 foot and is equivalent to 43,560 cubic feet or 325,850 gallons. Cubic foot per second (cfs) is the rate of discharge representing a volume of 1 cubic foot passing a given point during 1 second and is equivalent to approximately 7.48 gallons per second or gallons per minute. The volume of water represented by a flow of 1 cubic foot per second for 24 hours is equivalent to 86,400 cubic feet, approximately acre-feet, or 646,272 gallons. Conversely, 1.5 cfs for 24 hours is approximately 1 million gallons; therefore, 1.5 cfs is approximately 1 million gallons per day (MGD). Discharge is the volume of water (or more broadly, volume of fluid plus suspended sediment) that passes a given point within a given period of time. Drainage area of a stream at a specific location is that area, measured in a horizontal plane, enclosed by a topographic divide from which direct surface runoff from precipitation normally drains by gravity into the river above the specified point. Figures of drainage area given herein include all closed basins, or noncontributing areas, within the area unless otherwise noted. Drainage basin is a part of the surface of the earth that is occupied by drainage system, which consists of a surface stream or body of impounded surface water together with all tributary surface streams and bodies of impounded water. Drought is three or more consecutive years of below-average calendar year runoff into the Missouri River above Sioux City, IA. Gaging station is a particular site on a stream, canal, lake, or reservoir where systematic observations of hydrologic data are obtained. Runoff in inches shows the depth to which the drainage area would be covered if all the runoff for a given time period were uniformly distributed on it. Streamflow is the discharge that occurs in a natural channel. Although the term "discharge" can be applied to the flow of a canal, the word "streamflow" uniquely describes the discharge in a surface stream course. The term "streamflow" is more general than "runoff" as streamflow may be applied to discharge whether or not it is affected by diversion or regulation. vi
8 MISSOURI RIVER MAINSTEM RESERVOIR SYSTEM Summary of Actual 2008 Regulation I. FOREWORD This document contains a summary of the actual regulation of the Missouri River Mainstem Reservoir System (System) for the 2008 Calendar Year (CY). Two other reports related to System regulation are also available, the System Description and Regulation, and Final Annual Operating Plan. All three reports can be obtained by contacting the Missouri River Basin Water Management Division (MRBWM) of the U.S. Army Corps of Engineers Northwestern Division at 1616 Capitol Avenue, Suite 365, Omaha, Nebraska , phone (402) The reports are also available on the MRBWM website at A basin map is presented on Plate 1 and the pertinent data for the Missouri River System is shown on Plate 2. A. General II. REVIEW OF REGULATION JANUARY-DECEMBER 2008 During 2008 the System was regulated in accordance with the Master Water Control Manual (Master Manual) and the applicable provisions of the Final Annual Operating Plan (AOP), which was made available for review and comment by representatives of State and Federal agencies, Tribes, the general public, and specific interest groups. A summary of the significant events during 2008 is given in the following paragraphs. B. Precipitation and Water Supply Available in 2008 Criteria defining drought can vary. For the purposes of this document we will define a drought period as three or more consecutive years of below-average calendar year runoff into the Missouri River above Sioux City, IA. The 2008 runoff year marked the end of the 8-year ( ) drought in the Missouri River basin. Runoff during the 2008 runoff year was 26.4 MAF, 105% of normal. Runoff is discussed in more detail in Section II.B.4 of this report. 1. Plains Snowpack November 2007 began with two weeks of warm dry weather across most of the Missouri River basin. The middle part of the month brought cooler weather and some heavier snow across Montana. A daily-record snowfall of 7.8 inches fell in Great Falls on November 19 and a total of 9.7 inches of snow fell from November A major 1
9 winter storm crossed the nation in late November, but snowfall mostly missed the basin. Snowfall occurred again in early December in the northern portions of the basin. In South Dakota, Aberdeen had a daily-record total of 8.5 inches on December 1. Stormy weather brought snow, sleet, freezing rain, and rain to the basin in mid-december. St. Louis, Missouri reported 6.9 inches of snow on December 15. Topeka, Kansas recorded a daily-record snowfall of 9.0 inches on December 22. January began with mild, dry weather over most of the Plains. A cold front entered the Plains near mid-month. Great Falls, MT set a daily-record snowfall on January 19 (3.5 inches). The cold continued towards the end of the month. From January 20-22, significant snow fell across parts of the northern Plains and the Midwest. In South Dakota, Rapid City set a daily snowfall record for January 20 (3.4 inches). Snow cover was generally less than 2 inches across the majority of the basin at the end of the month. Cooler weather remained through early February. The cold temperatures were followed with snow across the north-central U.S. Daily-record totals reached 3.4 inches in Pierre, SD and 3.3 inches in Valentine, NE on February 11. Snow depth was generally light across most of the basin at the end of February, with only a few scattered areas with more than 4 inches of snow cover. Much-above-normal temperatures returned to parts of the basin in early March. However, some snow did fall with daily-record snowfall for March 4 of 10.0 inches in St. Louis, MO. A band of snow across Nebraska produced a daily-record total of 5.4 inches on March 17 in North Platte. Further north in the basin, record snowfall was being recorded. On March 21, Sisseton, SD (10.7 inches) and Fargo, ND (7.6 inches) noted record daily snowfall amounts. On March 26-27, more than a foot of snow blanketed some spots in Hyde and Sully Counties of central South Dakota. Late-March snow blanketed parts of the Plains and upper Midwest, with 8 inches falling in Chadron, NE on the 31st. Daily-snowfall records for March 31 included 3.5 inches in Pierre, SD. By the end of March, plains snow depth was less than 2 inches across most of the basin, with a few small areas with 4 to 6 inches. In early April, chilly weather, accompanied by snow, prevailed across the northern Plains. Daily-record snowfall totals for April 6 reached 8.0 inches in Mobridge. Days later, the snow turned to rain throughout the basin. By mid-month record warmth prevailed over the western portion of the basin, but was then followed by a large temperature drop and snowfall. Great Falls, MT received 15.1 inches of snow on April Great Falls 9.6-inch snowfall total on April 19 represented its greatest single-day snowfall so late in the year since April 27, 1989, when 10.3 inches fell. Heavy snow developed on April from part of Nebraska into Minnesota, resulting in a lateseason total of 19.0 inches in Watertown, SD. The storm shattered numerous daily snowfall records in South Dakota, including 11.0 inches at Webster and 9.0 inches at Huron at April 25, followed by 17.0 inches at Clear Lake and 10.0 inches at Pickstown on April 26. By late April, most of the snow cover was melted. 2
10 Much heavier snow blanketed the Black Hills of South Dakota towards the end of April and into early May. The unofficial April 30-May 2 total reached 54.5 inches in Lead, 30.0 inches near Spearfish, 28.0 inches in Deadwood, and 13.3 inches in Rapid City. On May 2, Rapid City s 12-inch total eclipsed its single-day snowfall record for May (previously, 10.8 inches on May 7, 1950). Significant storms returned in mid-may. On May 12, Bozeman, MT received a daily-record snowfall of 3.7 inches. By late April, most of the snow cover was melted. Heavy snow also blanketed Riverton, WY where 10.7 inches fell on May 22. Until then, Riverton had never received a daily snowfall in excess of 10 inches after April 22, and had never received more than 7 inches on a single day in May. Although the snow cover was gone, some snow did fall in June. On Montana s high plains, Great Falls received 6.8 inches of snow on June 11. In the last 60 years, the only later measurable snowfall in Great Falls occurred on June 12, 1969, when 5.1 inches fell. 2. Mountain Snowpack a. Fall 2007 In Montana, the mountain snowfall season was quite variable early, but statewide mountain snowpack was near average. December precipitation was 109% of normal. Mountain snow water content was 90% of average and 114% of the previous year. In Wyoming, snow water equivalent (SWE) across the state was slightly below average. The SWE average for the state was 87% of normal. In December, precipitation in the basins ranged from 70% of average to 155% of average. The 2007 year ended with the mountain snowpack 92% of normal in the reach above Fort Peck and 94% of normal in the reach from Fort Peck to Garrison. b. January 2008 In Montana, January mountain precipitation was 105% of average. Normally about 60% of the seasonal snowpack is in place by the end of January. Statewide, mountain snowpack was 103% of average and 130% of the previous year. Generally, the SWE across Wyoming was below average for January. Storms covered Wyoming with snow and the outlook began to improve. The SWE in the northwestern portion of the state was about 98% of normal, and the northeastern portion was 91% of normal. The southeastern area was 100% of normal and the southwestern area was 93% of normal. January s precipitation was quite varied across the state. Basin precipitation ranged from 97% of average to 147% of average. The month of January ended with the mountain snowpack 104% of normal in the reach above Fort Peck and 98% of normal in the reach from Fort Peck to Garrison. 3
11 c. February 2008 In Montana, February mountain precipitation was 129% of normal. Statewide snowpack was 107% of average and 123% of the previous year. Even though overall snowpack was above normal, some localized basins were below average. In Wyoming, SWE amounts across the state were near average for February at 99% of normal. The SWE varied from 99% of normal in the northwestern portion of the state to 107% in southeastern Wyoming. February precipitation was above average across most of Wyoming. The month of February ended with the mountain snowpack 104% of normal in the reach above Fort Peck and 100% of normal in the reach from Fort Peck to Garrison. d. March 2008 In Montana, mountain precipitation during March was 88% of average. Mountain snowpack statewide was 108% of average, and 155% of last year. During March, the SWE across Wyoming was near average at 102% of normal. The SWE in the northwestern portion of the state was about 106% of normal, and the northeastern portion was 108% of normal. The southeast and southwest areas were 105 and 94% of normal, respectively. February precipitation was below average across most of Wyoming. The month of March ended with the mountain snowpack 102% of normal in the reach above Fort Peck and 105% of normal in the reach from Fort Peck to Garrison. e. April 2008 In Montana, mountain precipitation during April was below average, 79% of normal. Cool temperatures delayed the mountain snowmelt. Mountain snowpack was above average at 123% and 179% of the previous year. Generally, the SWE across Wyoming was slightly above average for April, with water content about 108% of average. Across the state SWE was 108% in the northeast, southeast, and southwest portions of the state and 112% in the northwest part of Wyoming. April s precipitation was below average across most of Wyoming. The month of April ended with the mountain snowpack 162% of normal in the reach above Fort Peck and 158% of normal in the reach from Fort Peck to Garrison due mainly to the delayed melting of the snowpack. Snowpack was 69% of the normal April 15 peak in the reach above Fort Peck, and 77% of the normal peak in the reach from Fort Peck to Garrison. 4
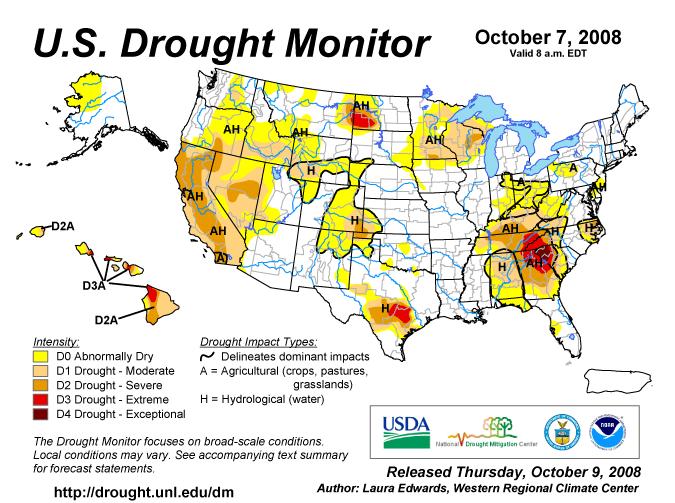
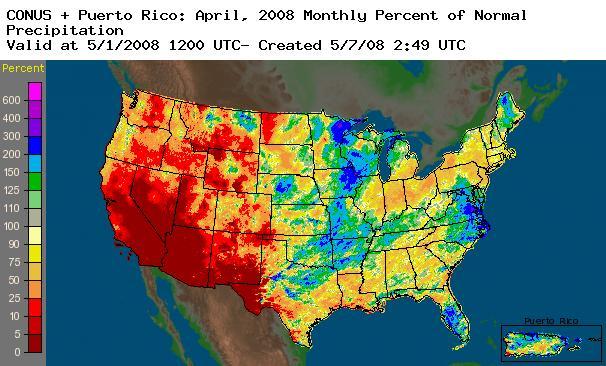
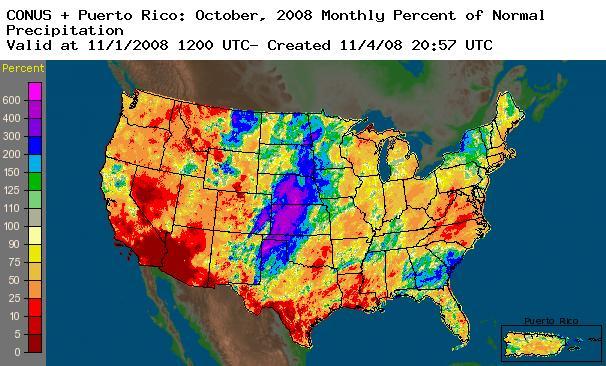
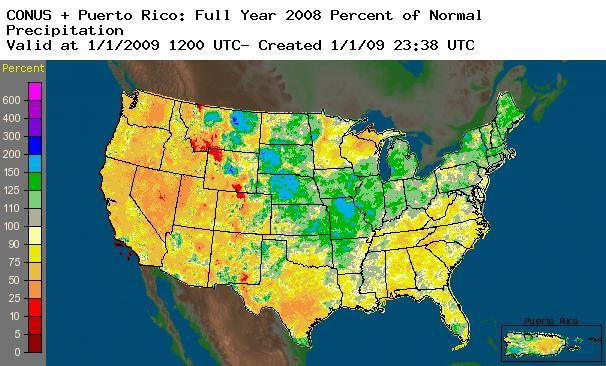
12 f. May 2008 In Montana, May mountain precipitation was 139% of average. Seasonably cool temperatures during most of May slowed the snowmelt. Mountain snowpack ended the month 148% of normal and 374% of the previous year. The SWE across Wyoming was above average at 149%, due in part to a cool spring. The SWE in the northwestern portion of the state was 145% of normal and the northeastern portion was 221% of normal. The southeast and southwest areas were 119 and 111% of normal, respectively. May s precipitation was above average across all of Wyoming. As the month of May ended, the mountain snowpack was 112% of normal in the reach above Fort Peck and 110% of normal in the reach from Fort Peck to Garrison, representing a delayed snowmelt as well as a near normal snowpack. g. Summary Overall snow water content totals recorded during the entire snow season ending July 1, 2008 were above normal. The mountain snowpack in the reach above Fort Peck peaked on April 27 at 111% of the normal peak accumulation. The mountain snowpack in the reach between Fort Peck and Garrison peaked on April 27 at 110% of the normal peak accumulation. The normal date for snow accumulation to peak is April 15. The mountain snow accumulation and melt for the reaches above Fort Peck and Fort Peck to Garrison are illustrated in Figure Weather Conditions The following weather summaries are from the USDA Weekly Weather and Crop Bulletins. Figure 2 displays the drought magnitude and Figure 3 displays percent of normal precipitation experienced by the basin for April, July and October as well as for As shown in Figure 2, the year began with abnormally dry to moderate drought conditions in the large portions of Wyoming, Montana, western South Dakota, western North Dakota. By July, most of the basin had returned to normal conditions; western North Dakota, western Kansas and eastern Colorado remained in abnormally dry to moderate drought conditions. a. January 2008 The year began with mild, dry weather over most of the Plains. On January 4, dailyrecord highs included 55 F in both Billings and Glasgow, MT. On January 6, a dailyrecord high of 73 F was recorded in St. Louis, MO. A cold front entered the Plains near mid-month and temperatures below 0 F were noted on the central High Plains on January 17 and as far south as northern portions of Kansas and Missouri on January 20. The cold continued towards the end of the month. Cold air blanketed much of the nation, holding 5
13 Missouri River Basin Mountain Snowpack Water Content Total Above Fort Peck Total Fort Peck to Garrison Inches of Water Equivalent Inches of Water Equivalent Oct Nov Dec Jan Feb Mar Apr May Jun Jul Aug Sep Oct Nov Dec Jan Feb Mar Apr May Jun Jul Aug Sep Historic Average Computed Average Historical Average Computed Average The mountain snowpack in the reach above Fort Peck peaked at 111% of the normal peak accumulation on April 27. The mountain snowpack in the reach between Fort Peck and Garrison peaked at 110% of the normal peak accumulation on April 27. The Missouri River basin mountain snowpack normally peaks around April 15.
14
15
16 weekly temperatures as much as 20 F below normal across the northern Rockies. Temperatures dipped to 0 F or lower as far south as the northern portions of Kansas and Missouri. Daily record lows were recorded in Chadron, NE (-16 F on January 22) and Yankton, SD (-11 F on January 25). The month of January ended with a brief surge of warmth across the lower portion of the basin while the upper basin remained cold. Harlem, MT reported a maximum temperature of -13 F on January 29. Wind chill temperatures below -50 F were noted at several locations in the Dakotas on January 29: Dickinson, ND (-55 F) and Sand Lake, SD (-53 F). Meanwhile, a daily-record high of 73 F was recorded on the same day at St. Louis, MO. b. February 2008 Cold temperatures maintained through early February across the upper Midwest. Weekly temperatures averaged at least 10 to 15 F below normal. The high temperature for February 10 at Fargo, ND was -12 F. The cold temperatures were followed with snow across the north-central U.S. Daily-record lows for February 20 included -34 F in Devils Lake, ND and -28 F in Watertown, SD. Grand Forks, ND, reported a high of -10 F and a low of -33 F on February 20. Record-high monthly precipitation was record in Springfield, MO (6.41 inches; normal of 2.28 inches) and Vichy-Rolla, MO (4.36 inches; normal of 1.93 inches). c. March 2008 March began with a daily-record high temperature of 80 F being recorded at both McCook, NE and Garden City, KS. Topeka, KS received a daily-record rainfall (1.10 inches) on March 2. Topeka had just completed its wettest winter on record, with a December-February sum of 8.10 inches, 228% of normal. Further north, a daily-record low temperature of -21 F was recorded on March 7 at Jamestown, ND. Only three days later, warm weather entered North Dakota resulting in a daily-record high of 64 F at Bismarck, ND on March 10. On March 17 a daily-record precipitation total of 1.86 inches was recorded at Wichita, KS. Record rainfall was recorded in Missouri on March 18 West Plains (5.69 inches) and Springfield (3.93 inches). Springfield s daily rainfall record for March had stood since 1927, when 3.35 inches fell on March 31. Further north in the basin record snowfall was being recorded. In Missouri, Springfield set a precipitation record for the second consecutive month, following February s 6.41-inch total with a 9.40-inch sum in March. Springfield s 2-month total reached inches, 259% of normal. d. April 2008 Chilly weather prevailed early in the month across the northern Plains. Mobridge, SD posted consecutive daily-record lows (11 and 2 F) on April 6-7. Snow came with this cold weather. A daily-record rainfall amount of 1.93 inches fell in St. Joseph, MO on April 8. April 9-11 rainfall totals reached 5.3 inches in Goodland, KS, 6.6 inches in 9
17 North Platte, NE, and 10.5 inches in Watertown, SD. By mid-month record warmth prevailed over the western portion of the basin. A daily-record high of 80 F was observed on April 13 in Harlem, MT. On the 14 th record highs were observed in Great Falls, MT (79 F) and Helena, MT (78 F). This warmth was followed with a large temperature drop and snowfall. Great Falls, MT received 15.1 inches of snow on April 19-20, followed by temperature lows of -1 and -8 F on April 20 and 21, respectively. Previously, Great Falls latest sub-zero reading occurred on April 6, 1975, with a low of -6 F. Heavy snow developed on April from part of Nebraska into Minnesota. Daily-record lows for April 28 included 16 F in Jamestown, ND and 18 F in Watertown, SD. e. May 2008 Much heavier snow blanketed the Black Hills of South Dakota towards the end of April. On May 3, a daily-record low of 16 F was noted at Laramie, WY, and Alliance, NE. In Colorado, Denver posted its second-lowest temperature on record in May (21 F), behind 19 F on May 3, Significant storms produced daily-record rainfall amounts in Broken Bow, NE (1.55 inches on May 10). On May 11, cold weather returned to the basin producing several daily-record lows, including 23 F in Alliance, NE and 24 F in Bismarck, ND. On May 12, Bozeman, MT received a daily-record snowfall of 3.7 inches. Chilly air returned to the High Plains on May 14, when daily-record lows in Colorado included 30 F in Colorado Springs and 32 F in Pueblo. Cool weather continued into the later part of the month in some parts of the basin. Sub-freezing temperatures were most widespread in the upper Midwest on May 21, when Grand Forks, ND noted a daily-record low (27 F). Heavy snow also blanketed Riverton, WY. Elsewhere in Montana, Billings received rainfall totaling at least 0.70 inch on 4 consecutive days (3.83 inches fell from May 21-24) for the first time on record (previously, 2 days on many occasions, most recently on March 29-30, 2006). Similarly in Wyoming, Sheridan received at least 0.35 inch of rain on 4 consecutive days (3.23 inches fell from May 21-24) for the first time (previously, 3 days on several occasions, most recently in June 1995). Widespread severe thunderstorms gradually shifted from the central High Plains on May to the southern High Plains and the upper Midwest by May 25. In Nebraska, rainfall was especially heavy on May 23, when daily-record totals included 5.13 inches in McCook, 3.29 inches in Kearney, and 2.77 inches in Broken Bow. For McCook, it was also the wettest May day (previously 3.43 inches on May 21, 1969) and calendar day (previously, 4.08 inches on June 26, 1985) on record. See Plate 3 for a 24-hour radar image of the May 23, 2008 precipitation. On May 27, a freeze struck the northern half of North Dakota and neighboring areas, with a dailyrecord low being set in Grand Forks (27 F ) and Minot (23 F ). St. Louis, MO received precipitation totaling inches (187% of normal) during the first 5 months of the year, breaking its January-May 1927 record of inches. With inches of rain, it was the third-wettest May in St. Louis behind inches in 1995 and inches in
18 f. June 2008 Heavy rainfall erupted across the northern Plains and the Midwest in the early days of June. Daily-record totals for June 5 included 4.15 inches in Des Moines, IA and 2.09 inches in Huron, SD. See Plate 4 for a 24-hour radar image of the June 5, 2008 precipitation. Unofficially, 40 inches of snow fell from June at Badger Pass, MT, while 1 to 2 feet blanketed several other locations in western Montana and the mountains of Wyoming. Even on Montana s high plains, Great Falls received snow on June 11. In the last 60 years, the only later measurable snowfall in Great Falls occurred on June 12, 1969, when 5.1 inches fell. This area of the basin recorded daily-record low temperatures at or below the freezing mark including Great Falls, MT (32 F on June 11) and Sheridan, WY (31 F on June 12). Heavy rain overspread the northern Plains at mid-week and returned to the Midwest a day later. On June 11, daily-record rainfall totals reached 2.62 inches in Jamestown, ND, and 2.14 inches in Sisseton, SD. On June 13 a daily-record total of 3.88 inches was observed in Springfield, MO. Just a week later, Springfield recorded another daily-record total (2.11 inches on June 19). The end of the month showed a great variety in temperature readings in the basin. In Nebraska, Hastings (91 F on June 25) experienced its latest date of the year s first 90-degree reading since June 28, Daily-record lows dipped to 38 F on June 28 in Havre, MT. June rainfall record were broken in numerous Midwestern locations, including Springfield, MO (13.41 inches, or 267% of normal; previously inches in 1928). See Plate 5 for a 24-hour radar image of the June 25, g. July 2008 The month began with oppressive heat across portions of the upper basin. Sidney, MT recorded a July 1 high of 97 F. Just a few days later in Montana, Great Falls noted consecutive daily-record lows on July (39 and 40 F). Daily-record lows for July 13 were registered at Casper, WY (37 F) and Alliance, NE (39 F). Heavy rain developed across the Midwest resulting in 4.40 inches of rain in Hastings, NE on July It was the highest 2-day rainfall in Hastings since August 3-4, 1990, when 5.69 inches fell. A record daily-tying low of 46 F was recorded on July 20 at Sheridan, WY. Just a few days later and a few hundred miles east, Imperial, NE posted a daily-record high for July 23 of 106 F. While the western portion of the basin was experiencing large shifts in temperature during this time period, the eastern portion of the basin was experiencing heavy rainfall. Columbia, MO measured a record-setting total for July 22 (3.23 inches). Additional heavy rain triggered flooding, including a record crest on the Chariton River near Prairie Hill, MO (8.27 feet above flood stage on July 27; previously, 8.01 feet above flood stage on May 13, 2002). Columbia, MO recorded a daily-record rainfall on July 28 (1.52 inches). Elsewhere in Missouri, Springfield surpassed its normal annual precipitation of inches by July 26, while St. Louis completed its wettest January- July period on record. Precipitation during the first 7 months of the year totaled inches (166% of normal) in St. Louis, edging its January-July 1898 standard of inches. Further north in the basin, local heavy showers across the Dakotas resulted in a daily-record precipitation total on July 31 at Sisseton, SD of 1.77 inches. 11
19 h. August 2008 The month started with hot weather expanding across much of the nation, concentrating across the Rockies, High Plains and South. Cheyenne, WY noted a monthly record high (98 F on August 1 and 2), previously established with a reading of 96 F on August 6, 1979, and several earlier dates. In Colorado, Denver narrowly missed its all-time-record high of 105 F (104 F on August 1), established on August 8, 1978, and July 20, However, Denver easily set a record for its longest streak of 90 F heat (previously, 18 days from July 1-18, 1874, and July 6-23, 1901). Denver s stretch with high of 90 F or above reached 24 consecutive days (July 13 August 5). Farther north, highs topped 100 F on August 1 as far north as Billings (102 F) and Miles City, MT (104 F). A day later, Imperial, NE edged its monthly record of 110 F, set in 1934 (111 F on August 2). Also in Colorado, Grand Junction set a record for consecutive days at or above 90 F (52 days from June 15 August 5; previously, 51 days in 1901). Missoula, MT set a daily-record high for August 7 (98 F). Despite all the hot weather very heavy rain was also observed in some parts of the basin. A daily-record sum was noted in Cheyenne, WY of 2.02 inches on August 5. Cheyenne s rain, which fell in a 90- minute period, represented its highest single-day total since August 1, 1985, when an astounding 6.06 inches fell. It was also Cheyenne s eighth-wettest day during the last 90 years. Significant rains also soaked parts of the Dakotas, where daily-record totals included 2.05 inches (on August 10) in Watertown, SD, and 3.33 inches (on August 11) in Fargo, ND. In Riverton, WY, rain on August 10 ended a 65-day spell (June 6 August 9) without measurable precipitation. Huron, SD posted a daily-record total for August 14 (1.90 inches), followed by a record in Cheyenne, WY of 2.07 inches on August 15. In Cheyenne, where statistics have been kept since 1871, the second- and third-wettest August days on record occurred on August 5 and 15 (2.02 and 2.07 inches, respectively). Those totals were also Cheyenne s tenth- and twelfth-highest daily totals on record for any time of the year. During these storms, the maximum temperature was very low. Cheyenne, WY noted a daily-record maximum of 49 F on August 15. It was Cheyenne s coldest day since May 27. Further north and a few days later, triple-digit readings were noted in Montana in such locations as Thompson Falls (104 F on August 18) and Glasgow (103 F on August 19). Large temperature fluctuations were noted in the northern portion of the basin during the last part of the month. On August 24, Grand Forks, ND (39 F) posted a daily-record low. Farther west, triple-digit heat was noted in several locations in Montana Miles City and Billings noted daily-record highs of 103 F on August 25. However, by August 30, daily-record highs in North Dakota soared to 101 F in Dickinson and 100 F in Bismarck. i. September 2008 On the northern Plains, daily-record rainfall totals for September 1 included 1.10 inches in Harlem, MT. The following day, record lows for September 2 in Montana dipped to 30 F in both Choteau and Shelby. In Wyoming, Casper posted consecutive daily-record lows of 32 F on September 2-3. By September 4, daily-record lows on the central High Plains included 36 F in Sidney, NE, and 39 F in Pueblo, CO. Sisseton, SD 12
20 noted consecutive daily-record lows of 37 F on September 8 and 9. Other daily-record lows for September 9 included 36 F in Atlantic, IA, and 42 F in St. Joseph, MO. From September 8-10, the effects of Hurricane Ike were felt in the Midwest. Rainfall records associated with Ike s passage through Missouri on September 14 included 4.58 inches in St. Louis and 4.43 inches in Vichy-Rolla. See Plate 6 and Plate 7 for 24-hour radar images of September 13 and 14, 2008, respectively. In Hermann, MO, the Missouri River (10.44 feet above flood stage on September 16) climbed to its ninth-highest level on record and highest level since May 19, By September 20, the year-to-date precipitation in St. Louis climbed to inches (176% of normal), leaving the city just 4.94 inches shy of its 1982 annual record. j. October 2008 Local heavy showers dotted the nation s mid-section during early October. Kearney, NE noted a daily record amount of 3.67 inches on October 5. Grand Forks, ND set a daily-record rainfall for October 11 (1.16 inches). Lander, WY received 29.7 inches of snow from October 10-12, representing its greatest October storm and seventh-highest single-storm total on record. In Montana, Billings measured an October 9-13 storm total of 12.9 inches, while Glasgow set an October snowfall record (13.6 inches from October 11-13). Previously, Glasgow s monthly record for October was 11.5 inches, all of which fell on October 12, Heavy snow fell as far east as western North Dakota, where Williston received 8.4 inches from October Meanwhile on the Plains, North Platte, NE experienced its wettest 3-day period in October (2.95 inches of rain from October 11-13) since 1946, when 3.79 inches fell from October 4-6. Butte, MT dipped to 10 F on October 12 and 13, setting records on both dates. Bismarck, ND finally recorded its first autumn freeze with a low of 27 F on October 14, breaking the record established on October 11, Another storm entered the nation s mid-section in mid-october. October precipitation records were broken in locations such as Hastings, NE (6.16 inches; previously 4.76 inches in 2007), and Dodge City, KS (5.00 inches; previously, 4.94 inches in 1997). Specific daily-record totals for October 22 included 2.31 inches in Kearney, NE, and 2.25 inches in Sioux City, IA. Official snowfall totals for October 23 included 2.0 inches in Goodland, KS, and 1.1 inches in North Platte, NE. On October 26, wind gusts were measured at 66 mph in Pierre, SD and 64 mph in Valentine, NE. k. November 2008 November began with record warmth prevailing across the nation s mid-section. A daily-record high of 79 F was set on November 2 in Rapid City, SD. A few days later, significant precipitation occurred on the northern Plains. Daily-record totals were reached in Rapid City, SD (2.02 inches on November 6) and in Williston, ND (1.51 inches on November 6). Rapid City also received a daily-record snowfall of 9.0 inches on November 6. Elsewhere in western South Dakota, storm-total snowfall amounts of 2 to 4 feet were reported in locations such as Deadwood, Lead, and Silver City. Heavy snow fell as far east as Bismarck, ND where 9.4 inches accumulated on November 6-7. High winds accompanied the storm, with gusts on November 6 measured as high as 64 mph in Ogallala, NE and 63 mph in Goodland, KS. A gust to 77 mph was reported in Rapid City on November 5. November 10 storms resulted in daily-record precipitation 13
21 amounts in Nebraska at Imperial (0.83 inch) and Grand Island (0.80 inch). Imperial s precipitation fell in the form of 10.5 inches of snow. By November 18 record warmth briefly spread over the Plains where daily-record highs included 74 F in Flatwillow, MT; 78 F in Denver, CO; and 79 F in Imperial, NE and Rapid City, SD. In Montana, November 18 highs of 71 F at Helena and 70 F at Townsend represented the stations last observance of a high of 70 F or greater. l. December 2008 The month started with record-setting warmth in the central High Plains. On December 2, McCook set a daily-record high (70 F), while Billings, MT set a dailyrecord snowfall (4.6 inches). A few days later, colder weather entered the Plains resulting in a daily-record low of -5 F in Denver, CO on December 4, just 2 days after reaching 69 F. In North Dakota, December snowfall totals reached 13.8 inches in Williston and 12.4 inches in Bismarck. In Montana, 10.0 inches of snow blanketed Glasgow on December 13, setting a record for any December day (previously, 8.0 inches on December 9, 1906). Glasgow also measured a northeasterly wind gust of 49 mph. On the night of December 13-14, wind gusts in Nebraska were measured as high as 65 mph in Gordon and 61 mph in Broken Bow. By the morning of December 14, daily-record lows were shattered in Montana locations such as Havre (-33 F), Lewistown (-29 F), and Great Falls (-25 F). On December 13-14, Bismarck, ND, noted consecutive daily-record snowfall totals of 5.9 and 6.6 inches, respectively. Watertown, SD, reported a dailyrecord snowfall (6.0 inches) on December 14, which was also its first of 9 consecutive days with a low temperature below 0 F. Lows of -30 F in Havre, MT; -20 F in Buffalo, WY; and -19 F in Denver, CO were among the daily records for December 15. Later in the day, higher temperatures for December 15 struggled to reach -16 F in Williston, ND and Glasgow, MT. Even colder air gripped parts of Montana on December 16, when lows plunged to -39 F in Simpson and -35 F in both Harlem and Chinook. On December 22, Sisseton, SD (-22 F), set a daily-record low as did Ord, NE (-17 F). Ord experienced its coldest day since January 16, 2005, when it was -18 F. An all-time monthly snowfall record was recorded in Bismarck, ND (33.3 inches; previously, 31.1 inches in March 1975) and a December snowfall record was observed in Great Falls, MT (30.5 inches; previously, 25.0 inches in 1945). Further south, St. Louis, MO recorded its wettest year on record (57.96 inches, or 150% of normal; previously inches in 1982) Calendar Year Runoff Runoff for the period January through December 2008 for the basin above Sioux City, Iowa, totaled 26.4 MAF, 105% of normal runoff based on the historical period of , as shown in Table 1. The 26.4 MAF in 2008 represents the first abovenormal runoff since 1999, as shown on Figure 4, and marks the end of the longest drought (8-years from ) since the drought of the 1930 s and early 1940 s (12 years from ). Monthly runoff during 2008 above Sioux City, IA varied from a low of 52% in April to highs of 157% and 155% in June and July, respectively. Figure 5 indicates the monthly variation of runoff for CY
22 Table Calendar Year Runoff for Selected Reaches Average Runoff Volume (in 1000 AF) Reach Calendar Year 2008 Runoff Volume (in 1000 AF) Percent of Average Runoff Above Fort Peck 7,395 6, Fort Peck to Garrison 10,840 10, Garrison to Oahe 2,430 2, Oahe to Fort Randall Fort Randall to Gavins Point 1,675 1, Gavins Point to Sioux City 1,940 3, TOTAL ABOVE SIOUX CITY 25,190 26, Average Runoff Sioux City to Nebraska City* 7,390 11, Nebraska City to Kansas City* 11,610 15, Kansas City to Hermann* 23,610 19, TOTAL BELOW SIOUX CITY* 42,610 46, * Runoff in the reaches from Sioux City to Hermann is not adjusted to 1949 depletion levels. Averages are taken from USGS Water Data Reports for the period The observed monthly runoffs for 2008 from Fort Peck downstream to Sioux City, IA by major river reach are presented in Table 2. The table lists the runoff by month and reach and is the basic compilation of the runoff into the System. This forecast forms a basis for intra-system balancing of storage accumulated in the System and is updated by MRBWM on the first of each month to forecast the runoff for the remainder of the year. The monthly accumulation of actual runoff is shown under the "Accumulated Summation above Sioux City" column. As the season progresses and the actual runoff is accumulated, the forecast becomes more reliable. The majority of the annual runoff has usually occurred by the end of July, and the remainder of the year can be estimated with a greater degree of accuracy. The System storage declined throughout the month of January and early February. The System storage reached its yearly low of 36.4 MAF on February 4. The record low of 33.9 MAF was established on February 8, 2007, almost exactly a year earlier. System releases during February were decreased throughout the month from 13,500 cfs on February 1 to 9,000 cfs on February
23 Table 2 Missouri River Basin Calendar Year 2008 Runoff above Sioux City, IA Reach Fort Garrison Oahe Fort Gavins Sioux Summation Summation Accumulated Above Peck Randall Point City above above Summation Gavins Sioux above Point City Sioux City Values in 1000 Acre Feet JAN NORMAL DEPARTURE % OF NORM 63% 73% -50% -210% 41% 594% 55% 80% 80% FEB ,538 NORMAL ,075 1,815 DEPARTURE % OF NORM 67% 59% 8% 202% 106% 291% 71% 88% 85% MAR ,285 1,734 3,272 NORMAL 610 1, ,625 2,925 4,740 DEPARTURE ,340-1,191-1,468 % OF NORM 64% 45% 21% 25% 127% 150% 49% 59% 69% APR ,111 1,529 4,801 NORMAL 665 1, ,605 2,945 7,685 DEPARTURE ,494-1,416-2,884 % OF NORM 47% 45% 20% 15% 97% 123% 43% 52% 62% MAY ,335 2,856 7,657 NORMAL 1,120 1, ,050 3,325 11,010 DEPARTURE ,353 % OF NORM 77% 65% 97% 75% 115% 189% 77% 86% 70% JUN ,236 3,164 1, ,528 8,500 16,157 NORMAL 1,655 2, ,145 5,415 16,425 DEPARTURE ,383 3, % OF NORM 135% 117% 318% 261% 181% 360% 146% 157% 98% JUL ,155 2, ,647 5,033 21,190 NORMAL 835 1, ,025 3,240 19,665 DEPARTURE 320 1, ,622 1,793 1,525 % OF NORM 138% 159% 222% 128% 92% 180% 154% 155% 108% AUG ,142 22,332 NORMAL ,205 1,335 21,000 DEPARTURE ,332 % OF NORM 71% 85% 151% -13% 83% 132% 81% 86% 106% SEP ,017 23,349 NORMAL ,080 1,175 22,175 DEPARTURE ,174 % OF NORM 74% 88% 99% 8% 117% 107% 85% 87% 105% OCT ,123 1,302 24,651 NORMAL ,125 1,200 23,375 DEPARTURE ,276 % OF NORM 84% 97% 106% 240% 151% 239% 100% 109% 105% NOV ,248 1,355 26,006 NORMAL ,070 24,445 DEPARTURE ,561 % OF NORM 102% 106% 269% 980% 122% 143% 125% 127% 106% DEC ,421 NORMAL ,190 DEPARTURE ,231 % OF NORM 63% 70% 0% -1030% 40% 211% 46% 56% 105% Calendar Year Totals 6,862 10,313 2, ,863 3,855 22,566 26,421 NORMAL 7,395 10,840 2, ,675 1,940 23,250 25,190 DEPARTURE , ,231 % OF NORM 93% 95% 114% 83% 111% 199% 97% 105%
24 Missouri River Basin Annual Runoff above Sioux City, Iowa Million Acre-Feet Historic Drought Periods 2008 = 26.4 MAF 10% 25% 50% 75% 90% Years U.D MAF U.Q MAF MED MAF L.Q MAF L.D MAF
25 Missouri River Basin 2008 Monthly Runoff above Sioux City, Iowa Million Acre-Feet (MAF) Actual Normal Jan Feb Mar Apr May Jun Jul Aug Sep Oct Nov Dec 80% 88% 59% 52% 86% 157% 155% 86% 87% 109% 127% 56% 2008 Runoff : 26.4 MAF - 105% of normal Normal Runoff: 25.2 MAF
26 The March spring pulse from Gavins Point was conducted in The System storage on March 1 was 36.6 MAF, which was 0.1 MAF above the minimum storage level of 36.5 MAF needed to conduct the first March pulse as per the Master Manual. System releases were made as indicated in Table 3. Table 3 March 2008 Spring Rise System Releases Date System Release (cfs) March 24 9,000 March 25 12,000 March 26 13,500 March 27 18,000 March 28 18,000 March 29 17,000 March 30 16,000 March 31 15,500 April 1 15,000 April 2 15,000 April 3 13,500 April 4 12,000 The March 15 System storage was 36.9 MAF, which was above the navigation season preclude level of 31.0 MAF. Per the Master Manual, since the March 15 storage level was between 49.0 and 31.0 MAF, the navigation service level was set at minimum service. The plan for the System releases to support the 2008 navigation season during the threatened and endangered (T&E) tern and plover nesting season is referred to as the Steady Release Flow-to-Target (SR-FTT) plan. The SR-FTT release plan calls for Gavins Point releases to be set at an initial steady rate and then adjusted higher or lower during the nesting season to meet downstream flow targets, if necessary. Depending on where the initial steady release is set, this regulation can provide for more T&E habitat early in the nesting season and saves additional water in the upper three reservoirs, when compared to a Steady Release (SR) plan. The SR-FTT plan also reduces the potential for flooding nests and exceedance of the anticipated incidental take for listed terns and plovers when compared to a Flow-to-Target (FTT) plan. Flow support for the 2008 navigation season began on March 23 at Sioux City, IA; March 25 at Omaha, NE; March 26 at Nebraska City, NE; March 28 at Kansas City, MO; and April 1 at the mouth of the Missouri River near St. Louis, MO. System releases during April ranged from 12,000 to 19,000 cfs. Downstream tributary inflow between Nebraska City and Kansas City was significant towards the beginning of the navigation season. As a water conservation measure, the flow targets at Sioux City (25,000 cfs), Omaha (25,000 cfs), and Nebraska City (31,000 cfs) were not met in late March and early 19
27 April since there was no barge traffic in those reaches. Flow targets at Kansas City (35,000 cfs) were met throughout the navigation season. Starting on April 12, flow targets were met at Omaha and Nebraska City. On April 1 System storage was 37.1 MAF, 1.2 MAF more than the previous year s April 1 System storage. The May 1 System storage was 37.1 MAF, 2.9 MAF less than the required 40.0 MAF necessary to run the May spring pulse from Gavins Point Dam. Early spring rainfall and plains snowmelt produced a March-May runoff of 6.1 MAF above Sioux City, which is 67% of normal. Runoff volumes above Sioux City for June and July were significantly higher than normal: 8.5 (157% of normal) and 5.0 (155% of normal) MAF, respectively. The June-July runoff was a result of mountain snowpack runoff as well as significant rainfall runoff. Mountain snowpack peaked at 111% of normal above Fort Peck and 110% of normal between Fort Peck and Garrison. System storage peaked on August 3 at 45.9 MAF, which is 5.6 MAF higher than the 2007 peak (40.3 MAF on July 4). The end-of-july System storage was 45.8 MAF, 6.5 MAF higher than the 2007 end-of-july storage and 12.5 MAF less than endof-july average (58.3 MAF). System storage began a steady decline through the late summer and then gradually increased during the fall once the navigation season ended. End-of-month storages were: August, 45.0 MAF; September, 44.5 MAF; October, 44.4 MAF; November, 44.8 MAF; and December, 44.0 MAF. The end-of-december System storage was 7.1 MAF more than the previous year and 8.5 MAF less than endof-december average. As per the Master Manual, the July 1 water in storage check resulted in the navigation season being shortened by 30 days from the normal ending date of December 1 at St. Louis, MO. 2. Fort Peck Regulation January to December 2008 a. General Fort Peck, the third largest Corps storage reservoir, serves all authorized purposes. Fort Peck s primary functions are: (1) to capture the snowmelt runoff and localized rainfall runoff from the large drainage area above Fort Peck Dam, which are metered out at controlled release rates to meet the authorized purposes while reducing flood damages in the Fort Peck to Garrison reach; (2) to serve as a secondary storage location for water accumulated in the System from reduced System releases due to major downstream flood control regulation, thus helping to alleviate large pool increases in Garrison, Oahe, and Fort Randall; and (3) to provide the water needed to meet all authorized purposes that draft storage during low-water years. Table 4 lists the average monthly inflows and releases in cfs and the end-of-month (EOM) pool elevation in ft msl for Fort Peck for 2007 and 2008 as well as the averages since the System first filled in
28 b. Winter Season 2008 The Fort Peck reservoir level began 2008 at elevation ft msl, 34.5 feet below the annual flood control zone and at the same elevation for the same day the previous year. The minimum reservoir level occurred on May 21 at ft msl, 2.2 feet higher than the 2007 minimum, which was the record low. c. Winter River and Ice Conditions Below Fort Peck No special release reductions were required to prevent ice-jam flooding downstream of Fort Peck Dam. The average monthly discharges for December 2007, which was a monthly minimum of record, and January and February 2008 were below average. Icecover formation on the Missouri River began on December 5, 2007 when the Missouri River stage rose over 5 feet in the Wolf Point, MT area. The stage at Wolf Point peaked near 6.5 feet on February 14, 2008, which is well below the flood stage of 10.9 feet. The Missouri River at Culbertson, MT peaked on March 23, 2008 at a stage of 8.5 feet, which is well below the flood stage of 19.0 feet. No reports of ice-affected flooding on the Missouri River below Fort Peck Dam were recorded during the 2008 winter season. The Fort Peck reservoir (Fort Peck Lake) froze over on January 12, 2008 and was free of ice on April 16, The 2007 winter s freeze date was also January 12. d. Spring Open Water Season 2008 The releases averaged 6,000 cfs in April, 7,600 cfs in May, and 6,800 cfs in June. Although Garrison was given top priority in 2008 for a rising pool during the forage fish spawn, it was also possible to provide a rising pool in Fort Peck due to sufficient runoff. Releases in May and June were scheduled to provide rising reservoir levels at Fort Peck and Garrison during the fish spawn while still meeting the minimum flow requirements for downstream irrigation. The reservoir elevation rose slowly and steadily during May ( to ft msl) and rose significantly during June ( to ft msl). Average inflows of 11,900 cfs for May were below average (79% of average) while June inflows of 28,400 cfs were significantly above average (150% of average). e. Summer Open Water Season 2008 Summer release rates, which are generally higher than spring releases due to the increased demand for hydropower, were between 6,100 and 7,000 cfs, well below average. The inflows during the summer months were about average for July and slightly below average for August and September. The Fort Peck pool slowly climbed during July ( to ft msl) and then slowly declined during August and September ( to ft msl). f. Fall Open Water Season 2008 Releases were reduced from approximately 7,000 cfs to 4,000 cfs in late September, when irrigation ceased for the season. Releases were maintained near this minimum level 21
29 during October and November and then increased to the winter release rate in December, when power demands increased. Inflows for October and November were about average. The average inflows coupled with minimum releases resulted in the pool elevation slightly rising during these two months ( to ft msl). g. Summary The highest Fort Peck reservoir level during 2008 occurred on December 5 at ft msl. The lowest reservoir level during 2008 occurred on May 21 at ft msl. The average annual inflow of 8,800 cfs during 2008 was 88% of average ( ). The average annual release of 5,900 cfs during 2008 was 63% of average ( ). In 2008, Fort Peck did not rise into the annual flood control and multiple use zone, which extends from to ft msl. Table 4 Fort Peck Inflows, Releases, and Elevations Month Ave Monthly Inflow Ave Monthly Release EOM Elevation (ft msl) (cfs) (cfs) January 4,300 5,600 7,200 5,500 10,100 10, * February 5,100 7,500 8,700 5,400 10,700 11, * March 6,400 9,400 11,900 5,100 6,300 8, * April 5,000 7,500 10,300 6,000 4,200 7, May 11,900 11,900 15,100 7,600 6,800 9, June 28,400 12,800 18,900 6,800 6,100 9, July 12,300 5,800 12,100 6,800 6,700 10, * August 6,800 4,700 7,900 7,000 7,000 10, * September 7,000 5,300 7,800 6,100 5,100 8, October 6,800 5,100 7,300 4,100 4,000 8, November 6,700 4,500* 7,100 4,200 3,900 8, December 4,900 4,500 6,600 5,800 5,300* 9, * monthly minimum of record 3. Garrison Regulation January to December 2008 a. General Garrison, the largest Corps storage reservoir, is another key component in the regulation of the System. Its primary functions are (1) to capture the snowmelt runoff and localized rainfall runoff from the large drainage area between the Fort Peck and Garrison dams, which are metered out at controlled release rates to meet the authorized purposes, while reducing flood damages in the Garrison to Oahe reach, particularly the urban Bismarck area; (2) to serve as a secondary storage location for water accumulated in the System from reduced System releases due to major downstream flood control 22
30 regulation, thus helping to alleviate large pool increases in Oahe and Fort Randall; and (3) to provide water needed to meet all authorized purposes that draft storage during lowwater years. Table 5 lists the average monthly inflows and releases in cfs and the EOM pool elevation in ft msl for Garrison for 2007 and 2008 as well as the averages since the System filled in b. Winter Season 2008 Releases from Garrison were below normal for an eighth consecutive winter season. Garrison began 2008 at ft msl, 3.1 feet higher than the previous year s elevation of ft msl. The ft msl elevation is 26.6 feet below the base of the annual flood control and multiple use zone. The reservoir level declined throughout the winter season to an annual minimum elevation of ft msl on March 16. This elevation was more than 30 feet below the base of the annual flood control and multiple use zone of ft msl. c. Winter River and Ice Conditions Below Garrison The Missouri River in the Bismarck, ND area rose over 3 feet on November 29-30, 2007 during river ice cover formation. The ice-cover conditions were generally continuous from the end of November 2007 through mid-march A few periods of open channel occurred during January and March when the area experienced abovenormal temperatures. Garrison releases were adjusted according to the downstream channel conditions during melt and ice formation periods. The winter peak ice-affected Missouri River stage at Bismarck was 9.6 feet on February 2. This was well below the Bismarck flood stage of 16 feet and the Corps winter freeze-in stage target of 13 feet. The Garrison reservoir (Lake Sakakawea) froze over on December 22, 2007 and was free of ice on April 21, The 2007 winter s freeze date was also December 22 (2006). d. Spring Open Water Season 2008 In 2008, Garrison was given priority during the forage fish spawn in April and May. Starting in late April, Garrison s releases were made in order to maintain a steady-torising Garrison pool level to promote the forage fish spawn in the Garrison reservoir. The Garrison pool level remained fairly level during April due to the incremental runoff between Fort Peck and Garrison and record low System releases. The reservoir level on April 1, the beginning of the navigation season, was ft msl. This elevation was 1.1 feet lower than the level at the start of the 2007 navigation season. The Garrison pool level remained fairly steady through April ( to ft msl) and then rose slightly during May ( to ft msl) and significantly during June ( to ft msl). Average inflows for April of 12,500 cfs (56% of average) and May of 23,900 cfs (84% of average) were below normal. However, inflows for June of 51,300 cfs (113% of average) were above normal. 23
31 e. Summer Open Water Season 2008 During June and July the snowpack runoff caused the Garrison pool to rise. During July the pool rose 6 feet from to ft msl. The pool level remained fairly level during the months of August and September. Releases during the summer months of August (13,900 cfs, 58% of average) and September (12,600 cfs, 61% of average) were significantly below normal. August and September inflows, meanwhile, were about normal. A daily peaking pattern was established at Garrison during the nesting season to protect terns and plovers nesting below the project. See Section II.F.3. of this report regarding modifications made to the intake structure to assist with coldwater fishery habitat in the Garrison reservoir. f. Fall Open Water Season 2008 Fall releases were reduced to the 11,000 cfs range when irrigation ceased for the season in mid-september, followed by higher December releases of around 14,000 cfs to provide hydropower during winter demand increases. g. Lake Audubon / Snake Creek Embankment Lake Sakakawea lake levels have risen considerably since March 2007 when the 43- foot maximum water level difference between Lake Audubon and Lake Sakakawea pool restriction was put into place. The restriction was a result of an underseepage evaluation by the Omaha District. Since that time relief wells have been installed and underseepage issues should not be a factor in future operations of Lake Audubon. In the event the pool difference approaches the 43-foot maximum that was in place in 2007, the Omaha District s Geotechnical Branch will be consulted as to whether or not the 43-foot maximum is still a consideration. Lake Audubon was drawn down to the normal winter level of 1845 ft msl in the fall. h. Summary Buford-Trenton pumping costs totaled $19, for The highest Garrison reservoir level during 2008 occurred on November 7 at ft msl, which was 8.1 feet higher than the 2007 peak. The lowest Garrison reservoir level during 2008 occurred on March 16 at ft msl. The average annual inflow of 19,000 cfs during calendar year 2008 was 85% of average ( ). The average annual release of 13,200 cfs during calendar year 2008 was 62% of average ( ). In 2008, Garrison did not rise into the annual flood control zone, which extends from to ft msl. 24
32 Table 5 Garrison Inflows, Releases, and Elevations Month Ave Monthly Inflow Ave Monthly Release EOM Elevation(ft msl) (cfs) (cfs) January 8,900 13,400 15,300 15,000 15,900 22, * February 9,900* 15,300 18,800 15,300 15,800 24, * March 12,800 21,400 27,000 12,800 14,800 19, * * April 12,500 13,300 22,300 12,500 13,500 19, May 23,900 30,400 28,300 12,900 13,300 21, June 51,300 36,100 45,500 14,300 16,000 22, July 39,500 12,500 32,100 13,600 15,900 24, August 16,000 9,400 18,000 13,900* 16,000 24, September 15,500 9,800 16,500 12,600 11,600 20, October 14,500 10,500 17,300 11,000 10,800 18, November 13,200 10,900 16,000 11,000 10,800 19, December 9,400 8,900 13,800 13,900 14,900 20, * monthly minimum of record 4. Oahe and Big Bend Regulation January to December 2008 a. General Oahe, the second largest Corps storage reservoir, serves all authorized purposes. Oahe s primary functions are (1) to capture snowmelt and localized rainfall runoff from the large drainage area between the Garrison and Oahe Dams, which are metered out at controlled release rates to meet the authorized purposes, while reducing flood damages in the Oahe to Big Bend reach, especially in the urban Pierre and Fort Pierre areas; (2) to serve as a primary storage location for water accumulated in the System from reduced System releases due to major downstream flood control regulation, thus helping to alleviate large reservoir level increases in Big Bend, Fort Randall and Gavins Point; and (3) to provide water needed to meet all authorized purposes that draft storage during low-water years, particularly downstream water supply and navigation. In addition, hourly and daily releases from Big Bend and Oahe fluctuate widely to meet varying power loads. Over the long term, their release rates are geared to back up navigation releases from Fort Randall and Gavins Point in addition to providing storage space to permit a smooth transition in the scheduled annual fall drawdown of Fort Randall. Big Bend, with less than 2 MAF of storage, is primarily used for hydropower production, so releases from Oahe are generally passed directly through Big Bend. Table 6 lists the average monthly inflows and releases in cfs and the EOM pool elevations in ft msl for Oahe for 2007 and 2008 as well as the averages since the System first filled in
33 A settlement agreement was approved in an order of dismissal by the United States District Court, District of South Dakota on August 8, 2003, in the case of Lower Brule Sioux Tribe et al. v. Rumsfeld, et al. (Civil No (D.S.D.)). The agreement provides that the Corps will consult with the Lower Brule Tribe and the Crow Creek Sioux Tribe during any review and revision of the Missouri River Master Water Control Manual. This agreement also provides that the Corps will coordinate the regulation of Big Bend and the water level of Lake Sharpe with the two Tribes to include the following: the Corps will normally strive to maintain an reservoir level at Lake Sharpe between elevation 1419 ft msl and ft msl; when the level of Lake Sharpe drops below elevation 1419 ft msl or exceeds elevation ft msl, the Chief of MRBWM will provide notice to such persons as the Tribes shall designate in writing. When it is anticipated that the water level will drop below 1418 ft msl or rise above 1422 ft msl, or, in the event the water level falls below 1418 ft msl or rises above 1422 ft msl, the Commander, Northwestern Division, or his designee, shall immediately contact the Chairpersons of the Tribes or their designees to notify them of the situation and discuss proposed actions to remedy the situation. During 2008, the Big Bend reservoir level varied in the narrow range between elevations to ft msl. As per the settlement agreement no additional coordination was necessary. Table 7 lists the average monthly inflows and releases in cfs and the EOM pool elevations in ft msl for Big Bend for 2007 and 2008 as well as the averages since the System first filled in b. Winter Season 2008 Flooding in the Pierre-Fort Pierre area, especially at street intersections in the Stoeser Addition, has been a recurring problem since High Oahe releases, coupled with the formation of river ice cover in the LaFrambois Island area, have historically caused water to back up into a storm sewer outlet flooding street intersections. The city of Pierre installed a valve on the Stoeser Addition storm sewer in the fall of 1998 to prevent winter flooding; however, Oahe releases will continue to be constrained at times to prevent flooding at other locations. A study, referred to as the Pierre/Ft. Pierre Flood Mitigation Project, was initiated by the Omaha District in the late 1990 s and finalized approximately 5 to 7 years later. This project involved the purchase or flood-proofing of homes along the Missouri River that may be affected by ice-affected Missouri River flows. Approximately 100 homes were purchased and removed and about 20 were floodproofed. Some home owners chose not to participate in the voluntary project. No flooding problems were experienced in this area during the winter of There were no ice events during this winter season in the Pierre/Fort Pierre area on the Missouri River. The Oahe reservoir (Lake Oahe) froze over on January 24, 2008 and was free of ice on March 27, Big Bend was regulated in the winter season to follow power peaking requirements with hourly releases varying widely. The daily average flow in 2008 varied between 0 26
34 and 30,900 cfs. The Big Bend reservoir (Lake Sharpe) froze over on December 19, 2007 and was free of ice on March 28, c. Spring Open Water Season 2008 Releases from Oahe are generally set lower during weekends than on weekdays. The normal regulation is to maintain Oahe average daily releases above 3,000 cfs to enhance downstream fishing and boating use during the recreation season. During the spring of 2008, no minimum release rate criteria were established for Oahe. Due to the ongoing drought conditions and ensuing low reservoir levels, making large releases during shorter periods of the day rather than a constant lower release maximized power production during the periods of highest demand. Average monthly releases for April (14,700 cfs, 70% of average) and May (10,000 cfs, 46% of average) were less than normal, but considerably higher than the average monthly releases from the previous year. The average monthly inflows for April (13,700 cfs, 52% of average) and May (17,800 cfs, 65% of average) were also less than normal. Table 6 Oahe Inflows, Releases, and Elevations Month Ave Monthly Inflow Ave Monthly Release EOM Elevation (ft msl) (cfs) (cfs) January 14,600 15,600 23,200 13,300 14,900 20, * February 15,400 16,100 27,300 17,100 18,400 18, * March 14,500 19,500 30,500 9,700 8,000* 18, April 13,700 15,200 26,200 14,700 8,600 21, May 17,800 14,100 27,400 10,000 3,700 21, June 34,800 22,000 28,400 3,300* 12,300 24, July 17,000 15,600* 26,800 9,800 19,400 29, August 14,200* 17,900 25,400 18,500 21,100 32, September 14,300 13,500 22,000 10,300 8,100* 28, October 12,200 12,100 20,200 13,800 10,600 23, November 13,700 10,600* 21,100 5,300* 5,400* 22, December 13,300 15,200 20,500 15,100 13,600* 21, * monthly minimum of record In 2008, Garrison was given priority during the forage fish spawn in April and May. With priority given to Garrison, the Oahe pool level declined slightly in April ( to ft msl), but rose almost 2 feet in May ( to ft msl) and almost 8 feet in June ( to feet msl). 27
35 Table 7 Big Bend Inflows, Releases, and Elevations Month Ave Monthly Inflow Ave Monthly Release EOM Elevation (ft msl) (cfs) (cfs) January 12,300 13,800 20,700 12,700 14,500 20, February 16,000 17,200 18,500 15,900 16,800 18, March 9,200 8,200* 19,200 8,800 7,600* 19, April 13,500 7,700 21,500 13,800 7,800 21, May 9,600 3,700 22,100 9,000 3,400 22, June 4,800 11,600 25,200 4,200* 11,600 25, July 9,300 17,300 28,600 9,300 17,600 28, August 16,700 20,000 31,800 15,700 19,000 31, September 9,900 7,100* 28,300 9,500 6,400* 27, October 12,900 10,400 23,600 13,100 9,900 23, November 5,000* 5,100* 23,900 4,400* 4,900* 22, December 13,900 13,100 20,900 13,700 12,300* 20, * monthly minimum of record d. Summer Open Water Season 2008 The Oahe pool level continued to steadily increase through June and July until reaching its peak of ft msl on July 27, 11.1 feet higher than the 2007 peak ( ft msl on June 21). The August 1 elevation was ft msl, 12.5 feet higher than the August 1, 2007 elevation. The September 1 elevation was ft msl, more than 12 feet higher the previous year s September 1 elevation. Oahe summer releases were far below average: July (9,800 cfs, 33% of average), August (18,500 cfs, 57% of average), and September (10,300 cfs, 36% of normal). e. Fall Open Water Season 2008 The Oahe reservoir elevation rose slightly through October and November. Releases were reduced in September to initiate the annual fall drawdown of the Fort Randall reservoir prior to the close of the navigation season. Low Oahe releases were maintained in November to facilitate the Fort Randall drawdown. The average monthly release for November of 5,300 cfs was the minimum average November monthly release of record. f. Summary The highest Oahe reservoir level during 2008 occurred on July 27 at ft msl. The annual minimum pool elevation of ft msl occurred on February 21. This was nearly 10 feet higher than the 2007 minimum elevation of ft msl. The average annual inflow to Oahe of 16,300 cfs was 66% of average ( ). The average 28
36 annual release from Oahe of 11,700 cfs was 50% of average ( ). In 2008, Oahe did not rise into its annual flood control zone, which extends from to ft msl. Big Bend ended the year at ft msl, within the normal regulating range. 5. Fort Randall Regulation January to December 2008 a. General Fort Randall, the fourth largest System reservoir, serves all authorized purposes. Fort Randall s primary functions are: (1) to capture snow and localized rainfall runoffs in the drainage area between the Big Bend and Fort Randall dams, which are metered out at controlled release rates to meet the authorized purposes while reducing flood damages in the Fort Randall reach where several areas have homes and cabins in close proximity to the river; (2) to serve as a primary storage location along with the upstream projects for water accumulated in the System when System releases are reduced due to major downstream flood control regulation, thus helping to alleviate large pool increases in the very small Gavins Point Project; (3) to provide a location to store the water necessary to provide increased winter hydropower energy by allowing an annual fall drawdown of the reservoir to occur with a winter reservoir refilling that is unique to Fort Randall; and (4) to provide water needed to meet all authorized purposes, particularly navigation and downstream water supply, that draft storage during low water years. Table 8 lists the Fort Randall average monthly inflows and releases in cfs and the EOM pool elevation in ft msl for 2007 and 2008 as well as the averages since the System was first filled in b. Winter Season 2008 The Fort Randall winter releases ranged from 4,800 to 14,400 cfs. The Fort Randall reservoir (Lake Francis Case) froze over on January 15, 2008 and was ice free on March 21, c. Spring Open Water Season 2008 Fort Randall March releases were at reduced levels as Gavins Point releases were maintained at the 9,000 cfs open water release rate prior to the start of the navigation season. Releases were adjusted as needed to back up System releases from Gavins Point and to maintain the Gavins Point pool in the desired range. The April releases of 12,000 cfs were 56% of normal and the May releases of 9,900 cfs were 40% of normal. These below-normal releases corresponded with below normal inflows; April inflows of 15,500 cfs were 65% of normal and May inflows of 46% of normal. d. Summer Open Water Season 2008 A daily peaking pattern was established at Fort Randall during the nesting season to provide flexibility to regulate over a range of releases while minimizing impact to birds 29
37 nesting below the project. Fort Randall summer releases were far below average: July (15,600 cfs, 51% of average), August (21,900 cfs, 66% of average), and September (19,600 cfs, 58% of normal). e. Fall Open Water Season 2008 Normal regulation of Fort Randall includes the lowering of the pool level at the end of the navigation season to ft msl, 17.5 feet below the normal summer level, to make room for winter generation releases from the upper reservoirs. Even during a shortened navigation season such as 2008 (30-day shortening), attempts are made to maintain the Fort Randall pool above 1353 ft msl through the Labor Day weekend. However, in late August higher-than-expected releases from Gavins Point of 25,500 cfs, which were backed up with similar releases from Fort Randall, resulted in the Fort Randall pool being at ft msl at the end of the Labor Day weekend. f. Summary The highest Fort Randall reservoir level during 2008 occurred on June 13 at ft msl. The lowest reservoir level during 2008 occurred on October 15 at ft msl. The average annual inflow to Fort Randall of 12,600 cfs was 51% of average ( ). The average annual release from Fort Randall of 12,300 cfs was 50% of average ( ). In 2008, Fort Randall rose into its annual flood control zone, which extends from to ft msl. However, the normal summer regulating pool level at Fort Randall is ft msl. Table 8 Fort Randall Inflows, Releases, and Elevations Month Ave Monthly Inflow Ave Monthly Release EOM Elevation (ft msl) (cfs) (cfs) January 12,900 15,300 22,000 11,800 12,700 15, February 19,000 19,800 20,200 9,300 9,600 13, March 10,700 10,500 21,700 6,600 4,100* 15, April 15,500 8,900 23,800 12,000 6,900 21, May 11,300 5,800 24,700 9,900 7,700* 24, June 10,200* 14,100* 27,600 6,600* 15,500 27, July 10,200 18,200 29,500 15,600 21,100 30, August 17,100 22,200 32,600 21,900 20,400 33, September 9,800 6,400* 28,700 19,600 20,000 33, * October 14,500 11,900 23,100 15,500 11,500 31, November 6,300 3,800* 22,000 6,700 7,900 28, December 13,100* 14,700 21,800 12,700 10,700 17, * monthly minimum of record 30
38 6. Gavins Point Regulation January to December 2008 a. General Gavins Point, the most downstream of the System projects, is primarily used for flow re-regulating to smooth out the release fluctuations of the upper projects to better serve downstream purposes. With a total storage of less than 500,000 acre-feet, it provides only a small amount of flood control and is generally maintained in a narrow reservoir elevation band between and ft msl. Due to the limited storage, releases from Gavins Point must be backed up with releases out of the upper reservoirs. Gavins Point is the key location in the initiation of release reductions for downstream flood control. Even though it has only a small amount of storage space for flood control, this volume is usually adequate to perform significant downstream flood control by coordinating Gavins Point release reductions with the upstream projects. Releases greater than the powerplant capacity, near 35,000 cfs, are passed through the spillway. Table 9 lists the Gavins Point average monthly inflows and releases in cfs and the EOM pool elevation in ft msl for 2007 and 2008 as well as the averages since the System was filled in b. Winter Season 2008 The Gavins Point average daily release was below the normal winter release rate for the entire winter season. The Gavins Point winter releases varied between 10,500 cfs to 14,000 cfs in December; 8,300 cfs to 14,000 cfs in January; and 9,000 cfs and 13,500 cfs in February. The Gavins Point reservoir (Lewis and Clark Lake) froze over on December 10, 2007 and was free of ice on March 6, c. Winter River and Ice Conditions Below Gavins Point The first signs of floating ice on the Missouri River during the 2008 winter season were noted on November 29, 2007 near Sioux City, IA. On December 3, 15 to 40% floating ice with pads ranging from 3 to 10 feet were noted in the Missouri River in the Sioux City to Omaha, NE reach. The volumes of floating ice fluctuated through the rest of December to January 8, 2008, at which time the Missouri River was free of floating ice downstream of Sioux City. When a round of freezing temperatures occurred from January 13-26, large volumes of ice were produced and resulted in the greatest extent of floating ice reported for the winter season. Ice observations noted floating ice from 5 to 80%, with pads ranging from 5 to 30 feet in the Sioux City to Nebraska City, NE reach of the Missouri River. The floating ice diminished from January However, another round of freezing temperatures arrived on January 31 and an ice bridge formed upstream from Sioux City. The Gavins Point release was increased from 12,000 cfs up to 14,000 cfs during this period to offset the loss in downstream flow and also to assist in breaking up the ice bridge. The Missouri River stages dropped as much as 3.5 feet throughout the reach downstream of Sioux City from January The Missouri River stage at Sioux City reached its winter low level of 7.06 feet on January
39 Another round of single degree temperatures arrived on February 10 and produced ice bridging conditions upstream from Ponca, NE. Missouri River stages dropped anywhere from 1 foot to over 1.5 feet in the Ponca, NE to Sioux City reach. The Gavins Point release was increased from the 12,000 cfs to 13,000 cfs on February 7 in anticipation of decreased downstream stages due to ice bridging during this extreme cold period. Starting on February 7, the Missouri River had about 30% floating ice in the Sioux City area of the Missouri River. The reports of floating ice continued until February 28, the last report of floating ice on the Missouri River. The floating ice ranged from 3 to 35% and pans size ranged from 5 to 30 feet. By February 28 only 1% floating ice was reported on the Missouri River between Sioux City and Omaha. d. Spring Open Water Season 2008 The March spring pulse from Gavins Point was conducted in The System storage on March 1 was 36.6 MAF, which was 0.1 MAF above the minimum storage level of 36.5 MAF needed to conduct the first-ever March pulse as per the Master Manual. Flow support for the 2008 navigation season began on March 23 at Sioux City, IA; March 25 at Omaha, NE; March 26 at Nebraska City, NE; March 28 at Kansas City, MO; and April 1 at the mouth of the Missouri River near St. Louis, MO. The March, April and May average monthly releases were all below normal, though not as low as the historic low levels experienced in Average monthly releases of 10,800 cfs for March were 54% of average, 14,800 cfs for April were 59% of average, and 13,100 cfs for May were 46% of average. With large rainfall events in the lower basin in May, System releases were maintained at much lower-than-normal levels, to decrease the risk of downstream flooding. System releases were lowered to 11,000 cfs on May 2 and maintained at that level until May 19. e. Summer Open Water Season 2008 The summer storms in the lower portion of the basin continued into June. Average monthly System releases of 12,000 cfs for June was a monthly historic low, far lower than the previous record of 16,700 cfs set in For a large portion of June the System releases were cycled between 10,000 cfs, the minimum release necessary to meet downstream water supply needs, and 13,000 cfs to in order to discourage endangered species from nesting at lower levels on exposed sand bars. During July the releases were increased to meet downstream navigation targets. However, the average monthly July release of 16,300 cfs was half of the normal monthly July release. During August, releases ranged from 18,000 to 25,500 cfs in order to meet navigation targets. The average monthly August release of 22,800 cfs was 66% of average. 32
40 f. Fall Open Water Season 2008 System releases were maintained in the 16,000 to 25,500 cfs range in September and the first half of October to meet the downstream minimum navigation targets. Releases to support navigation stopped on October 22, 2008, resulting in a 30-day shortening of the navigation season. In 2007, 2006, 2005 and 2004 the navigation season was shortened by 35, 44, 48 and 47 days, respectively. g. Summary The highest Gavins Point reservoir level during 2008 occurred on June 10 at ft msl. The lowest reservoir level during 2008 occurred on April 10 at ft msl. The average annual inflow to Gavins Point of 14,800 cfs, which was also the average annual inflow for 2007, was 54% of average ( ). The average annual release from Gavins Point of 14,600 cfs, which was also the average annual outflow for 2007, was 54% of average ( ). Table 9 Gavins Point Inflows, Releases, and Elevations Month Ave Monthly Inflow Ave Monthly Release EOM Elevation (ft msl) (cfs) (cfs) January 12,500 13,500 17,300 12,500 13,900 17, February 12,200 13,900 16,600 11,800 13,200 17, March 10,300 9,700* 19,800 10,800 10,100* 19, April 15,200 10,300* 25,400 14,800 10,200* 25, May 13,700 10,500* 28,700 13,100 10,600* 28, June 11,200* 17,500 30,200 12,000* 17,700 29, July 16,800 21,500 32,800 16,300 21,100 32, August 23,000 22,300 35,100 22,800 21,500 34, September 21,500 21,100 35,700 20,700 20,900 35, October 18,500 14,800 34,200 18,200 14,500 34, November 9,200 9,500 30,800 9,000 9,100 30, December 13,400 12,500 19,300 13,500 12,700 19, * monthly minimum of record 33
41 D. Non-Routine Regulation and Other Items Pertaining to System Regulation Numerous regulation activities are performed each year that, although at one time may have been considered special, are now considered routine. These include release restrictions from a particular project for a period of time to permit soundings, to facilitate limited construction within or adjacent to the downstream channel, and to pattern releases to facilitate measurements of downstream discharges and water surface profiles. Events that occurred in connection with regulation activities during 2008 that may be considered unusual, or recently have come to the attention of MRBWM, are discussed in the following paragraphs. 1. Lawsuits On March 24, 2008, the State of Missouri filed a complaint in the United States District Court for the Eastern District of Missouri seeking a temporary restraining order (TRO) and preliminary and permanent injunctions to stop the Corps from implementing the March spring pulse. Missouri alleged that implementation of the spring pulse by the Corps violated the 1944 Flood Control Act and the Administrative Procedures Act. Missouri claimed that subordinating flood control to fish and wildlife operations violated the 1944 Flood Control Act since flood control is a dominant purpose of the Flood Control Act. Missouri also claimed that because there is latitude in the Master Manual to change operations, the Corps' failure to do so when there is downstream flooding that endangers life and property is an abuse of discretion under the Administrative Procedures Act. Following a three hour hearing in St. Louis on Tuesday, March 25th, Judge Jean Hamilton denied Missouri s request for a TRO. That same day, immediately following Judge Hamilton s ruling Missouri filed a notice of appeal with the 8th Circuit Court of Appeals and requested the Court issue a TRO to enjoin the Corps' planned increase releases from Gavins Point. Later that day the 8th Circuit denied Missouri s TRO request. Subsequently, the Corps increased releases at Gavins Point to implement the March spring pulse. This pulse increased releases by 5,000 cfs for a two day period. Releases were adjusted from five tributary dams in Missouri and Kansas to eliminate the spring pulse on the Missouri River below Kansas City. A total reduction of 5,100 cfs in releases were made from Milford, Tuttle Creek and Perry dams on the Kansas River tributaries, Clinton Dam on the Wakarusa River, and Smithville Dam on the Little Platte River. 2. Master Manual Revision A summary of the process used in the 2006 revision of the Master Manual to include technical criteria for a Gavins Point spring pulse can be found in the Summary of Actual 2005 Regulation report. A Record of Decision (ROD) revising the Master Manual was signed on February 28,
42 The Corps is committed to monitoring both the physical and biological impacts of the bimodal spring pulse releases, including the response of the pallid sturgeon to the pulses, further evaluation of interior drainage and groundwater concerns, and potential impacts to cultural resources. Within an overall adaptive management strategy, the results of monitoring will be used to develop future modifications to the criteria. If information becomes available through the research, monitoring, and evaluation processes that indicate a change to the spring pulse technical criteria, then the adaptive management process, including any National Environmental Policy Act (NEPA) work required, will be followed to revise the Master Manual. 3. Fort Peck Mini-Test and Intrasystem Unbalancing As described in the AOP, the Fort Peck "mini-test" and the unbalancing of the three large upper reservoirs were not implemented due to low System storage. When System storage recovers sufficiently, the Corps anticipates that both these regulation plans will be implemented. The endangered species modified flow "mini-test," which was designed to monitor the effects of higher spring releases and warmer water released from the Fort Peck spillway, requires a reservoir elevation of approximately 2229 ft msl to avoid unstable flows over the spillway. The "mini-test" was not possible in 2008 because reservoir elevations during May and June ranged from 17 to 27 feet below the spillway crest elevation of 2225 ft msl. The Missouri River Natural Resources Committee (MRNRC) previously has provided recommended guidelines (Table VII, AOP) for unbalancing the upper three reservoirs to benefit reservoir fishery and the endangered terns and plovers. As a result of the continuing drought conditions and low reservoir elevations, the criteria for unbalancing the reservoirs were not met in Summary of Drought Impacts Above normal runoff in 2008 ended the 8-year ( ) drought in the Missouri River basin. During this drought the System storage set a new record low of 33.9 MAF on February 8, 2007, 6.9 MAF below the record low of 40.8 MAF set in the previous drought in January System storage ended 2008 at 44.0 MAF, 7.1 MAF higher than the previous year. Because the bulk of the carryover multiple use storage is in the upper three reservoirs, Fort Peck, Garrison, and Oahe reservoirs have set new record low pool levels during the drought. While the increase in storage during 2008 was an improvement from the past year, impacts of the drought have been felt across the basin. Some of the municipal, rural, industrial, and irrigation water intakes in the reservoirs and along the river reaches have been forced to make modifications to maintain access to the water. Many of the boat ramps have been extended, relocated or closed as the reservoir levels declined. Coldwater habitat in the reservoirs has been dramatically reduced threatening the viability of the coldwater fisheries. Cultural resources, once covered by water, are now exposed and vulnerable to additional erosion and looting. Noxious weeds have become even more problematic as thousands of acres of bare shoreline appear. 35
43 The only authorized purpose that is not adversely impacted by the drought is flood control, which is actually enhanced during drought conditions. The negative impacts of drought will be felt even after runoff returns to normal because of the time that will be required to refill the evacuated storage. Full service project releases to all purposes will not resume until the System storage has recovered to near normal levels, however, as System storage increases, improved service will be provided. Users who rely on the Missouri River need to closely monitor current and forecasted river and reservoir conditions and take necessary steps to ensure they can function through a wide range of river flows and reservoir levels. E. Reservoir Elevations and Storage Reservoir elevations and storage contents of the System reservoirs at the end-of-july 2008 are presented in Table 10 and the same information for end-of-december 2008 is presented as Table 11. The 12-month change columns indicate significant increases in the elevations and storages in the upper 3 large storage reservoirs. Figures 6A and 6B show the end-of-july pool elevations for Fort Peck, Garrison, and Oahe plus total System end-of-july storage for 2006 through Individual tables with the historic maximum, average, and minimum pool elevations for each reservoir are also shown on Figures 6A and 6B. During CY 2008, the upper three reservoirs all had higher July 31 pool levels than All three reservoirs experienced their historical minimum record pool levels during 2005 or On July 31, 2008 Fort Peck Lake was at elevation ft msl, 7.7 feet higher than at the same time in On July 31, 2008 Lake Sakakawea was at elevation ft msl, 8.7 feet higher than at the same time in Lake Oahe was at elevation on July 31, 2008, 12.5 feet higher than at the same time in The storage gain in Oahe was due to the lower-than-normal System releases made from March through June, including record low releases in March, April and May. The lower-than-normal System releases were made to offset downstream flooding in the State of Missouri from rainfall runoff and were sufficient to meet navigation targets in reaches being utilized for commercial navigation. Table 10 Reservoir Levels and Storages July 31, 2008 Reservoir Elevation Water in Storage 1,000 AF Project Elevation 12-Month Above Min. 12-Month Total (ft msl) Change (ft) Level* Change Fort Peck ,568 6,397 +1,226 Garrison ,677 9,697 +2,163 Oahe ,006 9,633 +2,961 Big Bend , Fort Randall ,583 2, Gavins Point *Net usable storage above minimum reservoir levels established for power, recreation, irrigation diversions, and other purposes. 36
44 Table 11 Reservoir Levels and Storages December 31, 2008 Reservoir Elevation Water in Storage 1,000 AF Project Elevation 12-Month Above Min. 12-Month Total (ft msl) Change (ft) Level* Change Fort Peck ,254 6,043 +1,342 Garrison ,457 9,477 +2,309 Oahe ,706 9,333 +2,558 Big Bend , Fort Randall , Gavins Point *Net usable storage above minimum reservoir levels established for power, recreation, irrigation diversions, and other purposes. F. Summary of Results 1. Flood Control Releases during CY 2008 were influenced by continuation of the drought conservation measures to conserve System storage, and the higher than normal downstream runoff. The storage crest was much lower than the base of the annual flood control zone. Mountain snowpack was near normal, and significant spring rains did lessen drought severity in the basin. Based on the near normal snowpack and little plains snow, the expectation was for a below-normal runoff, and water conservation measures were implemented to conserve the remaining storage according to Master Manual criteria. While runoff was above normal for the first time since 1999, System storage is still recovering from the effects of 8 consecutive years of below normal runoff. The estimated total flood damages prevented by all Corps projects in the basin during 2008 exceeded $3.3 billion. The estimated total flood damages prevented by the System during 2008 was $2,877,180,000. The total damages prevented by the System in the Missouri River basin include $219,809,000 in the Omaha District and $2,657,371,000 in the Kansas City District. The unindexed flood damages prevented by the System since construction now totals $21.6 billion, the bulk of which was prevented between 1993 and 1999 (see Figure 8B). Figure 8A indicates the flood damages prevented indexed to Although the System prevents enormous amounts of damage, it is not capable of totally eliminating flooding along the Missouri River. Figure 7 shows the actual regulated Missouri River flows that were experienced at Sioux City, Nebraska City and St. Joseph and the unregulated flows that would have been experienced if the System and tributary reservoirs had not been in regulation. 37
45 Missouri River Carryover & Multiple Use Zone Permanent Daily Project Data Maximum Pool /1975 Average Pool Minimum Pool /2005 Maximum for /06/2008 Minimum for /15/ Elevation in ft msl Garrison Exclusive Flood Control Zone Annual Flood Control & Multiple Use Zone Carryover & Multiple Use Zone Permanent Daily Project Data Maximum Pool /1975 Average Pool Minimum Pool /2007 Maximum for /04/2008 Minimum for /22/ Exclusive Flood Control Zone Annual Flood Control & Multiple Use Zone Fort Peck 2250 Elevation in ft msl End-of-July Pool Elevations
46 System Reservoirs and Total System Storage Daily Project Data Maximum Storage /1975 Average Storage 54.9 Minimum Storage /2007 Maximum for /03/2008 Minimum for /04/2008 Daily Project Data Maximum Pool /1995,06/1996 Average Pool Minimum Pool /2006 Maximum for /26/2008 Minimum for /07/2008
47 Sioux City Regulated and Unregulated Flows Actual Regulated Flow Unregulated Flow Flow in 1000 cfs Aug Sep Oct Nov Dec Jan Feb Mar Apr May Jun Jul Nebraska City Regulated and Unregulated Flows Actual Regulated Flow Unregulated Flow Flow in 1000 cfs Aug Sep Oct Nov Dec Jan Feb Mar Apr May Jun Jul St. Joseph Regulated and Unregulated Flows Actual Regulated Flow Unregulated Flow Flow in 1000 cfs Aug Sep Oct Nov Dec Jan Feb Mar Apr May Jun Jul
48 Missouri River Mainstem Reservoirs Flood Damages Prevented Billion Dollars - Indexed to 2008 $22.4 $11.8 $7.1 $ $0.01 billion 2003 $0.06 billion 2004 $0.00 billion 2005 $0.12 billion 2006 $0.00 billion $2.8 $1.8 $0.05 $2.8 $0.3 $.02 $.2 $0.4 Cost of '93 '94 '95 '96 '97 '98 '99 '00 '01 '07 '08 Total Dams $2.9 $ Billion Dollars - Original Cost $0.01 billion 2003 $0.05 billion 2004 $0.00 billion 2005 $0.11 billion 2006 $0.00 billion $ $4.4 $3.0 $1.2 $5.2 $1.8 $2.9 $2.0 $0.2 $1.2 $0.04 $.01 $.2 $0.4 Cost of '93 '94 '95 '96 '97 '98 '99 '00 '01 '07 '08 Total Dams
49 2. Irrigation Federally developed irrigation projects are not being served directly from System reservoirs. Releases from the reservoirs, however, are being utilized by numerous private irrigators as well as Federally financed projects that take water from the river. About 900 private irrigators pump directly from the reservoir or river reaches. Releases from the reservoirs during 2008 generally met the needs of irrigators, however the reduction of releases from Fort Peck and Garrison in September may have resulted in an earlier than desired end to the irrigation season in those reaches. Also due to the shortening of the navigation season Fort Randall reservoir was drawn down earlier than normal, which impacted irrigation pumping directly from that reservoir. Low reservoir levels and releases have also resulted in additional pumping costs, difficulty in, or in some cases inability to, access the water, and/or the need to dredge in order to maintain access. 3. Water Supply and Water Quality Control Problems at municipal and industrial (M&I) intakes located in the river reaches and System reservoirs are related primarily to intake or river access problems rather than inadequate water supply. In emergency situations, short-term adjustments to protect human health and safety would be considered to keep M&I intakes functioning. Low reservoir levels during the drought contributed to both intake access and water quality problems for intakes on Garrison and Oahe reservoirs, including several Tribal intakes. The Standing Rock Sioux Tribe s (SRST) intake at Fort Yates, ND failed in November 2003, leaving the community without water for several days. The Bureau of Reclamation (USBR) has installed a temporary intake and drilled a well to ensure continued water supply for that community. The USBR has also lowered the intake at Wakpala, SD on the Oahe reservoir. A new intake and wet well located on the south side of the Indian Memorial Recreation Area at Wakpala is currently in the process of being constructed. The new intake will be located in the old river channel. The longterm plan involves the construction of a new water treatment plant south of Kennel, SD. The raw water for this treatment plant will be delivered from the new Wakpala intake. The intake structure and treatment plant will eventually become the primary source of water the entire SRST reservation. The Cheyenne River Sioux Tribe, with assistance from the Corps, relocated their Mni Waste water intake, which serves over 14,000 residents of and near the Cheyenne River Indian Reservation. The new intake was dedicated in The Corps has used its emergency authority to lower the intake at Parshall, ND on Garrison reservoir. Other intakes that have been identified as having problems or potential problems include Mandaree, ND and Twin Buttes, ND on Garrison reservoir. Intake owners today are generally better prepared to handle periods of low water due to adjustments made to intakes or regulations procedures. The intake owners have made various adjustments to their operations to account for low water levels. Some of these adjustments involve using warm water to keep ice formation from building up on intake 42
50 screens, installing new pumps, lowering intakes, installing sediment redirection vanes and ice deflectors, obtaining, or arranging to obtain, alternate sources of water; and cleaning screens more thoroughly and frequently. While these remedial actions were expensive, they have significantly improved the ability of the intakes to operate at lower river stages and reservoir levels. During 2008, the Omaha District conducted long-term, fixed-station ambient monitoring at the System reservoirs and the lower Missouri River. Water quality conditions of the water discharged through each of the System dams was continuously monitored (i.e., hourly data-logging and monthly sampling). Intensive water quality surveys were conducted at Big Bend, Fort Randall and Gavins Point. The Omaha District has identified seven priority water quality issues that have relevance to the System projects. These identified priority issues and their relative ranking are: (1) Determine how regulation of the System dams effects water quality in the impounded reservoir and downstream river. Utilize the CE-QUAL-W2 hydrodynamic and water quality model to facilitate this effort. (2) Evaluate how eutrophication is progressing in the System reservoirs, especially regarding the expansion of anoxic conditions in the hypolimnion during summer stratification. (3) Determine how flow regime, especially the release of water from System projects, affects water quality in the Missouri River. (4) Provide water quality information to support Corps reservoir regulation elements for effective water quality and aquatic habitat management. (5) Provide water quality information and technical support to the States in the development of their Section 303(d) lists and development and implementation of Total Maximum Daily Loads (TMDL) at District projects, including the System projects. (6) Identify existing and potential water quality problems at District projects, and develop and implement appropriate solutions. (7) Evaluate water quality conditions and trends at District projects. Note: Relative ranking of priority in parentheses (1 = highest priority). Table 12 provides a summary of water quality issues and concerns at each of the System projects, based on Omaha District monitoring and a review of current State water quality reports. 43
51 Table 12 Water Quality Issues and Concerns Project Fort Peck Fort Peck Lake Missouri River, Fort Peck Dam to the Milk River Missouri River, Milk River to the Poplar River Missouri River, Poplar River to North Dakota Garrison Lake Sakakawea Missouri River, Garrison Dam to Lake Oahe Oahe Lake Oahe Big Bend Lake Sharpe Fort Randall Lake Francis Case Missouri River, Fort Randall Dam to Lewis and Clark Lake TMDL Considerations* On 303(d) List Impaired Uses Pollutant/Stressor Yes (MT) Yes (MT) Yes (MT) Yes (MT) Yes (ND) Drinking Water Supply Primary Contact Recreation Aquatic Life Cold Water Fishery Aquatic Life Warm Water Fishery Aquatic Life Warm Water Fishery Fish and Other Aquatic Biota Fish Consumption Lead Mercury Aquatic Plants - Native Flow Regime Alteration Alteration of Littoral Vegetation Riparian Degradation Water Temperature Flow Regime Alteration Alteration of Littoral Vegetation Riparian Degradation Water Temperature Flow Regime Alteration Water Temperature Low Dissolved Oxygen Water Temperature Methyl-Mercury TMDL Completed Fish Consumption Advisories Other Potential Water Quality Concerns Advisory in Effect Identified Contamination No Yes Mercury --- No No No No No No No Yes Mercury No Yes Mercury Hypolimnetic dissolved oxygen levels Low dissolved oxygen in Garrison Dam tailwaters (associated with late summer hypolimnetic lake withdrawals) No No No Yes No --- TMDL completed for sediment. A nonpoint source management project is being implemented in the Bad River watershed. No No No No Gavins Point Lewis and Clark Lake Missouri River, Gavins Point Dam to the Big Sioux River Missouri River, Big Sioux River to Platte River Missouri River, Boyer River to Council Bluffs water supply intake Missouri River, Platte River to Kansas No No --- Sedimentation Emergent aquatic vegetation No No Yes (NE) Aquatic Life Dieldrin PCBs No Dieldrin Yes PCBs Summer ambient water temperature (NPDES limitations regarding cooling water discharges) Yes (IA) Drinking Water Arsenic No No Yes (NE, IA) Recreation Aquatic Life E. coli Dieldrin PCBs Yes (E. coli) * Information taken from published state Total Maximum Daily Load (TMDL) 303(d) reports and listings as of December 31, Yes Dieldrin PCBs Summer ambient water temperature (NPDES limitations regarding cooling water discharges)
52 Maintaining coldwater habitat in Garrison reservoir during late summer continues to be a challenge due to the effects of the recent 8-year ( ) drought in the western United States. Due to the drought, the reservoir level dropped considerably and impacted that coldwater habitat in the Garrison reservoir during the summer months. The pool elevation of Garrison reached a point where the reduced hypolimnetic volume of cold water, in concert with the degradation of dissolved oxygen in the deeper water of the reservoir, limited the maintenance of coldwater habitat through the end of the summer, which is referred to as the thermal stratification period. Water temperature and dissolved oxygen levels are primary water quality factors that determine the suitability of water for coldwater aquatic life. The State of North Dakota has defined optimal coldwater fish habitat in the Garrison reservoir as being 15 C and having dissolved oxygen levels 5 mg/l. The measured water temperature and dissolved oxygen concentration depth profiles that were obtained through water quality monitoring conducted at the Garrison reservoir during 2003 through 2008 were used to estimate the volume of water in the reservoir that meets the optimal coldwater habitat conditions defined by the State of North Dakota. Plate 8 shows reservoir and optimal coldwater habitat volumes for 2003 through Optimal coldwater habitat present in the Garrison reservoir during 2008 appears to have been similar to that present in 2003 through The reduction of coldwater habitat in the reservoir is exacerbated by the releases from the Garrison Dam intake structure. Because the invert elevation of the intake portals to the power tunnels (i.e., penstocks) is 2 feet above the reservoir bottom (1672 ft msl), water drawn through the penstocks comes largely from the lower depths of the reservoir. Thus, during the summer thermal stratification period, water is drawn from the coldwater habitat volume of the reservoir. Three water quality management measures were identified for implementation in an effort to preserve the coldwater habitat in the reservoir. These measures, which were first implemented at Garrison in July 2005, included: 1) modification of the dam s intake trash racks, 2) utilization of head gates to restrict the opening to the dam s power tunnels, and 3) modification of the daily flow cycle and minimum flow releases from the dam. The three implemented water quality management measures were targeted at drawing water into the dam from higher elevations within the reservoir. Implementation of the three water quality management measures was continued in 2006, 2007, and Based on water quality monitoring of the water discharged through Garrison Dam, it was estimated that up to 795,000 acre-feet of water meeting optimal coldwater habitat criteria was prevented from being discharged through Garrison and retained in the reservoir due to the implementation of the water quality management measures in This compares to the 380,000, 1,020,000, and 830,000 acre-feet of optimal coldwater habitat that was potentially saved in 2005, 2006, and 2007, respectively. Similar to previous years, implementation of the water quality management measures in 2008 warmed the water that was discharged through Garrison Dam during the summer by 2 to 4 C. Although the water quality management measures were implemented to preserve coldwater habitat in the reservoir, they also had the probable benefit of allowing water 45
53 quality standards criterion established by the State of North Dakota for dissolved oxygen to be met in the Missouri River immediately below Garrison Dam during late summer minimum flow releases. Pool levels in Garrison Reservoir recovered to approximately 1825 ft msl in late July However, as indicated on Plate 8, optimal coldwater habitat did not show a similar recovery. Pool levels in the Garrison reservoir were still near record lows in early June 2008 when the thermocline formed in the reservoir sealing off the hypolimnion (i.e., pools levels recovered after the hypolimnion was established). Thus, the higher pools levels seemingly did not occur early enough to allow for an increased hypolimnetic volume. If higher pool levels are maintained during the summer months in the Garrison reservoir when the hypolimnion forms, optimal coldwater habitat in the reservoir should benefit. The initial application of the CE-QUAL-W2 hydrodynamic and water quality model of the Garrison reservoir, as well as preparation of a final report, was completed by the Omaha District during The initial application of the model showed good success in predicting pool levels, water temperature and dissolved oxygen conditions for the reservoir. The model was utilized to assess the impact of the implemented water quality measures on preserving optimal coldwater habitat. The modeling indicated the implemented measures had a small, but seemingly positive, effect in preserving optimal coldwater habitat. A hypothetical high-level reservoir withdrawal for power production was modeled (i.e., reservoir withdrawal were limited to an elevation of 1775 ft msl, the top of the permanent pool). Based on modeling results, a high-level reservoir withdrawal would significantly increase optimal coldwater habitat in Garrison Reservoir during the summer and increase water temperatures downstream of Garrison. 4. Navigation The first towboat to enter the Missouri River in 2008 was the MV Leslie Ann, owned by Jefferson City River Terminal. The towboat entered the Missouri River from the Mississippi River on March 20, 2008 with six empty barges headed for the Jefferson City River Terminal, MO at River Mile (RM) 143. The first towboat to travel upstream of Kansas City, MO was the MV Claude R, owned by McDonough Marine Service. The MV Claude R load consisted of one barge loaded with $10 million (estimated) of powerplant equipment, such as generators, turbines, and low pressure (LP) casings. The tow arrived on April 29 at the Westin Power Plant (RM 411). There were no tows with a Sioux City, IA destination during The most upstream tow was the MV JA Ward, which arrived at Blair, NE on July 8, 2008 with three empty barges for loading alfalfa pellets at Consolidated Blenders Terminal for shipment to Guntersville, Alabama. The MV JA Ward made five trips to Blair, NE during the 2008 navigation season. Even with the drought ending in 2007, the 2008 navigation season was still impacted with minimum service navigation flow support and a 30-day shortened season. This is because the determination of full or minimum flow support and length of the navigation season is based on System storage. 46
54 The Waterborne Commerce Statistics Center (WCSC) data for 2007 shows total Missouri River tonnage of 6.7 million tons. This includes 6.3 million tons for sand and gravel, 0.1 million tons for waterways materials, and 0.3 million tons for long-haul commercial tonnage. The reduction of total tonnage of about 1.6 million tons compared to 2006 was due to permit restrictions on the sand and gravel mining companies and the reduced construction business demand from recent economic stress. The long haul commercial tonnage increased over 100,000 tons from the 2006 record low (since 1952). Although the Missouri River was operated at minimum service flow support, above average inflow from rainfall provided favorable navigation channel conditions downstream of Kansas City, MO. The largest total tonnage year was 2001, 9.7 million tons. The largest long-haul commercial tonnage year, excluding sand, gravel, and waterway material, occurred in 1977 (3.3 million tons). Tonnages of commodities shipped during 2004 through 2007 are shown in Table 13. Figure 9A shows the value of the commodities since 1960, using 2009 present-worth computations. Figure 9B shows tonnage value of long-haul commercial commodities since The commercial tonnage figure for 2008 is an estimate and will change once final WCSC tabulations are available. Figure 10 shows total navigation tonnage on the Missouri River. Missouri River long-haul commercial tonnage in 2008 is currently estimated to total about 351,000 tons, based on towboat activity and barge counts from the Corps daily boat reports. Table 13 Missouri River Tonnage by Commodities (In Thousands of Tons) Commodity Classification Group Farm Products Corn Wheat Soybeans Misc Farm Product Nonmetallic Minerals Sand/Gravel Misc Nonmetallic Food and Kindred Pulp and Paper Chemicals Fertilizer Other Chemicals Petroleum (including coke) Stone/Clay/Glass Primary Metals Waterway Materials Other Total Commercial Total Long Haul Commercial
55 Navigation season target flows for past years are given in Table 14. Table 15 shows the scheduled lengths of past navigation seasons with total tonnage and ton-miles for each year. The 2008 navigation season was shortened 30 days in accordance with the Master Manual. Figure 11 presents discharge data at Sioux City, IA; Nebraska City, NE; and Kansas City, MO for the August 2007 through December 2008 period. The three graphs demonstrate that actual flows at these locations are influenced considerably by System releases. Tributaries between Gavins Point and Kansas City provided much inflow during the navigation season. Supplemental Missouri River navigation support was provided by releases from Kansas River reservoir projects from September 3 to October 25. The releases were fairly well distributed between the three projects: Tuttle Creek (50%), Milford (25%), and Perry (25%). Refer to Section II.C. of this report for further discussion on System releases during the 2008 navigation season. 5. Power-Eastern Division, Pick-Sloan Missouri Basin Program (P-S MBP) The energy generated in 2008 was transmitted over a Federal transmission system that traverses 7,745 circuit miles. This past year, service was provided to 360 customers. Customers in a 6-state area receiving direct service include 194 municipalities, 2 Federal agencies, 33 state agencies, 28 BOR projects, 5 irrigation districts, 36 rural electric cooperatives, 7 public utility districts, 30 private utilities, 27 Native American Services, and 1 inter-project sale. Additional benefits were provided by the interconnections to the Southwestern and Bonneville Power Administrations and other areas of the Western Area Power Administration (Western). Statistics from the Omaha Public Power District (OPPD) show that the average customer uses approximately 11,000 kilowatt hours (kwh) of energy annually. Based upon the total System generation of 4.9 billion kwh, the energy generated in CY 2008 by this portion of the Federal power system could have supplied all of the yearly needs of about 445,000 residential OPPD customers. In addition to the clean, renewable energy transmitted to the Midwest area, the hydropower system provides an added measure of stability to the regional power system with the ability to meet full load in 5 seconds or less. Large coal-fired and nuclear units are reinforced by idle hydropower units, typically in 30 seconds. Outside utilities can have access to the hydropower capability within several minutes of a known problem. The excellent reliability of the hydropower system is indicated by having to maintain a 10% reserve, while thermal power must maintain a 15% reserve. Although the Federal hydropower system that serves the Missouri River region accounts for only 9% of the region's energy, it is large enough to fill gaps and provide a positive benefit to the integrated system. 48
56 Commercial Waterway Materials Sand and Gravel Estimated Power Plant Million Dollars Missouri River Total Navigation Tonnage Value Present Worth Years Commercial Navigation Tonnage Value Present Worth All Others Primary Metals Stone, Clay, Cem Petro & Coke Chemicals Food & Kindred Non-Metallic Farm Products Estimated Power Plant 1000 Million Dollars Years Commercial Value Excludes Sand, Gravel & Waterway Materials Updated Using 2007 Final Tonnage
57 Million Tons Missouri River Total Navigation Tonnage Commercial Waterway Materials Sand and Gravel Estimated Data Updated Using 2007 Final Tonnage Years
58 Table 14 Navigation Season Target Flows in 1,000 cfs Year Months Sioux City Omaha Nebraska City Kansas City 1967 Apr-Jun Jul-Nov Apr-Nov Apr-Jun(1) Jul(1) Aug-Sep(1) Oct-Nov(1) Apr-May May-Sep(1) Oct-Nov(1) Apr-May(1) May-Nov(1) Apr-Nov(1) Apr-Nov Apr May-Nov(1) Apr-Jul(1) Aug-Dec(1) Apr-Nov Apr May-Jul(1) Aug-Nov(1) Apr-Jul(1) Aug-Nov(1) Apr-Nov Apr-Nov(2) Apr-Sep Oct Nov-Dec(1) Apr-Jun Jul Aug-Nov(1) Apr-Jun Jul-Dec(1) Apr-Dec Apr(1) May-Dec(1) Apr-Nov Apr-Nov(2) Apr-Aug(3) Sep-Oct(3) Apr-Oct(4) Apr-Dec Apr-May Jun-Dec(1) Apr(1) May(1) Jun-Dec(1) Apr-Dec(5) * * * * 1998 Apr-Dec(5) Apr-Dec(1) Apr-Jun Jul-Dec(3) Apr-Dec(3) Apr-Jun(3) Jul-Dec(3) Apr-Nov(4) Apr-Oct(6) (1) Downstream flow targets above full-service navigation level as a flood control storage evacuation measure. (2) Full service flows provided for shortened season. (3) Navigation targets below full service as a water conservation measure. (4) Navigation targets at minimum service as a water conservation measure. (5) Releases determined by flood control storage evacuation critiera and not adjusted to meet specific navigation targets. (6) Minimum service targets at Sioux City and Omaha not met during periods when there was no navigation in those reaches.
59 Table 15 Missouri River Navigation Tonnage and Season Length Scheduled Length Total of Season Commercial Traffic Total Traffic Year (Months) (Tons) (1) (Tons) (2) (1000 Ton-Miles) (2) 1967 (3) 8 2,562,657 6,659,219 1,179, (4) 2,254,489 6,724,562 1,047, (4) 2,123,152 7,001,107 1,053, (5) 2,462,935 7,519,251 1,190, (4) 2,791,929 7,483,708 1,329, (4) 2,665,579 7,182,841 1,280, ,817,471 6,370, , ,576,018 7,673,084 1,227, (4) 2,317,321 6,208,426 1,105, (4) 3,111,376 6,552,949 1,535, ,335,780 6,734,850 1,596, (4) 3,202,822 7,929,184 1,528, (4) 3,145,902 7,684,738 1,518, ,909,279 5,914,775 1,335, /4 (6) 2,466,619 5,251,952 1,130, (4) 2,513,166 4,880,527 1,131, (4) 2,925,384 6,301,465 1,300, (4) 2,878,720 6,386,205 1,338, (4) (7) 2,606,461 6,471,418 1,201, (4) (7) 2,343,899 6,990,778 1,044, ,405,212 6,735,968 1,057, /2 2,156,387 6,680, , /4 1,906,508 5,352, , /4 1,329,000 5,841, , /4 1,563,000 5,729, , /4 1,403,000 5,783, , (8) 1,570,000 5,631, , ,800,000 8,501, , (4) 1,439,000 6,884, , (4) 1,547,000 8,165, , (4) 1,651,000 8,172, , (4) 1,735,000 8,379, , (4) 1,576,000 9,252, , ,344,000 8,733, , ,288,000 9,732, , (9) 1,009,000 8,266, , (10) 667,000 8,050, , /2 (11) 525,498 8,192, , /2 (11) 284,641 7,935, , /2 (11) 195,290 8,295,226 84, /4 (11) 302,769 6,684, , /4 (11) 351,000 (12) 7,401,000 (12) 150,000 (12) (1) Includes commercial tonnage except for sand and gravel or waterway materials. Tonnage compiled by Waterborne Commerce Statistics Center (WCSC). (2) Includes commodities; sand, gravel, and crushed rock; and waterway improvement materials. Tonnage by WCSC. (3) Mainstem Reservoir System first reached normal operating storage level in (4) 10-day extension of season provided. (5) 10-day extension and 10-day early opening provided. (6) Full service flows for shortened season in preference to reduced service. (7) 10-day extension provided for 1985 season in trade for 10-day delayed support of 1986 season. (8) Lower Missouri River closed: 57 days in 1993, 20 days in 1995, and 18 days in (9) To protect endangered shore birds below Gavins Point Dam, the Corps did not support navigation from July 3 to August 14, Average days towing industry off the river was 23 days. (10) 6-day shortening of season to follow CWCP. From Aug 11 to Sep 1 Corps did not support navigation flows to comply with lawsuit to follow 2000 Biological Opinion. Navigation industry left the river during this period. (11) Season shortening; 47-days, 2004; 48-days, 2005; 44-days, 2006; 35-days, 2007; 30-days, 2008 (12) Estimated using boat report barge counts.
60 Missouri River Flows at Sioux City, Nebraska City and Kansas City Flow in 1000 cfs Aug Sep Oct Nov Dec Jan Feb Mar Apr May Jun Jul Aug Sep Oct Nov Dec Flow in 1000 cfs Aug Sep Oct Nov Dec Jan Feb Mar Apr May Jun Jul Aug Sep Oct Nov Dec Flow in 1000 cfs Sioux City Minimum Service to Navigation - 25,000 cfs Nebraska City Minimum Service to Navigation - 31,000 cfs Kansas City Minimum Service to Navigation - 35,000 cfs Aug Sep Oct Nov Dec Jan Feb Mar Apr May Jun Jul Aug Sep Oct Nov Dec
61 Generation in 2008 of 4.9 billion kwh, a record low, was 52% of average since the System first filled in The total generation for 2008 was 4,912,302 MWh, just 7,307 MWh less than the previous low 4,919,609 MWh, set in Energy generation was below normal due to lower than normal pool levels, below normal runoff, and belownormal releases at all powerplants. Western purchased about 5.7 billion kwh between January 1, 2008 and December 31, 2008, at a cost of $311.3 million to supplement System hydropower production. System generation with individual project distribution for each calendar year since 1954 is shown on Figure 12. The gross generation from the Federal system (peak capacity and energy sales) for 2008 is shown in Table 16. The tabulations in Table 17 and Table 18 summarize the total gross generation and power regulation for the Eastern Division, P-S MBP marketing area system for the past operating year. Actual settlement figures at the end of the billing periods differ somewhat from the calendar month figures shown. Table 16 Gross Federal Power System Generation January 2008 through December 2008 Energy Generation Peak Hour 1,000 kwh kwh Generation Date Corps Power Plants Mainstem Fort Peck 607, , Jun Garrison 1,270, , Jun Oahe 1,146, , Dec Big Bend 475, ,000 7 Mar Fort Randall 922, , Aug Gavins Point 490,034 93, Aug-2 Sep Corps Subtotal 4,912,302 1,600, Aug USBR Powerplants Canyon Ferry 336,806 57,000 Jun Yellowtail* 381, ,500 Jun USBR Subtotal 718,518 Federal System Total 5,630,820 * Includes only half of total Yellowtail generation, which is marketed by the Eastern Division, P-S MBP. 54
62 POWER GENERATION Mainstem Power Generation Million MWh TOTAL POWER GENERATION BY THE MAINSTEM DAMS SINCE 1943 IS BILLION KWS Years Fort Peck Garrison Oahe Big Bend Ft. Randall Gavins Point
63 Table 17 Historical Generation and Load Data - Peaks Eastern Division, Pick-Sloan Missouri River Program* Data at plant - 1,000 kw January 1, 2008 through December 31, 2008 Corps of Engineers USBR Federal Interchange Peak Hourly Hourly Hour and Total Generation (plus) Generation (equals) Generation (plus) Purchases (equals) System Peak Peak Period (Gross)** (Gross)** (Gross)** Received** Load Date Hour January 1, , , Jan 19:00 February ,002 1,009 2, Feb 8:00 March 1, , ,913 7-Mar 8:00 April 1, , , Apr 9:00 May , May 17:00 June , Jun 17:00 July , , Jul 18:00 August 1, , ,157 6-Aug 17:00 September 1, , , Sep 18:00 October , , Oct 20:00 November ,150 1, Nov 19:00 December 1, , , Dec 20:00 * This tabulation summarizes the total gross generation and power operations for the Eastern Division marketing area system shown on Table 16. ** During hour of peak total system load Scheduled Corps of Interchange Engineers USBR Federal and Total Generation (plus) Generation (equals) Generation (plus) Purchases (equals) System Period (Gross) (Gross) (Gross) Received Load January 425,430 38, , ,665 1,068,407 February 424,205 37, , , ,780 March 325,941 41, , , ,466 April 423,599 39, , , ,494 May 377,650 52, , , ,857 June 286, , , , ,968 July 444,917 85, , , ,888 August 601,809 59, , ,403 1,035,477 September 449,207 53, , , ,595 October 438,159 56, , , ,222 November 249,630 55, , , ,991 December 465,326 56, , ,133 1,153,330 *Powerplants from Table 16 Table 18 Historical Generation and Load Data - Total Eastern Division, Pick-Sloan Missouri Basin Program* Data at plant - 1,000 kwh January 1, 2008 through December 31, 2008
64 6. Fish Management Rainbow smelt are the primary forage species in both Garrison and Oahe. Successful rainbow smelt reproduction is dependent on many factors including stable reservoir levels during the smelt spawning period, generally in April and early May. Most eggs are laid in water less than 1-foot deep and are subject to desiccation through wave action and slight drops in water level. In the Fort Peck reservoir, a forage fish spawn normally occurs between April 15 and May 30. As per the AOP, if runoff was not sufficient to keep all pool levels rising during the fish spawn in 2008, the Corps would, to the extent reasonably possible, set releases to result in a steady-to-rising pool level in Lake Sakakawea in April and May. Low runoff in the Plains resulted in the pool dropping slightly during the primary smelt spawn. However beginning in early May, Fort Peck, Garrison, and Oahe reservoirs rose as the mountain snowmelt progressed. The state of North Dakota larval trawls continue to document record low levels of rainbow smelt reproduction. The lack of success is attributed to the lack of suitable spawning substrate and very low volume and quality of nursery and spawning habitat. The standard adult population surveys conducted by the State of North Dakota continued to document poor condition and size structure for walleye, sauger and northern pike since the introduction of rainbow smelt in In Oahe, the annual larval smelt surveys revealed larval densities near average. The reservoir rose more than 11 feet above the peak in 2007, flooding terrestrial vegetation and providing good young-of-the-year nursery habitat. The reservoir elevation recovered sufficiently to allow the Whitlock Bay Salmon Spawning Station to be operated for the first time since The recovery from the drought continued to cause a decline in coldwater habitat in the Garrison reservoir. As stated on page 46 of this report, even though the Garrison reservoir elevation increased, the increase in elevation did not increase the coldwater habitat storage. The Corps installed plywood barriers on the trash racks on the intake structures of power plant units 2 and 3 during 2005 and on unit 1 during In addition, hydropower peaking patterns were adjusted to try to limit the volume of cold water released. As shown on Plate 6, these measures preserved coldwater habitat through the summer, but the volume of optimal habitat continues to be very low for a few weeks in the late summer. 7. Threatened and Endangered Species This was the 23nd year of reservoir regulation since the piping plover and least tern were Federally listed as threatened and endangered species, respectively. This was the second year of operating for the endangered pallid sturgeon per the revised Master Manual. No May spring pulse was released from Gavins Point Dam in 2008, as there was not enough water in storage per the Master Manual. The March pulse was released at the beginning of the navigation season. 57
65 The terns and plovers nest on sparsely vegetated sandbars, islands, and shoreline of the Missouri River and the reservoirs. Stream gages have been installed on the Missouri River to monitor river stages and flows during the nesting season. These gages provide a check, as well as a stage history, throughout the season to help relate the effects of regulation and natural events at intervals along the river. The gaging data must be supplemented with observations of nesting activities and conditions to provide the information that is needed for regulation. A dynamic flow routing model has been developed to accurately predict river stages along the river for different combinations of daily and hourly power-peaking. Beginning in 1999, the Omaha District created a computerized T&E Species Data Management System. Report data, which is updated daily, includes nest records, census and productivity data, site descriptions, field journals, and messages. This database provided vital information again during the 2008 nesting season and proved to be a valuable tool in aiding release decisions benefiting the terns and plovers. Although the Corps prevented inundation of nests where possible and created habitat following the listing, fledging ratios continued to be lower than predicted by the USFWS 1990 Biological Opinion until 1998, when fledge ratios exceeded the goal for both species. Predation, habitat degradation, severe weather, nest inundation, record runoff, and other factors contributed to the previously disappointing low fledging. The record fledging that occurred for both species in 1998 and the subsequent above-average and new record fledge ratios achieved since then can be attributed to the large amount of habitat created by the high flows of 1997 and the declining reservoir levels during the current drought. The creation of additional habitat has also allowed greater flexibility in the release levels at the lower two System projects. During 2008 the majority of plovers were again found on the shoreline of the Garrison and Oahe reservoirs and below Gavins Point. The majority of the terns nested in the river reach below Gavins Point. The 2003 amended Biological Opinion (BiOp) described an anticipated level of loss of tern and plover eggs and chicks due to management of the Missouri River reservoirs. The loss due to reservoir operations in 2008 was less than anticipated in the Biological Opinion (BiOp). A total of 32 tern and 256 plover eggs and seven plover chicks were determined to be lost due to water management operations. The rapid rise in the Garrison reservoir elevation due to mountain snowmelt caused the majority of the plover losses. A detailed description of the factors affecting tern and plover nesting, fledge ratios, habitat conditions and creation activities can be found in the Missouri River Recovery Program 2008 Annual Report. The population distribution and productivity for terns and plovers for 1986 through 2008 are shown on Table 19 and Table 20. Productivity estimates for these birds on the Missouri River does not include least terns and piping plovers raised in captivity. The captive rearing facility was not utilized in Adult birds in this table are considered breeders even though they may not have had nesting success. The term "fledglings/pair" refers to the number of young birds produced per breeding pair. This ratio is an estimate, as the fate of every single fledgling is impossible to ascertain. 58
66 Table 19 Missouri River System Interior Least Tern Survey Data Fort Peck Lake Adults Fledglings/Pair {} Fort Peck to Lake Sakakawea Adults Fledglings/Pair Lake Sakakawea Adults * Fledglings/Pair Garrison to Lake Oahe Adults Fledglings/Pair Lake Oahe Adults 16* 21* Fledglings/Pair Ft. Randall to Niobrara Adults Fledglings/Pair Lake Lewis and Clark Adults Fledglings/Pair Gavins Point to Ponca Adults Fledglings/Pair Total Adults ** 1, Fledglings/Pair ** Year Running Average Interior Least Tern Fledge Ratio Goal = Data not collected * Partial Survey Results {} No Birds Found + Subsampling of Selected Nesting Areas ** includes adults and fledglings from Lake Francis Case The data does not include least terns and piping plovers raised in captivity. The data represents only wild fledged birds. From 1990 to 2003 the 10-Year Least Tern Fledge Ratio was 0.70 (1990 and 2000 Biological Opinions). From 2004 to current 5-Year running average goal is 0.94 (2003 Amended Biological Opinion) Data in this table may differ from previous reports. As information becomes available, this table is updated.
67 Table 20 Missouri River System Piping Plover Survey Data Fort Peck Lake Adults Fledglings/Pair Fort Peck to Lake Sakakawea Adults Fledglings/Pair {} Lake Sakakawea Adults Fledglings/Pair Garrison to Lake Oahe Adults Fledglings/Pair Lake Oahe Adults 4* 4* Fledglings/Pair * Ft. Randall to Niobrara Adults Fledglings/Pair * Lake Lewis and Clark Adults Fledglings/Pair Gavins Point to Ponca Adults Fledglings/Pair Total Adults Fledglings/Pair Year Running Average Piping Plover Fledge Ratio Goal = Data not collected * Partial Survey Results {} No Birds Found + Subsampling of Selected Nesting Areas The data does not include least terns and piping plovers raised in captivity. The data represents only wild fledged birds. From 1990 to 2000 the 15-Year Piping Plover Fledge Ratio Goal was 1.44 (1990 Biological Opinion). From 2001 to 2003 the goal was 1.13 (2000 Biological Opinion) From 2004 to current the 10-year running average goal is 1.22 (2003 Amended Biological Opinion) Data in this table may differ from previous reports. As information becomes available, this table is updated.
68 8. Recreation and Resource Management The System reservoirs provide outstanding opportunities for boating, fishing, swimming, camping, and other outdoor recreation pursuits. Tourism related to the reservoirs is a major economic factor in all of the states adjoining the System. However, when the reservoirs are drawn down due to extended drought periods, recreation may be adversely affected. Most of the recreational impacts of drought are experienced at the upper three large reservoirs, Fort Peck, Garrison, and Oahe. Due to their relatively small size, the lower three reservoirs are regulated in a similar manner year-to-year and are not significantly impacted by the drought. Low pool levels at the upper three reservoirs make some boat ramps unusable, expose large areas of beach and sometimes make areas of the reservoirs unreachable. Thus, the low pools adversely affect recreation activities such as boating, fishing, swimming, and camping. However there were effects downstream as well. The use of the water conservation measure to only provide navigation flow support when commercial tows are schedule to utilize a reach of the river has negatively impacted some marinas located downstream of the System during the drought. Significant System storage is conserved annually when only those reaches with tows operating in them obtain flow support from the System. This reduced release rate has at times negatively affected marinas from Gavins Point to below Omaha. Most marina operators have chosen to dredge their marinas deeper but those that have not have suffered periods of inoperability as a result of the lower flows. Due to the improved runoff and low System releases in 2008, recreational access at the upper three reservoirs was much improved. During 2008 the Corps spent approximately $1,366,000 extending and relocating boat ramps to maintain public access where such work was feasible. Considerable effort has been required by all parties involved to maintain recreation access to the reservoirs during period of drought. However, in some locations it is impossible to extend or relocate boat ramps due to the local topography. Of the 11 reservoir access areas located on the Fort Peck reservoir, 9 ramps were usable for all or most of the 2008 recreation season. At Garrison, 34 of the total 36 reservoir access areas were available for the majority of the recreation season. At Oahe, 12 of 13 access areas were available on the North Dakota portion of the reservoir although all of these were in river conditions, and 25 of 27 were available on the South Dakota portion in Access areas at the upper three reservoirs include Corps-owned as well as Tribal, state, and privately-owned facilities. In 2002, many of the Federal recreation areas and boat ramps in South Dakota were turned over in fee title to the state of South Dakota and the Bureau of Indian Affairs through the Title VI process. Since the land transfer, both the Federal treasury and the Corps have provided money to the South Dakota Game Fish and Parks, Cheyenne River Sioux Tribe, and Lower Brule Sioux Tribe for operations and stewardship of the Title VI lands they received. Congress is also capitalizing a trust fund to cover these costs in the future. During 2008, public use at these reservoirs totaled 42,752,300 visitor hours, a 9% increase from Visitor attendance figures at the System projects from 2005 through 2008 are shown in Table 21. Overall visitation was up significantly in 2008 and all projects except Fort Peck experienced increases. Figure 13 displays recreation related 61
69 visitor hours at each of the six mainstem projects for the years 1954 through Although the drought has had an impact on visitation during the past 7 years, much of the reduction shown in Figure 12 is attributed to the data collection changes associated with the South Dakota Title VI land transfer mentioned previously. Since the land transfer occurred, the Corps has not collected visitation data consistent with previous years at the recreation sites in South Dakota. The 2008 visitation in South Dakota presented in Table 21 and Figure 13 reflects water-related use on the reservoirs but not the visitation at the campgrounds that were turned over to the State of South Dakota and the Tribes. The reporting method was changed from recreation days to visitor hours in 1987, and the reporting period was changed from calendar year to fiscal year in 1989 for all Corps projects. All Corps projects, including the System projects, are now reporting visitation using the Visitation Estimation Reporting System (VERS). Table 21 Visitation at System Reservoirs in Visitor Hours Mainstem Project Percent Change Fort Peck 5,445,900 5,374,200 5,630,400 5,443,000-3 % Garrison 12,698,600 14,016,900 12,309,600 13,121, % Oahe 7,700,600 7,386,000 8,045,400 9,641, % Big Bend 2,980,900 3,325,000 3,096,900 3,794, % Fort Randall 1,103,600 1,033,400 1,000,100 1,139, % Gavins Point 8,800,200 8,928,300 9,075,100 9,612, % System Total 38,729,800 40,063,900 39,157,500 42,752, % 9. Cultural Resources As acknowledged in the 2004 Programmatic Agreement for the Operation and Management of the Missouri River Main Stem System (PA), wave action and the fluctuation of reservoirs levels results in erosion along the banks of the reservoirs. With the drought conditions of recent years, additional cultural resource sites have become exposed as the pool levels have declined. The Corps will continue to work with the Tribes utilizing 36 CFR Part 800 and the PA to address the exposure of these sites. The objective of a programmatic agreement is to deal with the potential adverse effects of complex projects or multiple undertakings The objective of the PA was to collaboratively develop a preservation program that would avoid, minimize, and/or mitigate the adverse effects of the System regulation. All Tribes, whether signatory to the PA or not, may request government-to-government consultation on the regulation of the System and the resulting effect on historic and cultural properties and other resources. The planned preservation program is outlined by multiple stipulations in the PA. One of the stipulations, or program components, is the 5-year plan. This plan outlines how the Corps will accomplish its responsibilities under the PA and National Historic Preservation Act. The Draft Five Year Plan, dated February 2005 (see website 62
70 is currently being implemented. The plan includes inventory, testing and evaluation, mitigation, and other specific activities that will allow the Corps to avoid, minimize, and/or mitigate the adverse effects to cultural sites on the Corps lands within the System. Under the terms of Stipulation 18 of the PA the Corps has agreed to consult/meet with the affected Tribes and Tribal Historic Preservation Officers (THPO s), State Historic Preservation Officers (SHPO s), the Advisory Council on Historic Preservation (ACHP) and other parties on the draft AOP. The purpose of this consultation/meeting is to determine whether operational changes are likely to cause changes to the nature, location or severity of adverse effects to historic properties or to the types of historic properties affected and whether amendments to the Corps Cultural Resources Management Plans and Five-Year Plan are warranted in order to better address such effects to historic properties. A letter, dated August 27, 2008, was sent to the Missouri basin Tribes offering consultation on the AOP. To date, no requests for consultation have been received; however two Tribes participated in the fall AOP public meetings in October 2008 and provided input on the draft AOP. In addition the Great Plains Tribal Chairman s Committee provided written comments on the draft AOP. 63
71 System Project Visits 1954 to 2008 Fort Peck Garrison Oahe Big Bend Ft. Randall Gavins Point 70 Million Visitor Hours through 1988 data in Calendar Years 1989 to 1991 in Fiscal Years 1992 to present in VERS System Year 2002 to present reflect changed accounting due to Title VI land transfer to State of South Dakota
72
73 Summary of Engineering Data -- Missouri River Mainstem System Item Subject Fort Peck Dam - Garrison Dam - Oahe Dam - No. Fort Peck Lake Lake Sakakawea Lake Oahe 1 Location of Dam Near Glasgow, Montana Near Garrison, ND Near Pierre, SD 2 River Mile Mileage Mile Mile Mile Total & incremental drainage 57, ,400 (2) 123, ,490 (1) 62,090 areas in square miles 4 Approximate length of ful 134, ending near Zortman, MT 178, ending near Trenton, ND 231, ending near Bismarck, ND reservoir (in valley miles) 5 Shoreline in miles (3) 1520 (elevation 2234) 1340 (elevation ) 2250 (elevation ) 6 Average total & incrementa 10,200 25,600 15,400 28,900 3,300 inflow in cfs 7 Max. discharge of record 137,000 (June 1953) 348,000 (April 1952) 440,000 (April 1952) near damsite in cfs 8 Construction started - calendar yr In operation (4) calendar yr Dam and Embankment 10 Top of dam, elevation in feet msl Length of dam in feet 21,026 (excluding spillway 11,300 (including spillway 9,300 (excluding spillway 12 Damming height in feet (5) Maximum height in feet (5) Max. base width, total & w/o 3500, , , 1500 berms in feet 15 Abutment formations ( under dam & Bearpaw shale and glacial fil Fort Union clay shale Pierre shale embankment) 16 Type of fill Hydraulic & rolled earth fil Rolled earth filled Rolled earth fill & shale berms 17 Fill quantity, cubic yards 125,628,000 66,500,000 55,000,000 & 37,000, Volume of concrete, cubic yards 1,200,000 1,500,000 1,045, Date of closure 24 June April August 1958 Spillway Data 20 Location Right bank - remote Left bank - adjacent Right bank - remote 21 Crest elevation in feet ms Width (including piers) in fee 820 gated 1336 gated 456 gated 23 No., size and type of gates 16-40' x 25' vertical lift gates 28-40' x 29' Tainter 8-50' x 23.5' Tainter 24 Design discharge capacity, cfs 275,000 at elev ,000 at elev ,000 at elev Discharge capacity at maximum 230, ,000 80,000 operating pool in cfs Reservoir Data (6) 26 Max. operating pool elev. & area 2250 msl 241,000 acres 1854 msl 380,000 acres 1620 msl 374,000 acres 27 Max. normal op. pool elev. & area 2246 msl 234,000 acres 1850 msl 364,000 acres 1617 msl 360,000 acres 28 Base flood control elev & area 2234 msl 210,000 acres msl 307,000 acres msl 312,000 acres 29 Min. operating pool elev. & area 2160 msl 89,000 acres 1775 msl 128,000 acres 1540 msl 117,000 acres Storage allocation & capacity 30 Exclusive flood contro ,000 a.f ,489,000 a.f ,102,000 a.f. 31 Flood control & multiple use ,838,000 a.f ,222,000 a.f ,201,000 a.f. 32 Carryover multiple use ,667,000 a.f ,130,000 a.f ,461,000 a.f. 33 Permanent ,073,000 a.f ,980,000 a.f ,373,000 a.f. 34 Gross ,500,000 a.f ,821,000 a.f ,137,000 a.f. 35 Reservoir filling initiate November 1937 December 1953 August Initially reached min. operating poo 27 May August April Estimated annual sediment inflow 17,700 a.f yrs. 25,900 a.f. 920 yrs. 19,800 a.f yrs. Outlet Works Data 38 Location Right bank Right Bank Right Bank 39 Number and size of conduits 2-24' 8" diameter (nos. 3 & 4) 1-26' dia. and 2-22' dia ' dia. upstream, 18.25' dia. downstream 40 Length of conduits in feet (8) No. 3-6,615, No. 4-7, to No., size, and type of service gates 1-28' dia. cylindrical gate 1-18' x 24.5' Tainter gate per 1-13' x 22' per conduit, vertical 6 ports, 7.6' x 8.5' high (net conduit for fine regulation lift, 4 cable suspension and opening) in each control shaft 2 hydraulic suspension (fine regulation) 42 Entrance invert elevation (msl Avg. discharge capacity per condui Elev Elev Elev & total 22,500 cfs - 45,000 cfs 30,400 cfs - 98,000 cfs 18,500 cfs - 111,000 cfs 44 Present tailwater elevation (ft msl ,000-35,000 cfs ,000-60,000 cfs ,000-55,000 cfs Power Facilities and Data 45 Avg. gross head available in feet ( Number and size of conduits No. 1-24'8" dia., No. 2-22'4" dia. 5-29' dia., 25' penstocks 7-24' dia., imbedded penstocks 47 Length of conduits in feet (8) No. 1-5,653, No. 2-6, From 3,280 to 4, Surge tanks PH#1: 3-40' dia., PH#2: 2-65' dia. 65' dia. - 2 per penstock 70' dia., 2 per penstock 49 No., type and speed of turbines 5 Francis, PH#1-2: rpm, 5 Francis, 90 rpm 7 Francis, 100 rpm rpm, PH#2-2: rpm 50 Discharge cap. at rated head in cfs PH#1, units 1&3 170', 2-140' 150' 41,000 cfs 185' 54,000 cfs 8,800 cfs, PH#2-4&5 170'-7,200 cfs 51 Generator nameplate rating in kw 1&3: 43,500; 2: 18,250; 4&5: 40, ,600, 2-109, , Plant capacity in kw 185, , , Dependable capacity in kw (9) 181, , , Avg. annual energy, million kwh (12 1,063 2,268 2, Initial generation, first and last uni July June 1961 January October 1960 April June Estimated cost September 1999 completed project (13) $158,428,000 $305,274,000 $346,521,000
74 Summary of Engineering Data -- Missouri River Mainstem System Big Bend Dam - Fort Randall Dam - Gavins Point Dam - Total Item Remarks Lake Sharpe Lake Francis Case Lewis & Clark Lake No. 21 miles upstream Chamberlain, SD Near Lake Andes, SD Near Yankton, SD 1 (1) Includes 4,280 square Mile Mile Mile miles of non-contributing 249,330 (1) 5, ,480 (1) 14, ,480 (1) 16,000 3 areas. (2) Includes 1,350 square 80, ending near Pierre, SD 107, ending at Big Bend Dam 25, ending near Niobrara, NE 755 miles 4 miles of non-contributing areas. 200 (elevation 1420) 540 (elevation 1350) 90 (elevation ) 5,940 miles 5 (3) With pool at base of flood 28,900 30,000 1,100 32,000 2,000 6 control. (4) Storage first available for 440,000 (April 1952) 447,000 (April 1952) 480,000 (April 1952) 7 regulation of flows (5) Damming height is heigh from low water to maximum operating pool. Maximum height is from average streambed to top of dam. 10,570 (including spillway 10,700 (including spillway 8,700 (including spillway 71, (6) Based on latest available feet 12 storage data (7) River regulation is attained 1200, , , by flows over low-crested spillway and through Pierre shale & Niobrara chalk Niobrara chalk Niobrara chalk & Carlile shale 15 turbines. (8) Length from upstream face Rolled earth, shale, chalk fil Rolled earth fill & chalk berms Rolled earth & chalk fil 16 of outlet or to spiral case. 17,000,000 28,000,000 & 22,000,000 7,000, ,128,000 cu. yds 17 (9) Based on 8th year (1961) 540, , ,000 5,554,000 cu. yds. 18 of drought drawdown 24 July July July (From study ). (10) Affected by level of Lake Left bank - adjacent Left bank - adjacent Right bank - adjacent 20 Francis case. Applicable to pool at elevation gated 1000 gated 664 gated 22 (11) Spillway crest 8-40' x 38' Tainter 21-40' x 29' Tainter 14-40' x 30' Tainter 23 (12) Average 390,000 at elev ,000 at elev ,000 at elev (13) Source: Annual Report on 270, , , Civil Works Activities of th Corps of Engineers. Extract Report Fiscal Year msl 61,000 acres 1375 msl 102,000 acres 1210 msl 30,000 acres 1,188,000 acres 26 (14) Based on Study msl 60,000 acres 1365 msl 95,000 acres 1208 msl 27,000 acres 1,140,000 acres msl 57,000 acres 1350 msl 77,000 acres msl 23,000 acres 986,000 acres msl 51,000 acres 1320 msl 38,000 acres msl 23,000 acres 446,000 acres ,000 a.f ,000 a.f ,000 a.f. 4,615,000 a.f ,000 a.f ,309,000 a.f ,000 a.f. 11,773,000 a.f ,607,000 a.f. 38,865,000 a.f ,621,000 a.f ,517,000 a.f ,000 a.f. 17,871,000 a.f ,798,000 a.f ,418,000 a.f ,000 a.f. 73,124,000 a.f. 34 November 1963 January 1953 August March November December ,300 a.f. 430 yrs. 18,400 a.f. 250 yrs. 2,600 a.f. 180 yrs. 89,700 a.f. 37 Left Bank 38 None (7) 4-22' diameter None (7) ' x 23' per conduit, vertical 41 lift, cable suspension 1385 (11) (11) 42 Elev ,000 cfs - 128,000 cfs (10) 25, ,000 cfs ,000-60,000 cfs ,000-60,000 cfs feet 45 None: direct intake 8-28' dia., 22' penstocks None: direct intake 46 1,074 55, None 59' dia, 2 per alternate penstock None 48 8 Fixed blade, 81.8 rpm 8 Francis, 85.7 rpm 3 Kaplan, 75 rpm 36 units 49 67' 103,000 cfs 112' 44,500 cfs 48' 36,000 cfs ,276, 5-58,500 40,000 44, , , ,300 2,501,200 kw , ,000 74,000 1,967,000 kw 53 Corps of Engineers, U.S. Army 976 1, ,412 million kwh 54 Compiled by October July 1966 March January 1956 September January 1957 July July Northwestern Division 56 Missouri River Region $107,498,000 $199,066,000 $49,617,000 $1,166,404,000 January 2009
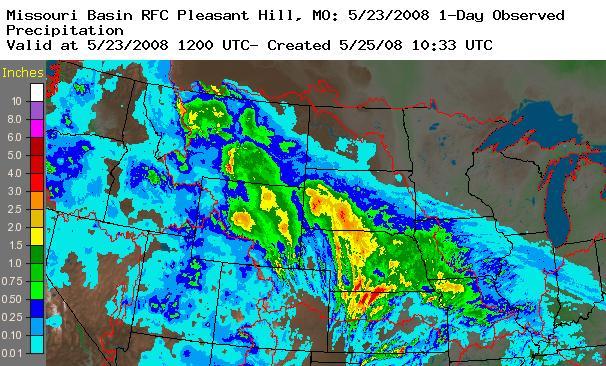
75
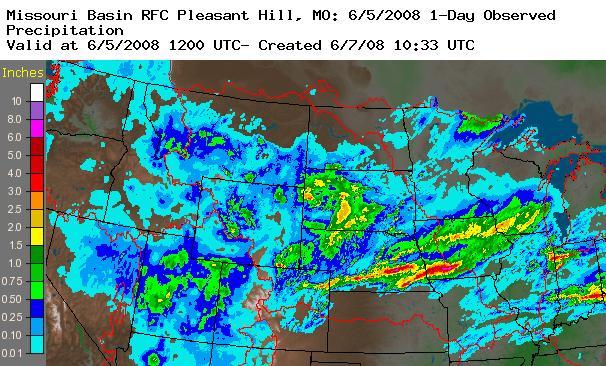
76
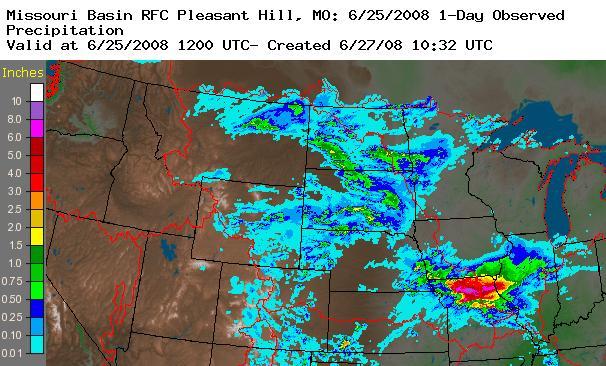
77
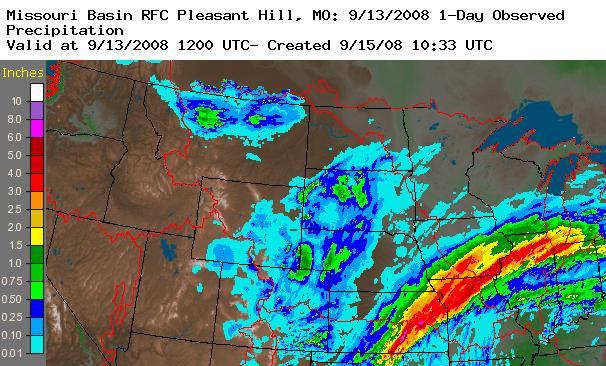
78
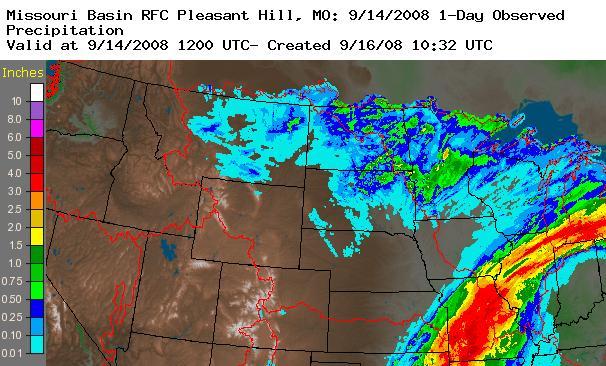
79
Summary of Actual 2010 Regulation
 US Army Corps of Engineers Northwestern Division Missouri River Mainstem Reservoir System Summary of Actual 2010 Regulation Missouri River Basin Fort Peck Garrison Oahe Big Bend Gavins Point Fort Randall
Summary of Actual 2006 Regulation
 US Army Corps of Engineers Northwestern Division Missouri River Mainstem Reservoir System Summary of Actual 2006 Regulation Missouri River Basin Fort Peck Garrison Oahe Big Bend Gavins Point Ft. Randall
January 2011 Calendar Year Runoff Forecast
 January 2011 Calendar Year Runoff Forecast 2010 Runoff Year Calendar Year 2010 was the third highest year of runoff in the Missouri River Basin above Sioux City with 38.8 MAF, behind 1978 and 1997 which
Missouri River Basin Water Management
 Missouri River Basin Water Management US Army Corps of Engineers Missouri River Navigator s Meeting February 12, 2014 Bill Doan, P.E. Missouri River Basin Water Management US Army Corps of Engineers BUILDING
Summary of Actual Operations
 Missouri River Region US Army Corps of Engineers Since 1953 Reservoir Control Center Northwestern Division Missouri River Region Reservoir Control Center Missouri River Basin Fort Peck Montana Garrison
Reservoir Control Center U. S Army Corps of Engineers Northwestern Division - Missouri River Basin Omaha, Nebraska
 US Army Corps of Engineers Fort Peck Garrison Oahe Big Bend Gavins Point Ft. Randall Reservoir Control Center U. S Army Corps of Engineers Northwestern Division - Missouri River Basin Omaha, Nebraska April
Summary of Actual 2007 Regulation
 US Army Corps of Engineers Northwestern Division Missouri River Mainstem Reservoir System Summary of Actual 2007 Regulation Missouri River Basin Fort Peck Garrison Oahe Big Bend Gavins Point Ft. Randall
Upper Missouri River Basin February 2018 Calendar Year Runoff Forecast February 6, 2018
 Upper Missouri River Basin February 2018 Calendar Year Runoff Forecast February 6, 2018 Calendar Year Runoff Forecast Explanation and Purpose of Forecast U.S. Army Corps of Engineers, Northwestern Division
Upper Missouri River Basin December 2017 Calendar Year Runoff Forecast December 5, 2017
 Upper Missouri River Basin December 2017 Calendar Year Runoff Forecast December 5, 2017 Calendar Year Runoff Forecast Explanation and Purpose of Forecast U.S. Army Corps of Engineers, Northwestern Division
MISSOURI RIVER BASIN WATER MANAGEMENT SPRING 2019 PUBLIC MEETINGS
 MISSOURI RIVER BASIN WATER MANAGEMENT SPRING 2019 PUBLIC MEETINGS April 9 11:00 a.m. Fort Peck, MT April 9 6:00 p.m. Bismarck, ND April 10 10:00 a.m. Pierre, SD April 10 4:00 p.m. Sioux City, IA April
Missouri River Basin Water Management Monthly Update
 Missouri River Basin Water Management Monthly Update Participating Agencies 255 255 255 237 237 237 0 0 0 217 217 217 163 163 163 200 200 200 131 132 122 239 65 53 80 119 27 National Oceanic and Atmospheric
Missouri River Basin Water Management Monthly Update
 Missouri River Basin Water Management Monthly Update Participating Agencies 255 255 255 237 237 237 0 0 0 217 217 217 163 163 163 200 200 200 131 132 122 239 65 53 80 119 27 National Oceanic and Atmospheric
Upper Missouri River Basin January 2018 Calendar Year Runoff Forecast January 3, 2018
 Calendar Year Runoff Forecast Upper Missouri River Basin January 2018 Calendar Year Runoff Forecast January 3, 2018 Explanation and Purpose of Forecast U.S. Army Corps of Engineers, Northwestern Division
January 25, Summary
 January 25, 2013 Summary Precipitation since the December 17, 2012, Drought Update has been slightly below average in parts of central and northern Illinois and above average in southern Illinois. Soil
Missouri River Basin Water Management Monthly Update
 Missouri River Basin Water Management Monthly Update Participating Agencies 255 255 255 237 237 237 0 0 0 217 217 217 163 163 163 200 200 200 131 132 122 239 65 53 80 119 27 National Oceanic and Atmospheric
Upper Missouri River Basin May 2018 Calendar Year Runoff Forecast May 4, 2018
 Calendar Year Runoff Forecast Explanation and Purpose of Forecast Upper Missouri River Basin May 2018 Calendar Year Runoff Forecast May 4, 2018 U.S. Army Corps of Engineers, Northwestern Division Missouri
Missouri River Basin Water Management Monthly Update
 Missouri River Basin Water Management Monthly Update Participating Agencies 255 255 255 237 237 237 0 0 0 217 217 217 163 163 163 200 200 200 131 132 122 239 65 53 80 119 27 National Oceanic and Atmospheric
Champaign-Urbana 1998 Annual Weather Summary
 Champaign-Urbana 1998 Annual Weather Summary ILLINOIS STATE WATER SURVEY Audrey Bryan, Weather Observer 2204 Griffith Dr. Champaign, IL 61820 wxobsrvr@sparc.sws.uiuc.edu The development of the El Nìno
Missouri River Basin Climate Outlook 1 May Dr. Dennis Todey State Climatologist South Dakota State Univ.
 Missouri River Basin Climate Outlook 1 May 2014 Dr. Dennis Todey State Climatologist South Dakota State Univ. dennis.todey@sdstate.edu 605-688-5141 Photo taken Feb 19, 2013 General Information Providing
2012 Growing Season Weather Summary for North Dakota. Adnan Akyüz and Barbara A. Mullins Department of Soil Science October 30, 2012
 2012 Growing Season Weather Summary for North Dakota Adnan Akyüz and Barbara A. Mullins Department of Soil Science October 30, 2012 Introduction The 2012 growing season (the period from April through September)
Monthly Long Range Weather Commentary Issued: APRIL 18, 2017 Steven A. Root, CCM, Chief Analytics Officer, Sr. VP,
 Monthly Long Range Weather Commentary Issued: APRIL 18, 2017 Steven A. Root, CCM, Chief Analytics Officer, Sr. VP, sroot@weatherbank.com MARCH 2017 Climate Highlights The Month in Review The average contiguous
Champaign-Urbana 1999 Annual Weather Summary
 Champaign-Urbana 1999 Annual Weather Summary ILLINOIS STATE WATER SURVEY 2204 Griffith Dr. Champaign, IL 61820 wxobsrvr@sws.uiuc.edu Maria Peters, Weather Observer A major snowstorm kicked off the new
Missouri River Flood Task Force River Management Working Group Improving Accuracy of Runoff Forecasts
 Missouri River Flood Task Force River Management Working Group Improving Accuracy of Runoff Forecasts Kevin Grode, P.E. Reservoir Regulation Team Lead Missouri River Basin Water Management Northwestern
May 2016 Volume 23 Number 5
 The Weather Wire May 2016 Volume 23 Number 5 Contents: Winter Summary Current Colorado and West-wide Snow Pack Drought Monitor April Summary/Statistics May Preview Snowfall Totals Winter Summary The Front
The hydrologic service area (HSA) for this office covers Central Kentucky and South Central Indiana.
 for this office covers Central Kentucky and South Central Indiana.") January 2012 February 13, 2012 An X inside this box indicates that no flooding occurred within this hydrologic service area. January 2012 continued the string of wet months this winter. Rainfall was generally
January 2012 February 13, 2012 An X inside this box indicates that no flooding occurred within this hydrologic service area. January 2012 continued the string of wet months this winter. Rainfall was generally
Monthly Long Range Weather Commentary Issued: February 15, 2015 Steven A. Root, CCM, President/CEO
 Monthly Long Range Weather Commentary Issued: February 15, 2015 Steven A. Root, CCM, President/CEO sroot@weatherbank.com JANUARY 2015 Climate Highlights The Month in Review During January, the average
Doug Kluck NOAA Kansas City, MO National Center for Environmental Information (NCEI) National Integrated Drought Information System (NIDIS)
 National Integrated Drought Information System (NIDIS)") National Integrated Drought Information System (NIDIS) for the Missouri River Basin Drought Early Warning Information System (DEWS) & Runoff Trends in the Missouri Basin & Latest Flood Outlook Doug Kluck
National Integrated Drought Information System (NIDIS) for the Missouri River Basin Drought Early Warning Information System (DEWS) & Runoff Trends in the Missouri Basin & Latest Flood Outlook Doug Kluck
Great Lakes Update. Volume 199: 2017 Annual Summary. Background
 Great Lakes Update Volume 199: 2017 Annual Summary Background The U.S. Army Corps of Engineers (USACE) tracks and forecasts the water levels of each of the Great Lakes. This report is primarily focused
Monthly Long Range Weather Commentary Issued: SEPTEMBER 19, 2016 Steven A. Root, CCM, Chief Analytics Officer, Sr. VP,
 Monthly Long Range Weather Commentary Issued: SEPTEMBER 19, 2016 Steven A. Root, CCM, Chief Analytics Officer, Sr. VP, sroot@weatherbank.com SEPTEMBER 2016 Climate Highlights The Month in Review The contiguous
SEPTEMBER 2013 REVIEW
 Monthly Long Range Weather Commentary Issued: October 21, 2013 Steven A. Root, CCM, President/CEO sroot@weatherbank.com SEPTEMBER 2013 REVIEW Climate Highlights The Month in Review The average temperature
Wind River Indian Reservation and Surrounding Area Climate and Drought Summary
 Northern Arapaho Tribe Wind River Indian Reservation and Surrounding Area Climate and Drought Summary Spring Events & Summer Outlook 2015 Spring Was Warm And Very Wet Across The Region The spring season
Champaign-Urbana 2001 Annual Weather Summary
 Champaign-Urbana 2001 Annual Weather Summary ILLINOIS STATE WATER SURVEY 2204 Griffith Dr. Champaign, IL 61820 wxobsrvr@sws.uiuc.edu Maria Peters, Weather Observer January: After a cold and snowy December,
The hydrologic service area (HSA) for this office covers Central Kentucky and South Central Indiana.
 for this office covers Central Kentucky and South Central Indiana.") MONTH YEAR January 2011 February 15, 2011 X An X inside this box indicates that no flooding occurred within this hydrologic service area. January 2011 was drier than normal in all locations in the area.
MONTH YEAR January 2011 February 15, 2011 X An X inside this box indicates that no flooding occurred within this hydrologic service area. January 2011 was drier than normal in all locations in the area.
Monthly Long Range Weather Commentary Issued: APRIL 1, 2015 Steven A. Root, CCM, President/CEO
 Monthly Long Range Weather Commentary Issued: APRIL 1, 2015 Steven A. Root, CCM, President/CEO sroot@weatherbank.com FEBRUARY 2015 Climate Highlights The Month in Review The February contiguous U.S. temperature
National Wildland Significant Fire Potential Outlook
 National Wildland Significant Fire Potential Outlook National Interagency Fire Center Predictive Services Issued: September, 2007 Wildland Fire Outlook September through December 2007 Significant fire
Central Region Climate Outlook May 15, 2014
 Central Region Climate Outlook May 15, 2014 Dr. Jim Angel State Climatologist IL State Water Survey University of Illinois jimangel@illinois.edu 217-333-0729 Chicago-area flooding General Information Providing
A Review of the 2007 Water Year in Colorado
 A Review of the 2007 Water Year in Colorado Nolan Doesken Colorado Climate Center, CSU Mike Gillespie Snow Survey Division, USDA, NRCS Presented at the 28 th Annual AGU Hydrology Days, March 26, 2008,
PRELIMINARY DRAFT FOR DISCUSSION PURPOSES
 Memorandum To: David Thompson From: John Haapala CC: Dan McDonald Bob Montgomery Date: February 24, 2003 File #: 1003551 Re: Lake Wenatchee Historic Water Levels, Operation Model, and Flood Operation This
Minnesota s Climatic Conditions, Outlook, and Impacts on Agriculture. Today. 1. The weather and climate of 2017 to date
 Minnesota s Climatic Conditions, Outlook, and Impacts on Agriculture Kenny Blumenfeld, State Climatology Office Crop Insurance Conference, Sep 13, 2017 Today 1. The weather and climate of 2017 to date
Illinois Drought Update, December 1, 2005 DROUGHT RESPONSE TASK FORCE Illinois State Water Survey, Department of Natural Resources
 Illinois Drought Update, December 1, 2005 DROUGHT RESPONSE TASK FORCE Illinois State Water Survey, Department of Natural Resources For more drought information please go to http://www.sws.uiuc.edu/. SUMMARY.
The following information is provided for your use in describing climate and water supply conditions in the West as of April 1, 2003.
 Natural Resources Conservation Service National Water and Climate Center 101 SW Main Street, Suite 1600 Portland, OR 97204-3224 Date: April 8, 2003 Subject: April 1, 2003 Western Snowpack Conditions and
Colorado s 2003 Moisture Outlook
 Colorado s 2003 Moisture Outlook Nolan Doesken and Roger Pielke, Sr. Colorado Climate Center Prepared by Tara Green and Odie Bliss http://climate.atmos.colostate.edu How we got into this drought! Fort
Great Lakes Update. Volume 188: 2012 Annual Summary
 Great Lakes Update Volume 188: 2012 Annual Summary Background The U.S. Army Corps of Engineers (USACE) tracks the water levels of each of the Great Lakes. This report highlights hydrologic conditions of
Webinar and Weekly Summary February 15th, 2011
 Webinar and Weekly Summary February 15th, 2011 -Assessment of current water conditions - Precipitation Forecast - Recommendations for Drought Monitor Upper Colorado Normal Precipitation Upper Colorado
Midwest/Great Plains Climate-Drought Outlook September 20, 2018
 Midwest/Great Plains Climate-Drought Outlook September 20, 2018 Brian Fuchs National Drought Mitigation Center University of Nebraska-Lincoln School of Natural Resources September 20, 2018 General Information
Champaign-Urbana 2000 Annual Weather Summary
 Champaign-Urbana 2000 Annual Weather Summary ILLINOIS STATE WATER SURVEY 2204 Griffith Dr. Champaign, IL 61820 wxobsrvr@sws.uiuc.edu Maria Peters, Weather Observer January: January started on a mild note,
The Pennsylvania Observer
 The Pennsylvania Observer April 2, 2009 March 2009 Pennsylvania Weather Recap Prepared by Curt Harpster For the month of March the saying, In like a lion and out like a lamb really fit the pattern quite
Great Lakes Update. Volume 191: 2014 January through June Summary. Vol. 191 Great Lakes Update August 2014
 Great Lakes Update Volume 191: 2014 January through June Summary The U.S. Army Corps of Engineers (USACE) monitors the water levels of each of the Great Lakes. This report provides a summary of the Great
Drought in Southeast Colorado
 Drought in Southeast Colorado Nolan Doesken and Roger Pielke, Sr. Colorado Climate Center Prepared by Tara Green and Odie Bliss http://climate.atmos.colostate.edu 1 Historical Perspective on Drought Tourism
Great Lakes Update. Volume 194: 2015 Annual Summary
 Great Lakes Update Volume 194: 2015 Annual Summary Background The U.S. Army Corps of Engineers (USACE) tracks and forecasts the water levels of each of the Great Lakes. This report summarizes the hydrologic
The Colorado Drought : 2003: A Growing Concern. Roger Pielke, Sr. Colorado Climate Center.
 The Colorado Drought 2001-2003: 2003: A Growing Concern Roger Pielke, Sr. Colorado Climate Center Prepared by Tara Green and Odie Bliss http://climate.atmos.colostate.edu 2 2002 Drought History in Colorado
HyMet Company. Streamflow and Energy Generation Forecasting Model Columbia River Basin
 HyMet Company Streamflow and Energy Generation Forecasting Model Columbia River Basin HyMet Inc. Courthouse Square 19001 Vashon Hwy SW Suite 201 Vashon Island, WA 98070 Phone: 206-463-1610 Columbia River
2011 Year in Review TORNADOES
 2011 Year in Review The year 2011 had weather events that will be remembered for a long time. Two significant tornado outbreaks in April, widespread damage and power outages from Hurricane Irene in August
KANSAS CLIMATE SUMMARY January 2018
 KANSAS CLIMATE SUMMARY January 2018 Some welcome moisture After an extended period with little to no moisture, parts of Kansas recorded some significant precipitation. At Tribune, a small snow event on
2003 Moisture Outlook
 2003 Moisture Outlook Nolan Doesken and Roger Pielke, Sr. Colorado Climate Center Prepared by Tara Green and Odie Bliss http://climate.atmos.colostate.edu Through 1999 Through 1999 Fort Collins Total Water
January 2008 Climate Summary
 Joseph Mays (765) 494-6574 Feb 5, 2008 http://www.iclimate.org Summary January 2008 Climate Summary January was a mix bag of conditions, with an oscillatory pattern developing. We experienced phases of
KANSAS CLIMATE SUMMARY February 2015
 KANSAS CLIMATE SUMMARY February 2015 Extended Cold Despite some record warm readings at a few locations, February was characterized by colder than normal conditions. This was particularly true during the
Great Lakes Update. Volume 193: 2015 January through June Summary. Vol. 193 Great Lakes Update August 2015
 Great Lakes Update Volume 193: 2015 January through June Summary The U.S. Army Corps of Engineers (USACE) monitors the water levels of each of the Great Lakes. This report provides a summary of the Great
2. PHYSICAL SETTING FINAL GROUNDWATER MANAGEMENT PLAN. 2.1 Topography. 2.2 Climate
 FINAL GROUNDWATER MANAGEMENT PLAN 2. PHYSICAL SETTING Lassen County is a topographically diverse area at the confluence of the Cascade Range, Modoc Plateau, Sierra Nevada and Basin and Range geologic provinces.
The Climate of Murray County
 The Climate of Murray County Murray County is part of the Crosstimbers. This region is a transition between prairies and the mountains of southeastern Oklahoma. Average annual precipitation ranges from
The Pennsylvania Observer
 The Pennsylvania Observer January 5, 2009 December 2008 Pennsylvania Weather Recap The final month of 2008 was much wetter than average and a bit colder than normal. In spite of this combination, most
Water Supply Conditions and Outlook June 4, 2018
 Water Supply Conditions and Outlook June 4, 2018 Flow Forecasting & Operations Planning Water Security Agency Overview Water supply conditions across Saskatchewan are generally good with most reservoir
PH YSIC A L PROPERT IE S TERC.UCDAVIS.EDU
 PH YSIC A L PROPERT IE S 8 Lake surface level Daily since 1900 Lake surface level varies throughout the year. Lake level rises due to high stream inflow, groundwater inflow and precipitation directly onto
The Colorado Drought of 2002 in Perspective
 The Colorado Drought of 2002 in Perspective Colorado Climate Center Nolan Doesken and Roger Pielke, Sr. Prepared by Tara Green and Odie Bliss http://climate.atmos.colostate.edu Known Characteristics of
UNITED STATES AND SOUTH AMERICA OUTLOOK (FULL REPORT) Wednesday, April 18, 2018
 Wednesday, April 18, 2018") T-storm Weather Summary Coolness continues over the next week in much of the central U.S., most likely producing the coldest April since 1907 in the Corn Belt, but followed by seasonable to mild weather
T-storm Weather Summary Coolness continues over the next week in much of the central U.S., most likely producing the coldest April since 1907 in the Corn Belt, but followed by seasonable to mild weather
ACCUMULATED PRECIPITATION IN INCHES
 CUMULATIVE PRECIPITATION WATER YEAR COLUMBIA BASIN ABOVE GRAND COULEE 84% of Normal 1971- Average ACCUMULATED PRECIPITATION IN INCHES 8 6 82% of Normal 85% of Normal 82% of Normal SNAKE RIVER BASIN ABOVE
ACCUMULATED PRECIPITATION IN INCHES
 4 3 CUMULATIVE PRECIPITATION WATER YEAR 7 COLUMBIA BASIN ABOVE GRAND COULEE 18% of Normal 1971- Average ACCUMULATED PRECIPITATION IN INCHES 1 3 1 4 3 1 8 6 4 94% of Normal 17% of Normal 118% of Normal
Modeling of peak inflow dates for a snowmelt dominated basin Evan Heisman. CVEN 6833: Advanced Data Analysis Fall 2012 Prof. Balaji Rajagopalan
 Modeling of peak inflow dates for a snowmelt dominated basin Evan Heisman CVEN 6833: Advanced Data Analysis Fall 2012 Prof. Balaji Rajagopalan The Dworshak reservoir, a project operated by the Army Corps
KANSAS CLIMATE SUMMARY April 2017
 KANSAS CLIMATE SUMMARY April 2017 Epic Blizzard While much of the month was warmer than normal, the last week brought a return to cold, wintery weather in the western third of the state, and cold rainy
Souris River Basin Spring Runoff Outlook As of March 1, 2019
 Souris River Basin Spring Runoff Outlook As of March 1, 2019 Prepared by: Flow Forecasting & Operations Planning Water Security Agency Basin Conditions Summer rainfall in 2018 over the Saskatchewan portion
2012 USACE Drought Actions
 2012 USACE Drought Actions for Inland Waterway Users Board 68 Jim Walker Navigation Branch Chief 19 December 2012 US US Army Corps of of Engineers US Drought Monitor 1 2 3 4 6 5 Impacts: 1. The area in
NATIONAL WEATHER SERVICE
 January 2016 February 9, 2016 This was a dry month across the HSA despite one large and several smaller snowfalls. Most locations ended up 1-2 inches below normal for the month. The driest locations at
March 1, 2003 Western Snowpack Conditions and Water Supply Forecasts
 Natural Resources Conservation Service National Water and Climate Center 101 SW Main Street, Suite 1600 Portland, OR 97204-3224 Date: March 17, 2003 Subject: March 1, 2003 Western Snowpack Conditions and
April 2011 Volume 18 Number 4
 The Weather Wire April 2011 Volume 18 Number 4 Contents: Winter Summary to Date Drought Monitor March Summary/Statistics April Preview Sunrise/Sunset Snow Totals Winter Summary to Date The Front Range
Assessing Spatial and Temporal Distribution of Sediment, Nitrogen and Phosphorous Loading in the Missouri River Basin (MORB)
") Assessing Spatial and Temporal Distribution of Sediment, Nitrogen and Phosphorous Loading in the Missouri River Basin (MORB) Zhonglong Zhang, PhD, PE, May Wu, PhD LimnoTech, Environmental Laboratory, ERDC,
Assessing Spatial and Temporal Distribution of Sediment, Nitrogen and Phosphorous Loading in the Missouri River Basin (MORB) Zhonglong Zhang, PhD, PE, May Wu, PhD LimnoTech, Environmental Laboratory, ERDC,
Great Lakes Update. Great Lakes Winter and Spring Summary January June Vol. 187 Great Lakes Update August 2012
 Great Lakes Update Great Lakes Winter and Spring Summary January June 2012 The US Army Corps of Engineers (USACE) Detroit District monitors hydraulic and hydrologic conditions of the Great Lakes. This
Weather and Climate of the Rogue Valley By Gregory V. Jones, Ph.D., Southern Oregon University
 Weather and Climate of the Rogue Valley By Gregory V. Jones, Ph.D., Southern Oregon University The Rogue Valley region is one of many intermountain valley areas along the west coast of the United States.
The Climate of Texas County
 The Climate of Texas County Texas County is part of the Western High Plains in the north and west and the Southwestern Tablelands in the east. The Western High Plains are characterized by abundant cropland
Monthly Long Range Weather Commentary Issued: May 15, 2014 Steven A. Root, CCM, President/CEO
 Monthly Long Range Weather Commentary Issued: May 15, 2014 Steven A. Root, CCM, President/CEO sroot@weatherbank.com APRIL 2014 REVIEW Climate Highlights The Month in Review The average temperature for
The Weather Wire. Current Colorado Snowpack. Contents:
 The Weather Wire December 2018 Volume 25 Number 12 Contents: Current Colorado Snowpack Drought Monitor November Summary/Statistics December Preview Snowfall Totals Current Colorado Snowpack Although snowfall
Monthly Long Range Weather Commentary Issued: July 18, 2014 Steven A. Root, CCM, President/CEO
 Monthly Long Range Weather Commentary Issued: July 18, 2014 Steven A. Root, CCM, President/CEO sroot@weatherbank.com JUNE 2014 REVIEW Climate Highlights The Month in Review The average temperature for
Colorado CoCoRaHS. Colorado CoCoRaHS. Because Every Drop Counts! November 2014 Volume 2, Issue 11
 U.S. PRECIPITATION (% OF AVERAGE) LOOKING BACK AT OCTOBER 2014 October was a fairly dry month for much of the nation with the exception of the Pacific Northwest, portions of New England and the Tennessee
The Climate of Marshall County
 The Climate of Marshall County Marshall County is part of the Crosstimbers. This region is a transition region from the Central Great Plains to the more irregular terrain of southeastern Oklahoma. Average
The Climate of Bryan County
 The Climate of Bryan County Bryan County is part of the Crosstimbers throughout most of the county. The extreme eastern portions of Bryan County are part of the Cypress Swamp and Forest. Average annual
Montana Drought & Climate
 Montana Drought & Climate MARCH 219 MONITORING AND FORECASTING FOR AGRICULTURE PRODUCERS A SERVICE OF THE MONTANA CLIMATE OFFICE IN THIS ISSUE IN BRIEF PAGE 2 REFERENCE In a Word PAGE 3 REVIEW Winter 219:
3.0 TECHNICAL FEASIBILITY
 3.0 TECHNICAL FEASIBILITY 3.1 INTRODUCTION To enable seasonal storage and release of water from Lake Wenatchee, an impoundment structure would need to be constructed on the lake outlet channel. The structure
The Pennsylvania Observer
 The Pennsylvania Observer October 1, 2015 September 2015 - Pennsylvania Weather Recap By: Quinn Lease The month of September will be remembered for its above normal temperatures and dry conditions that
2018 Year in Review for Central and Southeast Illinois By: Chris Geelhart, Meteorologist National Weather Service, Lincoln IL
 By: Chris Geelhart, Meteorologist National Weather Service, Lincoln IL While 2018 featured some significant out-of-season weather, including below zero temperatures in April and 90-degree highs in early
KANSAS CLIMATE SUMMARY August 2015
 KANSAS CLIMATE SUMMARY August 2015 Cool and Dry August was drier than normal in most of the state. State-wide average precipitation was 2.80 inches or 85 percent of normal. The Northeast division of the
NIDIS Drought and Water Assessment
 NIDIS Drought and Water Assessment PRECIPITATION The images above use daily precipitation statistics from NWS COOP, CoCoRaHS, and CoAgMet stations. From top to bottom, and left to right: most recent 7-days
Midwest and Great Plains Drought and Climate Summary 20 February 2014
 Midwest and Great Plains Drought and Climate Summary 20 February 2014 Wendy Ryan Assistant State Climatologist Colorado Climate Center Colorado State University wendy.ryan@colostate.edu 970-491-8506 General
NIDIS Intermountain West Drought Early Warning System April 18, 2017
 1 of 11 4/18/2017 3:42 PM Precipitation NIDIS Intermountain West Drought Early Warning System April 18, 2017 The images above use daily precipitation statistics from NWS COOP, CoCoRaHS, and CoAgMet stations.
Flood Risk Assessment
 Flood Risk Assessment February 14, 2008 Larry Schick Army Corps of Engineers Seattle District Meteorologist General Assessment As promised, La Nina caused an active winter with above to much above normal
2015 Fall Conditions Report
 2015 Fall Conditions Report Prepared by: Hydrologic Forecast Centre Date: December 21 st, 2015 Table of Contents Table of Figures... ii EXECUTIVE SUMMARY... 1 BACKGROUND... 2 SUMMER AND FALL PRECIPITATION...
NWS FORM E-5 U.S. DEPARTMENT OF COMMERCE I HYDRO SERVICE AREA NOAA, NATIONAL WEATHER SERVICE I Indianapolis, IN MONTHLY REPORT
 NWS FORM E-5 U.S. DEPARTMENT OF COMMERCE I HYDRO SERVICE AREA NOAA, NATIONAL WEATHER SERVICE I Indianapolis, IN. 1-------------------- MONTHLY REPORT OF RIVER AND FLOOD CONDITIONSI REPORT FOR I November
Highlights of the 2006 Water Year in Colorado
 Highlights of the 2006 Water Year in Colorado Nolan Doesken, State Climatologist Atmospheric Science Department Colorado State University http://ccc.atmos.colostate.edu Presented to 61 st Annual Meeting
The Pennsylvania Observer
 The Pennsylvania Observer May 31, 2012 May 2012 - Pennsylvania Weather Recap By: Paul Knight The majority of the fifth month had temperatures averaging well above seasonal levels with two distinct hot
The Weather Wire. Contents: Summer 2018 Outlook. Summer 2018 Outlook Drought Monitor May Summary/Statistics June Preview Rainfall Totals
 The Weather Wire June 2018 Volume 25 Number 6 Contents: Summer 2018 Outlook Drought Monitor May Summary/Statistics June Preview Rainfall Totals Summer 2018 Outlook June 1 st marked the first day of meteorological
Wind River Indian Reservation and Surrounding Area Climate and Drought Summary
 Northern Arapaho Tribe Wind River Indian Reservation and Surrounding Area Climate and Drought Summary Winter Events & Spring Outlook 2015-2016 Winter Was Warm And Dry Winter was warm and dry for the Wind
Midwest and Great Plains Climate- Drought Outlook 17 April 2014
 Midwest and Great Plains Climate- Drought Outlook 17 April 2014 Dr. Dennis Todey State Climatologist South Dakota State Univ. dennis.todey@sdstate.edu 605-688-5141 Photo taken Feb 19, 2013 Tornado-Trenton,