ALL PRESSURE VARIABLES AND STATION MODELS MEGA PACKET
|
|
|
- Gloria Stanley
- 5 years ago
- Views:
Transcription
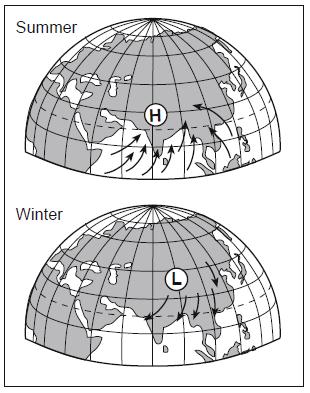
1 NAME: MEGA PACKET 1. A change in the type and location of large high-pressure systems (H) and large low-pressure systems ( L) over Asia creates shifts in prevailing winds that cause a rainy summer season and a dry winter season in southern Asia. Which set of maps below best represents the type and location of pressure systems and the wind pattern around these pressure systems that cause these seasonal changes? A)
2 B) C)
3 D)
. Letter X represents a location on Earth's surface on December 8, 20")
4 Base your answers to questions 2 through 6 on the weather maps below and on your knowledge of Earth science. The weather maps show the eastern United States on two consecutive days. Some isobars are labeled in millibars (mb). Letter X represents a location on Earth's surface on December 8, Which information shown on the weather maps best indicates that wind speeds in New York State were greater on December 9 than on December 8? A) The isobars were closer together on December 9. B) The fronts were closer together on December 9. C) The air pressure over New York State was lower on December 9. D) The air pressure over New York State was higher on December Which type of front was located just south of New York City on December 9? A) cold B) warm C) stationary D) occluded 4. In which direction did the high-pressure center move from December 8, 2009, to December 9, 2009? A) southwest B) southeast C) northwest D) northeast


5 5. Which map best shows the general surface wind pattern around the high-pressure system on December 8? A) B) C) D) 6. What was the barometric pressure for location X on December 8? A) 1016 mb B) 1012 mb C) 1008 mb D) 1004 mb

6 7. The map below indicates an air-pressure field over North America. Isobar values are recorded in millibars. At which city was the greatest wind speed occurring? A) Boise B) Denver C) Kansas City D) Austin
7 8. The map below shows air pressures recorded in millibars (mb). Which map shows the correct location of the 996-mb, 1000-mb, and 1004-mb isobars? A) B) C) D) 9. What is the average air pressure exerted by Earth's atmosphere at sea level, expressed in millibars and inches of mercury? A) mb and in of Hg B) mb and in of Hg C) mb and in of Hg D) mb and in of Hg
 and a low-pressure center (L) over a portion of North America.")
8 Base your answers to questions 10 through 13 on the weather map below, which shows the locations of a high-pressure center (H) and a low-pressure center (L) over a portion of North America. The isolines indicate surface air pressures.


9 A) 10. The arrows on which map show the most likely path in which these two pressure centers will move over the next few days? B) C) D)


10 A) 11. The arrows on which map best show the pattern of surface winds around these two pressure centers? B) C) D)

 C) D) 13.")

11 A) 12. Which map shows the most likely location of clouds associated with these pressure centers? B) C) D) 13. The data used to construct the isolines on this map were recorded in which units? A) inches B) millibars C) feet D) meters


12 14. Which weather variable generally decreases when wind speed is increasing, clouds are thickening, and visibility drops? A) relative humidity B) dewpoint C) precipitation D) air pressure Base your answers to questions 15 and 16 on the weather map below, which represents a low-pressure system over New York State. The L on the map represents the center of the low-pressure system. Two fronts extend from the center of the low, and are labeled front 1 and front 2. Cloud cover has been omitted from the station models. 15. Which map best represents the type of fronts and direction of movement of these fronts in relation to the low-pressure center? A) B) C) D)


13 16. The arrows on which map best represent the surface wind pattern around this low-pressure center? A) B) C) D) 17. The weather map below shows isobars labeled in millibars. Points A, B, C, and D are locations on Earth's surface. Which location was probably experiencing the highest wind speed? A) A B) B C) C D) D
 4-millibar air-pressure difference between two nearby locations B) 4-millibar air-pressure difference between two distant locations C)")
 dewpoint B) wind speed C) air pressure D) visibility 21. Air pressure is usually highest when the air is A) cool and humid B) cool and dry C) warm and humid D) warm and dry 22.")
14 18. Which cross section below best shows the locations of high air pressure and low air pressure near a beach on a hot, sunny, summer afternoon? A) B) C) D) 19. The highest surface wind speeds occur when there is a A) 4-millibar air-pressure difference between two nearby locations B) 4-millibar air-pressure difference between two distant locations C) 20-millibar air-pressure difference between two nearby locations D) 20-millibar air-pressure difference between two distant locations 20. Which weather variable is measured by a barometer? A) dewpoint B) wind speed C) air pressure D) visibility 21. Air pressure is usually highest when the air is A) cool and humid B) cool and dry C) warm and humid D) warm and dry 22. Which weather variable would most likely decrease ahead of an approaching storm system? A) wind speed B) air pressure C) cloud cover D) relative humidity
15 A) 23. Which graph best represents the change in air pressure as air temperature increases at Earth's surface? B) C) D)

 wind direction B) air pressure C) wind speed D) amount of rainfall The air pressure at the ocean surface a few miles from the shore is most likely A) 994 mb B) 1005 mb C) 1013 mb D) 1017 mb 27.")
16 24. Adjacent water and landmasses are heated by the morning Sun on a clear, calm day. After a few hours, a surface wind develops. Which map best represents this wind's direction? A) B) C) D) 25. An instrument used to measure a weather variable is shown below. 26. The cross section below shows a sea breeze blowing from the ocean toward the land. The air pressure at the land surface is 1013 millibars. Which weather variable is measured by this instrument? A) wind direction B) air pressure C) wind speed D) amount of rainfall The air pressure at the ocean surface a few miles from the shore is most likely A) 994 mb B) 1005 mb C) 1013 mb D) 1017 mb 27. A barometric pressure of millibars is equal to how many inches of mercury? A) B) C) D) Earth s surface winds generally blow from regions of higher A) air temperature toward regions of lower air temperature B) air pressure toward regions of lower air pressure C) latitudes toward regions of lower latitudes D) elevations toward regions of lower elevations
 high-pressure funnel clouds that spin counterclockwise 30. Which weather condition most directly determines wind speeds at Earth s surface?")
17 29. In the United States, most tornadoes are classified as intense A) low-pressure funnel clouds that spin clockwise B) low-pressure funnel clouds that spin counterclockwise C) high-pressure funnel clouds that spin clockwise D) high-pressure funnel clouds that spin counterclockwise 30. Which weather condition most directly determines wind speeds at Earth s surface? A) visibility changes B) amount of cloud cover C) air-pressure gradient D) dewpoint differences Base your answers to questions 31 and 32 on the weather map below, which shows a low-pressure system centered near Poughkeepsie, New York. Isobars shown are measured in millibars. 31. Surface winds are most likely blowing from A) Danbury toward New York City B) Poughkeepsie toward Scranton C) Binghamton toward Danbury D) Port Jervis toward Binghamton 32. Which city is most likely experiencing winds of the greatest velocity? A) New York City B) Binghamton C) Poughkeepsie D) Scranton
 1009.0 mb B) 1012.5 mb C) 1015.")
18 33. The diagram below represents an aneroid barometer that shows the air pressure, in inches of mercury. 35. Various weather conditions at LAX Airport in Los Angeles are shown on the station model below. When converted to millibars, this air pressure is equal to A) mb B) mb C) mb D) mb 34. The table below shows air-pressure readings taken at two cities, in the same region of the United States, at noon on four different days. What were the barometric pressure and weather conditions at the airport at the time of the observation? A) mb of pressure and smog B) mb of pressure and a clear sky C) mb of pressure and smog D) mb of pressure and a clear sky The wind speed in the region between cities A and B was probably the greatest at noon on day A) 1 B) 2 C) 3 D) 4
 1014 mb B) 1012 mb C) 1010 mb D) 1006 mb 37.")
19 Base your answers to questions 36 and 37 on the map below, which shows sea-level air pressure, in millibars, for a portion of the eastern coast of North America. Points A, B, C, and D are sea-level locations on Earth's surface. 36. The air pressure recorded at point D was most likely A) 1014 mb B) 1012 mb C) 1010 mb D) 1006 mb 37. Which weather instrument was used to measure the air pressures? A) thermometer B) wind vane C) sling psychrometer D) barometer 38. Surface winds on Earth are primarily caused by differences in A) air density due to unequal heating of Earth s surface B) ocean wave heights during the tidal cycle C) rotational speeds of Earth s surface at various latitudes D) distances from the Sun during the year

20 39. The air-pressure field map below represents a high-pressure system over the central United States. Isobars show the air pressure, in millibars. Letters A through E represent locations on Earth's surface. 42. Wind is caused mainly by air-pressure differences that result from A) uneven heating of Earth's atmosphere B) absorption of ultraviolet radiation by Earth's landmasses C) radiation of heat from Earth's landmasses to water bodies D) rotation of Earth on its axis 43. The cartoon below shows a strong wind blowing from right to left. Between which two locations is the wind speed greatest? A) A and B B) B and C C) C and D D) D and E Base your answers to questions 40 and 41 on the weather map below. Points A, B, C, and D are locations on Earth's surface. 40. The strongest winds are closest to location A) A B) B C) C D) D 41. The isolines on the map represent values of air A) density B) humidity C) pressure D) temperature The wind is blowing from right to left because the region to the right has a higher A) air temperature B) air pressure C) relative humidity D) elevation 44. As warm, moist air moves into a region, barometric pressure readings in the region will generally A) decrease B) increase C) remain the same 45. Air pressure is usually highest when the air is A) warm and humid B) warm and dry C) cold and humid D) cold and dry
21 46. Which graph best represents the relationship between air temperature and air density in the atmosphere? A) B) 49. A high-pressure center is generally characterized by A) cool, wet weather B) cool, dry weather C) warm, wet weather D) warm, dry weather 50. The graph below shows air temperature for an area near the Earth's surface during a 12-hour period. C) D) Base your answers to questions 47 and 48 on the diagram below of a weather instrument. Which graph best illustrates the probable change in air pressure during the same time period? A) B) C) 47. In Connecticut, which weather conditions are most likely to exist when the height of the mercury in the tube is much greater than 30 inches? A) cold, dry air with clear skies B) warm, moist air with overcast skies C) strong southerly winds with hail warnings D) a violent storm associated with the autumn season 48. Which weather variable is this instrument designed to measure? A) visibility B) relative humidity C) dewpoint temperature D) air pressure D) 51. Which factor most directly affects the wind speed between two locations? A) air pressure B) Coriolis force C) dewpoint temperature D) cloud cover
22 52. Base your answer to the following question on the diagram below. The diagram shows the pattern of air movement within a closed room. 57. Base your answer to the following question on the data table below, which shows the air pressures and air temperatures collected by nine observers at different elevations on the same side of a high mountain. The data were collected at 12:00 noon on a clear, calm day. If the room is considered a model of circulation in the Earth's atmosphere, at which location would air pressure be greatest? A) A B) B C) E D) F 53. An air pressure of 1,005 millibars is equivalent to approximately how many inches of mercury? A) B) C) D) A weather map of New York State shows isobars that are close together, indicating a steep pressure gradient. Which weather condition is most likely present? A) dry air B) strong winds C) low temperatures D) low visibility 55. On a July afternoon in Florida, the barometric pressure is inches and falling. This reading most likely indicates A) an approaching storm B) rapidly clearing skies C) continuing fair weather D) gradually improving conditions 56. An air pressure of inches of mercury is equal to A) 996 mb B) 998 mb C) 1,002 mb D) 1,014 mb From sea level to an elevation of 1,200 meters, air pressure decreased at the rate of A) 1.0 mb/m B) 0.1 mb/m C) 10.0 mb/m D) mb/m 58. The weather map below shows closely spaced isobars in the region of Albany, New York. At the time that the weather data were collected, Albany was most probably experiencing A) a high wind velocity B) a high temperature C) the passage of a dry air mass D) the passage of a warm air mass
 and large low-pressure systems (L) over Asia creates shifts in prevailing winds that cause a rainy summer season and a dry winter")
23 59. Wind velocity is most directly dependent on the A) gradient of the air pressure field B) value of the Coriolis effect C) moisture content of the air D) rotational velocity of the Earth 60. A change in the type and location of large high-pressure systems (H) and large low-pressure systems (L) over Asia creates shifts in prevailing winds that cause a rainy summer season and a dry winter season in southern Asia. Which set of maps below best represents the type and location of pressure systems and the wind pattern around these pressure systems that cause these seasonal changes? A) B) C) D) 61. As wind velocity decreases, the distance between isobars on a weather map will A) decrease B) increase C) remain the same 62. As the temperature of the atmosphere at a given location increases, the air pressure will most likely A) decrease B) increase C) remain the same
 north B) south C) east D) west 64. The graph below shows the surface air pressure at a certain city during a five-day period.")
24 63. The diagram below shows the isolines of air pressure around a low-pressure center. On which side of the low-pressure center will the wind speed be greatest? 66. The map below shows the location of India and the Indian Ocean. A) north B) south C) east D) west 64. The graph below shows the surface air pressure at a certain city during a five-day period. On which day was the warmest airmass probably over the city for the entire day? A) Monday B) Tuesday C) Wednesday D) Friday 65. In a certain area the air temperature and the dewpoint temperature are approaching the same value. The air pressure is decreasing and the cloud cover is increasing. What atmospheric change is most likely occurring in this area? A) Warm, moist air is moving into the area. B) Warm, dry air is moving into the area. C) Cold, dry air is moving into the area. D) A cold front has just passed through this area. Which statement best describes the monsoon winds during the rainy season in India? A) Warm, moist air flows from India to the Indian Ocean. B) Warm, moist air flows from the Indian Ocean to India. C) Cold, dry air flows from India to the Indian Ocean. D) Cold, dry air flows from the Indian Ocean to India. 67. Which map best represents the surface wind pattern around Northern Hemisphere high-pressure and low-pressure centers? A) B) C) D)
25 68. Which current has a cooling effect on the climate of the west coast of South America? A) Falkland Current B) Peru Current C) Benguela Current D) Brazil Current 69. The diagram below shows a weather instrument found at most weather stations. The main function of this instrument is to measure which weather variable? A) wind speed B) wind direction C) air pressure D) relative humidity 70. A low-pressure system in the Northern Hemisphere has a surface air-circulation pattern that is A) clockwise and away from the center B) clockwise and toward the center C) counterclockwise and away from the center D) counterclockwise and toward the center


26 A) 71. Which map best represents the surface wind pattern associated with high-pressure and low-pressure systems in the Northern Hemisphere? B) C) D)
27 A) 72. Which map best represents the surface wind pattern around a Northern Hemisphere high-pressure center? B) C) D)

28 73. Base your answer to the following question on the water cycle diagram shown below. Some arrows are numbered 1 through 4 and represent various processes. Which atmospheric condition is most likely responsible for the wind blowing the clouds from the sea toward the land? A) high air temperature over the sea and low air temperature over the land B) high air pressure over the sea and low air pressure over the land C) low air density over the sea and high air density over the land D) low visibility over the sea and high visibility over the land 74. The surface winds in a typical Northern Hemisphere high-pressure system are generally moving A) counterclockwise away from the high-pressure center B) counterclockwise toward the high-pressure center C) clockwise away from the high-pressure center D) clockwise toward the high-pressure center
29 A) 75. Which map view best represents the pattern of isobar values, in millibars, and the pattern of wind flow, shown by arrows, at Earth's surface surrounding a Northern Hemisphere low-pressure center? B) C) D)


30 76. Which map best represents the direction of surface winds associated with the high-pressure and low-pressure systems? A) B) C)

 Summer is cooler and less humid than winter.")
31 D) 77. The arrows on the two maps below show how the monsoon winds over India change direction with the seasons. How do these winds affect India's weather in summer and winter? A) Summer is cooler and less humid than winter. B) Summer is warmer and more humid than winter. C) Winter is warmer and less humid than summer. D) Winter is cooler and more humid than summer.
 C) D) 79.")


32 A) 78. Adjacent land and ocean surfaces have the same temperature at sunrise on a clear, calm, summer day. Then the land and water are heated by the Sun for several hours. Which cross section shows the most likely direction of surface winds that will develop at this ocean shore? B) C) D) 79. Which map view best shows the movement of surface air around a low-pressure system in the Northern Hemisphere? A) B) C) D) 80. In which direction do surface winds around lowpressure centers in the Northern Hemisphere generally move? A) counterclockwise, toward the center of the low B) clockwise, toward the center of the low C) counterclockwise, away from the center of the low D) clockwise, away from the center of the low 81. On a certain day, the isobars on a weather map are very close together over eastern Kentucky. To make the people of this area aware of possible risk to life and property in this situation, the National Weather Service should issue A) a dense-fog warning B) a high-wind advisory C) a heat-index warning D) an air-pollution advisory
33 82. Which diagram best illustrates a map view of the motion of lower level winds in a Northern Hemisphere hurricane? A) B) C) D) 87. In the Northern Hemisphere, what is the direction of surface wind circulation in a low-pressure system? A) counterclockwise and outward from the center B) counterclockwise and toward the center C) clockwise and outward from the center D) clockwise and toward the center 88. Which map correctly shows the wind directions of the high-pressure and low-pressure systems? A) 83. In the Northern Hemisphere, in which direction does surface wind circulate in a high-pressure air mass? A) clockwise and toward the center B) clockwise and away from the center C) counterclockwise and toward the center D) counterclockwise and away from the center 84. The air over the Equator generally rises because the air is A) dry and cool with low density B) moist and hot with low density C) moist and cool with high density D) dry and hot with high density 85. Winds are blowing from high-pressure to low-pressure systems over identical ocean surfaces.which diagram represents the area of greatest windspeed? [Arrows indicate wind direction.] A) B) C) D) B) C) D) 89. Which diagram below best represents the air circulation around a Northern Hemisphere low-pressure center? A) B) 86. In the Northern Hemisphere, in which direction does surface wind circulate in a high-pressure air mass? A) clockwise and toward the center B) clockwise and away from the center C) counterclockwise and toward the center D) counterclockwise and away from the center C) D)
34 90. Which area is the most common source region for cold, dry air masses that move over New York State? A) North Atlantic Ocean B) Gulf of Mexico C) central Canada D) central Mexico 91. Base your answer to the following question on the image below. Locations A and B on the map of North America below are source regions for air masses. 93. Which air mass is associated with low relative humidity and high air temperature? A) maritime polar B) maritime tropical C) continental polar D) continental tropical 94. An air mass classified as ct usually forms over which type of Earth surface? A) cool water B) cool land C) warm water D) warm land Compared to the air mass formed at location B, the air mass formed at location A will normally be A) cooler and drier B) cooler and wetter C) warmer and drier D) warmer and wetter 92. Most of the air in the lower troposphere at the equatorial low-pressure belt is A) warm, moist, and rising B) warm, dry, and rising C) cool, moist, and sinking D) cool, dry, and sinking


35 95. Which map shows the two correctly labeled air masses that frequently converge in the central plains to cause tornadoes? A) B)
 rate of Earth s rotation B) direction of Earth s surface winds C) source region where the air mass formed D) path the air mass follows")
36 C) D) 96. The properties of an air mass are mostly determined by the A) rate of Earth s rotation B) direction of Earth s surface winds C) source region where the air mass formed D) path the air mass follows along a land surface 97. Which geographic area is a common source region for cp air masses that move into New Jersey? A) southwestern United States B) central Canada C) the north Pacific Ocean D) the Gulf of Mexico
37 98. The graph below shows changes in the atmosphere occurring above typical air-mass source regions A, B, C, and D. Changes in air temperature and altitude are shown as the graphed lines. Changes in water-vapor content, in grams of vapor per kilogram of air, are shown as numbers on each graphed line. Which list best identifies each air-mass source region? A) A ct, B cp, C mp, D mt B) A cp, B mp, C mt, D ct C) A mp, B mt, C ct, D cp D) A mt, B ct, C cp, D mp 99. An air mass classified as mp usually forms over which type of Earth surface? A) warm land B) warm ocean C) cool land D) cool ocean 100. An Earth science student observed the following weather conditions in Albany, New York, for 2 days: The first day was warm and humid with southerly winds. The second day, the temperature was 15 degrees cooler, the relative humidity had decreased, and wind direction was northwest. Which type of air mass most likely had moved into the area on the second day? A) continental tropical B) continental polar C) maritime tropical D) maritime polar
38 101. Base your answer to the following question on the weather map of North America below. The map shows the location of a front and the air mass influencing its movement. Which region is the probable source of the air mass labeled cp on the map? A) central Canada B) southwestern United States C) North Atlantic Ocean D) Gulf of Mexico 102. In Connecticut, dry, cool air masses (cp) often interact with moist, warm air masses (mt). Which statement correctly matches each air mass with its usual geographic source region? A) cp is from the North Atlantic Ocean and mt is from the deserts of the southwestern United States. B) cp is from northern Canada and mt is from the deserts of the southwestern United States. C) cp is from northern Canada and mt is from the Gulf of Mexico. D) cp is from the North Atlantic Ocean and mt is from the Gulf of Mexico An air mass classified as mt usually forms over which type of Earth surface? A) cool land B) cool water C) warm land D) warm water
39 104. Base your answer to the following question on the weather map below, which shows a weather system that is affecting part of the United States. Compared to the air over most of the map region, the air mass centered over Alabama is A) warmer and more humid B) warmer and drier C) colder and more humid D) colder and drier 105. An airmass originating over north central Canada would most likely be A) warm and dry B) warm and moist C) cold and dry D) cold and moist 106. An air mass that originates over the northern Pacific Ocean and moves southward over the United States would most likely be labeled on a weather map as A) mp B) mt C) cp D) ct 107. In which geographic region are air masses most often warm with a high moisture content? A) Central Canada B) Central Mexico C) Gulf of Mexico D) North Pacific Ocean 108. Which symbol would be used to identify an airmass originating in central Canada? A) mt B) mp C) ct D) cp 109. A large rainstorm follows the usual direction of movement of a weather system across the United States. Which part of New York State will receive rain from the storm first? A) northwestern B) northeastern C) southwestern D) southeastern 110. Compared to a maritime tropical air mass, a continental polar air mass is A) cooler and contains less moisture B) cooler and contains more moisture C) warmer and contains less moisture D) warmer and contains more moisture
 cooler and drier B) cooler and wetter C) warmer and drier D) warmer and wetter 112.")
 lake-effect snowstorm B) tornado C) warm, sunny weather D) hurricane 113.")
40 111. Locations A and B on the map of North America below are source regions for air masses An airmass originates with its center located at 25 N and 90 W. Compared to the air mass formed at location B, the air mass formed at location A will normally be A) cooler and drier B) cooler and wetter C) warmer and drier D) warmer and wetter 112. In winter, a cold, dry air mass from Canada moves across Lake Ontario. The air over the lake is warmer and more humid than the air over the land. Which weather condition is most likely to occur as the air mass reaches Oswego? A) lake-effect snowstorm B) tornado C) warm, sunny weather D) hurricane 113. Which abbreviation indicates a warm air mass that contains large amounts of water vapor? A) cp B) ct C) mt D) mp Based on the map, this air mass would be classified as A) cp B) mp C) ct D) mt 115. The weather map below shows a frontal system that has followed a typical storm track. The air mass located over point X most likely originated over the A) northern Atlantic Ocean B) central part of Canada C) Gulf of Mexico D) Pacific Northwest
41 A) North Atlantic Ocean B) Gulf of Mexico C) central Canada D) central Mexico 116. Which area is the most common source region for cold, dry air masses that move over New York State? 117. An mp air mass is located over the northwestern part of the United States. The source region of this air mass is most likely A) central Mexico B) the Gulf of Mexico C) northern Canada D) the North Pacific Ocean 118. On a weather map, an airmass that is very warm and dry would be labeled A) mp B) mt C) cp D) ct 119. An air mass originating over the North Pacific Ocean would most likely be A) continental polar B) continental tropical C) maritime polar D) maritime tropical 120. The properties of an airmass depend mainly on the A) wind speed within the airmass B) characteristics of the surface over which the airmass was formed C) size of the airmass D) rotation of the Earth


42 121. The map below shows a position of the polar jet stream over North America in January. Which map best shows the air-mass movements associated with this jet stream position? A) B) C) D)


")
 north to south")


43 122. Which weather instrument is used to determine wind direction? A) B) C) D) 123. Jet stream winds over the United States generally move from A) east to west B) west to east C) north to south D) south to north 124. Which map shows normal paths followed by low-pressure storm centers as they pass across the United States? A) B) C) D)
 A B) B C) C D) D 126.")
44 Base your answers to questions 125 through 128 on the weather map below, which shows a low-pressure system over the central United States. Isobars are labeled in millibars. Points A, B, C, and D represent locations on Earth's surface Which location is most likely experiencing the fastest wind speed? A) A B) B C) C D) D 126. The air pressure at the center of this low is A) 991 mb B) 994 mb C) 997 mb D) 1001 mb 127. The circulation of surface winds associated with this low-pressure system is A) clockwise and toward the center of the low B) clockwise and away from the center of the low C) counterclockwise and toward the center of the low D) counterclockwise and away from the center of the low

45 128. Which map shows the most likely path this low-pressure center will follow during the next 12 hours? A) B) C)

46 D) 129. If a low-pressure system follows a typical storm track across New York State, it will move toward the A) southeast B) southwest C) northeast D) northwest 130. Base your answer to the following question on the weather map below and on your knowledge of Earth science. The weather map shows a typical low-pressure system and associated weather fronts labeled A and B. The L indicates the center of the low-pressure system. A few New York State cities are shown. Symbols cp and mt represent different air masses. The wind direction at Utica and Rochester is shown on the station models. If this weather system is following a normal storm track, the center of this low is most likely moving toward which city? A) Buffalo B) Ithaca C) Utica D) Plattsburgh
47 131. Base your answer to the following question on the weather map below. The map shows a low-pressure system and some atmospheric conditions at weather stations A, B, and C. If this weather system follows a normal storm track, the low-pressure center (L) will generally move toward the A) northeast B) northwest C) southeast D) southwest 132. In which map does the arrow show the general direction that most low-pressure storm systems move across New York State? A) B) C) D)
48 133. The map below shows the average number of thunderstorms each year in the continental United States. The average number of thunderstorms that occur each year in Albany, New York is approximately A) 15 B) 25 C) 35 D) 45
49 Base your answers to questions 134 through 138 on the weather map and barogram below. The weather map shows a hurricane that was located over southern Florida. The isobars show air pressure in inches of mercury. Letter A represents a point near the west coast of Florida. The barogram shows the recorded air pressure in inches of mercury as the hurricane passed near Miami, Florida.

 B) C) D) 137.")
 27.60 in C) 27.75 in D) 28.60 in 138.")
50 134. Which map shows the most likely track of this hurricane? A) B) C) D) 135. Which type of air mass would most likely be the source of the moisture that causes the strong winds and heavy rain associated with this hurricane? A) cp B) ct C) mp D) mt 136. Which station model best represents the weather conditions at point A? A) B) C) D) 137. What was the lowest air pressure recorded on the barogram as the hurricane passed near Miami? A) in B) in C) in D) in 138. What is the latitude and longitude at the center of the hurricane? A) 26 N 81 W B) 26 N 89 W C) 34 N 81 W D) 34 N 89 W
 southeast B) northeast C) southwest D) northwest 140.")
51 139. The map below shows a low-pressure system located over an area in the south-central United States The station model below shows some weather conditions at a location on Earth's surface. In the next few days, because of the prevailing winds, the air mass will probably move toward the A) southeast B) northeast C) southwest D) northwest 140. Which station model represents a location that has the greatest chance of precipitation? A) B) Which present weather symbol represents the most likely type of precipitation occurring at this location? A) B) C) D) C) D) 141. The weather station model shown below indicated that winds are coming from the A) southeast at 10 knots B) northwest at 10 knots C) southeast at 20 knots D) northwest at 20 knots


52 143. Which station model shows an air temperature of 75 F and a barometric pressure of mb? A) B) C) D) 144. The weather station model below shows some of the weather data for a certain location. What is the wind speed shown on the station model and which instrument is used to measure the wind speed? A) 15 knots, measured by a wind vane B) 15 knots, measured by an anemometer C) 25 knots, measured by a wind vane D) 25 knots, measured by an anemometer 145. A weather station model is shown below Liquid water sometimes turns into ice when it comes in contact with Earth's surface. Which present weather symbol on a station model represents this type of precipitation? A) B) C) D) Which information shown on the station model is most closely associated with measurements from an anemometer? A) B) C) D)


53 147. Which set of instruments is correctly paired with the weather variables that they measure? A) B) C) D) 148. The station model below shows several weather variables recorded at a particular location. What was the most likely dewpoint at this location? A) 32 F B) 40 F C) 61 F D) 70 F 149. Which station model shows a wind direction from the southeast? A) B) C) D)
54 150. Weather station models for three New York State cities on the same day at the same time are shown below. Which map shows the front that was most likely passing through Rochester at that time? A) B)
55 C) D)

 1015.0 mb B) 1017.0 mb C) 102l.0 mb D) 1036.0 mb 153.")
56 Base your answers to questions 151 through 154 on the weather map below. The map shows isobars and seven weather station models. Four of the weather stations are identified by letters A, B, C, and D Which weather information shown at station B was measured with an anemometer and weather vane? A) 34 B) C) D) What was the probable air pressure, in millibars, at station D? A) mb B) mb C) 102l.0 mb D) mb 153. Which weather station had the highest relative humidity? A) A B) B C) C D) D 154. Which New York State weather station had clear skies? A) Albany B) Buffalo C) New York City D) Syracuse
57 155. What are the dewpoint and wind direction shown on the station model below? A) 72 F and wind from the northeast B) 72 F and wind from the southeast C) 74 F and wind from the northwest D) 74 F and wind from the southwest 156. Weather data is normally recorded at positions A, B, C, and D on the weather station model shown below. At which position should the measurements from a rain gauge be recorded? A) A B) B C) C D) D Base your answers to questions 157 through 159 on on the station models below, which show various weather conditions recorded at the same time on the same day at four different cities Which weather symbol best represents the type of precipitation that was most likely occurring in Utica? A) B) C) D) 158. Which city had the lowest relative humidity? A) Chicago B) Detroit C) Buffalo D) Utica 159. Which wind speed was recorded at Detroit? A) 15 knots B) 25 knots C) 35 knots D) 45 knots

58 Base your answers to questions 160 through 162 on the weather map below, which shows a low-pressure system over the eastern United States. Letters A through D represent weather stations Surface winds within this low-pressure system most likely are flowing A) toward the center in a clockwise pattern B) toward the center in a counterclockwise pattern C) away from the center in a clockwise pattern D) away from the center in a counterclockwise pattern 161. Which weather instrument was used to measure wind speed at station D? A) barometer B) thermometer C) psychrometer D) anemometer 162. Which station model correctly represents the barometric pressure at station A? A) B) C) D) 163. On which station model would the present weather symbol * most likely be found? A) B) C) D)
59 164. Which station model correctly represents the weather conditions in an area that is experiencing winds from the northeast at 25 knots and has had a steady drop in barometric pressure of 2.7 millibars during the last three hours? A) B) C) D) 165. A weather station model is shown below. What is the barometric pressure indicated by this station model? A) mb B) mb C) mb D) mb 166. Base your answer to the following question on the graph below, which shows air temperature, dewpoint, and present weather conditions for a 23-hour period at Dallas, Texas. Which weather condition was reported at Dallas when the air temperature was equal to the dewpoint? A) fog B) rain C) thunderstorm D) drizzle
60 167. Which station model shows the correct form for indicating a northwest wind at 25 knots and an air pressure of mb? A) B) C) D) 168. Which weather-station model shows an air pressure of millibars? A) 169. Which weather station model shows the highest relative humidity? A) B) B) C) D) C) D)
61 170. The station model below shows the weather conditions at Houston, Texas, at 9 a.m. on a particular day in June Which station model represents a location that is currently receiving some form of precipitation? A) B) C) D) What was the barometric pressure at Houston 3 hours earlier on that day? A) mb B) mb C) mb D) mb 171. What is the visibility, in miles, shown on the station model below? A) 10 B) 28 C) 38 D) What is the air pressure indicated on the weather station model shown below? A) mb B) mb C) mb D) mb

62 174. Base your answer to the following question on the weather map below, which shows a hurricane that was located over southern Florida. The isobars show air pressure in inches of mercury. Letters A through D represent four widely separated locations. Which station model best represents some of the atmospheric conditions at location A? A) B) C) D)

 177.")

 B) B) C) D) C) 178.")


 B) 179.")

63 175. Which station model correctly shows the weather conditions of a thunderstorm with heavy rain? A) 177. Which weather station model indicates the highest relative humidity? A) B) B) C) D) C) 178. At which weather station is visibility greatest? A) B) C) D) D) 176. Which weather station model indicates the greatest probability of precipitation? A) B) 179. Which weather station model represents a location where a thunderstorm is occurring? A) B) C) D) C) D)

 B) C) D) 182.")
64 180. Which weather station model represents the location with the greatest probability of precipitation? A) 183. A weather station records a barometric pressure of millibars. Which diagram below would best represent this weather station on a weather map? A) B) B) C) D) C) D) 181. Which station model represents an atmospheric pressure of 1,009.2 millibars and a temperature of 75 F? A) B) C) D) 182. Which station model represents a location that has the greatest chance of precipitation? A) B) C) D)


65 184. The cross section below represents a prevailing wind flow that causes different climates on the windward and leeward sides of a mountain range. Compared to the temperature and moisture of the air rising on the windward side, the temperature and moisture of the air descending at the same altitude on the leeward side will be A) warmer and drier B) warmer and more moist C) cooler and drier D) cooler and more moist 185. The cross section below represents prevailing winds moving over a coastal mountain range. Letters A through D represent locations on Earth's surface. Which location will most likely have the least annual precipitation? A) A B) B C) C D) D
 lower temperatures and less precipitation B) lower")

66 186. The cross section below shows two cities, A and B at different elevations. Compared to the yearly temperature and precipitation at city B, city A most likely has A) lower temperatures and less precipitation B) lower temperatures and more precipitation C) higher temperatures and less precipitation D) higher temperatures and more precipitation 187. The diagram below shows the flow of air over a mountain, from location A to B to C. Which graph best shows how the air temperature and probability of precipitation change during this air movement? A) B) C) D)
 drier and warmer B) drier and cooler C) more humid and warmer D) more humid and")

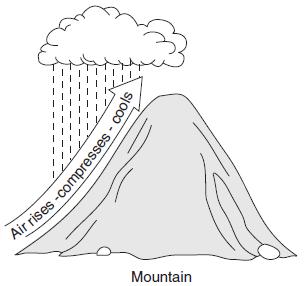
67 188. The diagram below shows air movement over a mountain. Compared to the climate on the windward side of the mountain, the climate on the leeward side of the mountain is A) drier and warmer B) drier and cooler C) more humid and warmer D) more humid and cooler Base your answers to questions 189 and 190 on the diagram below, which shows air movement over a mountain range. The arrows indicate the direction of airflow. Points 1 through 3 represent locations on Earth's surface Cloud formation at location 2 is the direct result of air that is rising, A) expanding, and cooling B) expanding, and warming C) compressing, and cooling D) compressing, and warming 190. Compared to the climate at location 1, the climate at location 3 is A) cooler and drier B) cooler and wetter C) warmer and drier D) warmer and wetter

 warmer and wetter 192. The diagram below shows how prevailing winds cause different weather conditions on the windward and leeward sides of a mountain range.")
 Location A is cooler and wetter than location B. C) Location B is warmer and wetter than location A. D) Location B is cooler and drier than location A. 194.")
 rises and cools B) rises and warms C) sinks and cools D) sinks and warms Compared to the")
68 191. The cross section below shows the direction of air flowing over a mountain. Points A and B are at the same elevation on opposite sides of the mountain The arrows on the cross section below show the prevailing wind that flows over a mountain. Points A and B represent locations on opposite sides of the mountain. Compared to the air temperature and humidity at point A, the air temperature and humidity at point B are usually A) cooler and drier B) cooler and wetter C) warmer and drier D) warmer and wetter 192. The diagram below shows how prevailing winds cause different weather conditions on the windward and leeward sides of a mountain range. Which statement correctly describes the differences in the climates of locations A and B? A) Location A is warmer and drier than location B. B) Location A is cooler and wetter than location B. C) Location B is warmer and wetter than location A. D) Location B is cooler and drier than location A The arrows in the cross section below show the prevailing winds moving across northern New York State into Vermont during the summer. Clouds usually form on the windward sides of mountains because this is where air A) rises and cools B) rises and warms C) sinks and cools D) sinks and warms Compared to the climate of location A, the climate of location B is A) warmer and wetter B) warmer and drier C) cooler and wetter D) cooler and drier


 warmer and wetter D) warmer and drier The heaviest rainfall would most likely occur on which side of this mountain and in which type")
69 195. The diagram below shows wind flowing over a mountain range The cross section below shows the prevailing winds that cause different climates on the windward and leeward sides of this mountain range. As the wind flows down the leeward side of the mountain range, the air becomes A) cooler and drier B) cooler and wetter C) warmer and drier D) warmer and wetter 196. The cross section below shows the flow of winds over a mountain ridge. Compared to the climate conditions on the leeward side of this mountain range, the conditions on the windward side are usually A) cooler and wetter B) cooler and drier C) warmer and wetter D) warmer and drier The heaviest rainfall would most likely occur on which side of this mountain and in which type of air mass? A) on the leeward side, in a mp air mass B) on the leeward side, in a ct air mass C) on the windward side, in a mt air mass D) on the windward side, in a cp air mass
70 198. Which diagram best illustrates how air rising over a mountain produces precipitation? A) B)
71 C) D)

 Rising air compresses and cools, causing the water droplets to evaporate. B) Rising air compresses and warms, causing the water vapor to condense.")
72 199. The map below shows the location of four cities, A, B, C, and D, in the western United States where prevailing winds are from the southwest The cross section below shows how prevailing winds have caused different climates on the windward and leeward sides of a mountain range. Which city most likely receives the least amount of average yearly precipitation? A) A B) B C) C D) D Why does the windward side of this mountain have a wet climate? A) Rising air compresses and cools, causing the water droplets to evaporate. B) Rising air compresses and warms, causing the water vapor to condense. C) Rising air expands and cools, causing the water vapor to condense. D) Rising air expands and warms, causing the water droplets to evaporate.

 compresses and warms B) compresses and cools C) expands and warms D) expands and cools After most of the moisture is removed")
73 Base your answers to questions 201 and 202 on the diagram of a mountain shown below. The arrows represent the direction of airflow over the mountain A desert often forms on the leeward side of a mountain range, as shown in the cross section below Compared to the temperature and humidity conditions at location A, the conditions at location B are A) warmer and less humid B) warmer and more humid C) cooler and less humid D) cooler and more humid 202. As the air moves up the windward side of the mountain, the air A) compresses and warms B) compresses and cools C) expands and warms D) expands and cools After most of the moisture is removed from the air on the windward side, deserts form on the leeward side because the sinking air A) compresses and warms B) compresses and cools C) expands and warms D) expands and cools 204. The diagram below shows the average yearly precipitation, in centimeters, at locations A through E across the State of Washington. Arrows indicate the direction of prevailing winds. Which statement best explains why location B and location E receive relatively low average yearly precipitation? A) These locations are on the leeward side of mountain ranges. B) These locations are on the windward side of mountain ranges. C) These locations receive more insolation than the other locations. D) These locations receive less insolation than the other locations.

 expansion of rising air B) compression of rising air C) precipitation from clouds D) evaporation from clouds 206. The cross section below shows the flow of prevailing winds over a mountain ridge.")
74 205. The diagram below shows the flow of planetary winds over a mountain ridge The cross section below shows several locations in the State of Washington and the annual precipitation at each location. The arrows represent the prevailing wind direction. As air rises on the windward side of the mountain ridge, the air's temperature decreases. Which process usually causes this temperature decrease? A) expansion of rising air B) compression of rising air C) precipitation from clouds D) evaporation from clouds 206. The cross section below shows the flow of prevailing winds over a mountain ridge. Why do the windward sides of these mountain ranges receive more precipitation than the leeward sides? A) Sinking air compresses and cools. B) Sinking air expands and cools. C) Rising air compresses and cools. D) Rising air expands and cools Which statement best explains why a cloud is forming as shown in the diagram below? Which location is most likely to receive precipitation? A) A B) B C) C D) D A) Water vapor is condensing. B) Moisture is evaporating. C) Cold air rises and compresses. D) Warm air sinks and expands As a parcel of air rises, its temperature will A) decrease due to expansion B) decrease due to compression C) increase due to expansion D) increase due to compression
75 210. The diagram below shows the positions of the cities of Seattle and Spokane, Washington. Both cities are located at approximately 48 North latitude, and they are separated by the Cascade Mountains The diagram below shows the flow of air over a mountain from point A to point C. Which graph best shows the approximate temperature change of the rising and descending air due to the adiabatic process? How does the climate of Seattle compare with the climate of Spokane? A) Seattle hot and dry Spokane cool and humid B) Seattle hot and humid Spokane cool and dry C) Seattle cool and humid Spokane warm and dry D) Seattle cool and dry Spokane warm and humid A) B) C) D) 212. As a sample of very moist air rises from sea level to a higher altitude, the probability of condensation occurring in that air sample will A) decrease B) increase C) remain the same
 30 N to 60 N B) 0 to 30 N C) 0 to 30 S D) 30 S to 60 S 215.")
76 213. Precipitation often occurs along a frontal surface because the air along a frontal surface A) has a high density B) contains condensation nuclei C) is rising D) is low in humidity 214. In which planetary wind belt do most storms move toward the northeast? A) 30 N to 60 N B) 0 to 30 N C) 0 to 30 S D) 30 S to 60 S 215. Base your answer to the following question on the map below, which shows the position of the jet stream relative to two air masses and a low-pressure center (L) over the United States. What is the general movement of the surface winds around the center of this low-pressure area? A) counterclockwise and outward B) counterclockwise and inward C) clockwise and outward D) clockwise and inward
 warmer temperatures farther north and causes storms to move more")
77 216. The map below shows a typical position and average velocity of the polar front jet stream during two different seasons. For the eastern United States, the change of the polar front jet stream from this summer position to this winter position causes A) warmer temperatures farther north and causes storms to move more slowly B) warmer temperatures farther north and causes storms to move more rapidly C) cooler temperatures farther south and causes storms to move more slowly D) cooler temperatures farther south and causes storms to move more rapidly 217. The planetary wind belts in the troposphere are primarily caused by the A) Earth s rotation and unequal heating of Earth s surface B) Earth s revolution and unequal heating of Earth s surface C) Earth s rotation and Sun s gravitational attraction on Earth s atmosphere D) Earth s revolution and Sun s gravitational attraction on Earth s atmosphere

78 Base your answers to questions 218 and 219 on map below, which represents an imaginary continent. Locations A and B are on opposite sides of a mountain range on a planet similar to Earth. Location C is on the planet's equator Compared to the climate at location A, the climate at location B would most likely be A) warmer and more humid B) warmer and less humid C) cooler and more humid D) cooler and less humid 219. Location C most likely experiences A) low air pressure and low precipitation B) low air pressure and high precipitation C) high air pressure and low precipitation D) high air pressure and high precipitation
79 Base your answers to questions 220 through 222 on the map below, which shows Earth's planetary wind belts Which climatic conditions exist where the trade winds converge? A) cool and wet B) cool and dry C) warm and wet D) warm and dry 221. Which wind belt has the greatest effect on the climate of New York State? A) prevailing northwesterlies B) prevailing southwesterlies C) northeast trades D) southeast trades 222. The curving of these planetary winds is the result of A) Earth's rotation on its axis B) the unequal heating of Earth's atmosphere C) the unequal heating of Earth's surface D) Earth's gravitational pull on the Moon
80 223. Base your answer to the following question on the cross section below and on your knowledge of Earth science. The cross section shows the general movement of air within a portion of Earth's atmosphere located between 30 N and 30 S latitude. Numbers 1 and 2 represent different locations in the atmosphere. Which map best shows the surface movement of winds between 30 N and 30 S latitude? A) B) C) D)
4. Which map best represents the type of fronts and direction of movement of these fronts in relation to the low-pressure center?
 1. Adjacent water and landmasses are heated by the morning Sun on a clear, calm day. After a few hours, a surface wind develops. Which map best represents this wind's direction? 2. An air pressure of 29.47
RR#4 - Multiple Choice
 1. The map below shows the amount of snowfall, in inches, produced by a lake-effect snowstorm in central New York State. The wind that produced this snowfall pattern most likely came from the 1) northeast
1. Which weather map symbol is associated with extremely low air pressure? A) B) C) D) 2. The diagram below represents a weather instrument.
 B) C) D) 2. The diagram below represents a weather instrument.") 1. Which weather map symbol is associated with extremely low air pressure? 2. The diagram below represents a weather instrument. Which weather variable was this instrument designed to measure? A) air pressure
1. Which weather map symbol is associated with extremely low air pressure? 2. The diagram below represents a weather instrument. Which weather variable was this instrument designed to measure? A) air pressure
Weather Practice. 4. As wind velocity decreases, the distance between isobars on a weather map will A) decrease B) increase C) remain the same
 decrease B) increase C) remain the same") 1. The chart below shows the air temperature and the dewpoint temperature near the ground at a given location for four consecutive days. All temperatures were recorded at noon. Which statement is best
1. The chart below shows the air temperature and the dewpoint temperature near the ground at a given location for four consecutive days. All temperatures were recorded at noon. Which statement is best
Weather and Climate A B1
 Weather and Climate A B1 1. What causes the Coriolis effect? (1) Earth s tilt on its axis (2) the spin of Earth on its axis (3) the orbital motion of the Moon around Earth (4) the orbital motion of Earth
Page 1. Name:
 Name: 1) As the difference between the dewpoint temperature and the air temperature decreases, the probability of precipitation increases remains the same decreases 2) Which statement best explains why
Name: Regents Earth Science. Weather and Climate - Review Questions
 Name: Regents Earth Science Weather and Climate - Review Questions Date: Thayer - 279 1. People sometimes release substances into the atmosphere to increase the probability of rain by A) raising the air
L.O Students will learn about factors that influences the environment
 Name L.O Students will learn about factors that influences the environment Date 1. At the present time, glaciers occur mostly in areas of A) high latitude or high altitude B) low latitude or low altitude
Guided Notes Weather. Part 1: Weather Factors Temperature Humidity Air Pressure Winds Station Models
 Guided Notes Weather Part 1: Weather Factors Temperature Humidity Air Pressure Winds Station Models. 1. What is weather? Weather: short-term atmospheric conditions in a specific area at a specific time
Ch 7 Weather Practice Questions
 Practice Questions 1. Base your answer to the following question on the cross section below, which shows two weather fronts moving across New York State. Lines X and Y represent frontal boundaries. The
Weather Practice Test
 Name: Weather Practice Test 1. The diagram below shows weather instruments A and B. Which table correctly indicates the name of the weather instrument and the weather variable that it measures? A) B) C)
SEVERE WEATHER AND FRONTS TAKE HOME QUIZ
 1. Most of the hurricanes that affect the east coast of the United States originally form over the A) warm waters of the Atlantic Ocean in summer B) warm land of the southeastern United States in summer
MOISTURE IN THE ATMOSPHERE MEGA PACKET
 NAME: MEGA PACKET 1. A psychrometer is used to determine which weather variables? A) wind speed and wind direction B) percentage of cloud cover and cloud height C) air pressure and air temperature D) relative
3. The map below shows an eastern portion of North America. Points A and B represent locations on the eastern shoreline.
 1. Most tornadoes in the Northern Hemisphere are best described as violently rotating columns of air surrounded by A) clockwise surface winds moving toward the columns B) clockwise surface winds moving
A) B) C) D) 2) The diagrams below show the phases of the Moon as viewed by an observer in New York State at different times in August.
 B) C) D) 2) The diagrams below show the phases of the Moon as viewed by an observer in New York State at different times in August.") Name: 1) Which weather station model indicates the highest relative humidity? 8605-1 - Page 1 A) B) C) D) 2) The diagrams below show the phases of the Moon as viewed by an observer in New York State at
Name: 1) Which weather station model indicates the highest relative humidity? 8605-1 - Page 1 A) B) C) D) 2) The diagrams below show the phases of the Moon as viewed by an observer in New York State at
Weather and Energy Review
 Weather and Energy Review Name 1. Base your answer to the following question on the diagram below, which represents the greenhouse effect in which heat energy is trapped in Earth's atmosphere Which type
3. As warm, moist air moves into a region, barometric pressure readings in the region will generally 1. decrease 2. increase 3.
 Teacher: Mr. Prizzi Castle Learning Review 1 1. Which process most directly results in cloud formation? 1. condensation 3. precipitation 2. transpiration 4. radiation 2. An air mass originating over north
also known as barometric pressure; weight of the air above the surface of the earth; measured by a barometer air pressure, high
 Weather Vocabulary Vocabulary Term Meaning/Definition air mass * large bodies of air that have the similar properties throughout such as temperature, humidity, and air pressure; causes most of the weather
NAME: Log onto YouTube and search for jocrisci channel.
 NAME: Log onto YouTube and search for jocrisci channel. REFERENCE TABLES (Videos 8.1 & 8.2 ESRT 12, 13a, 14b) 1. Use the temperature scales on page 13. (notes-air temperature conversions) a. 80 C to F
Global Wind Patterns
 Name: Earth Science: Date: Period: Global Wind Patterns 1. Which factor causes global wind patterns? a. changes in the distance between Earth and the Moon b. unequal heating of Earth s surface by the Sun
Mid-latitude Cyclones & Air Masses
 Lab 9 Mid-latitude Cyclones & Air Masses This lab will introduce students to the patterns of surface winds around the center of a midlatitude cyclone of low pressure. The types of weather associated with
Mr. Lanik Practice Test Name:
 Mr. Lanik Practice Test Name: 1. New York State s Catskills are classified as which type of landscape region? mountain plateau Adirondacks Catskills lowland plain 2. In which New York State landscape region
Page 1. Name: 4) State the actual air pressure, in millibars, shown at Miami, Florida on the given weather map.
 State the actual air pressure, in millibars, shown at Miami, Florida on the given weather map.") Name: Questions 1 and 2 refer to the following: A partial station model and meteorological conditions table, as reported by the weather bureau in the city of Oswego, New York, are shown below. 1) Using
Name: Questions 1 and 2 refer to the following: A partial station model and meteorological conditions table, as reported by the weather bureau in the city of Oswego, New York, are shown below. 1) Using
A) its rotation D) Sun, the Moon, and some stars C) an oblate sphere D) troposphere B) hydrosphere and troposphere B) less dense and more felsic
 its rotation D) Sun, the Moon, and some stars C) an oblate sphere D) troposphere B) hydrosphere and troposphere B) less dense and more felsic") 1. The Earth is slightly flattened from a perfect spherical shape because of A) its rotation B) the pull of the sun and moon C) storms on the sun's surface D) its molten core 2. The Earth's actual shape
1. The Earth is slightly flattened from a perfect spherical shape because of A) its rotation B) the pull of the sun and moon C) storms on the sun's surface D) its molten core 2. The Earth's actual shape
Earth Science Chapter 16 and 17. Weather and Climate
 Earth Science Chapter 16 and 17 Weather and Climate Prediction Old way Groundhog Color of the sky Modern way satellites instruments computers Goal Weather Factors Studied by meteorologists Several factors
Atmospheric Layers. Earth s atmosphere is divided into several different atmospheric layers extending from Earth s surface outward.
 6-4.1 Compare the composition and structure of Earth s atmospheric layers (including the gases and differences in temperature and pressure within the layers). Taxonomy level: 2.6-B Understand Conceptual
Unit Three Worksheet Meteorology/Oceanography 2 WS GE U3 2
 Unit Three Worksheet Meteorology/Oceanography 2 WS GE U3 2 Name Period Section 17.3 1. 2. 3. 4. 5. 6. 7. 8. Of the following, which is NOT a factor that controls temperature? (C) latitude (D) longitude
Weather & Atmospheric Variables Review
 Weather & Atmospheric Variables Review Words that are bold, italicized and/or underlined are vocabulary you must KNOW! A) Atmospheric variables: a) Temperature as it relates to: 1) duration of insolation...longer
Weather Final Review Page 1
 Weather Final Review Name 1. Which change would cause a decrease in the amount of insolation absorbed at Earths surface? A) a decrease in cloud cover B) a decrease in atmospheric transparency C) an increase
What a Hurricane Needs to Develop
 Weather Weather is the current atmospheric conditions, such as air temperature, wind speed, wind direction, cloud cover, precipitation, relative humidity, air pressure, etc. 8.10B: global patterns of atmospheric
Key. Name: OBJECTIVES
 Name: Key OBJECTIVES Correctly define: air mass, air pressure, anemometer, barometer, cyclone, dew point, front, isobar, isotherm, meteorology, precipitation, psychrometer, relative humidity, saturated,
Name: C) wind speed D) visibility 3) The diagram below represents a weather instrument.
 wind speed D) visibility 3) The diagram below represents a weather instrument.") Name: 1) An increase in the transparency of Earth's atmosphere is often caused by A) a decrease in solar radiation B) an increase in airborne dust particles C) an increase in the duration of insolation
Name: 1) An increase in the transparency of Earth's atmosphere is often caused by A) a decrease in solar radiation B) an increase in airborne dust particles C) an increase in the duration of insolation
Weather Packet 10. Your Name Group Members. Score. Minutes
 Weather Packet 10 Your Name Group Members Score Minutes Standard 4 Key idea 2 Performance Indicator: 2.1 Use the concepts of density and heat energy to explain observations of weather patterns, seasonal
Page 1. C) reducing the gradient of a steep hill D) planting grasses and shrubs on a hillside
 reducing the gradient of a steep hill D) planting grasses and shrubs on a hillside") Name: 1) One result of a large volcanic eruption is that surface air temperatures decrease over a sizable region of Earth. This phenomenon occurs because volcanic eruptions usually decrease the number
Name: 1) One result of a large volcanic eruption is that surface air temperatures decrease over a sizable region of Earth. This phenomenon occurs because volcanic eruptions usually decrease the number
Name: Climate Date: EI Niño Conditions
 Name: Date: Base your answers to questions 1 and 2 on the maps and the passage below. The maps show differences in trade wind strength, ocean current direction, and water temperature associated with air-pressure
Foundations of Earth Science, 6e Lutgens, Tarbuck, & Tasa
 Foundations of Earth Science, 6e Lutgens, Tarbuck, & Tasa Weather Patterns and Severe Weather Foundations, 6e - Chapter 14 Stan Hatfield Southwestern Illinois College Air masses Characteristics Large body
Air Masses, Fronts, Storm Systems, and the Jet Stream
 Air Masses, Fronts, Storm Systems, and the Jet Stream Air Masses When a large bubble of air remains over a specific area of Earth long enough to take on the temperature and humidity characteristics of
Solar Energy. Convection Zones. Weather Observations and Measurements
 Atmospheric Layers Atmospheric Gases Atmospheric Temperatures Atmospheric Pressure Water Cycle Precipitation Clouds Air Masses Fronts High & Low Pressure Solar Energy Convection Zones Weather Observations
Class Notes: Weather
 Name: Date: Period: Weather The Physical Setting: Earth Science I. Cyclonic Weather Hurricane - Hurricane Statistics Largest of all the storms Approximately per year Nearly deaths per year Saffir-Simpson
Page 1. Name: 1) The graph below shows air temperature for an area near the Earth's surface during a 12-hour period.
 The graph below shows air temperature for an area near the Earth's surface during a 12-hour period.") Name: 1) The graph below shows air temperature for an area near the Earth's surface during a 12-hour period. Which graph best illustrates the probable change in air pressure during the same time period?
Name: 1) The graph below shows air temperature for an area near the Earth's surface during a 12-hour period. Which graph best illustrates the probable change in air pressure during the same time period?
Week: Dates: 3/2 3/20 Unit: Climate
 clementaged.weebly.com Name: EVEN Period: Week: 28 30 Dates: 3/2 3/20 Unit: Climate Monday Tuesday Wednesday Thursday Friday 2 O 3 E *Vocabulary *Water in the Atmosphere and Clouds Notes *Cloud Drawings
WEATHER. Review Note Cards
 WEATHER Review Note Cards Thermometer Weather instrument that measures air temperature Units include F, C, and K ESRT 13 Sling Psychrometer Weather instrument that measures relative humidity and dewpoint
Pressure System Circulation
 NAME 1. Base your answer to the following question on the surface weather map shown below. The map shows weather systems over the United States and weather station data for cities A, B, C, and D. Note
Weather and Climate Review
 Weather and Climate Review STUFF YOU NEED TO KNOW and to UNDERSTAND! 1) Because water has a higher specific heat than land, water will warm and cool more slowly than the land will. Because of this: a)
Global Weather Trade Winds etc.notebook February 17, 2017
 Global Weather 1 north pole northern hemisphere equator southern hemisphere south pole 2 We have seasons because of the Earth's tilt The seasons are opposite in the northern and southern hemispheres winter
Weather, Air Masses, Fronts and Global Wind Patterns. Meteorology
 Weather, Air Masses, Fronts and Global Wind Patterns Meteorology Weather is what conditions of the atmosphere are over a short period of time. Climate is how the atmosphere "behaves" over long periods
A. Weather - the conditions of the variables of the atmosphere for any short period of time
 WEATHER & THE ATMOSPHERE A. Weather - the conditions of the variables of the atmosphere for any short period of time Meteorology - the study of weather and weather related variables - the variables: Topic
Go With the Flow From High to Low Investigating Isobars
 Go With the Flow From High to Low Investigating Isobars Science 10 Mrs. Purba Air Masses The air over a warm surface can be heated, causing it to rise above more dense air. The result is the formation
25.1 Air Masses. Section 25.1 Objectives
 Section 25.1 Objectives Explain how an air mass forms. List the four main types of air masses. Describe how air masses affect the weather of North America. Air Masses 25.1 Air Masses Differences in air
Weather Unit Part 2: Meteorology
 Name: Earth Science Date: Period: Weather Unit Part 2: Meteorology 1 The map below shows North America and its surrounding bodies of water. Country borders are shown. On the map, label the following locations:
1 What Is Climate? TAKE A LOOK 2. Explain Why do areas near the equator tend to have high temperatures?
 CHAPTER 17 1 What Is Climate? SECTION Climate BEFORE YOU READ After you read this section, you should be able to answer these questions: What is climate? What factors affect climate? How do climates differ
Weather Notes. Chapter 16, 17, & 18
 Weather Notes Chapter 16, 17, & 18 Weather Weather is the condition of the Earth s atmosphere at a particular place and time Weather It is the movement of energy through the atmosphere Energy comes from
Unit 8: Meteorology. How is Earth s weather influenced by different atmospheric variables? How can we predict weather?
 Unit 8: Meteorology How is Earth s weather influenced by different atmospheric variables? How can we predict weather? Regent s Earth Science Name: Topics Weather Structure of Earth s atmosphere Air Temperature
Chapter 7 Properties of the Atmosphere
 14. Day Breezes H L Chapter 7 Properties of the Atmosphere Questions Pages 177 179 1. (3) 2. (4) 3. (4) 4. (3) 5. (2) 6. (3) 7. (2) 8. (2) 9. (3) 10. (1) 11. (4) 12. (2) Questions Pages 186 188 13. (3)
Science 1206 Chapter 1 - Inquiring about Weather
 Science 1206 Chapter 1 - Inquiring about Weather 1.1 - The Atmosphere: Energy Transfer and Properties (pp. 10-25) Weather and the Atmosphere weather the physical conditions of the atmosphere at a specific
UNIT 13: WEATHER AND CLIMATE
 UNIT 13: WEATHER AND CLIMATE After Unit 13 you should be able to: o Be able to use Selected Properties of Earth s Atmosphere, Planetary Wind and Moisture Belts in the Troposphere, Temperature, Pressure,
The Atmosphere. All weather occurs here 99% of water vapor found here ~75 % of total mass of the atmosphere
 The Atmosphere Structure/Layers Contains 4 major layers See E.S.R.T pg 14 o Troposphere All weather occurs here 99% of water vapor found here ~75 % of total mass of the atmosphere o Stratosphere Contains
1. Base your answer to the following question on the weather map below, which shows a weather system that is affecting part of the United States.
 1. Base your answer to the following question on the weather map below, which shows a weather system that is affecting part of the United States. Which sequence of events forms the clouds associated with
b. The boundary between two different air masses is called a.
 NAME Earth Science Weather WebQuest Part 1. Air Masses 1. Find out what an air mass is. http://okfirst.mesonet.org/train/meteorology/airmasses.html a. What is an air mass? An air mass is b. The boundary
Climate versus Weather
 Climate versus Weather What is climate? Climate is the average weather usually taken over a 30-year time period for a particular region and time period. Climate is not the same as weather, but rather,
3. This room is located in a building in New York State. On which side of the building is the window located? (1) north (3) east (2) south (4) west
 north (3) east (2) south (4) west") 1. The planetary winds in Earth s Northern Hemisphere generally curve to the right due to Earth s (1) orbit around the Sun (2) spin on its axis (3) magnetic field (4) force of gravity Base your answers
1. The planetary winds in Earth s Northern Hemisphere generally curve to the right due to Earth s (1) orbit around the Sun (2) spin on its axis (3) magnetic field (4) force of gravity Base your answers
Name Period 4 th Six Weeks Notes 2013 Weather
 Name Period 4 th Six Weeks Notes 2013 Weather Radiation Convection Currents Winds Jet Streams Energy from the Sun reaches Earth as electromagnetic waves This energy fuels all life on Earth including the
Space Atmospheric Gases. the two most common gases; found throughout all the layers a form of oxygen found in the stratosphere
 Earth s atmospheric layers Earth s atmosphere is the layer of gases that surrounds the planet and makes conditions on Earth suitable for living things. Layers Earth s atmosphere is divided into several
2. Would you expect convection in a lake? Why or why not?
 NAME: PERIOD: DATE: ENTRY NUMBER: REVIEW FOR WEATHER AND CLIMATE TEST 1. Describe 3 types of heat transfer. Give an example of each. 2. Would you expect convection in a lake? Why or why not? 3. What part
Ch. 3: Weather Patterns
 Ch. 3: Weather Patterns Sect. 1: Air Mass & Fronts Sect. 2: Storms Sect. 3: Predicting the Weather Sect. 4: Weather forecasters use advanced technologies Ch. 3 Weather Fronts and Storms Objective(s) 7.E.1.3
3) What is the difference between latitude and longitude and what is their affect on local and world weather and climate?
 What is the difference between latitude and longitude and what is their affect on local and world weather and climate?") www.discoveryeducation.com 1) Describe the difference between climate and weather citing an example of each. Describe how water (ocean, lake, river) has a local effect on weather and climate and provide
www.discoveryeducation.com 1) Describe the difference between climate and weather citing an example of each. Describe how water (ocean, lake, river) has a local effect on weather and climate and provide
12/22/2018. Water and the Atmosphere. 8 th Grade. Lesson 1 (Water in the Atmosphere) Chapter 4: Weather. Lesson 2 (Clouds) Clouds
 Chapter 4: Weather. Lesson 2 (Clouds) Clouds") Lesson 1 (Water in the Atmosphere) Water cycle the continual movement of water among Earth s atmosphere, oceans, and land surface through evaporation, condensation, and precipitation Water and the Atmosphere
Lesson 1 (Water in the Atmosphere) Water cycle the continual movement of water among Earth s atmosphere, oceans, and land surface through evaporation, condensation, and precipitation Water and the Atmosphere
Chapter 18/19. Ch 18
 Chapter 18/19 Ch 18 Pressure Force of the weight of the air above At sea level: 14.7 lbs/in2 Decreases with altitude Inches of mercury (29.92 @ sea level) Barometer - instrument used to measure air pressure
Background: What is Weather?
 Weather Maps Background: What is Weather? Weather is the day-to-day state of the atmosphere. The interaction of three important factors result in weather systems: air temperature, air pressure, and the
ATSC 2000 Final Fall 2005
 ATSC 2000 Final Fall 2005 true/false /25 multiple choice /25 short answer /23 essay /10 total /83 or % True/False Indicate whether the sentence or statement is true or false. (25 questions 1% each) 1.
Tuesday, September 13, 16
 Weather Weather State Objectives 4.c, 4.d, 4.h. Discussion What are some ways in which weather affects your everyday life? Discussion What are some ways in which weather affects your everyday life? What
Science 1206 SAMPLE Test ( Weather Dynamics)
") Science 1206 SAMPLE Test ( Weather Dynamics) Name:. Part A: Multiple Choice (60%) Shade the letter of the best answer on the Scantron sheet provided. 1. Which term refers to the current atmospheric conditions?
Science 1206 SAMPLE Test ( Weather Dynamics) Name:. Part A: Multiple Choice (60%) Shade the letter of the best answer on the Scantron sheet provided. 1. Which term refers to the current atmospheric conditions?
Topic 1 The Atmosphere and Atmospheric Variables
 Name Notes: Topic 1 The Atmosphere Regents Earth Science Topic 1 The Atmosphere and Atmospheric Variables What is the atmosphere? Meteorology is the study of A. Structure of the Atmosphere: What two gases
Meteorology. I. The Atmosphere - the thin envelope of gas that surrounds the earth.
 Meteorology I. The Atmosphere - the thin envelope of gas that surrounds the earth. A. Atmospheric Structure - the atmosphere is divided into five distinct layers that are based on their unique characteristics.
Bell Work. REVIEW: Our Planet Earth Page 29 Document A & B Questions
 9.12.16 Bell Work REVIEW: Our Planet Earth Page 29 Document A & B Questions Intro to Climate & Weather https://www.youtube.com/watch?v=vhgyoa70q7y Weather vs. Climate Video Climate & Weather 3.1 Weather
Lecture #14 March 29, 2010, Monday. Air Masses & Fronts
 Lecture #14 March 29, 2010, Monday Air Masses & Fronts General definitions air masses source regions fronts Air masses formation types Fronts formation types Air Masses General Definitions a large body
Forecasts include: Temperature. Barometric (air) Pressure. Wind direction/speed Humidity
 Pressure. Wind direction/speed Humidity") Meteorology I Intro. to Weather 1. What is Weather? A) Weather is the state of the atmosphere at a given time and place. B) Weather changes on a regular basis. C) Meteorologists forecast weather conditions
Meteorology I Intro. to Weather 1. What is Weather? A) Weather is the state of the atmosphere at a given time and place. B) Weather changes on a regular basis. C) Meteorologists forecast weather conditions
Unit 5 Part 2 Test PPT
 Unit 5 Part 2 Test PPT Standard 1: Air Masses Air Mass An air mass is an immense body of air that is characterized by similar temperatures and amounts of moisture at any given altitude When an air mass
WEATHER UNIT REVIEW/STUDY GUIDE
 WEATHER UNIT REVIEW/STUDY GUIDE This Study Guide will help you prepare for the Unit test on Weather. To complete this study guide, you may use your notebook, the video links and quizlets shown below. Helpful
Weather is the of the Earth s atmosphere at a place and time. It is the movement of through the atmosphere o Energy comes from the
 Weather Notes Weather Weather is the of the Earth s atmosphere at a place and time It is the movement of through the atmosphere o Energy comes from the The sun is the force that weather The sun s energy
Unit 9: Climate & Meteorology. Vocabulary
 Unit 9: Climate & Meteorology Vocabulary Weather Temperature Dew Point Relative Humidity Psychrometer Air Pressure Barometer Isobars Wind Anemometer condensation Sea Breeze Land Breeze Coriolis Effect
The Atmosphere. Characteristics of the Atmosphere. Section 23.1 Objectives. Chapter 23. Chapter 23 Modern Earth Science. Section 1
 The Atmosphere Chapter 23 Modern Earth Science Characteristics of the Atmosphere Chapter 23 Section 1 Section 23.1 Objectives Describe the composition of Earth s atmosphere. Explain how two types of barometers
Weather Maps. The Sun s radiation produces weather on Earth.
 Sunny days give way to rainy days. Storms appear, then fade away. Howling winds become gentle breezes. At one o clock on an autumn afternoon, an outdoor thermometer reads 20 C. An hour later, the temperature
World geography 3200/3202 Unit 2 review
 World geography 3200/3202 Unit 2 review 1. Does this statement use the terms revolve & rotate correctly? "Saturn revolves on its axis while several moons rotate around it." 2. Does this statement use the
Clouds, Precipitation
 ES 106 Clouds, Precipitation I. Condensation and cloud formation A. Condensation nuclei necessary for clouds to form 1. dust, pollen, salt, smoke 2. at sub-freezing temperature, form by deposition of water
7. The weather instrument below can be used to determine relative humidity.
 1. What is the dewpoint temperature when the dry-bulb temperature is 12 C and the wet-bulb temperature is 7 C? A) 1 C B) -2 C C) -5 C D) 4 C 2. A parcel of air has a dry-bulb temperature reading of 16
Weather Systems Study Guide:
 Weather Systems Study Guide: 1. Draw a diagram of Earth s water cycle and label each part. 2. Explain how the water cycle works. 3. What happens in the troposphere and stratosphere? Atmosphere Level What
4. Fill in the table about the 4 different types of air masses. Air Masses Source Region Type of Air Symbol
 Packet #12: Weather & Climate Name: Per: Reading Guide: Chapter 24.1 (Read and study text pages 601-604) Understanding Air Masses 5a. Students know how differential heating of Earth results in circulation
Wind: Global Systems Chapter 10
 Wind: Global Systems Chapter 10 General Circulation of the Atmosphere General circulation of the atmosphere describes average wind patterns and is useful for understanding climate Over the earth, incoming
True or false: The atmosphere is always in hydrostatic balance. A. True B. False
 Clicker Questions and Clicker Quizzes Clicker Questions Chapter 7 Of the four forces that affect the motion of air in our atmosphere, which is to thank for opposing the vertical pressure gradient force
Lecture Outlines PowerPoint. Chapter 19 Earth Science 11e Tarbuck/Lutgens
 Lecture Outlines PowerPoint Chapter 19 Earth Science 11e Tarbuck/Lutgens 2006 Pearson Prentice Hall This work is protected by United States copyright laws and is provided solely for the use of instructors
Earth Science, 11e. Weather Patterns and Severe Storms Chapter 19. Air masses. A cold Canadian air mass Figure Air masses. Air masses 9/5/2012
 2006 Pearson Prentice Hall Lecture Outlines PowerPoint Chapter 19 Earth Science 11e Tarbuck/Lutgens This work is protected by United States copyright laws and is provided solely for the use of instructors
MASTERY ASSIGNMENT 2015
 Climate & Meteorology MASTERY ASSIGNMENT 2015 Directions: You must submit this document via Google Docs to lzimmerman@wcpss.net. The document must include the questions and pictures must be hand drawn
Final Weather Unit Study Guide
 Name: Atmospheric Composition and Layers Altitude Atmosphere Composition Troposphere Air Pressure Stratosphere Mesosphere Thermosphere Exosphere Ionosphere Sample Questions: Final Weather Unit Study Guide
Chapter 21. Weather Patterns and Severe Storms
 Chapter 21 Weather Patterns and Severe Storms 20.1 Air Masses Air Masses and Weather Air Masses An air mass is an immense body of air that is characterized by similar temperatures and amounts of moisture
Science Olympiad Meteorology Quiz #2 Page 1 of 8
 1) The prevailing general direction of the jet stream is from west to east in the northern hemisphere: 2) Advection is the vertical movement of an air mass from one location to another: 3) Thunderstorms
COMPOSITION OF THE ATMOSPHERE
 Name Air COMPOSITION OF THE ATMOSPHERE 1. What are the two most abundant gases in the atmospherere? 2. Why do you think the percentage of water vapor in the air varies? 3. Would you classify carbon dioxide
1 What Is Climate? TAKE A LOOK 2. Explain Why do areas near the equator tend to have high temperatures?
 CHAPTER 3 1 What Is Climate? SECTION Climate BEFORE YOU READ After you read this section, you should be able to answer these questions: What is climate? What factors affect climate? How do climates differ
The Atmosphere - Chapter Characteristics of the Atmosphere
 Section Objectives Describe the composition of Earth s atmosphere. Explain how two types of barometers work. Identify the layers of the atmosphere. Identify two effects of air pollution. The Atmosphere
DEPARTMENT OF EARTH & CLIMATE SCIENCES Name SAN FRANCISCO STATE UNIVERSITY Nov 29, ERTH 360 Test #2 200 pts
 DEPARTMENT OF EARTH & CLIMATE SCIENCES Name SAN FRANCISCO STATE UNIVERSITY Nov 29, 2018 ERTH 360 Test #2 200 pts Each question is worth 4 points. Indicate your BEST CHOICE for each question on the Scantron