THE DRIFT OF THE ICE-BREAKER SEDOV
|
|
|
- Dorcas Cameron Parrish
- 5 years ago
- Views:
Transcription
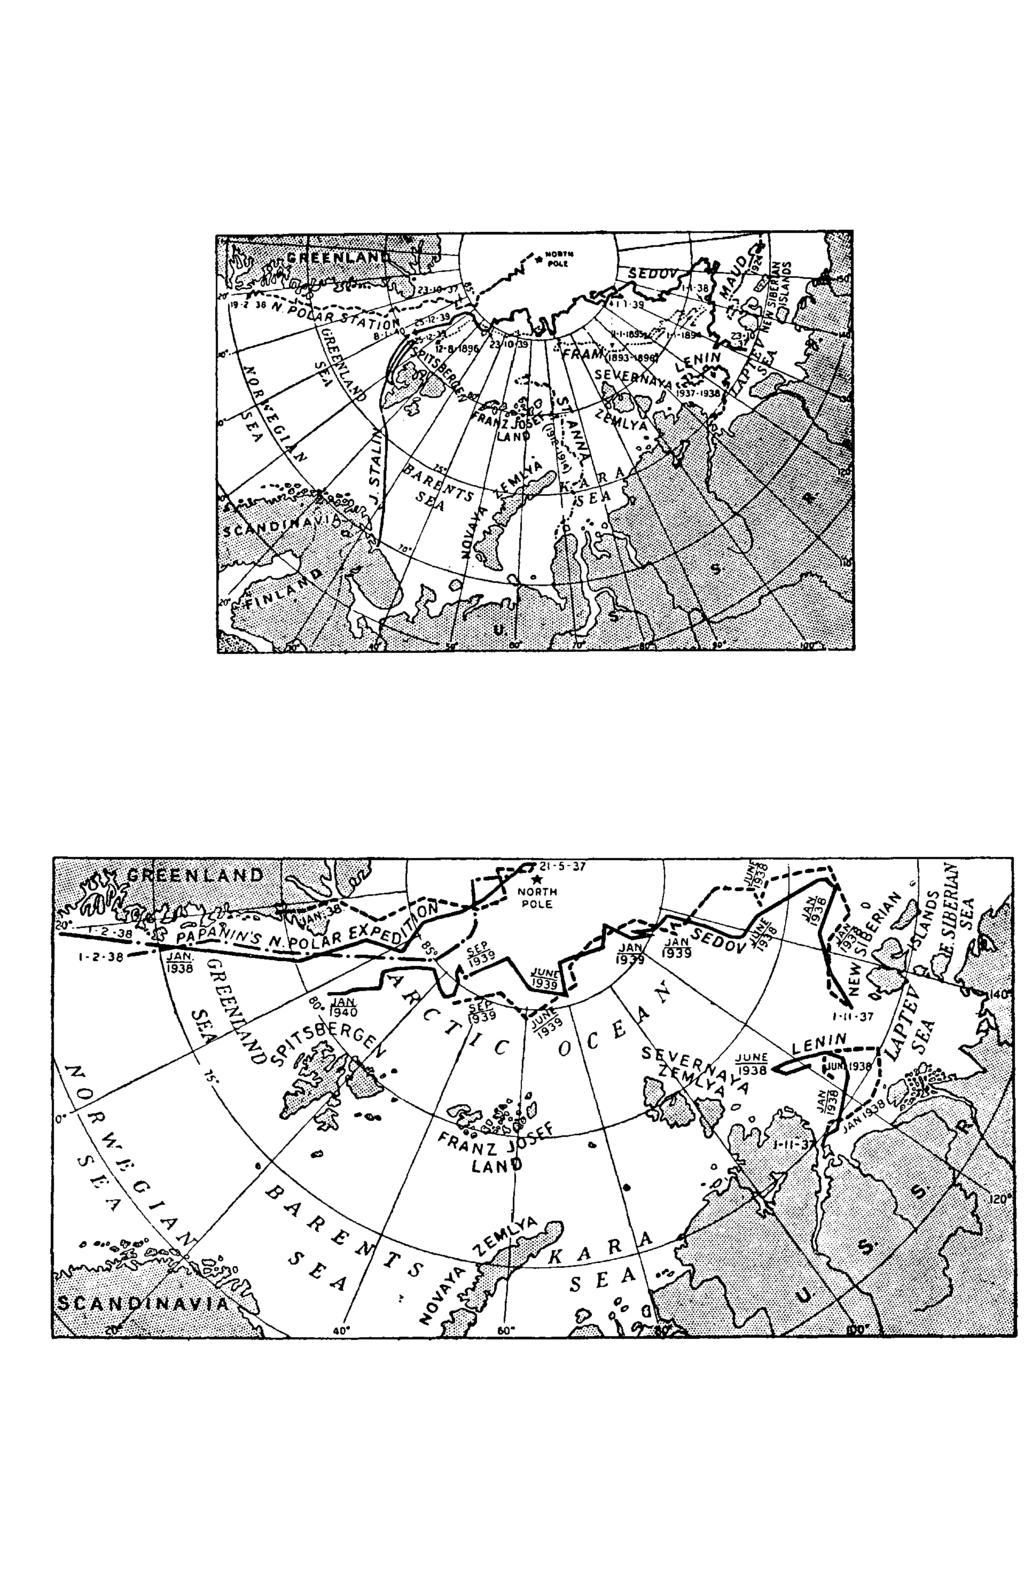
1 6 7 THE DRIFT OF THE ICE-BREAKER SEDOV by Professor N. N. ZU BO V. (Reproduced from Nature, London, April 6, 1940). Attempts have been made by many expeditions to penetrate to the central part of the Arctic Ocean. A few have even succeeded in reaching the North Pole itself. After several unsuccessful attempts, the American explorer Robert P e a r y, on April 6, 1909, reached the North Pole on sledges drawn by dogs and remained there for some thirty hours. On May 9, 1926, the American aviator, Admiral Richard B y r d, flew to the Pole by aeroplane and describing a circle in the air, returned safely to Spitsbergen, the starting point of flight. In the same year, the Norwegian explorer Am undsen crossed the Artie Ocean from Spitsbergen to Alaska in a dirigible, flying over the North Pole on May 12. On May 24, 1928, the Italian expedition of General N o b ile also succeded in reaching the North Pole in a dirigibile, which circled over it; but the expedition met with disaster on the return flight and some of the members perished. Concerted attempts to reach the North Pole were made by Soviet explorers in 1937, in which year nine Soviet aeroplanes flew over the Pole. While the North Polar Station on the drifting icefloe was being set up, there were present at the Pole four heavy aeroplanes and thirty-three Soviet polar explorers. During those days five aeroplanes, piloted by M o- l o k o v, G o lo v in, V o d o p a n o v, A le x e y e r and M azu ruk, flew over the Pole. On June 18, 1937, C h k a lo v s machine passed over the Pole on his flight from Moscow to the United States. On July, 13, 1937 following the same route Grom ov flew his machine over the North Pole; on August 13, L e v a n e v s k y flew over the North Pole on his way to America. L e v a n e v s k y was afterwards lost and during the search for his machine. V o d o p ian o v flew over the Pole on October 7, 1937, and M o s h k o v sk y on April 4, F O R E R U N N E R S O F T H E SED O V Only three expeditions have drifted with the ice in the Arctic: Nansen s expedition of on the From, Papanin s North Polar expedition on the drifting icefloe of , and the expedition of the Soviet polar explorers on the ice-breaker Sedov {Nature, 143, ; 1939)- Nansen s expedition did not reach the North Pole. During her drift, the From only reached lat. 8s 56 N. Yet it was Nansen who, in a scientific sense, literally discovered the Arctic Ocean. Prior to the drift of the From, very little indeed was known about this ocean. Nansen himself did not expect to find depths exceeding 500 m. (1,640 ft.) and consequently did not take with him the necessary equipment for sounding great depths. From Nansen s expedition it was learned that the Arctic Ocean was a sea having depths of more than 3,000 m. (9,843 ft.) The warm Atlantic waters a branch of the Gulf Stream were shown to penetrate as a deep current far into the central part of the Arctic Ocean. Nansen s observations revealed the primary conditions of the movement of the ice in this basin. Lastly, Nansen also studied the principal conditions governing the formation, development and disintegration of sea ice. There is not an aspect of oceanography and geophysics relating to the Arctic Ocean to which Nansen s expedition did not make important discoveries. On May 21, 1937, with the help of four heavy aeroplanes, the Papanin expedition was landed on the ice. On a big icefield the Soviet polar explorers set up a well-equipped polar observatory. On June 6 the organization of the North Polar Station was completed. The aeroplanes flew back to the mainland, leaving Papanin, Krenkel, Shirshov and Fedorov on the ice. They remained on the icefloe for 274 days. During this period, the icefield of the Papanin expedition was carried from the North Pole to the east coast of Greenland where, at lat N. and long. I9 48 W., the drifting expedition was taken off by the ice-breakers Taimyr and Murman.

2 The men of the expedition on the drifting icefloe measured all depths along the entire course of their drift from the North Pole to the coast of Greenland. They revealed the movement of the ice and sea current under the ice which had escaped Nansen s attention. They refuted Nansen s theory that no life existed in the central part of the Arctic Ocean. They carried out valuable observations on terrestrial magnetism. The meteorological observations of the Papanin expedition not only facilitated the organization of the trans-arctic flights of Chkalov and Gromov, but also contributed to our knowledge of the structure of the atmosphere and the processes determining the weather in the central part of the Arctic. S T A R T O F T H E SED O V D R IF T Contrary to the drifts of the Fram and the North Polar Expedition on the drifting icefloe, the drift of the Sedov was not deliberately planned. With the ice-breakers Sadko and Malygin, on October 23, 1937, the Sedov was caught in the ice in the Laptev Sea at lat. 75 i9 N. and, long. I32 25 E. On August 28, 1938, these ice-breakers were at lat. 83 o6 N., long. I38 24 E. On that day the ice-breaker Yermak extricated the Sadko and Malygin from the ice and brought them into clear water. The Sedov, however, could not be released owing to the fact that during her imprisonment in the ice she had sustained some damage to her steering gear. Fifteen volunteers, headed by Captain Badygin, remained on the Sedov; and from that time the vessel continued her remarkable drift in the most inaccessible part of the Arctic Ocean, where no other vessel had ever drifted before and no aeroplane had flown. Several circumstances make the drift of the Sedov of exceptional interest. First, the drift of the ice-breaker began at a time when the North Polar Expedition on the drifting icefloe was still making observations. Thus, uninterrupted observations of the central parts of the Arctic Ocean were being conducted. Secondly, soon after the commencement of the drift of the Sedov and also in the Laptev Sea but in the south-western part, there began the drift of several vessels headed by the ice-breaker Lenin. These vessels had been carried from Khatanga Bay. The drift of the ice-breaker Lenin ended on August 7, 1938, when, with the entire caravan of ships, she was extricated from the ice by the Krassin. Thus, for nine months two caravans of ships drifted simultaneously at some distance from each other, one in the south-western part of the Laptev Sea, the other in the north-eastern part of the same sea, and in the region to the north of the New Siberian Islands. A comparison of these drifts has yielded noteworthy results. Differing from each other in details, these drifts at the same time reveal extraordinary similarity, a fact which goes to show that they were conditioned by the same causes: the prevailing winds and constant currents. Thirdly, soon after the commencement of her drift, the Sedov found herself in the region where the drift of Nansen s Fram started. A comparison of the subsequent courses of the drifts of the Fram and the Sedov is of exceptional interest, because the former took place in climatic conditions differing considerably from those of the present day. At first the Sedov drifted directly northwards. In a month, under the influence of west winds the ice-breaker turned eastwards, and early in January, 1938, reached the most easterly point of her course ' lat N. and long. I53 26 E. From that time the Sedov began slowly to move westwards, at the same time going more and more to the north. She continued this north-westerly direction, and on March 22, 1939, reached lat N. and long. io8 so E. Later, the drift began gradually to incline to the south-west. From May 17 until July 27, 1939, the courses of the Sedoz> and the Fram overlap, as it were, but afterwards the Sedov again commenced to go rapidly to the north, and on August 29, 1939, reached the northernmost point of her drift, lat. 8603Q.S N., long. 47 S5 E. After that the Sedov again descended to the south, crossing the Fram s course, and along a line lying between the drifts of the expedition on the drifting icefloe and that of the Fram, made for the broad strait dividing Greenland from Spitsbergen. From December 1, 1939, the Sedov, was finally drawn into the drift of the ice moving from the Arctic Basin to the Greenland Sea; with gradually increasing speed the ice-breaker drifted almost due south. On January i, 1940, she had already reached lat. 8i i5.4 N., long. 4 i 6 E. She was afterwards extricated from the ice by the ice-breaker, Joseph Stalin. Her crew was taken off the vessel on January 1 3, and on January 29, 1940, the Sedov arrived in Murmansk.
3
4

5 E N D O F A L E G E N D One achievement of the Sedov is the final explosion of the Sannikov Land legend. In 1811, Jacob Sannikov purported to have sighted from the northern coast of Kotelny Island a high land which he attempted to reach by crossing the ice; he was prevented from doing so by a big polynia (an expanse of clear water in the icefield). According to Sannikov, there remained only another 25 kilometres (15 1/2 miles) for him to cross in order to reach this land. Doubts as to the existence of this supposed land have, however, been held by many for several decades. The Sedov, during the period of her drift, twice crossed the region of the supposed land: once from west to east, approximately at the 78th parallel, and the second time from the south-east to the north-west. Later, the air expedition of Alexejev passed over the region approximately in a meridional direction. The flights were from the northern extremity of Kotelny Island to the drifting caravan of vessels, the Sadko, Sedov and Malygin, and were made at a time when visibility was excellent. Through this same region also passed the ice-breakers Yermak and Joseph Stalin on their way to meet the drifting vessels. Yet neither ice-breaker saw any sign of Sannikov Land. B O U N D A R Y O F T H E L A P T E V S E A. From the point of view of physical geography, the Laptev Sea is not a sea but only a gulf of the Acrtic Ocean. The northern boundary of this sea is conditional, having been fixed by the Soviet Government as the arc of the great circle connecting Cape Molotov (the northern point of Severnaya Zemlya) with the point at which the meridian crosses the northern point of Kotelny Island (long E.) and the edge of the continental shelf. The drift of the Sedov from the beginning up lo lat N., long. I49 s8 E. proceeded along the continental shelf. The depths did not exceed 200 m. However, at lat N., long. I48 02 E., the Sedov found herself over depths considerably exceeding m., that is, at depths characteristic of the deep bed of the central part of the Arctic Ocean. The region lying to the north of the New Siberian Islands has been thoroughly sounded. From a comparison of these soundings, it appears most probable that the continental shelf at the Kotelny Island meridian (long. 139 E.) ends at lat. 78 3o N. This must be considered as the north-eastern point of the Laptev Sea. A s was found in the region of the New Siberian Islands, the continental shelf stretches farther north than was supposed, and the continental slope is much more gradual. It occupies 20 of latitude and has a gradient of not more than I. To the north of Franz Josef Land great depths were unexpectedly discovered. A t lat N., and long. 39 2S E. the expedition failed to find bottom at 5,180 m. Extremely interesting are the soundings obtained by the Sedov in the latter stages of her drift at the entrance to the Greenland Sea. Nansen surmised that between the northeastern extremity of Greenland and the north-western extremity of Spitsbergen was a submarine ridge separating the great depths of the Arctic Ocean from the great depths of the Greenland Sea. This ridge came to be known as Nansen s submarine ridge. Its eastern part was studied in 1935 by the Sadko expedition, and the western part by the Papanin North Polar Expedition on the drifting icefloe. The Sedov crossed Nansen s submarine ridge in its middle part, at lat. 81*34 N. long. 4 4o E., and registered a depth of 1,500 m., thus confirming the existence of this ridge. C H A N G E S IN T H E T H E R M A L B A L A N C E In addition to the sounding of depths, the Sedov crew carried out meteorological, hydrological, magnetic and gravimetrical observations along the same lines as the members of the North Polar Expedition on the drifting icefloe. The observations of the Sedov crew confirmed what has already been recorded by the Papanin expedition and by Nansen: on the whole course of their drift they discovered at intermediate depths warm waters of Atlantic origin. The fact that the lines of the drifts of the Front and the Sedov crossed in several places
6 has made it possible to determine the changes in the thermal balance of the Arctic Basin during the last forty-five years. The Sedov remained twice as long beyond the 85th parallel as the North Polar Expedition on the drifting icefloe, and two and a half times as long as the Fram, though the drift of the latter lasted nearly three years. The Sedov began her drift considerably farther south than the Fram, and at the end of it she descended to more southerly latitudes than Nansen s vessel, yet the Sedov's drift lasted only 26 1/2 months. This indicates that the speed of the Sedov's drift was considerably greater than that of the Fram. The increased movement of ice from the Arctic Basin into the Greenland Sea is accompanied by an increase in the flow of warm Atlantic waters into the polar basin, a reduction in the volume of ice in seas bordering on the Arctic, a decrease in the thickness of polar ice and size of glaciers, and also by a rise in the winter temperatures of the air. All these phenomena are characteristic of the warmer temperatures we are now observing in the Arctic. Notwithstanding the fact that the line of the Sedov s drift was considerably more northerly than the line of the Fram s drift, the winter months in the Arctic in Nansen s time were several degrees colder than at the present time. The lowest temperature of the air ( 44. i ) was registered by the Sedov s crew on March , at lat, N., long. no 2o E. The lowest temperature during the drift of the Fram ( 520) was registered on January 15, 1896 approximately at lat N, long. 410 E., that is, appreciably more south-west than the spot where the Sedov's lowest temperature was registered and where, as a rule, it is warmer. The thickness of level ice according to the measurements of the Sedov s crew was not more than 218 cm. (7 ft. 2 in.). Nansen s expedition encountered ice 365 cm. in thickness. Analysis has shown that the lesser thickness of the ice in the region of the Sedov s drift was due not so much to the rise of the winter temperatures of the air as to the melting of the ice in recent years in summer time. B E L T O F H U M M O CK S In the light of the observations made by the Sedov s crew, interest is attached to questions concerning the maximum thickness of the ice. The members of the North Polar Expedition on the drifting icefloe never encountered ice of a greater thickness than 218 cm. That being the case, where was the icefield on which the expedition set up its observation station formed, and how did it reach the North Pole? We know that this icefield was more than 3 m. thick. Why was the Sedov, which on March 22, 1939, was 180 km. (97.12 nautical miles) farther to the north than the Fram and afterwards, like the Fram, turned westwards unable to penetrate to the 87th parallel? The highest latitude reached by the Fram was & ; the highest latitude reached by the Sedov was The northernmost point reached by Nansen during his sledge journey to the North Pole was lat. 86 i4 ; lastly, in 1900 Cagni in the same region reached lat N. Both Nansen and Cagni were prevented from going farther north by impenetrable hummocky ice. These data should be compared with the observations made by Alexeyev during his flights from Franz Josef Land to the North Pole and back. Alexeyev ascertained that from Rudolf Island up to lat. 82 3o N. lie hummocky fields of young ice dotted with icebergs. Higher, up to lat. 85 3o N., the size of the icefields increases, reaching 20 km across. On these fields are level platforms suitable for the landing of aeroplanes. A t the 84th parallel the thickness of the ice did not exceed cm. Beyond 85 3o commenced an icefield of ice many years old, while up to the 86th parallel the icefields were small and hummocky, and the lanes between the icefields were filled with broken ice. In these places it was impossible to land aeroplanes. Farther north, particularly between 87 and 88 3o, the icefields appeared more suitable for landing-places. The condition of the ice in the region of the North Polar Expedition on the drifting icefloe is already known. From the foregoing, we see that between the North Pole and Franz Josef Land is situated a belt of hummocks of a peculiar character. This belt separates the younger ice, formed mainly on the continental shelf of Eurasia, from the thicker ice near the North Pole. It seems that this belt of hummocks which, in its time, had stopped the further advance to the north of Nansen and Cagni, is a permanent feature.
7 N A N S E N S L A W S Four times a day the men on the Sedov transmitted by radio their position and meteorological observations. This made possible a comparison of the ice drift with the wind causing the drift. Such observations made near coasts are usually distorted by the nearness of land and shallows; and so, for a theoretical study we are only able to use the data supplied by three drifts, those of the Fram, of the Papanin North Polar Expedition on the drifting icefloe (while it was in the central part of the Arctic Ocean) and of the Sedov. Like all known drifts, the drift of the Sedov did not proceed in a straight line. The ice-breaker often turned back on her course, described zigzags and even loops. These changes of direction were caused by changes in the direction and velocity of the wind. In this connexion, very characteristic are the figure 8 described by the Sedov between October 2 and 26, and the zigzags between November 10 and 30, 1938, and the loop she made between January 3 and 17, The only difference between the direction of the drift and the direction of the wind was that the drift was deflected s o ^ o 0 to the right. Any deviation from this law can be attributed to the incompleteness of the Sedov s observations at my disposal. The observations of the Sedov worked out by me show that in the region where the Sedov drifted between September 1,1938, and February i, 1939, the constant current was so weak that it might be said to have been absent. As a result, almost laboratory conditions prevailed for the study of the relations between wind and drift. Far removed from the distorting influence of land and constant currents, the wind drift was shown here practically in its pure form. Iii this way it was possible to confirm yet again the exactness of the two simple laws of Nansen determining the behaviour of solid ice in the central part of the Arctic Basin. These laws are as follows : (1) The speed of the wind drift is approximately one fiftieth of the velocity of the wind causing the drift. (2) The drift of the ice is deflected from the direction of the wind by to the right owing to the influence of the deflecting force of the earth s rotation. Two Additional Laws. A study of the drift of the Sedov makes it possible to add to Nansen s two laws two other equally simple laws : (3) The drift of the ice follows the isobars. The ice drifts along these lines in such a way that the region of high pressure is to the right of the direction of the drift, and the region of low pressure to the left. (4) The drift of the ice takes place at a speed proportional to the gradient of atmospheric pressure, or in other words, inversely as the distance between the isobars. The first of these additional laws is not difficult to deduce. In moderate and high latitudes the wind, due to friction against the surface of the earth and to the influence of the deflecting force of the earth s rotation, is directed approximately to the left of the corresponding isobar. The drift of the ice. according to the second of Nansen s laws, is deflected from the direction of the wind approximately by to the right. Combining the two, we arrive at the drift of the ice along the isobar. The second additional law was arrived at thus. In the absence of constant currents and the deflecting influence of land, the ice moves at a speed proportional to the velocity of the wind. The latter, in its turn, is proportional to the gradient of atmospheric pressure; the closer the isobars are drawn on the synoptic chart for any given region, the stronger are the winds in that region. From this, supported by purely theoretical deductions, it was possible to judge from the synoptic chart not only the direction of the ice drift, but also its speed. Theoretical calculations made on the basis of the new laws confirm the hypothesis that the ice moves clockwise around the so-called pole of inaccessibility. Had the Sedov in January and February 1939 been somewhat more north than she actually was at that time,

8 it is highly probable that she would have been drawn into this clockwise movement around the pole of inaccessibility and would have been drifting now towards the northern coasts of America. The new laws offer an explanation of the known drifts of vessels and buoys and also of such arctic phenomena as Peary s polynia at the coast of Greenland, also the Great Siberian polynia stretching with interruptions from the New Siberia Islands to the Chukotsk Sea. These polynias coincide with the lines of separation of the ice, or in other words, with the lines of the divergence of the isobars. The movement of the ice along the isobars also explains why Amundsen s Maud, when entering the ice at Wrangel Island for the purpose of drifting across the North Pole, moved with the ice along the continental slope of the Asiatic coast, that is, along the parallel and not the meridian. It appears that the isobars in the vicinity of Wrangel Island both winter and summer stretch along the parallels. In order to drift with the ice to the North Pole it would be better to enter the ice in the region of the Beaufort Sea, whence, apparently, the icefield occupied by Papanin s North Polar Expedition was carried. T H E O R E T IC A L D R IF T A N D A C T U A L D R IFT. On the basis of the montly charts of pressure, the theoretical drifts were plotted of Papanin s North Polar Expedition (May 21, 1937, to February 1,1938), of the ice-breakers Sedov (November 1, 1937, to October 1, 1938) and Lenin. Afterwards, according to latitude and longitude, the actual drifts of these vessels were indicated on the chart. The similarity between the lines of the theoretical drifts and those of the actual drifts was noteworthy. The actual drifts of the Sedov and of the Lenin came very near those calculated by theory. There was, however, considerable difference between the actual and theoretical drifts of Papanin s North Polar Expedition. In the first place, the theoretical drift to Papanin s Expedition came out to the coast of Greenland, and in the second place, it was shorter than the actual (if calculated by latitude) by 550 nautical miles. This difference is accounted for by the fact that in calculating the theoretical drifts, account was taken only of the influence of local winds, whereas the movement of the ice is conditioned not only by winds, but also by constant currents. Naturally, in regions where the constant currents are weak, the influence of local winds on the speed and direction of the drift is paramount. With the approach to the Greenland Sea, the local winds, owing to the strong East Greenland current, have less and less influence on the icefields. The weak winds, the direction of which is contrary to that of the constant current, now only slow down or delay for a time the general drift to the south. This happened in the case of Papanin s North Polar Expedition, and also in the case of the Sedov. The difference between the actual and theoretical drifts of the Papanin North Polar Expedition is also connected with the speed of the wind drift of mass icefields in the central Arctic. This is one fiftieth of the velocity of the wind causing the drift; but the speed of the drift of ice under the influence of wind is considerably increased if ahead of the ice, in the direction of the wind, is open sea. In this case, the speed of the drift may reach one tenth of the velocity of the wind or sometimes even more. Conditions such as these are created when north and west winds prevail in the region of the central Arctic adjoining the Greenland Sea, or in the Greenland Sea itself. In this sea, along the east coast of Greenland right up to Lat. 6o N., summer and winter there moves to the south an uninterrupted line of polar ice carried from the Arctic Basin by the East Greenland current. A t the same time, to the north, along the west coasts of Scandinavia and Spitsbergen, flow warm Atlantic waters, which as a deep current later penetrate into the Arctic Basin. Owing to this, the eastern edge of the Greenland ice stretches approximately from Iceland through Jan Mayen Island to the north, up to the nortwestem extremity of Spitsbergen. In the summer, the edge recedes to the west, and, in the region situated to the north of Spitsbergen, in some years goes up to Lat. 82 N. In winter-time, the edge of the ice in the Greenland Sea moves somewhat to the east and at Spitsbergen descends to Lat. 8o N. ai<d lower. With western and northern winds the edge of the ice recedes to the east, the ice becoming somewhat less closely packed; with eastern and southern winds the edge of the ice recedes to the west and the ice becomes much more closely packed. Thus in the eastern part of the Greenland Sea at any time of the year are immense ice-free stretches of water.
9 T H E G R E E N L A N D S T R E A M Every year there flows into the Arctic Ocean about 5,000 cubic kilometres of river water. In addition about 30,000 cubic kilometres of Pacific waters and more than 100,000 cubic kilometres of warm Atlantic waters flow into the Arctic basin through the Bering Strait annually. A small proportion of this water passes into the Baffin Sea but the bulk flows into the Greenland Sea through the broad strait between Greenland and Spitsbergen, forming the East Greenland current. This current is maintained and considerably strengthened by the north and north-west winds which predominate on the east coast of Greenland. A s observations have shown, in the central basin, the speed of the constant current towards the Greenland Sea is not great: it is less than one nautical mile a day. But on approaching the Greenland Sea and within the Greenland Sea, the speed of the constant current increases. According to the calculations of Shirshov and Fedorov (of Papanin s North Polar Expedition), near the 83rd parallel the speed of the constant current towards the south reaches 4 km., near the 80th it is 6 km. and near the 75th parallel it is 9 km. a day. A t the end of August 1939, reaching the northern-most point of her drift, the Sedov began quickly to descend to the south-west, becoming gradually drawn into the Greenland current. From December 1, 1939, the drift proceeded due south, almost parallel to the drift of Papanin s North Polar Expedition, almost at the same speed with which the latter had drifted in that region two years previously. During the period of its drift, Papanin s North Expedition descended about 1,120 nautical miles to the south latitudinally. This route was covered under the influence of the constant current and local winds. If account is taken of the data of Shirshov and Fedorov concerning the direction and speed of the current, it appears that about 600 nautical miles of the total length of the drift was due to the accompanying sea currents, and only 520 nautical miles to accompanying winds. A t the same time, the theoretical drift for the Sedov was shorter than the actual drift by 550 nautical miles, because when plotting it, we gave consideration only to local winds. Taking into account the observations and calculations of Shirshov and Fedorov, we attempted to calculate the entire drift to Papanin s Expedition caused, on one hand, by the distribution of atmospheric pressure, and on the other, by the constant current. The results of this calculation made by myself with the help of my assistant, Mr. Somov, are of interest. Comparing the actual position of Papanin s North Polar Expedition on February 1, 1938, with the theoretical position, calculated according to my formulae, with due account of the constant curent, we find that the actual position of the Expedition differed from the theoretical position only by 50 miles in latitude, or only by 5 per cent of the total length of the drift in latitude. This comparison may be regarded as bordering on the limits of accuracy with which the original data were obtained.
Sea Ice Characteristics and Operational Conditions for Ships Working in the Eastern Zone of the NSR
 The Arctic 2030 Project: Feasibility and Reliability of Shipping on the Northern Sea Route and Modeling of an Arctic Marine Transportation & Logistics System 3-rd. Industry Seminar: Sea-Ice & Operational
The Planetary Circulation System
 12 The Planetary Circulation System Learning Goals After studying this chapter, students should be able to: 1. describe and account for the global patterns of pressure, wind patterns and ocean currents
CHAPTER IV THE RELATIONSHIP BETWEEN OCEANOGRAPHY AND METEOROLOGY
 CHAPTER IV THE RELATIONSHIP BETWEEN OCEANOGRAPHY AND METEOROLOGY THE relationship between oceanography and meteorology is of an order different from that between it and geology or biology, because meteorologic
1 What Is Climate? TAKE A LOOK 2. Explain Why do areas near the equator tend to have high temperatures?
 CHAPTER 17 1 What Is Climate? SECTION Climate BEFORE YOU READ After you read this section, you should be able to answer these questions: What is climate? What factors affect climate? How do climates differ
Canadian Ice Service
 Canadian Ice Service Key Points and Details concerning the 2009 Arctic Minimum Summer Sea Ice Extent October 1 st, 2009 http://ice-glaces.ec.gc.ca 1 Key Points of Interest Arctic-wide The Arctic-wide minimum
APPENDIX B PHYSICAL BASELINE STUDY: NORTHEAST BAFFIN BAY 1
 APPENDIX B PHYSICAL BASELINE STUDY: NORTHEAST BAFFIN BAY 1 1 By David B. Fissel, Mar Martínez de Saavedra Álvarez, and Randy C. Kerr, ASL Environmental Sciences Inc. (Feb. 2012) West Greenland Seismic
Satellites, Weather and Climate Module??: Polar Vortex
 Satellites, Weather and Climate Module??: Polar Vortex SWAC Jan 2014 AKA Circumpolar Vortex Science or Hype? Will there be one this year? Today s objectives Pre and Post exams What is the Polar Vortex
1 What Is Climate? TAKE A LOOK 2. Explain Why do areas near the equator tend to have high temperatures?
 CHAPTER 17 1 What Is Climate? SECTION Climate BEFORE YOU READ After you read this section, you should be able to answer these questions: What is climate? What factors affect climate? How do climates differ
4/29/2011. Mid-latitude cyclones form along a
 Chapter 10: Cyclones: East of the Rocky Mountain Extratropical Cyclones Environment prior to the development of the Cyclone Initial Development of the Extratropical Cyclone Early Weather Along the Fronts
World Geography Chapter 3
 World Geography Chapter 3 Section 1 A. Introduction a. Weather b. Climate c. Both weather and climate are influenced by i. direct sunlight. ii. iii. iv. the features of the earth s surface. B. The Greenhouse
Global Atmospheric Circulation
 Global Atmospheric Circulation Polar Climatology & Climate Variability Lecture 11 Nov. 22, 2010 Global Atmospheric Circulation Global Atmospheric Circulation Global Atmospheric Circulation The Polar Vortex
Ocean Boundary Currents Guiding Question: How do western boundary currents influence climate and ocean productivity?
 Name: Date: TEACHER VERSION: Suggested Student Responses Included Ocean Boundary Currents Guiding Question: How do western boundary currents influence climate and ocean productivity? Introduction The circulation
Contents. Section 1: Climate Factors. Section 2: Climate Types. Section 3: Climate Effects
 Contents Section 1: Climate Factors 1. Weather or Climate?.... 2 2. Elements of Climate.... 4 3. Factors Affecting Climate.... 10 4. Comparing Climates.... 15 5. Quiz 1.... 20 Section 2: Climate Types
Directed Reading. Section: Ocean Currents. a(n). FACTORS THAT AFFECT SURFACE CURRENTS
. FACTORS THAT AFFECT SURFACE CURRENTS") Skills Worksheet Directed Reading Section: Ocean Currents 1 A horizontal movement of water in a well-defined pattern is called a(n) 2 What are two ways that oceanographers identify ocean currents? 3 What
Skills Worksheet Directed Reading Section: Ocean Currents 1 A horizontal movement of water in a well-defined pattern is called a(n) 2 What are two ways that oceanographers identify ocean currents? 3 What
Serial No. N4470 NAFO SCR Doc. 01/83 SCIENTIFIC COUNCIL MEETING SEPTEMBER 2001
 NOT TO BE CITED WITHOUT PRIOR REFERENCE TO THE AUTHOR(S) Northwest Atlantic Fisheries Organization Serial No. N7 NAFO SCR Doc. /8 SCIENTIFIC COUNCIL MEETING SEPTEMBER Sea-surface Temperature and Water
The North Atlantic Oscillation: Climatic Significance and Environmental Impact
 1 The North Atlantic Oscillation: Climatic Significance and Environmental Impact James W. Hurrell National Center for Atmospheric Research Climate and Global Dynamics Division, Climate Analysis Section
AIR MASSES. Large bodies of air. SOURCE REGIONS areas where air masses originate
 Large bodies of air AIR MASSES SOURCE REGIONS areas where air masses originate Uniform in composition Light surface winds Dominated by high surface pressure The longer the air mass remains over a region,
North Pacific Climate Overview N. Bond (UW/JISAO), J. Overland (NOAA/PMEL) Contact: Last updated: September 2008
, J. Overland (NOAA/PMEL) Contact: Last updated: September 2008") North Pacific Climate Overview N. Bond (UW/JISAO), J. Overland (NOAA/PMEL) Contact: Nicholas.Bond@noaa.gov Last updated: September 2008 Summary. The North Pacific atmosphere-ocean system from fall 2007
North Pacific Climate Overview N. Bond (UW/JISAO), J. Overland (NOAA/PMEL) Contact: Nicholas.Bond@noaa.gov Last updated: September 2008 Summary. The North Pacific atmosphere-ocean system from fall 2007
Cruise Report R/V Oceania, AREX 2007
 Powstańców Warszawy 55, PL - 81-712 Sopot, P.O. Box 68 March 15, 2008 Cruise Report R/V Oceania, AREX 2007 Ship: R/V Oceania Cruise: AREX 2007 Dates: 19.06.2007 05.08.2007 Port Calls: Gdansk (Poland) Longyearbyen
Chapter 6. Antarctic oceanography
 Chapter 6 Antarctic oceanography The region of the world ocean bordering on Antarctica is unique in many respects. First of all, it is the only region where the flow of water can continue all around the
North Pacific Climate Overview N. Bond (UW/JISAO), J. Overland (NOAA/PMEL) Contact: Last updated: August 2009
, J. Overland (NOAA/PMEL) Contact: Last updated: August 2009") North Pacific Climate Overview N. Bond (UW/JISAO), J. Overland (NOAA/PMEL) Contact: Nicholas.Bond@noaa.gov Last updated: August 2009 Summary. The North Pacific atmosphere-ocean system from fall 2008 through
North Pacific Climate Overview N. Bond (UW/JISAO), J. Overland (NOAA/PMEL) Contact: Nicholas.Bond@noaa.gov Last updated: August 2009 Summary. The North Pacific atmosphere-ocean system from fall 2008 through
The Arctic Ocean Climate a balance between local radiation, advected heat and freshwater
 The Arctic Ocean Climate a balance between local radiation, advected heat and freshwater Bert Rudels Finnish Meteorological Institute, Helsinki, Finland French Arctic Initiative, Collège de France, Paris,
Please be ready for today by:
 Please be ready for today by: 1. HW out for a stamp 2. Paper and pencil/pen for notes 3. Be ready to discuss what you know about El Nino after you view the video clip What is El Nino? El Nino Basics El
Pacific Decadal Oscillation ( PDO ):
:") Time again for my annual Winter Weather Outlook. Here's just a small part of the items I considered this year and how I think they will play out with our winter of 2015-2016. El Nino / La Nina: When looking
Time again for my annual Winter Weather Outlook. Here's just a small part of the items I considered this year and how I think they will play out with our winter of 2015-2016. El Nino / La Nina: When looking
Global Wind Patterns
 Name: Earth Science: Date: Period: Global Wind Patterns 1. Which factor causes global wind patterns? a. changes in the distance between Earth and the Moon b. unequal heating of Earth s surface by the Sun
GEOGRAPHY STD.9 LATITUDE & LONGITUDE
 GEOGRAPHY STD.9 LATITUDE & LONGITUDE 1. What is the Earth Grid? A. The complete network of meridians & parallels is called the earth Grid. 2. What is Latitude? A. The latitude of a place is the distance
Global Weather Trade Winds etc.notebook February 17, 2017
 Global Weather 1 north pole northern hemisphere equator southern hemisphere south pole 2 We have seasons because of the Earth's tilt The seasons are opposite in the northern and southern hemispheres winter
Second Session of the Pan-Arctic Regional Climate Outlook Forum (PARCOF-2), virtual forum, October 2018
, virtual forum, October 2018") Second Session of the Pan-Arctic Regional Climate Outlook Forum (PARCOF-2), virtual forum, October 2018 Consensus Statement for the Arctic Winter 2018-2019 Season Outlook Climate change in the Arctic is
Second Session of the Pan-Arctic Regional Climate Outlook Forum (PARCOF-2), virtual forum, October 2018 Consensus Statement for the Arctic Winter 2018-2019 Season Outlook Climate change in the Arctic is
Activity #2 - Major Ocean Surface Currents
 Activity #2 - Major Ocean Surface Currents Concepts # 3 & 6 # 3 Atmospheric cells and ocean gyres redistribute heat from low to high latitudes, which influences climate, weather, and ocean temperature.
Lecture 5: Atmospheric General Circulation and Climate
 Lecture 5: Atmospheric General Circulation and Climate Geostrophic balance Zonal-mean circulation Transients and eddies Meridional energy transport Moist static energy Angular momentum balance Atmosphere
The weather in Iceland 2012
 The Icelandic Meteorological Office Climate summary 2012 published 9.1.2013 The weather in Iceland 2012 Climate summary Sunset in Reykjavík 24th April 2012 at 21:42. View towards west from the balcony
Unit 1: Geography. For additional information, refer to this website: 1 G e o g r a p h y
 Unit 1: Geography For additional information, refer to this website: http://mryoungtms.weebly.com/ 1 G e o g r a p h y Continents and Oceans SOL USI. 2a Essential Understanding: Continents are large land
8.1 Attachment 1: Ambient Weather Conditions at Jervoise Bay, Cockburn Sound
 8.1 Attachment 1: Ambient Weather Conditions at Jervoise Bay, Cockburn Sound Cockburn Sound is 20km south of the Perth-Fremantle area and has two features that are unique along Perth s metropolitan coast
Unseasonable weather conditions in Japan in August 2014
 Unseasonable weather conditions in Japan in August 2014 Summary of analysis by the TCC Advisory Panel on Extreme Climatic Events In an extraordinary session held at the Japan Meteorological Agency on 3
Water mass formation, subduction, and the oceanic heat budget
 Chapter 5 Water mass formation, subduction, and the oceanic heat budget In the first four chapters we developed the concept of Ekman pumping, Rossby wave propagation, and the Sverdrup circulation as the
3. HYDROMETEROLOGY. 3.1 Introduction. 3.2 Hydro-meteorological Aspect. 3.3 Rain Gauge Stations
 3. HYDROMETEROLOGY 3.1 Introduction Hydrometeorology is a branch of meteorology and hydrology that studies the transfer of water and energy between the land surface and the lower atmosphere. Detailed hydrological
Science 1206 Chapter 1 - Inquiring about Weather
 Science 1206 Chapter 1 - Inquiring about Weather 1.1 - The Atmosphere: Energy Transfer and Properties (pp. 10-25) Weather and the Atmosphere weather the physical conditions of the atmosphere at a specific
Here s what a weak El Nino usually brings to the nation with temperatures:
 Time again for my annual Winter Weather Outlook. Here's just a small part of the items I considered this year and how I think they will play out with our winter of 2018-2019. El Nino / La Nina: When looking
Winter. Here s what a weak La Nina usually brings to the nation with tempseraures:
 2017-2018 Winter Time again for my annual Winter Weather Outlook. Here's just a small part of the items I considered this year and how I think they will play out with our winter of 2017-2018. El Nino /
FEATURES OF TERRIGEN1C MATERIAL TRANSPORT BY ICE IN POLAR SEDIMENTATION
 G. A. Tar aso v Murmansk Marine Biological Institute of the Russian Academy of Sciences Robert Spielhagen GEO MOR, Kiel Hannes Grobe Alfred-Wegener-Institute for Polar and Marine Research, Bremerhaven
CHAPTER 9 ATMOSPHERE S PLANETARY CIRCULATION MULTIPLE CHOICE QUESTIONS
 CHAPTER 9 ATMOSPHERE S PLANETARY CIRCULATION MULTIPLE CHOICE QUESTIONS 1. Viewed from above in the Northern Hemisphere, surface winds about a subtropical high blow a. clockwise and inward. b. counterclockwise.
Regional Sea Ice Outlook for Greenland Sea and Barents Sea - based on data until the end of May 2013
 Regional Sea Ice Outlook for Greenland Sea and Barents Sea - based on data until the end of May 2013 Sebastian Gerland 1*, Max König 1, Angelika H.H. Renner 1, Gunnar Spreen 1, Nick Hughes 2, and Olga
Climatic Conditions Around Greenland 1995
 NAFO Sci. Coun. Studies, 27: 39 47 Climatic Conditions Around Greenland 1995 M. Stein Institut fur Seefischerei, Palmaille 9 D-22767 Hamburg, Federal Republic of Germany Abstract The annual review of variability
Analysis of Fall Transition Season (Sept-Early Dec) Why has the weather been so violent?
 Why has the weather been so violent?") WEATHER TOPICS Analysis of Fall Transition Season (Sept-Early Dec) 2009 Why has the weather been so violent? As can be seen by the following forecast map, the Fall Transition and early Winter Season of
WEATHER TOPICS Analysis of Fall Transition Season (Sept-Early Dec) 2009 Why has the weather been so violent? As can be seen by the following forecast map, the Fall Transition and early Winter Season of
Synoptic Analysis of Total Rainfall Patterns at Azerbaijan District.
 Synoptic Analysis of Total Rainfall Patterns at Azerbaijan District Samad Vahdati 1, Shahrokh Shahrokhi Shirvani 2, Abolfazl Nazari Giglou 3 1,3 Department of Civil Engineering, Parsabad Moghan Branch,
Weather Systems. Section
 Section 1 12.2 Objectives Compare and contrast the three major wind systems. Identify four types of fronts. Distinguish between highand low-pressure systems. Review Vocabulary convection: the transfer
Arctic oceanography; the path of North Atlantic Deep Water
 Chapter 7 Arctic oceanography; the path of North Atlantic Deep Water The importance of the Southern Ocean for the formation of the water masses of the world ocean poses the question whether similar conditions
Guided Notes Weather. Part 2: Meteorology Air Masses Fronts Weather Maps Storms Storm Preparation
 Guided Notes Weather Part 2: Meteorology Air Masses Fronts Weather Maps Storms Storm Preparation The map below shows North America and its surrounding bodies of water. Country borders are shown. On the
Map Elements & The 5 Oceans
 Map Elements & The 5 Oceans Latitude and Longitude Longitude lines run north and south. Latitude lines run east and west. The lines measure distances in degrees. Latitude Longitude Where is 0 degrees?
The surface of the ocean floor is as varied as the land. The five major oceans, from largest to smallest, are
 11.1 Ocean Basins The surface of the ocean floor is as varied as the land. The five major oceans, from largest to smallest, are w the Pacific w the Atlantic w the Indian w the Southern w the Arctic The
1 Earth s Oceans. TAKE A LOOK 2. Identify What are the five main oceans?
 CHAPTER 13 1 Earth s Oceans SECTION Exploring the Oceans BEFORE YOU READ After you read this section, you should be able to answer these questions: What affects the salinity of ocean water? What affects
Claim: Arctic, antarctic and Greenland ice loss is accelerating due to global warming REBUTTAL
 Claim: Arctic, antarctic and Greenland ice loss is accelerating due to global warming REBUTTAL Satellite and surface temperature records and sea surface temperatures show that both the East Antarctic Ice
L.O Students will learn about factors that influences the environment
 Name L.O Students will learn about factors that influences the environment Date 1. At the present time, glaciers occur mostly in areas of A) high latitude or high altitude B) low latitude or low altitude
Science 1206 SAMPLE Test ( Weather Dynamics)
") Science 1206 SAMPLE Test ( Weather Dynamics) Name:. Part A: Multiple Choice (60%) Shade the letter of the best answer on the Scantron sheet provided. 1. Which term refers to the current atmospheric conditions?
Science 1206 SAMPLE Test ( Weather Dynamics) Name:. Part A: Multiple Choice (60%) Shade the letter of the best answer on the Scantron sheet provided. 1. Which term refers to the current atmospheric conditions?
introduction National Council of Teachers of Mathematics.
 1 introduction The National Science Education Standards developed under the auspices of the National Research Council specifies Science as Inquiry as major content standard for all grade levels. The activities
Ocean Mixing and Climate Change
 Ocean Mixing and Climate Change Factors inducing seawater mixing Different densities Wind stirring Internal waves breaking Tidal Bottom topography Biogenic Mixing (??) In general, any motion favoring turbulent
Homework 9: Hurricane Forecasts (adapted from Pipkin et al.)
") November 2010 MAR 110 HW9 Hurricane Forecasts 1 Homework 9: Hurricane Forecasts (adapted from Pipkin et al.) Movement of Hurricanes The advance of a tropical storm or hurricane is controlled by the prevailing
November 2010 MAR 110 HW9 Hurricane Forecasts 1 Homework 9: Hurricane Forecasts (adapted from Pipkin et al.) Movement of Hurricanes The advance of a tropical storm or hurricane is controlled by the prevailing
Produced by Canadian Ice Service of. 2 December Seasonal Outlook Gulf of St Lawrence and East Newfoundland Waters Winter
 Environment Canada Environnement Canada Produced by Canadian Ice Service of Environment Canada 2 December 2010 Seasonal Outlook Gulf of St Lawrence and East Newfoundland Waters Winter 2010-2011 2010 Canadian
Winds and Global Circulation
 Winds and Global Circulation Atmospheric Pressure Winds Global Wind and Pressure Patterns Oceans and Ocean Currents El Nino How is Energy Transported to its escape zones? Both atmospheric and ocean transport
I. Ocean Layers and circulation types
 OCEAN Title CIRCULATION slide I. Ocean Layers and circulation types 1) Ocean Layers Ocean is strongly Stratified Consists of distinct LAYERS controlled by density takes huge amounts of energy to mix up
Choose a goal ANSWERS
 Choose a goal In order to help you focus on a topic, you will need to determine what your main goal will be. Whilst there may be some overlap in your purpose, some important main goals include: : entertain
Prepared by the North American Ice Service. 4 December Seasonal Outlook Great Lakes Winter
 Prepared by the North American Ice Service A collaboration of the Canadian Ice Service and the National/Naval Ice Center 4 December 2008 Seasonal Outlook Great Lakes Winter 2008-2009 - 1 - Table of contents
Meteorology Lecture 15
 Meteorology Lecture 15 Robert Fovell rfovell@albany.edu 1 Important notes These slides show some figures and videos prepared by Robert G. Fovell (RGF) for his Meteorology course, published by The Great
1. INTRODUCTION: 2. DATA AND METHODOLOGY:
 27th Conference on Hurricanes and Tropical Meteorology, 24-28 April 2006, Monterey, CA 3A.4 SUPERTYPHOON DALE (1996): A REMARKABLE STORM FROM BIRTH THROUGH EXTRATROPICAL TRANSITION TO EXPLOSIVE REINTENSIFICATION
Colorado CoCoRaHS. Colorado CoCoRaHS. Because Every Drop Counts! November 2014 Volume 2, Issue 11
 U.S. PRECIPITATION (% OF AVERAGE) LOOKING BACK AT OCTOBER 2014 October was a fairly dry month for much of the nation with the exception of the Pacific Northwest, portions of New England and the Tennessee
Analysis of the 500 mb height fields and waves: testing Rossby wave theory
 Analysis of the 500 mb height fields and waves: testing Rossby wave theory Jeffrey D. Duda, Suzanne Morris, Michelle Werness, and Benjamin H. McNeill Department of Geologic and Atmospheric Sciences, Iowa
Warm Up Vocabulary Check
 Warm Up Vocabulary Check Surface current Coriolis Effect global winds upwelling Gulf Stream deep current climate El Nino convection current continental deflection 1.The apparent curving of the path of
Currents & Gyres Notes
 Currents & Gyres Notes Current A river of water flowing in the ocean. 2 Types of Currents Surface Currents wind-driven currents that occur in the top 100m or less Deep Currents density-driven currents
Air Masses, Fronts, Storm Systems, and the Jet Stream
 Air Masses, Fronts, Storm Systems, and the Jet Stream Air Masses When a large bubble of air remains over a specific area of Earth long enough to take on the temperature and humidity characteristics of
1. Which weather map symbol is associated with extremely low air pressure? A) B) C) D) 2. The diagram below represents a weather instrument.
 B) C) D) 2. The diagram below represents a weather instrument.") 1. Which weather map symbol is associated with extremely low air pressure? 2. The diagram below represents a weather instrument. Which weather variable was this instrument designed to measure? A) air pressure
1. Which weather map symbol is associated with extremely low air pressure? 2. The diagram below represents a weather instrument. Which weather variable was this instrument designed to measure? A) air pressure
Weather Atmospheric condition in one place during a limited period of time Climate Weather patterns that an area typically experiences over a long
 Weather Atmospheric condition in one place during a limited period of time Climate Weather patterns that an area typically experiences over a long period of time Many factors influence weather & climate
Storm and Storm Systems Related Vocabulary and Definitions. Magnitudes are measured differently for different hazard types:
 Storm and Storm Systems Related Vocabulary and Definitions Magnitude: this is an indication of the scale of an event, often synonymous with intensity or size. In natural systems, magnitude is also related
Variations of atmospheric electric field and meteorological parameters in Kamchatka in
 Variations of atmospheric electric field and meteorological parameters in Kamchatka in 1997-2016 Sergey Smirnov 1, 1 Institute of Cosmophysical Research and Radio Wave Propagation FEB RAS, Paratunka, Russia
GEOPHYSICAL STUDIES ALONG NORTHERN ELLESMERE ISLAND
 GEOPHYSICAL STUDIES ALONG NORTHERN ELLESMERE ISLAND A. P. Crary" Part I. Bathymetry ATER depths in the general area of ard Hunt Island off the north coast of Ellesmere Island, extending east to Point Moss
AIR MASSES SOURCE REGION CHARACTERISTICS Continental Arctic (ca) Greenland, Antarctica, Highest latitudes of Asia and North America
 Greenland, Antarctica, Highest latitudes of Asia and North America") GEOGRAPHY CLIMATOLOGY AIRMASS, FRONT AND TEMPERATE CYCLONE AIRMASS A large body of air having little horizontal variation in temperature and moisture is called an airmass. Airmass acquires its properties
GEOGRAPHY CLIMATOLOGY AIRMASS, FRONT AND TEMPERATE CYCLONE AIRMASS A large body of air having little horizontal variation in temperature and moisture is called an airmass. Airmass acquires its properties
3) What is the difference between latitude and longitude and what is their affect on local and world weather and climate?
 What is the difference between latitude and longitude and what is their affect on local and world weather and climate?") www.discoveryeducation.com 1) Describe the difference between climate and weather citing an example of each. Describe how water (ocean, lake, river) has a local effect on weather and climate and provide
www.discoveryeducation.com 1) Describe the difference between climate and weather citing an example of each. Describe how water (ocean, lake, river) has a local effect on weather and climate and provide
CYCLONIC AND FRONTAL ACTIVITY IN OHIO DURING THE SUMMER OF 1953
 CYCLONIC AND FRONTAL ACTIVITY IN OHIO DURING THE SUMMER OF 1953 ROBERT D. RUDD Department of Geography and Geology, Ohio University, Athens The summer of 1953 was an unusually dry one in most of southern
Outline: 1) Extremes were triggered by anomalous synoptic patterns 2) Cloud-Radiation-PWV positive feedback on 2007 low SIE
 Extremes were triggered by anomalous synoptic patterns 2) Cloud-Radiation-PWV positive feedback on 2007 low SIE") Identifying Dynamical Forcing and Cloud-Radiative Feedbacks Critical to the Formation of Extreme Arctic Sea-Ice Extent in the Summers of 2007 and 1996 Xiquan Dong University of North Dakota Outline: 1)
Identifying Dynamical Forcing and Cloud-Radiative Feedbacks Critical to the Formation of Extreme Arctic Sea-Ice Extent in the Summers of 2007 and 1996 Xiquan Dong University of North Dakota Outline: 1)
Seasonal Summary. Great Lakes Winter By the North American Ice Service
 Seasonal Summary Great Lakes Winter 2014-2015 By the North American Ice Service Summary for the Great Lakes The 2014-2015 winter in the Great Lakes region was a season that was punctuated by three distinct
Name: Climate Date: EI Niño Conditions
 Name: Date: Base your answers to questions 1 and 2 on the maps and the passage below. The maps show differences in trade wind strength, ocean current direction, and water temperature associated with air-pressure
What a Hurricane Needs to Develop
 Weather Weather is the current atmospheric conditions, such as air temperature, wind speed, wind direction, cloud cover, precipitation, relative humidity, air pressure, etc. 8.10B: global patterns of atmospheric
Name Period 4 th Six Weeks Notes 2013 Weather
 Name Period 4 th Six Weeks Notes 2013 Weather Radiation Convection Currents Winds Jet Streams Energy from the Sun reaches Earth as electromagnetic waves This energy fuels all life on Earth including the
Fort Lewis, Washington (47 05'N, 'W)
") Fort Lewis, Washington (47 05'N, 122 35'W) Full Year Climatology CONVENTIONS: The spelling of place names and geographical features are those used by the National Imagery and Mapping Agency (NIMA). All
Fort Lewis, Washington (47 05'N, 122 35'W) Full Year Climatology CONVENTIONS: The spelling of place names and geographical features are those used by the National Imagery and Mapping Agency (NIMA). All
Meteorology. Circle the letter that corresponds to the correct answer
 Chapter 3 Worksheet 1 Meteorology Name: Circle the letter that corresponds to the correct answer 1) If the maximum temperature for a particular day is 26 C and the minimum temperature is 14 C, the daily
Website Lecture 3 The Physical Environment Part 1
 Website http://websites.rcc.edu/halama Lecture 3 The Physical Environment Part 1 1 Lectures 3 & 4 1. Biogeochemical Cycling 2. Solar Radiation 3. The Atmosphere 4. The Global Ocean 5. Weather and Climate
Occurrence of heavy rainfall around the confluence line in monsoon disturbances and its importance in causing floods
 Occurrence of heavy rainfall around the confluence line in monsoon disturbances and its importance in causing floods GNAGESWARA RAO Department of Meteorology & Oceanography, Andhra University, Visakhapatnam
Ice and Ocean Mooring Data Statistics from Barrow Strait, the Central Section of the NW Passage in the Canadian Arctic Archipelago
 Ice and Ocean Mooring Data Statistics from Barrow Strait, the Central Section of the NW Passage in the Canadian Arctic Archipelago Simon Prinsenberg and Roger Pettipas Bedford Institute of Oceanography,
A Synthesis of Results from the Norwegian ESSAS (N-ESSAS) Project
 Project") A Synthesis of Results from the Norwegian ESSAS (N-ESSAS) Project Ken Drinkwater Institute of Marine Research Bergen, Norway ken.drinkwater@imr.no ESSAS has several formally recognized national research
A Synthesis of Results from the Norwegian ESSAS (N-ESSAS) Project Ken Drinkwater Institute of Marine Research Bergen, Norway ken.drinkwater@imr.no ESSAS has several formally recognized national research
The Nike Shoe, Rubber Duck, & Hockey Glove Investigation
 Name: Advisory: The Nike Shoe, Rubber Duck, & Hockey Glove Investigation What do 80,000 Nike sneakers, 29,000 rubber duckies, & 5 million hockey gloves have in common? Large ships loaded with containers
ATMOSPHERE PACKET CHAPTER 22 PAGES Section 1 page 546
 Name: Period: ATMOSPHERE PACKET CHAPTER 22 PAGES 546-564 Section 1 page 546 1. Identify five main components of the atmosphere 2. Explain the cause of atmospheric pressure. 3. Why is atmospheric pressure
WINTER FORECAST NY Metro
 2015-2016 WINTER FORECAST NY Metro Weather @NY_WX DISCLAIMER: Seasonal forecasting is difficult and this is my first attempt at a Winter Forecast. I ve looked at all factors and put them together to create
Examples of Pressure Gradient. Pressure Gradient Force. Chapter 7: Forces and Force Balances. Forces that Affect Atmospheric Motion 2/2/2015
 Chapter 7: Forces and Force Balances Forces that Affect Atmospheric Motion Fundamental force - Apparent force - Pressure gradient force Gravitational force Frictional force Centrifugal force Forces that
Eurasian Snow Cover Variability and Links with Stratosphere-Troposphere Coupling and Their Potential Use in Seasonal to Decadal Climate Predictions
 US National Oceanic and Atmospheric Administration Climate Test Bed Joint Seminar Series NCEP, Camp Springs, Maryland, 22 June 2011 Eurasian Snow Cover Variability and Links with Stratosphere-Troposphere
CHAPTER 2 SKILL SHEET 2: CELESTIAL NAVIGATION
 CHAPTER 2 SKILL SHEET 2: CELESTIAL NAVIGATION Before the invention of GPS technology, how were people on ships far at sea, out of the sight of land, able to tell where they were? For thousands of years
PRELIMINARY WINTER OUTLOOK 2017/18 Joseph D Aleo, WeatherBell Analytics Seasonal forecasting is challenge for many reasons. There are many drivers
 PRELIMINARY WINTER OUTLOOK 2017/18 Joseph D Aleo, WeatherBell Analytics Seasonal forecasting is challenge for many reasons. There are many drivers that influence winters. When they synchronize, forecasters
Understanding Projections
 GEOGRAPHY SKILLS 1 Understanding Projections The earth is a sphere and is best shown as a globe. For books and posters, though, the earth has to be represented as a flat object. To do this, mapmakers create
according to and water. High atmospheric pressure - Cold dry air is other air so it remains close to the earth, giving weather.
 EARTH'S ATMOSPHERE Composition of the atmosphere - Earth's atmosphere consists of nitrogen ( %), oxygen ( %), small amounts of carbon dioxide, methane, argon, krypton, ozone, neon and other gases such
KUALA LUMPUR MONSOON ACTIVITY CENT
 T KUALA LUMPUR MONSOON ACTIVITY CENT 2 ALAYSIAN METEOROLOGICAL http://www.met.gov.my DEPARTMENT MINISTRY OF SCIENCE. TECHNOLOGY AND INNOVATIO Introduction Atmospheric and oceanic conditions over the tropical
Social Studies - Read the article "The Earliest Americans" and complete the Build Your Map Skills page and Extinct Animals of North America page.
 Day 2 Social Studies - Read the article "" and complete the Build Your Map Skills page and Extinct Animals of North America page. Language Arts - Draw a self-portrait of yourself in the center of a piece
4.3 Climate (6.3.3) Explore this Phenomena. The same sun shines on the entire Earth. Explain why these two areas have such different climates.
 Explore this Phenomena. The same sun shines on the entire Earth. Explain why these two areas have such different climates.") Explore this Phenomena The same sun shines on the entire Earth. 4.3 Climate (6.3.3) Explain why these two areas have such different climates. 89 6.3.3 Climate Develop and use a model to show how unequal
Explore this Phenomena The same sun shines on the entire Earth. 4.3 Climate (6.3.3) Explain why these two areas have such different climates. 89 6.3.3 Climate Develop and use a model to show how unequal