Climate Change Impacts and Adaptation for Coastal Transport Infrastructure in Caribbean SIDS. Applying the thresholds method/approach
|
|
|
- Lora Bond
- 5 years ago
- Views:
Transcription
1 UNCTAD National Workshop Jamaica 30 May 1 June 2017, Kingston, Jamaica Climate Change Impacts and Adaptation for Coastal Transport Infrastructure in Caribbean SIDS Applying the thresholds method/approach The Example of SAINT LUCIA By Isavela Monioudi University of the Aegean, Greece This expert paper is reproduced by the UNCTAD secretariat in the form and language in which it has been received. The views expressed are those of the author and do not necessarily reflect the views of the UNCTAD.


2 Applying the thresholds method/approach Τhe example of SAINT LUCIA Isavela Monioudi Synopsis 1. The operational thresholds method Collection of climate data 2.3 Estimation of historical and future disruptions 3. The Example of Jamaica 4. Some thoughts 1
3 The operational thresholds method Identify operational thresholds Collect climate data (historical and future projections) Assess current exposure (historical and present disruptions) (Future disruptions) Determine exposure to sea level rise and storm surge Determine exposure to temperature, precipitation, and other climate hazards Critical assets The four major transportation assets in Saint Lucia are: o o o o Hewanorra International Airport George F. L. Charles Airport Port Castries Port Vieux Fort 2

4 Employee ability to work safely outdoors and heat index Heat index is provided at Generic thresholds: Heat Index over 103 F is high risk Heat Index over 115 F is very high risk Employee ability to work safely outdoors and heat index For example the threshold of heat index equal 115 F will be exceeded if the temperature is over 92 F and at the same time humidity is over 75%. Combinations of temperature and relative humidity Humidity Heat index thresholds 70% 75% 80% 85% 90% 95% 100% Heat Index over 39.4 C (103 F) is high risk 32.2 C (89.9 F) 31.4 C (88.5 F) 30.8 C (87.5 F) 30.4 C (86.8 F) 29.9 C (85.8 F) 29.4 C (85 F) 28.9 C (84 F) Heat Index over 46 C (115 F) is very high risk 34 C (93.2 F) 33.3 C (92 F) 32.6 C (90.7 F) 32.1 C (89.7 F) 31.5 C (88.7 F) 31.1 C (87.9 F) 30.4 C (86.7 F) All combinations of Temperature and Humidity were compared with climate data and it was found that most disruptions are likely to be associated with relative humidity of 80 %. 3
5 Aircraft Runway Length Requirements and Temperature Takeoff length requirements vary by aircraft type, and are available from aircraft manufacturers. The types of aircrafts that fly into HIA include, inter alia, Airbuses (A300 s) Boeings ( ), DC10, DHC 6-8. For Boeing aircrafts this information is available at: Source: Boeing, 2013 ( This manual (Boeing, 2013) provides Takeoff Runway Length Requirements, in a series of charts. Each chart shows the runway length requirements for a different air temperature starting from the Standard Day (STD) temperature of 15 C. The temperatures that Boeing aircrafts will require a runway longer than the existing runway of HIA were estimated and used as thresholds. Aircraft Runway Length Requirements and Temperature Assuming the following conditions: o maximum aircraft takeoff weight o sea level o dry runway o zero wind o zero runway gradient o air conditioning off o and optimum flap setting The Takeoff length requirement for STD temperature (15 C) is 7000 ft. 4
 is 7600 ft.")
6 Aircraft Runway Length Requirements and Temperature Assuming the following conditions: o maximum aircraft takeoff weight o sea level o dry runway o zero wind o zero runway gradient o air conditioning off o and optimum flap setting The Takeoff length requirement for STD + 15 C temperature (30 C) is 7600 ft. Aircraft Runway Length Requirements and Temperature Using the charts, takeoff runway length requirements for 4 models of Boeing 737 aircraft under multiple temperature conditions were estimated. Hewanorra International Airport (HIA) has a runway length of 2,744 m (9,003 ft) Takeoff length requirements by aircraft type and temperature. 5

7 Increase of Energy cost and Temperature Extreme heat can raise energy costs for cooling. According to generic standard 1 C warming will result to 5% increase in energy costs. Using historical observed data of monthly scale from the Met office service, mean temperature for the period was estimated to be 26.8 C. If temperature exceeds 27.8 C, 29.8 C and 32.8 C the energy cost will raise by 5%, 15% and 30% respectively. Other Generic thresholds 6
8 Collection of climate data The database of the Caribbean Community Climate Change Centre (CCCCC) was used as a source, since it provides daily-scale climate data. Daily-scale climate data for the period from the Regional Climate Model (PRECIS) were obtained. The available projections were based on the A1B scenario which is compatible with the RCP 6.0. Assess current exposure Historical data in a daily scale, from the CCCCC database were used. The data were compared with thresholds and the number of days that the operational thresholds have been exceeded historically, was estimated. 7
9 (temperature, precipitation, and other climate hazards) o Compare the projected climate data with the operational thresholds. o Estimate the number of times the operational thresholds will be exceeded in the future Determine exposure to temperature, precipitation, and other climate hazards Extreme Heat Aircraft take-off length requirements Days of disruptions for the airports. Airports Disruptions (average days/year) Climate Stressor Sensitivity Threshold Heat Index* over 30.8 C (87.5 F) with relative Employee ability humidity 80% is high risk (41 days) (264 days) (1073 days) to work safely Heat Index* over 32.9 C (90.7 F) with relative outdoors 0 humidity 80% is very high risk (21 days) (236 days) Boeing aircraft would not be able to 2.2 take off from HIA if the temperature exceeds 0 0 (44 days) 34.2 C without reducing aircraft loads Wind Speeds Inability of aircraft to land or take off Boeing /-800W/BBJ2 aircraft would not be able to take off from HIA if the temperature exceeds 33 C without reducing aircraft loads Boeing aircraft would not be able to take off from HIA if the temperature exceeds 31.2 C without reducing aircraft loads Boeing aircraft would not be able to take off from HIA if the temperature exceeds 31 C without reducing aircraft loads (22 days) 1.7 (34 days) 0.7 (14 days) 12.1 (242 days) (245 days) 12.2 (244 days) 67.5 (1350 days) 67.9 (1357 days) Commercial airports: sustained winds of 20 m/s General Aviation airports: 11.2 m/s 0.2 (4 days) 0.1 (2 days) 0.05 (1 days) 8
10 Determine exposure to temperature, precipitation, and other climate hazards Extreme Heat Energy costs Days of disruptions for the sea ports. Ports Disruptions (average days/year) Climate Stressor Sensitivity Threshold C warming = 5% increase in energy costs if temperature exceeds 27.8 C (mean temperature for N/A (4419 days) (7029 days) the period : 26.8 C) Precipitation Wind Speed Low visibility inhibits crane operation Ability to berth ships (due to waves) 3 C warming = 15% increase in energy costs if temperature exceeds 29.8 C (mean temperature for the period : 26.8 C) 6 C warming = 30% increase in energy costs if temperature exceeds 32.8 C (mean temperature for the period : 26.8 C) Intense rainfall (e.g., > 20 mm/day) Very heavy rainfall (e.g. >50 mm/day) Winds 18 m/s (40.3 mph, 35 knots) force operational shutdown With winds of m/s ( mph, knots), discretion is applied N/A N/A 43.5 (870 days) 0.9 (18 days) 47.6 (951 days) 1 (20 days) 45.5 (910 days) 0.8 (16 days) 179 (3581 days) 15.4 (308 days) 46.7 (934 days) 0.8 (16 days) (1 days) 0 In Saint Lucia, coastal flooding is primarily caused by tropical storms and hurricanes. ESLs were estimated for Saint Lucia (and Jamaica). In order to assess the impacts of a Caribbean hurricane, the effect of a hurricane with the characteristics of Thomas were superimposed on the ESL projections. Flood/inundation was assessed (This work is made by the collaborating institute Joint Research Centre (JRC-EC), using dynamic inundation modeling (LISFLOOD-ACC) 9
11 Extreme Sea levels from JRC: ESL are driven by the combined effect of MSL, tides (η tide ) and water level fluctuations due to waves and storm surges (η w ss ). As a result, ESL can be defined as (Vousdoukas et al., 2017): ESL = MSL + η tide + η w ss The climate extremes contribution η w ss from waves and storm surge can be estimated according to the following equation: η w ss = SSL H s where SSL is the storm surge level, H s is the significant wave height and 0.2 H s is the wave set-up. Extreme Sea levels for Saint Lucia (MSL + tide + storm surge + wave set up + hurricane) from JRC: Time evolution of ESLs for 3 return periods (RP) and according with the RCP scenarios (a) 4.5 and (b)


 100-year ESL (RCP 8.")
12 and hurricane Inundation maps for a Caribbean hurricane (Thomas) superimposed on a 100-year ESL (RCP 4.5, 2050) (ESL = 1.66 m) and hurricane Inundation maps for a Caribbean hurricane (Thomas) superimposed on a 100-year ESL (RCP 8.5, 2100) (ESL = 2.23 m) 11
13 and hurricane Table summarizing the impacts to major transportation assets due to coastal flooding. 0: no impacts, 1: Low impact, 2: medium impact, 3: high impact. ESL plus Graded impacts to the Major Assets Scenarios Hurricane (m) HIA GFL IA Port Vieux Fort Port Castries RCP (RP=1/10) RCP (RP=1/50) RCP (RP=1/100) RCP (RP=1/10) RCP (RP=1/50) RCP (RP=1/100) RCP (RP=1/10) RCP (RP=1/50) RCP (RP=1/100) RCP (RP=1/10) RCP (RP=1/50) RCP (RP=1/100) The Example of Jamaica Extreme Sea levels for Jamaica (MSL + tide + storm surge + wave set up + hurricane) from JRC: Time evolution of ESLs for 3 return periods (RP) and according with the RCP scenarios (a) 4.5 and (b)

 superimposed on a 100-year ESL (a) RCP 4.")
 The Example of Jamaica and hurricane Kingston Freeport")
 13")
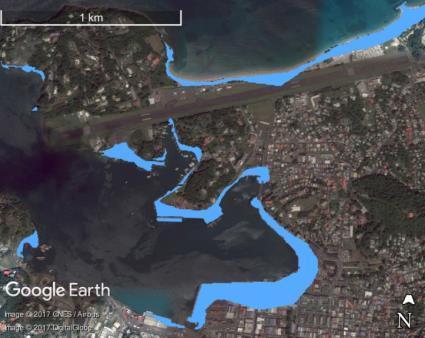
14 The Example of Jamaica and hurricane Donald Sangster International Airport (Runway elevation = 1.37 m) (a) (b) Inundation maps for a Caribbean hurricane (Thomas) superimposed on a 100-year ESL (a) RCP 4.5, 2050 (ESL = 1.47 m) and (b) RCP 8.5, 2100 (ESL = 2.10 m) The Example of Jamaica and hurricane Kingston Freeport Terminal (Port elevation = 4 m) (a) (b) Inundation maps for a Caribbean hurricane (Thomas) superimposed on a 100-year ESL (a) RCP 4.5, 2050 (ESL = 1.47 m) and (b) RCP 8.5, 2100 (ESL = 2.10 m) 13
15 Some thoughts Using the operational threshold method the historical and future disruptions can be determined Through the inundation mapping the locations which are most likely to be inundated can be determined The results of the application in Saint Lucia can be improved if the following information is available: o Specific operational thresholds for the specific facilities o Historical (observed) data in daily scale o DEM or LIDAR data of high resolution 14
Climate Change Impacts and Adaptation for Coastal Transport Infrastructure in Caribbean SIDS
 UNCTAD National Workshop Saint Lucia 24 26 May 2017, Rodney Bay, Saint Lucia Climate Change Impacts and Adaptation for Coastal Transport Infrastructure in Caribbean SIDS Applying the thresholds method/approach
SAINT LUCIA: A case study
 Climate Change Impacts on Coastal Transportation Infrastructure in the Caribbean: Enhancing the Adaptive Capacity of Small Island Developing States (SIDS) SAINT LUCIA: A case study EXECUTIVE SUMMARY* Prepared
Climate Change Impacts and Adaptation for Coastal Transport Infrastructure in Caribbean SIDS
 UNCTAD National Workshop Saint Lucia 24 26 May 2017, Rodney Bay, Saint Lucia Climate Change Impacts and Adaptation for Coastal Transport Infrastructure in Caribbean SIDS LISCoAsT Large Scale Integrated
Climate Change Impacts and Adaptation for Coastal Transport Infrastructure in Caribbean SIDS
 UNCTAD National Workshop Saint Lucia 24 26 May 2017, Rodney Bay, Saint Lucia Climate Change Impacts and Adaptation for Coastal Transport Infrastructure in Caribbean SIDS LISCoAsT Large Scale Integrated
Climate Change Impacts and Adaptation for Coastal Transport Infrastructure in Caribbean SIDS
 UNCTAD National Workshop Jamaica 30 May 1 June 2017, Kingston, Jamaica Climate Change Impacts and Adaptation for Coastal Transport Infrastructure in Caribbean SIDS LISCoAsT Large Scale Integrated Sealevel
Saint Lucia: A case study
 Climate Change Impacts on Coastal Transport Infrastructure in the Caribbean: Enhancing the Adaptive Capacity of Small Island Developing States (SIDS) Saint Lucia: A case study Climate Change Impacts on
Climate Change Impacts and Risks: The Challenge for Caribbean Ports. STC-13, April Georgetown, Guyana
 Climate Change Impacts and Risks: The Challenge for Caribbean Ports STC-13, April 15-18 Georgetown, Guyana Leonard A. Nurse, PhD CERMES, Faculty of Pure and Applied Sciences University of the West Indies
User s Guide to Storm Hazard Maps and Data
 Storm Hazard Assessment for St. Lucia and San Pedro/Ambergris Caye, Belize User s Guide to Storm Hazard Maps and Data Prepared For: Caribbean Development Bank Advanced technology and analysis solving problems
Climate Change Impacts and Adaptation for Coastal Transport Infrastructure in the Caribbean
 UNCTAD Regional Workshop 5 7 December 2017, Bridgetown, Barbados Climate Change Impacts and Adaptation for Coastal Transport Infrastructure in the Caribbean Climate change projections for the Caribbean
Climate Change Impacts and Adaptation for Coastal Transport Infrastructure in Caribbean SIDS
 UNCTAD National Workshop Saint Lucia 24 26 May 2017, Rodney Bay, Saint Lucia Climate Change Impacts and Adaptation for Coastal Transport Infrastructure in Caribbean SIDS Impacts of Natural Hazards on the
Climate Change Impacts and Adaptation for Coastal Transport Infrastructure in Caribbean SIDS
 UNCTAD National Workshop Jamaica 30 May 1 June 2017, Kingston, Jamaica Climate Change Impacts and Adaptation for Coastal Transport Infrastructure in Caribbean SIDS Climate Change Projections for the Caribbean
Climate Change Impacts and Adaptation for Coastal Transport Infrastructure in Caribbean SIDS
 UNCTAD National Workshop Jamaica 30 May 1 June 2017, Kingston, Jamaica Climate Change Impacts and Adaptation for Coastal Transport Infrastructure in Caribbean SIDS Impacts of Natural Hazards on the Transport
Storm and Storm Systems Related Vocabulary and Definitions. Magnitudes are measured differently for different hazard types:
 Storm and Storm Systems Related Vocabulary and Definitions Magnitude: this is an indication of the scale of an event, often synonymous with intensity or size. In natural systems, magnitude is also related
Miami-Dade County Overview
 Miami-Dade County Overview 2,000 square miles World s busiest cruise port 2.6 million residents Second busiest US airport for international travelers Gateway to the Caribbean and Latin America Natural
Boston Coastal Flooding Analysis and Mapping
 Boston Coastal Flooding Analysis and Mapping Philip Orton, Dara Mendeloff, Jane Mills, Malgosia Madajewicz Funding This research was funded by the National Oceanic and Atmospheric Administration (NOAA)
CURRENT AND FUTURE TROPICAL CYCLONE RISK IN THE SOUTH PACIFIC
 CURRENT AND FUTURE TROPICAL CYCLONE RISK IN THE SOUTH PACIFIC COUNTRY RISK PROFILE: SAMOA JUNE 2013 Samoa has been affected by devastating cyclones on multiple occasions, e.g. tropical cyclones Ofa and
Coastal Inundation Forecasting Demonstration Project CIFDP. Flood Forecasting Initiative-Advisory Group (FFI-AG 3), Geneva, 5-7 Dec, 2017
, Geneva, 5-7 Dec, 2017") Coastal Inundation Forecasting Demonstration Project CIFDP Flood Forecasting Initiative-Advisory Group (FFI-AG 3), Geneva, 5-7 Dec, 2017 Coastal Flooding & Vulnerable Populations Coastal populations are
Coastal Inundation Forecasting Demonstration Project CIFDP Flood Forecasting Initiative-Advisory Group (FFI-AG 3), Geneva, 5-7 Dec, 2017 Coastal Flooding & Vulnerable Populations Coastal populations are
Three main areas of work:
 Task 2: Climate Information 1 Task 2: Climate Information Three main areas of work: Collect historical and projected weather and climate data Conduct storm surge and wave modeling, sea-level rise (SLR)
CLIMATE-SMART AGRICULTURE: THE POTENTIAL ROLE OF MODELLING AS PART OF
 CLIMATE-SMART AGRICULTURE: THE POTENTIAL ROLE OF MODELLING AS PART OF THE SOLUTION FOR THE CARIBBEAN Michael A. Taylor Climate Studies Group, Mona University of the West Indies, Mona. IN THE CONTEXT OF
Understanding Weather and Climate Risk. Matthew Perry Sharing an Uncertain World Conference The Geological Society, 13 July 2017
 Understanding Weather and Climate Risk Matthew Perry Sharing an Uncertain World Conference The Geological Society, 13 July 2017 What is risk in a weather and climate context? Hazard: something with the
Covered Area Rainfall Event (29-30 September 2016) Tropical Cyclone Matthew Excess Rainfall
 Tropical Cyclone Matthew Excess Rainfall") Covered Area Rainfall Event (29-30 September 2016) Tropical Cyclone Matthew Excess Rainfall Event Briefing Dominica 11 October 2016 Registered Office: c/o Sagicor Insurance Managers Ltd., 103 South Church
Covered Area Rainfall Event (29-30 September 2016) Tropical Cyclone Matthew Excess Rainfall Event Briefing Dominica 11 October 2016 Registered Office: c/o Sagicor Insurance Managers Ltd., 103 South Church
JCOMM-CHy Coastal Inundation Forecasting Demonstration Project (CIFDP)
") WMO World Meteorological Organization Working together in weather, climate and water JCOMM-CHy Coastal Inundation Forecasting Demonstration Project (CIFDP) Coastal Flooding & Vulnerable Populations Coastal
WMO World Meteorological Organization Working together in weather, climate and water JCOMM-CHy Coastal Inundation Forecasting Demonstration Project (CIFDP) Coastal Flooding & Vulnerable Populations Coastal
Terrestrial Flood Risk and Climate Change in the Yallahs River, Jamaica. An assessment of future flood risk. projections of future climate
 Terrestrial Flood Risk and Climate Change in the Yallahs River, Jamaica An assessment of future flood risk using hydrodynamic models driven by projections of future climate Matthew Wilson1, Arpita Mandal2,
Crystal Goodison & Alexis Thomas University of Florida GeoPlan Center
 Crystal Goodison & Alexis Thomas University of Florida GeoPlan Center A1A Fort Lauderdale, Hurricane Sandy, October 2012 Photo Credits: Susan Stocker, Sun Sentinel FAU s Research Report (completed Jan
Future climate change in the Antilles: Regional climate, tropical cyclones and sea states
 Future climate change in the Antilles: Regional climate, tropical cyclones and sea states Ali Belmadani Météo-France Antilles-Guiana (DIRAG), Martinique Acknowledgements: P. Palany, R. Pilon, F. Chauvin,
Draft for Discussion 11/11/2016
 Coastal Risk Consulting (CRC) Climate Vulnerability Assessment for Village of Key Biscayne Deliverable 1.1 in Statement of Work. Preliminary Vulnerability Assessment Identifying Flood Hotspots Introduction...
St Lucia. General Climate. Recent Climate Trends. UNDP Climate Change Country Profiles. Temperature. Precipitation
 UNDP Climate Change Country Profiles St Lucia C. McSweeney 1, M. New 1,2 and G. Lizcano 1 1. School of Geography and Environment, University of Oxford. 2. Tyndall Centre for Climate Change Research http://country-profiles.geog.ox.ac.uk
Hurricane Harvey: SE Texas Impacts. 10 PM CDT UPDATE Friday, August 25, 2017 Prepared by: Lance Wood
 Hurricane Harvey: SE Texas Impacts 10 PM CDT UPDATE Friday, August 25, 2017 Prepared by: Lance Wood Latest Observations Hurricane Harvey making landfall this evening near Rockport as a category 4 hurricane.
Current and future climate of Vanuatu. Pacific-Australia Climate Change Science and Adaptation Planning Program
 Pacific-Australia Climate Change Science and Adaptation Planning Program Hiu Torres Islands Vanua Lava Gaua Banks Islands Espiritu Santo Malekula Ambae Épi Maéwo Pentecost Ambrym Shepherd Islands Éfate
Comparative Analysis of Hurricane Vulnerability in New Orleans and Baton Rouge. Dr. Marc Levitan LSU Hurricane Center. April 2003
 Comparative Analysis of Hurricane Vulnerability in New Orleans and Baton Rouge Dr. Marc Levitan LSU Hurricane Center April 2003 In order to compare hurricane vulnerability of facilities located in different
What is PRECIS and what can it do?
 PRECIS: Facilitating capacity building and technology transfer to enable climate change mitigation and adaptation activities worldwide Joseph Intsiful, UNFCCC NWP Meeting, Mexico City 4-7 March 2008 Content:
Exploring the costs of sea level rise: should we focus on means or extremes?
 Exploring the costs of sea level rise: should we focus on means or extremes? Robert Muir-Wood Chief Research Officer, RMS AAAS Chicago Feb 16 th 2009 Change Points in Cat 3-5 Hurricane Numbers (the drivers
Traffic and Weather. Soaring Safety Foundation. Tom Johnson CFIG
 Traffic and Weather Soaring Safety Foundation Tom Johnson CFIG Weather Contents Weather Gathering Sources Weather Acquisition Enroute Weather Analysis Weather Hazards Weather in the Landing Pattern Basic
Lorna V Inniss, Ph.D SAGE Workshop, New York City
 Lorna V Inniss, Ph.D SAGE Workshop, New York City 2014-05-21 Why me? The globally recognized success of the Barbados ICZM programme has generated requests for technical assistance and CD from many Governments
The Field Research Facility, Duck, NC Warming Ocean Observations and Forecast of Effects
 The Field Research Facility, Duck, NC Warming Ocean Observations and Forecast of Effects A potential consequence of a warming ocean is more frequent and more intense wind events (Hurricanes & Typhoons)
Tropical Cyclone Harvey (AL092017)
") Tropical Cyclone Harvey (AL092017) Wind and Storm Surge Preliminary Event Briefing Windward Islands 20 August 2017 Registered Office: CCRIF SPC c/o Sagicor Insurance Managers Limited, 198 North Church
Tropical Cyclone Harvey (AL092017) Wind and Storm Surge Preliminary Event Briefing Windward Islands 20 August 2017 Registered Office: CCRIF SPC c/o Sagicor Insurance Managers Limited, 198 North Church
Which tools were used? How and why?
 Raquel Chun 1, Clare Goodess 2, Ottis Joslyn 1, Colin Harpham 2 1 Caribbean Community Climate Change Centre, Belize 2 University of East Anglia, UK Keywords: Urban development, Flood Risk, Flooding, Extreme
Rising Sea Levels: Time for Proactive Action in Florida and the Caribbean?
 Rising Sea Levels: Time for Proactive Action in Florida and the Caribbean? Dr. Alan Fyall and Dr. Thomas Wahl National Center for Integrated Coastal Research, University of Central Florida Dr. Roberta
Climate Change Adaptation for ports and navigation infrastructure
 Climate Change Adaptation for ports and navigation infrastructure The application of climate projections and observations to address climate risks in ports Iñigo Losada Research Director IHCantabria Universidad
Hazard Impact Modelling for Storms Workshop
 The UK s trusted voice for coordinated natural hazards advice Hazard Impact Modelling for Storms Workshop Ken Mylne, Becky Hemingway, Ervin Zsoter ECMWF UEF 2017, 15 th June 2017 The UK s trusted voice
Covered Area Rainfall Event (28-30 September 2016) Tropical Cyclone Matthew Excess Rainfall
 Tropical Cyclone Matthew Excess Rainfall") Covered Area Rainfall Event (28-30 September 2016) Tropical Cyclone Matthew Excess Rainfall Event Briefing St. Vincent & the Grenadines 11 October 2016 Registered Office: c/o Sagicor Insurance Managers
Covered Area Rainfall Event (28-30 September 2016) Tropical Cyclone Matthew Excess Rainfall Event Briefing St. Vincent & the Grenadines 11 October 2016 Registered Office: c/o Sagicor Insurance Managers
Sea Level Rise Study Summary Town of South Bethany
 Sea Level Rise Study Summary Town of South Bethany This presentation was prepared by Anchor QEA for the Town of South Bethany using Federal Funds under award NA14 NOS 419 0123 from the Delaware Coastal
Assessing Storm Tide Hazard for the North-West Coast of Australia using an Integrated High-Resolution Model System
 Assessing Storm Tide Hazard for the North-West Coast of Australia using an Integrated High-Resolution Model System J. Churchill, D. Taylor, J. Burston, J. Dent September 14, 2017, Presenter Jim Churchill
Building Marina Resilience to Storms Wisconsin Marine Association Conference November 2-3, 2016
 Julia Noordyk NOAA Great Lakes Coastal Storms Program Outreach Coordinator UW Sea Grant @NoordCoast Building Marina Resilience to Storms Wisconsin Marine Association Conference November 2-3, 2016 July
Current and future climate of the Cook Islands. Pacific-Australia Climate Change Science and Adaptation Planning Program
 Pacific-Australia Climate Change Science and Adaptation Planning Program Penrhyn Pukapuka Nassau Suwarrow Rakahanga Manihiki N o r t h e r n C o o k I s l a nds S o u t h e Palmerston r n C o o k I s l
1.0 Introduction 1.1 Geographic Location 1.2 Topography 1.3 Climate and Rainfall 1.4 Geology and Hydrogeology 1.5 Water Availability 1.
 1.0 1.1 Geographic Location 1.2 Topography 1.3 Climate and Rainfall 1.4 Geology and Hydrogeology 1.5 Water Availability 1.6 Demography 1.0 1.1 Geographic Location St. Lucia forms part of an archipelago
Ellen L. Mecray NOAA Regional Climate Services Director, Eastern Region Taunton, MA
 Ellen L. Mecray NOAA Regional Climate Services Director, Eastern Region Taunton, MA Regions of the US National Climate Assessment What we Observe: Climate changes and impacts Increasing temperature Increasingly
Climate Outlook through 2100 South Florida Ecological Services Office Vero Beach, FL September 9, 2014
 Climate Outlook through 2100 South Florida Ecological Services Office Vero Beach, FL September 9, 2014 Short Term Drought Map: Short-term (
CLIMATE MODEL DOWNSCALING: HOW DOES IT WORK AND WHAT DOES IT TELL YOU?
 rhgfdjhngngfmhgmghmghjmghfmf CLIMATE MODEL DOWNSCALING: HOW DOES IT WORK AND WHAT DOES IT TELL YOU? YAN FENG, PH.D. Atmospheric and Climate Scientist Environmental Sciences Division Argonne National Laboratory
What the Science Tells Us & How Practitioners Can Use the Science
 What the Science Tells Us & How Practitioners Can Use the Science Presented at APTA Los Angeles, CA Presented by Dr. B. Tod Delaney President, First Environment, Inc. Wed. August 3, 2011 1 Agenda 1. What
Hindcast Arabian Gulf
 Hindcast Arabian Gulf Image of isobars of atmospheric pressure and hindcast wind- and wave field over the Arabian Gulf during a storm in January 1993. Detailed wave studies are supported by nesting of
COMPOUND FLOODING: EXAMPLES,
 1 COMPOUND FLOODING: EXAMPLES, METHODS, AND CHALLENGES Thomas Wahl Civil, Environmental and Construction Engineering & National Center for Integrated Coastal Research University of Central Florida Definition(s)
Sea Level Rise and Hurricane Florence storm surge research methodology
 Sea Level Rise and Hurricane Florence storm surge research methodology Hurricane Florence storm surge analysis was conducted using a variety of input sources. In order to determine the maximum storm surge
How will global warming of 2 o C affect Delaware? Observed and projected changes in climate and their impacts
 How will global warming of 2 o C affect Delaware? Observed and projected changes in climate and their impacts To prevent dangerous interference with the climate system, the scientific view is that the
The Coastal Change Analysis Program and the Land Cover Atlas. Rebecca Love NOAA Office for Coastal Management
 The Coastal Change Analysis Program and the Land Cover Atlas Rebecca Love NOAA Office for Coastal Management Natural Infrastructure = Greater Resilience NOAA C-CAP Regional Land Cover and Change coast.noaa.gov/digitalcoast/data/ccapregional
The Challenge of Compound Events
 The Challenge of Compound Events Jakob Zscheischler, Seth Westra, Bart van den Hurk, AmirAghaKouchak, David Bresch, Michael Leonard, Andy Pitman, Sonia Seneviratne, Thomas Wahl, Philip Ward, Xuebin Zhang
Antigua and Barbuda. General Climate. Recent Climate Trends. UNDP Climate Change Country Profiles. Temperature
 UNDP Climate Change Country Profiles Antigua and Barbuda C. McSweeney 1, M. New 1,2 and G. Lizcano 1 1. School of Geography and Environment, University of Oxford. 2. Tyndall Centre for Climate Change Research
CHAPTER 13 WEATHER ANALYSIS AND FORECASTING MULTIPLE CHOICE QUESTIONS
 CHAPTER 13 WEATHER ANALYSIS AND FORECASTING MULTIPLE CHOICE QUESTIONS 1. The atmosphere is a continuous fluid that envelops the globe, so that weather observation, analysis, and forecasting require international
Climate Outlook through 2100 South Florida Ecological Services Office Vero Beach, FL January 13, 2015
 Climate Outlook through 2100 South Florida Ecological Services Office Vero Beach, FL January 13, 2015 Short Term Drought Map: Short-term (
Cuba. General Climate. Recent Climate Trends. UNDP Climate Change Country Profiles. Temperature. C. McSweeney 1, M. New 1,2 and G.
 UNDP Climate Change Country Profiles Cuba C. McSweeney 1, M. New 1,2 and G. Lizcano 1 1. School of Geography and Environment, University of Oxford. 2. Tyndall Centre for Climate Change Research http://country-profiles.geog.ox.ac.uk
Experiences on Data and Observational Requirements in the Caribbean
 Experiences on Data and Observational Requirements in the Caribbean UNFCCC Expert Workshop on Methods & Tools and on Data & Observations under the NWP on Impacts, Vulnerability & Adaptation to Climate
Climate Adaptation Challenges for Boston s Water and Sewer Systems
 National Association of Flood & Stormwater Management Agencies Climate Adaptation Challenges for Boston s Water and Sewer Systems John P Sullivan P.E. October 15,2014 Boston 1630 Boston 1630-2012 Boston
Grenada. General Climate. Recent Climate Trends. UNDP Climate Change Country Profiles. Temperature. Precipitation
 UNDP Climate Change Country Profiles C. McSweeney 1, M. New 1,2 and G. Lizcano 1 1. School of Geography and Environment, University of Oxford. 2. Tyndall Centre for Climate Change Research http://country-profiles.geog.ox.ac.uk
Florida Flood Risks. Heavy Rainfall. Groundwater. Tidal Flooding. Storm Surge. King Tides. Runoff/Riverine
 Florida Flood Risks Heavy Rainfall Storm Surge Groundwater Tidal Flooding Runoff/Riverine King Tides Sawgrass Mills Mall Sunrise, Florida 15 of rain in 3 days, with most in 24 hours. Mall closed for 3
NOAA s Regional Climate Science & Information: Opportunities and Challenges
 NOAA s Regional Climate Science & Information: Opportunities and Challenges Dr. Wayne Higgins Climate Program Office, Director Office of Oceanic and Atmospheric Research National Oceanic and Atmospheric
Coastal Inundation Forecasting and Community Response in Bangladesh
 WMO Coastal Inundation Forecasting and Community Response in Bangladesh Bapon (SHM) Fakhruddin Nadao Kohno 12 November 2015 System Design for Coastal Inundation Forecasting CIFDP-PSG-5, 14-16 May 2014,
Flooding Performance Indicator Summary. Performance indicator: Flooding impacts on riparian property for Lake Ontario and the Upper St.
 Flooding Performance Indicator Summary Performance indicator: Flooding impacts on riparian property for Lake Ontario and the Upper St. Lawrence River Technical Workgroup: Coastal TWG Research by: Baird
What is happening to the Jamaican climate?
 What is happening to the Jamaican climate? Climate Change and Jamaica: Why worry? Climate Studies Group, Mona (CSGM) Department of Physics University of the West Indies, Mona Part 1 RAIN A FALL, BUT DUTTY
"Outcomes of the storm surge and waves workshop in Dominican Republic and the questionnaire"
 "Outcomes of the storm surge and waves workshop in Dominican Republic and the questionnaire" Strengthening Regional Cooperation to Support Forecasting with Multi Hazard Approach in RA IV Ritz Carlton Grand
Mozambique. General Climate. UNDP Climate Change Country Profiles. C. McSweeney 1, M. New 1,2 and G. Lizcano 1
 UNDP Climate Change Country Profiles Mozambique C. McSweeney 1, M. New 1,2 and G. Lizcano 1 1. School of Geography and Environment, University of Oxford. 2.Tyndall Centre for Climate Change Research http://country-profiles.geog.ox.ac.uk
TOWNSVILLE STORM SURGE HYPOTHETICAL: TECHNICAL SPECIFICATIONS
 TOWNSVILLE STORM SURGE HYPOTHETICAL: TECHNICAL SPECIFICATIONS Stuart Mead, Mahesh Prakash and Fletcher Woolard CSIRO Mathematics, Informatics and Statistics, Private Bag 33, Clayton South, VIC 3168, Australia
WMO. Early Warning System
 World Meteorological Organization Working together in weather, climate and water WMO Tropical Cyclone Early Warning System Koji Kuroiwa Tropical Cyclone Programme World Meteorological Organization For
Disaster Risk Assessment: Opportunities for GIS and data management with Open DRI
 Disaster Risk Assessment: Opportunities for GIS and data management with Open DRI Jacob Opadeyi Department of Geomatics Engineering and Land Management, The University of the West Indies, St. Augustine,
Translating Ensemble Weather Forecasts into Probabilistic User-Relevant Information
 Translating Ensemble Weather Forecasts into Probabilistic User-Relevant Information Matthias Steiner with contributions from Robert Sharman, Thomas Hopson, Yubao Liu, Mike Chapman, and Mary Hayden Email:
European Geosciences Union General Assembly Vienna, Austria 27 April - 02 May 2014
 European Geosciences Union General Assembly Vienna, Austria 27 April - 02 May 2014 Projecting the Current & Future Impact of Storm Surges on Coastal Flood Extent at Pigeon Point, South-West Tobago, through
Current Climate Science and Climate Scenarios for Florida
 Current Climate Science and Climate Scenarios for Florida Daniel Bader and Vivien Gornitz Water Utilities and Climate Change Workshop Palm Beach County Water Utilities/ Water Research Foundation June 10,
PRMS WHITE PAPER 2014 NORTH ATLANTIC HURRICANE SEASON OUTLOOK. June RMS Event Response
 PRMS WHITE PAPER 2014 NORTH ATLANTIC HURRICANE SEASON OUTLOOK June 2014 - RMS Event Response 2014 SEASON OUTLOOK The 2013 North Atlantic hurricane season saw the fewest hurricanes in the Atlantic Basin
WMO Guide on Integrated Urban Weather, Environment and Climate Services for Cities (IUWECS) Hong Kong- an experience from a high-density city
 Hong Kong- an experience from a high-density city") WMO Guide on Integrated Urban Weather, Environment and Climate Services for Cities (IUWECS) Hong Kong- an experience from a high-density city Dr. Chao REN Associate Professor School of Architecture The
WMO Guide on Integrated Urban Weather, Environment and Climate Services for Cities (IUWECS) Hong Kong- an experience from a high-density city Dr. Chao REN Associate Professor School of Architecture The
Outline. Extreme sea levels: past and future. Tropical cyclones 12/07/2013. North Sea Storm Surge of Understanding of coastal extremes
 Outline Extreme sea levels: past and future Svetlana Jevrejeva National Oceanography Centre, Liverpool, UK Introduction Changes in extreme sea levels in the recent past ( progress and limitation in understanding)
Tropical Storm Harvey: SE Texas Impacts
 Tropical Storm Harvey: SE Texas Impacts 10 AM CDT UPDATE Thursday, August 24, 2017 Prepared by: Dan Reilly, Brian Kyle PLEASE MUTE YOUR LINES AND DON T PUT ON HOLD! Situation Overview Tropical Storm Harvey
A global slowdown of tropical-cyclone translation speed and implications for flooding
 A global slowdown of tropical-cyclone translation speed and implications for flooding Thomas Mortlock, Risk Frontiers As the Earth s atmosphere warms, the atmospheric circulation changes. These changes
Pacific Catastrophe Risk Assessment And Financing Initiative
 Pacific Catastrophe Risk Assessment And Financing Initiative PALAU September is expected to incur, on average,.7 million USD per year in losses due to earthquakes and tropical cyclones. In the next 5 years,
Hurricanes, Sea Level Rise, and South Florida s Challenging Future
 Hurricanes, Sea Level Rise, and South Florida s Challenging Future Brian McNoldy Senior Research Associate University of Miami Tropical Weather Expert Washington Post Scientific Advisor Coastal Risk Consulting
(April 7, 2010, Wednesday) Tropical Storms & Hurricanes Part 2
 Tropical Storms & Hurricanes Part 2") Lecture #17 (April 7, 2010, Wednesday) Tropical Storms & Hurricanes Part 2 Hurricane Katrina August 2005 All tropical cyclone tracks (1945-2006). Hurricane Formation While moving westward, tropical disturbances
Lecture #17 (April 7, 2010, Wednesday) Tropical Storms & Hurricanes Part 2 Hurricane Katrina August 2005 All tropical cyclone tracks (1945-2006). Hurricane Formation While moving westward, tropical disturbances
Storm Hazard Assessment for San Pedro/Ambergris Caye, Belize. Statistical Estimation of Hazard Frequency and Intensity
 Storm Hazard Assessment for San Pedro/Ambergris Caye, Belize Statistical Estimation of Hazard Frequency and Intensity Prepared For: Caribbean Development Bank Advanced technology and analysis solving problems
Climate Change and. roads in Poland. The example of Polish National Roads projects. Commission Training Session. G. Łutczyk, E.
 Climate Change and Adaptation Major to CC Projects for national roads in Poland The example of Polish National Roads projects Commission Training Session Results of Stages I, II and beginning of Stage
Improving global coastal inundation forecasting WMO Panel, UR2014, London, 2 July 2014
 Improving global coastal inundation forecasting WMO Panel, UR2014, London, 2 July 2014 Cyclone Sidr, November 2007 Hurricane Katrina, 2005 Prof. Kevin Horsburgh Head of marine physics, UK National Oceanography
Copernicus EMS: Αξιολόγηση πολλαπλών φυσικών κινδύνων - Σχεδιασμός και Ανάκτηση
 Building Capacity for a Centre of Excellence for EO-based monitoring of Natural Disasters Copernicus EMS: Αξιολόγηση πολλαπλών φυσικών κινδύνων - Σχεδιασμός και Ανάκτηση Γιάννης Παπουτσής ΙΑΑΔΕΤ Εθνικό
NOAA National Centers for Environmental Information State Summaries 149-HI. Observed and Projected Temperature Change
 9-HI HAWAI I Key Messages Average annual temperature has increased by about F since 95, with a leveling off of the rate of warming in the last two decades. Under a higher emissions pathway, historically
COASTAL DATA APPLICATION
 2015 Coastal GeoTools Proactive By Design. Our Company Commitment COASTAL DATA APPLICATION Projecting Future Coastal Flood Risk for Massachusetts Bay Bin Wang, Tianyi Liu, Daniel Stapleton & Michael Mobile
Cape Verde. General Climate. Recent Climate. UNDP Climate Change Country Profiles. Temperature. Precipitation
 UNDP Climate Change Country Profiles C. McSweeney 1, M. New 1,2 and G. Lizcano 1 1. School of Geography and Environment, University of Oxford. 2. Tyndall Centre for Climate Change Research http://country-profiles.geog.ox.ac.uk
[State of the Jamaican Climate 2012]
![[State of the Jamaican Climate 2012]](/thumbs/81/83864622.jpg "[State of the Jamaican Climate 2012]") State of the Jamaican Climate 2012 [State of the Jamaican Climate 2012] Information for Resilience Building PREPARED BY: i P a g e CLIMATE STUDIES GROUP MONA DEPARTMENT OF PHYSICS UNIVERISTY OF THE WEST
State of the Jamaican Climate 2012 [State of the Jamaican Climate 2012] Information for Resilience Building PREPARED BY: i P a g e CLIMATE STUDIES GROUP MONA DEPARTMENT OF PHYSICS UNIVERISTY OF THE WEST
Pacific Catastrophe Risk Assessment And Financing Initiative
 Pacific Catastrophe Risk Assessment And Financing Initiative TIMOR-LESTE September Timor-Leste is expected to incur, on average, 5.9 million USD per year in losses due to earthquakes and tropical cyclones.
TROPICAL CYCLONES IN A WARMER WORLD
 TROPICAL CYCLONES IN A WARMER WORLD Dr Mark Saunders Benfield Hazard Research Centre Department of Space and Climate Physics University College London Workshop for Under 35s Reinsurance Group 14th October
USING MIKE TO MODEL COASTAL CATASTROPHE RISK
 USING MIKE TO MODEL COASTAL CATASTROPHE RISK Nicola Howe, Christopher Thomas, Joss Matthewman, John Maskell* 1 SUMMARY About RMS Who are we and what do we do? How do we use MIKE in our workflow? Case study:
WEEKEND WEATHER OUTLOOK BELIZE, CENTRAL AMERICA
 WEEKEND WEATHER OUTLOOK BELIZE, CENTRAL AMERICA PERIOD: Friday, July 13 until Monday, July 16, 2012 DATE ISSUED: Friday, June 13, 2012, 9:00 am RFrutos SYNOPSIS: A weak pressure gradient over the NW Caribbean
NOAA s National Weather Service Philadelphia/Mt. Holly NJ
 Next Briefing Package: Thursday, October 1, 2015 no later than 300 PM Hazards and Impacts: Overview: A dangerous weather pattern is developing for our region. Threats include very heavy rainfall, inland
Tool 2.1.4: Inundation modelling of present day and future floods
 Impacts of Climate Change on Urban Infrastructure & the Built Environment A Toolbox Tool 2.1.4: Inundation modelling of present day and future floods Authors M. Duncan 1 and G. Smart 1 Affiliation 1 NIWA,
Storm Surge/Coastal Inundation State of the Union. Jamie Rhome Storm Surge Team Lead NOAA/National Hurricane Center
 Storm Surge/Coastal Inundation State of the Union Jamie Rhome Storm Surge Team Lead NOAA/National Hurricane Center 2 Tampa: Cat 5 Scenario 3 4 The Stakes are High Combination of SLR and increasing coastal