Activity Climatographs
|
|
|
- Madlyn Dickerson
- 5 years ago
- Views:
Transcription

1 Name: Tiya Shen Date: May 22, 2016 Activity Climatographs Student Instructions: For this assignment, you will complete the activity by reading the purpose and procedures, answering questions and writing a conclusion in this Word Document You will also produce a graph. This can be done on paper, scanned and uploaded OR done with an Excel if you would prefer. Please follow the student instructions highlighted in yellow. Purpose: To interpret, compare and construct climatographs. Materials: Graph paper, pencil ruler OR graphing program Procedures: Part 1 - Climatograph Interpretation: 1) Look at the climatograph below and answer the following questions (type directly below each question using FULL SENTENCES): a) What information is indicated on the left hand y-axis (vertical axis?)
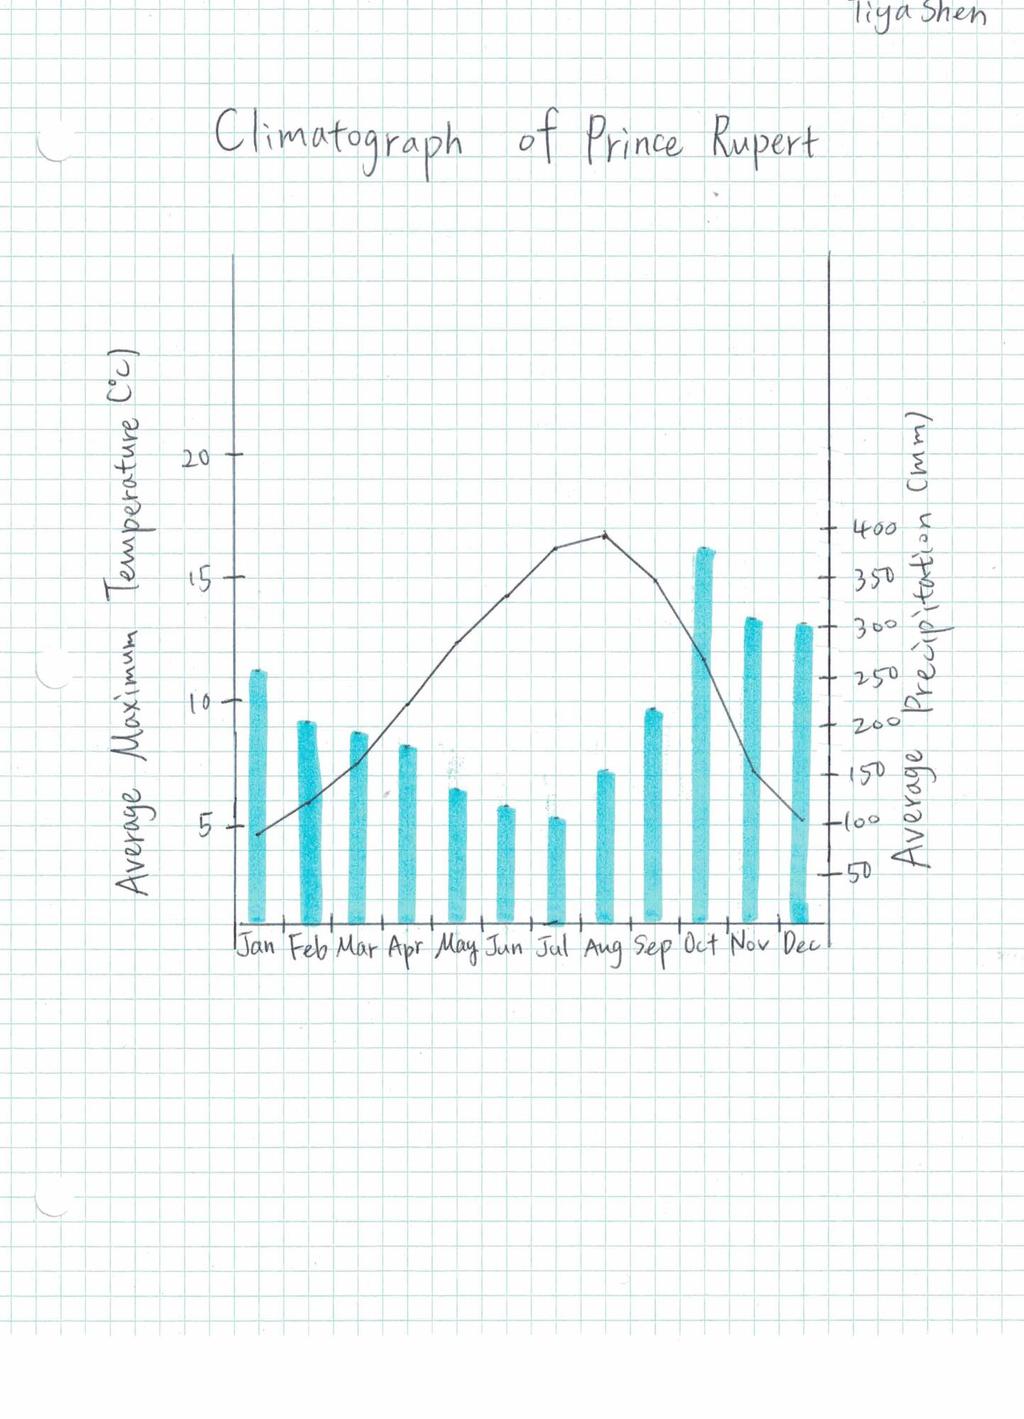
2 It is the temperate of Kamloops. b) What are the units on this axis? The unit is degree Celsius. c) What information is indicated on the right hand y-axis? It is the precipitation of Kamloops. d) What are the units on this axis? The unit is millimeter. e) What information is indicated on the x-axis (horizontal axis)? It is the time, and the unit is month. f) If you were looking at the line (temperature) which axis should you use? I should use the left hand y-axis. g) If you were looking at the bars (precipitation) which axis should you use? I should use the right hand y-axis. Part 2: Construct a Climatograph Student Instruction: You can use graph paper and then scan and upload your graph, or use a graphing program like excel to create a graph. (Note that creating a graph with a double y-axis is a bit tricky, so you may want to do this by hand) 2) Use the data below (Source: Environment Canada) to construct a climatograph for Prince Rupert BC. - months should be on the x- axis (horizontal axis) - temperature on the left hand y-axis (vertical axis), present as a line graph (smooth curve, NOT connect the dots) - precipitation on the right hand y-axis (vertical axis), present as a bar graph - refer to the graph in part 1 as an example Month Average Maximum Temperature (oc) Average Precipitation (mm) January February
3 March April May June Climate Data for Prince Rupert, BC July Tips for good graphing: August September use a ruler for straight lines, - make sure to label all axis including units, October make sure all intervals (the squares or tic marks November on a graph) are worth an EQUAL AMOUNT...for December example go up by twos, fives etc. - the graph should be large enough to be interpreted visually...at least 1/2 a page is a good rule of thumb
4
5 Data and Observations: Ensure you upload your graph with this assignment. Questions: Student Instructions: Answer these questions directly in the Word document under each question. Please use full sentences 1) How would you describe the climate of Kamloops (part 1) compared to the climate of Prince Rupert (part 2). For example is it hot/mild/cold, dry/wet/average precipitation? The climate of Kamloops is drier than the climate of Prince Rupert, but their average temperate are almost same. 2) Which biome type do you think Kamloops is, based on the climatograph? Explain your answer (refer to the previous lesson biomes if you need to). I think it is a cold desert because the average precipitation is below 25cm, but the average temperature is not as high as a hot desert. 3) Which biome type do you think Prince Rupert is, based on the climatograph? Explain your answer (refer to the previous lesson on biomes if you need to). I think it is a temperate rainforest because its average precipitation is over 200cm, and the average temperature is 10.6 degree Celsius, it is in the rage of temperate rainforest s temperature, from 5 degree Celsius to 25 degree Celsius. Conclusion: Student instructions: Type your conclusion in paragraph form below. In one or two well written paragraphs written in the third person, write a conclusion. Discuss the major results of this activity, the science behind it, what you have learned and any difficulties in this activity. DO NOT: - simply repeat the procedures,- use I, we, names etc Third Person Writing For example, instead of saying "I learned in this lab," try saying "This lab demonstrated..." Instead of saying "I think Climatographs are used for..." say "Climatographs are used for..."
6 Conclusion: Being Able to Reading Climatograph Tiya Shen The climatograph is a graph about the average temperate and precipitation for a location. Being able to read a climatograph is an important skill in science. People get many information from the graph. For example, the location, the vegetation, and the biome. The precipitation tells people the vegetation in the place. Abundant rainfall means the vegetation are diverse and growing well. Trees are very tall because plants need water to grow. Limited rainfall means the plant species are monotonous and the plants can t be tall. The plants in the dry place is short because that can reduce loss water. The temperate makes people know where it locations. If the temperate in January, November, and December is high than the temperate in June, July, and August, people can know the place is in southern hemisphere and vice versa. If the temperate is very high, people can know the place is in the tropical zone. If the temperate is low, people can know it s in polar circle. If people combine the temperate and precipitation, they can know the biome of the place. Every each biome has different characters of climate, so people can compare the climate of each biome, and match the climate of the climatograph. Then, people can know what the biome is on the climatogroph. In conclusion, people get so much information from reading a climatograph. It can be understood why this skill is so important.
Canada only has 7 of these biomes. Which biome do you think does not exist in Canada and why?
 Climate Zones and Biomes There are 8 defined biomes Permanent ice Tundra Boreal Forest Temperate deciduous forest Temperate rainforest Grassland Desert Tropical rainforest What is a biome? a major biotic
Worksheet: The Climate in Numbers and Graphs
 Worksheet: The Climate in Numbers and Graphs Purpose of this activity You will determine the climatic conditions of a city using a graphical tool called a climate chart. It represents the long-term climatic
Making a Climograph: GLOBE Data Explorations
 Making a Climograph: A GLOBE Data Exploration Purpose Students learn how to construct and interpret climographs and understand how climate differs from weather. Overview Students calculate and graph maximum
WHEN IS IT EVER GOING TO RAIN? Table of Average Annual Rainfall and Rainfall For Selected Arizona Cities
 WHEN IS IT EVER GOING TO RAIN? Table of Average Annual Rainfall and 2001-2002 Rainfall For Selected Arizona Cities Phoenix Tucson Flagstaff Avg. 2001-2002 Avg. 2001-2002 Avg. 2001-2002 October 0.7 0.0
Lab Activity: Climate Variables
 Name: Date: Period: Water and Climate The Physical Setting: Earth Science Lab Activity: Climate Variables INTRODUCTION:! The state of the atmosphere continually changes over time in response to the uneven
Name Period Date. Analyzing Climographs
 Name Period Date Analyzing Climographs Climographs: It is often helpful to plot two different types of data on the same graph. For example, a climograph is a single graph that charts both the average temperature
Identifying Biomes from Climatograms
 Identifying Biomes from Welcome to your climatogram lab. In this lab you will investigate the between the amount of rainfall and the variance of temperature and the effect on the distribution of biomes
MAST ACADEMY OUTREACH. WOW (Weather on Wheels)
") MAST ACADEMY OUTREACH ELEMENTARY PROGRAM Adventures Aboard WOW (Weather on Wheels) Teacher Instructions / Answer Keys MAST Academy Maritime and Science Technology High School Miami-Dade County Public Schools
MAST ACADEMY OUTREACH ELEMENTARY PROGRAM Adventures Aboard WOW (Weather on Wheels) Teacher Instructions / Answer Keys MAST Academy Maritime and Science Technology High School Miami-Dade County Public Schools
P7: Limiting Factors in Ecosystems
 P7: Limiting Factors in Ecosystems Purpose To understand that physical factors temperature and precipitation limit the growth of vegetative ecosystems Overview Students correlate graphs of vegetation vigor
Standard 2.1 Understand how text features make information accessible and usable. Assessment
 Grade 5 Language Arts Reading Comprehension Standard 2.1 Understand how text features make information accessible and usable. Name Date Assessment Directions: Read the paragraph, look at the graph and
MAST ACADEMY OUTREACH. WOW (Weather on Wheels)
") MAST ACADEMY OUTREACH MIDDLE SCHOOL PROGRAM Adventures Aboard WOW (Weather on Wheels) On-Site Highlights Packet MAST Academy Maritime and Science Technology High School Miami-Dade County Public Schools
MAST ACADEMY OUTREACH MIDDLE SCHOOL PROGRAM Adventures Aboard WOW (Weather on Wheels) On-Site Highlights Packet MAST Academy Maritime and Science Technology High School Miami-Dade County Public Schools
My Community vs. Nunavut Weather and Climate
 My Community vs. Nunavut Content Areas Social Studies, Science, Technology Objective Students will differentiate between weather and climate. For 1 month, they will collect and graph daily temperature
. Your group might be assigned to research and report on a biome. Read through all of the following instructions before starting to plan the report.
 Think About It Humans, other animals, and plants have adaptations to different climates in different biomes. For example, humans have adapted to different climates through clothing. A person living in
Third Grade Math and Science DBQ Weather and Climate/Representing and Interpreting Charts and Data - Teacher s Guide
 Third Grade Math and Science DBQ Weather and Climate/Representing and Interpreting Charts and Data - Teacher s Guide A document based question (DBQ) is an authentic assessment where students interact with
Data and Error Analysis
 Data and Error Analysis Introduction In this lab you will learn a bit about taking data and error analysis. The physics of the experiment itself is not the essential point. (Indeed, we have not completed
Appendix B: Skills Handbook
 Appendix B: Skills Handbook Effective communication is an important part of science. To avoid confusion when measuring and doing mathematical calculations, there are accepted conventions and practices
Weather and Climate in Canada. October 2 nd, 2017
 Weather and Climate in Canada October 2 nd, 2017 Big Ideas How are climate and weather in Canada influenced by geography? How do weather and climate affect the lives of Canadians? Weather and Climate
Weather to Climate Investigation: Maximum Temperature
 Name: Date: Guiding Questions: Weather to Climate Investigation: Maximum Temperature What are the historical and current weather patterns or events for a location in the United States? What are the long-term
Biosphere Organization
 Biosphere Organization What is a biome? Biomes refer to a large region or area characterized by the following: 1. A particular climate pattern of the annual temperature and precipitation distribution,
Graphing Sea Ice Extent in the Arctic and Antarctic
 Graphing Sea Ice Extent in the Arctic and Antarctic 1. Large amounts of ice form in some seasons in the oceans near the North Pole and the South Pole (the Arctic Ocean and the Southern Ocean). This ice,
WEATHER ON WHEELS Elementary School Program
 WEATHER ON WHEELS Elementary School Program MAST ACADEMY OUTREACH On-Site Packet Miami-Dade County Public Schools Miami, Florida MAST ACADEMY OUTREACH WEATHER ON WHEELS ELEMENTARY ON-SITE HIGHLIGHTS PACKET
Time allowed: 1 hour 30 minutes
 SPECIMEN ASSESSMENT MATERIAL: SET 2 GCSE GEOGRAPHY Paper 1 Living with the physical environment Specimen Materials For this paper you must have: a pencil a ruler. Time allowed: 1 hour 30 minutes Instructions
Motions of the Sun Model Exploration
 Name Date Bell Motions of the Sun Model Exploration 1. Go to the University of Nebraska-Lincoln Motions of the Sun Simulator: http://astro.unl.edu/naap/motion3/animations/sunmotions.swf 2. This is what
Bell Ringer: February 6, 2013
 Bell Ringer: Please take 5 minutes to work on/ finish PBL BIOME MAP and PBL SCAVENGER HUNT! If you are finished with this, please take 5 minutes to write any last second questions about SCIENCE FAIR TONIGHT!
How to Make a Climatogram Using Excel (10 pts. extra credit for each climatogram)
") How to Make a Climatogram Using Excel (10 pts. extra credit for each climatogram) As you know two abiotic factors that determine the makeup of a biome are temperature and precipitation. A climatogram is
How to Make a Climatogram Using Excel (10 pts. extra credit for each climatogram) As you know two abiotic factors that determine the makeup of a biome are temperature and precipitation. A climatogram is
P6: Global Patterns in Green-Up and Green-Down
 P6: Global Patterns in Green-Up and Green-Down Purpose To investigate the annual cycle of plant growth and decline using visualizations and graphs Overview Students will analyze visualizations and graphs
Monsoons: A Three Season Play. Kathy Sundstedt School not available. Content Area (Req.): Physical Geography, English/Reading
: Physical Geography, English/Reading") Instructional Sequence/Procedure (Req.): 1. Teacher preparation: Read through play and consider students for roles. Find yarn and string. Using overhead transparency, make an enlarged map of South Asia
Instructional Sequence/Procedure (Req.): 1. Teacher preparation: Read through play and consider students for roles. Find yarn and string. Using overhead transparency, make an enlarged map of South Asia
Name Class Date. 2. What is the average weather condition in an area over a long period of time called? a. winter b. temperature c. climate d.
 Skills Worksheet Directed Reading B Section: What Is Climate? CLIMATE VS. WEATHER 1. What kind of conditions vary from day to day? a. climate b. weather c. latitude d. biome 2. What is the average weather
MAST ACADEMY OUTREACH. WOW (Weather on Wheels)
") MAST ACADEMY OUTREACH ELEMENTARY SCHOOL PROGRAM Adventures Aboard WOW (Weather on Wheels) On-Site Packet MAST Academy Maritime and Science Technology High School Miami-Dade County Public Schools Miami,
MAST ACADEMY OUTREACH ELEMENTARY SCHOOL PROGRAM Adventures Aboard WOW (Weather on Wheels) On-Site Packet MAST Academy Maritime and Science Technology High School Miami-Dade County Public Schools Miami,
Comparing Climate Features
 Long-Term Projects Comparing Climate Features A graph of the monthly temperatures and amounts of precipitation for a region is called a climatograph. Climatographs can be used to compare the climates of
TOM NEWBY SCHOOL EXAMINATION. Name: Grade 6. Question 1: Climates of the world [5]
![TOM NEWBY SCHOOL EXAMINATION. Name: Grade 6. Question 1: Climates of the world [5]](/thumbs/95/126118858.jpg "TOM NEWBY SCHOOL EXAMINATION. Name: Grade 6. Question 1: Climates of the world [5]") 1 TOM NEWBY SCHOOL EXAMINATION Subject GEOGRAPHY Examiner MRS P SINGH Date 25 NOVEMBER 2016 Total marks 50 Session 1 Duration 1 HOUR Grade 6 Moderator MISS M ALBERTYN Special instructions/ Equipment 1.
1 TOM NEWBY SCHOOL EXAMINATION Subject GEOGRAPHY Examiner MRS P SINGH Date 25 NOVEMBER 2016 Total marks 50 Session 1 Duration 1 HOUR Grade 6 Moderator MISS M ALBERTYN Special instructions/ Equipment 1.
Module 11: Meteorology Topic 3 Content: Climate Zones Notes
 Introduction Latitude is such an important climate factor that you can make generalizations about a location's climate based on its latitude. Areas near the equator or the low latitudes are generally hot
Paper Reference. 1312/1F Edexcel GCSE Geography A Paper 1F. Foundation Tier. Monday 5 June 2006 Morning Time: 1 hour 45 minutes
 Centre No. Paper Reference Surname Initial(s) Candidate No. 1 3 1 2 1 F Signature Paper Reference(s) 1312/1F Edexcel GCSE Geography A Paper 1F Foundation Tier Monday 5 June 2006 Morning Time: 1 hour 45
Section. 1 Our Planet, Earth. Prepare to Read
 1 Section Step-by-Step Instruction Objectives Social Studies 1. Learn about Earth s movement in relation to the sun. 2. Explore seasons and latitude. Reading/Language Arts Use context clues from surrounding
Science Standard 1: Students analyze monthly precipitation and temperature records, displayed in bar charts, collected in metric units (mm).
.") Title: Precipitation Patterns across the Globe NSF GK-12 Fellow: Terry Legg Type of Lesson: STEM Grade Level(s): 4 th - 7 th grade This activity can be tailored to older, more advanced students by having
Title: Precipitation Patterns across the Globe NSF GK-12 Fellow: Terry Legg Type of Lesson: STEM Grade Level(s): 4 th - 7 th grade This activity can be tailored to older, more advanced students by having
The Tropical Rainforest Ecosystem
 The Tropical Rainforest Objectives To be able to interpret and analyse data from a variety of different sources To recognise how different parts of the tropical rainforest ecosystem are linked together
1 What Is Climate? TAKE A LOOK 2. Explain Why do areas near the equator tend to have high temperatures?
 CHAPTER 17 1 What Is Climate? SECTION Climate BEFORE YOU READ After you read this section, you should be able to answer these questions: What is climate? What factors affect climate? How do climates differ
RR#5 - Free Response
 Base your answers to questions 1 through 3 on the data table below and on your knowledge of Earth Science. The table shows the area, in million square kilometers, of the Arctic Ocean covered by ice from
Adopt a Drifter Lesson Plan by Mary Cook, Middle School Science Teacher, Ahlf Jr. High School, Searcy, Arkansas
 Adopt a Drifter Lesson Plan by Mary Cook, Middle School Science Teacher, Ahlf Jr. High School, Searcy, Arkansas Do Ocean Surface Currents Influence Climate? Objectives Students will construct climographs
Natural Disasters and Storms in Philadelphia. What is a storm? When cold, dry air meets warm, moist (wet) air, there is a storm.
 air, there is a storm.") Natural Disasters and Storms in Philadelphia 1. What is a natural disaster? 2. Does Philadelphia have many natural disasters? o Nature (noun) everything in the world not made No. Philadelphia does not
Natural Disasters and Storms in Philadelphia 1. What is a natural disaster? 2. Does Philadelphia have many natural disasters? o Nature (noun) everything in the world not made No. Philadelphia does not
Rolling marble lab. B. Pre-Lab Questions a) When an object is moving down a ramp, is its speed increasing, decreasing, or staying the same?
 When an object is moving down a ramp, is its speed increasing, decreasing, or staying the same?") IP 614 Rolling marble lab Name: Block: Date: A. Purpose In this lab you are going to see, first hand, what acceleration means. You will learn to describe such motion and its velocity. How does the position
IP 614 Rolling marble lab Name: Block: Date: A. Purpose In this lab you are going to see, first hand, what acceleration means. You will learn to describe such motion and its velocity. How does the position
Chapter 3 Section 3 World Climate Regions In-Depth Resources: Unit 1
 Guided Reading A. Determining Cause and Effect Use the organizer below to show the two most important causes of climate. 1. 2. Climate B. Making Comparisons Use the chart below to compare the different
OBSERVING PROJECT PARTNER ELECTION
 ASTRONOMY 25 NOON SUN PROJECT P. P. 1 Name(s) Section Day/Time Fill in either Part 1 or Part 2. OBSERVING PROJECT PARTNER ELECTION Part I. SOLO OBSERVER I will do the observing project by myself. I will
WEATHER AND CLIMATE SCIENCE
 WEATHER AND CLIMATE SCIENCE 4-H-1023 LEVEL 1 Reference in this publication to any specific commercial product, process, or service, or the use of any trade, firm, or corporation name is for general informational
Unit 1. Sustaining Earth s Ecosystem
 Unit 1 Sustaining Earth s Ecosystem 1. Identify distinctive plants, animals, and climatic characteristics of Canadian biomes (tundra, boreal forest, temperate deciduous forest, temperate rainforest, grasslands)
Investigation IV: Seasonal Precipitation and Seasonal Surface Runoff in the US
 Investigation IV: Seasonal Precipitation and Seasonal Surface Runoff in the US Purpose Students will consider the seasonality of precipitation and surface runoff and think about how the time of year can
Lesson 3 Latitude is Everything
 Latitude is Everything Essential Question: How does latitude affect the Amount of Solar Energy an Area Receives and that Area s Climate? Objective: Students will be able to explain how the sun s energy
Climatographs. Suggested Activity. Conduct an Investigation 1-1C on page 30. Climatograph Tofino, British Columbia, 49ºN. Average Precipitation (mm)
") BCS10_C01_F 3/11/08 12:44 P Page 16 Climatographs Conduct an Investigation 1-1C on page 30 onth verage Precipitation (mm) verage Temperature ( C) F S O N D 436 382 3 249 16 138 77 94 134 340 47 462 4 6
BCS10_C01_F 3/11/08 12:44 P Page 16 Climatographs Conduct an Investigation 1-1C on page 30 onth verage Precipitation (mm) verage Temperature ( C) F S O N D 436 382 3 249 16 138 77 94 134 340 47 462 4 6
Biomes Section 1. Chapter 6: Biomes Section 1: What is a Biome? DAY ONE
 Chapter 6: Biomes Section 1: What is a Biome? DAY ONE What is a Biome? Biomes are large regions characterized by a specific type of climate and certain types of plant and animal communities. The climate
Cambridge International Examinations Cambridge International General Certificate of Secondary Education
 Cambridge International Examinations Cambridge International General Certificate of Secondary Education *1121116891* ENVIRONMENTAL MANAGEMENT 0680/22 Paper 2 October/November 2017 1 hour 45 minutes Candidates
Ecology Lab Exercise 1.2: Biome Assessment
 Name Period Ecology Lab Exercise 1.2: Biome Assessment You will be doing a walk-about through Del Mar, quietly observing the features of the area, and being careful not to interact with the different species
A Plot of the Tracking Signals Calculated in Exhibit 3.9
 CHAPTER 3 FORECASTING 1 Measurement of Error We can get a better feel for what the MAD and tracking signal mean by plotting the points on a graph. Though this is not completely legitimate from a sample-size
Lesson IV. TOPEX/Poseidon Measuring Currents from Space
 Lesson IV. TOPEX/Poseidon Measuring Currents from Space The goal of this unit is to explain in detail the various measurements taken by the TOPEX/Poseidon satellite. Keywords: ocean topography, geoid,
Huron School District Core Curriculum Guide Grade Level: 4th Content Area: Math
 Unit Title: Understand Whole Numbers and Operations Month(s): August, September, October 4N3.1; 4N1.1; 4A3.1; 4A1.3 4A1.2; 4A2.1; 4A2.2; 4A4.1 4A1.1 To read, write, and indentify the place value of whole
Earth Motions Packet 14
 Earth Motions Packet 14 Your Name Group Members Score Minutes Standard 4 Key Idea 1 Performance Indicator 1.1 Explain complex phenomena, such as tides, variations in day length, solar insolation, apparent
Twelve Moons Curriculum Overview
 Twelve Moons Twelve Moons Curriculum Overview 1. Instructions The curriculum is arranged by book section, in order. Feel free to teach in any order you wish. The curriculum adheres to three objectives
MISSION DEBRIEFING: Teacher Guide
 Activity 2: It s Raining Again?! Using real data from one particular location, students will interpret a graph that relates rainfall to the number of cases of malaria. Background The relationship between
Ensure that you write your name, surname and class on this paper.
 pics: er s name and surname: mate and vegetation around the world : Grade 6 pulation why people live ol: Grade 6 Geography 40 where they do Examination Total mark: 40 Date: 26 November 2015 Time: 1 hour
1 What Is Climate? TAKE A LOOK 2. Explain Why do areas near the equator tend to have high temperatures?
 CHAPTER 17 1 What Is Climate? SECTION Climate BEFORE YOU READ After you read this section, you should be able to answer these questions: What is climate? What factors affect climate? How do climates differ
GRAPHICAL PRESENTATION OF AGRO-CLIMATIC DATA. Table 1. Month wise average maximum and minimum temperature in Dhaka, Bangladesh
 GRAPHICAL PRESENTATION OF AGRO-CLIMATIC DATA Mirza Hasanuzzaman, PhD Assistant Professor Department of Agronomy Sher-e-Bangla Agricultural University There are different types of graph are used to present
Location Latitude Longitude Durham, NH
 Name: Date: Weather to Climate Investigation: Snow **These are example answers using the Durham, NH dataset. Answers from students using Boise and Little Rock datasets will differ. Guiding Questions: What
Supplement of Vegetation greenness and land carbon-flux anomalies associated with climate variations: a focus on the year 2015
 Supplement of Atmos. Chem. Phys., 17, 13903 13919, 2017 https://doi.org/10.5194/acp-17-13903-2017-supplement Author(s) 2017. This work is distributed under the Creative Commons Attribution 3.0 License.
Name Class Date. For each pair of terms, explain how the meanings of the terms differ.
 Skills Worksheet Chapter Review USING KEY TERMS For each pair of terms, explain how the meanings of the terms differ. 1. biome and tropical zone 2. weather and climate 3. temperate zone and polar zone
Physical Features of Monsoon Asia. 192 Unit 7 Teachers Curriculum Institute 60 N 130 E 140 E 150 E 60 E 50 N 160 E 40 N 30 N 150 E.
 50 N 60 E 70 E 80 E 90 E 100 E 60 N 110 E 120 E 130 E 140 E 150 E 50 N 160 E 40 N 40 N 30 N 60 E 30 N 150 E Tropic of Cancer 20 N Tropic of Cancer 20 N 10 N 10 N 0 Equator 0 Equator 10 S 10 S 0 500 1,000
Map showing location of tropical rainforests
 Information sheet one: where are the rainforests located? Map showing location of tropical rainforests On your sheet describe the geographical location of the tropical rainforests. Top tip: Use an atlas
In this activity, students will compare weather data from to determine if there is a warming trend in their community.
 Overview: In this activity, students will compare weather data from 1910-2000 to determine if there is a warming trend in their community. Objectives: The student will: use the Internet to locate scientific
Biomes and Ecosystems
 Name Biomes and Ecosystems Date How do Earth s biomes and ecosystems differ? Before You Read Before you read the chapter, think about what you know about biomes and ecosystems Record your thoughts in the
Lesson 2: Terrestrial Ecosystems
 Lesson 2: Terrestrial Ecosystems A terrestrial ecosystem is a land ecosystem. Terrestrial ecosystems include tundra, forests, grasslands, deserts, and rainforests. 1 The arctic tundra is earth s coldest
UNST 232 Mentor Section Assignment 5 Historical Climate Data
 UNST 232 Mentor Section Assignment 5 Historical Climate Data 1 introduction Informally, we can define climate as the typical weather experienced in a particular region. More rigorously, it is the statistical
A week in the life of. Time days of the week. copy
 Time days of the week You will need: black pens pencils scissors copy What to do: You are going to make your own A Week in the Life of Me book. Think of something special you do on each day of the week.
House price moving averages. Information sheet A Finding moving averages. Average house prices in the UK since 2000
 House price moving averages House prices vary a great deal. They are influenced by many factors, including the region of the UK where the houses are and the time of year. This activity introduces moving
WHAT CAN MAPS TELL US ABOUT THE GEOGRAPHY OF ANCIENT GREECE? MAP TYPE 1: CLIMATE MAPS
 WHAT CAN MAPS TELL US ABOUT THE GEOGRAPHY OF ANCIENT GREECE? MAP TYPE 1: CLIMATE MAPS MAP TYPE 2: PHYSICAL AND/OR TOPOGRAPHICAL MAPS MAP TYPE 3: POLITICAL MAPS TYPE 4: RESOURCE & TRADE MAPS Descriptions
forest tropical jungle swamp marsh prairie savanna pampas Different Ecosystems (rainforest)
") Different Ecosystems forest A region of land that is covered with many trees and shrubs. tropical jungle (rainforest) swamp A region with dense trees and a variety of plant life. It has a tropical climate.
Different Ecosystems forest A region of land that is covered with many trees and shrubs. tropical jungle (rainforest) swamp A region with dense trees and a variety of plant life. It has a tropical climate.
Weather and climate. reflect. what do you think? look out!
 reflect You re going on vacation in a week and you have to start thinking about what clothes you re going to pack for your trip. You ve read the weather reports for your vacation spot, but you know that
See Hear Smell Touch Taste
 Imagery Chart See Hear Smell Touch Taste Writing 5 Conversions - Distance cm 0 1 2 3 4 5 6 7 8 9 10 11 12 13 14 15 16 17 18 0 1 2 3 4 5 6 7 in centimeters to inches 1 centimeter = 0.39 inches 1 inch =
Exemplar for Internal Achievement Standard. Mathematics and Statistics Level 3
 Exemplar for internal assessment resource Mathematics and Statistics for Achievement Standard 91580 Exemplar for Internal Achievement Standard Mathematics and Statistics Level 3 This exemplar supports
LAB 3: THE SUN AND CLIMATE NAME: LAB PARTNER(S):
:") GEOG 101L PHYSICAL GEOGRAPHY LAB SAN DIEGO CITY COLLEGE SELKIN 1 LAB 3: THE SUN AND CLIMATE NAME: LAB PARTNER(S): The main objective of today s lab is for you to be able to visualize the sun s position
GEOG 101L PHYSICAL GEOGRAPHY LAB SAN DIEGO CITY COLLEGE SELKIN 1 LAB 3: THE SUN AND CLIMATE NAME: LAB PARTNER(S): The main objective of today s lab is for you to be able to visualize the sun s position
2010 Growing Season. Prince Edward County Report
 2010 Growing Season Prince Edward County Report WIN Staff November 10, 2010 Overview It is always remarkable how each growing season is unique as a result of yearly variations in weather. Changes occur
Atlantic Region s Changing Climate. Dr. Adam Fenech, University of Prince Edward Island Climate Change and Aquaculture Symposium 11 March 2014
 Atlantic Region s Changing Climate Dr. Adam Fenech, University of Prince Edward Island Climate Change and Aquaculture Symposium 11 March 2014 Disclaimer Analysis has not been checked Some analysis uses
Lesson II: How does the general circulation of the atmosphere describe earth s climate zones?
 Lesson II: How does the general circulation of the atmosphere describe earth s climate zones? Overview: What causes the general circulation of the atmosphere? How does the general circulation of the atmosphere
Average temperature ( F) World Climate Zones. very cold all year with permanent ice and snow. very cold winters, cold summers, and little rain or snow
 World Climate Zones. very cold all year with permanent ice and snow. very cold winters, cold summers, and little rain or snow") P r e v i e w Look carefully at the climagraph of Mumbai, India. What is the wettest month (or months) in Mumbai? What is the driest month (or months) in Mumbai? What effects might this city s climate
P r e v i e w Look carefully at the climagraph of Mumbai, India. What is the wettest month (or months) in Mumbai? What is the driest month (or months) in Mumbai? What effects might this city s climate
New Paltz Central School District Mathematics Third Grade
 September - Unit 1: Place Value and Numeration/Addition and Use hundred charts and number lines. Place Value October Subtraction Read and write numbers to 1,000. Pre- What is place value? Order numbers
Climate and Adaptations at the Fullerton Arboretum
 Climate and Adaptations at the Fullerton Arboretum Summary of Activity: Investigate different implementations of key plant traits in plants from different climate settings. Assess plant traits in terms
HADDONFIELD PUBLIC SCHOOLS Curriculum Map for Advanced Precalculus/Chapter 1
 Curriculum Map for Advanced Precalculus/Chapter 1 September 1 September 30 (16 days) Targeted Standard(s): NJCCCS 4.3A Interdisciplinary: NJCCCS Technological Literacy 8.1A, 8.1B Enduring Understandings
Lesson 5: Trees. Tell your child that today he is going to learn about trees. Ask him what he knows about trees and how people are dependent on trees.
 Dirt and Plants -> 5: Trees Lesson 5: Trees Getting Started? Big Ideas P How are people dependent on plants? & Facts and Definitions P Evergreen trees do not change colors in the fall and winter. P Deciduous
Climatogram Project: Temperature, Rainfall, and Biome Distribution
 Name Period Due Date Climatogram Project: Temperature, Rainfall, and Biome Distribution Welcome to your climatogram project. In this project you will investigate the relationship between the amount of
Cell- Each box of information in a chart or table. A cell is named by its column and row
 Lesson 7 Cell- Each box of information in a chart or table. A cell is named by its column and row Steps to read a chart or table: Check the title to find out what type of information is being presented.
Climate Regions. Combining Climate Graphs and Köppen s Classification
 Lab 15 Climate Regions Combining knowledge of the global patterns behind the major climatic controls, this lab will teach students how to construct climate graphs and then allow them to explore patterns
Classroom Activities/Lesson Plan
 Grade Band: Middle School Unit 18 Unit Target: Earth and Space Science Unit Topic: This Is the Solar System Lesson 3 Instructional Targets Reading Standards for Informational Text Range and Level of Text
A summary of the weather year based on data from the Zumwalt weather station
 ZUMWALT PRAIRIE WEATHER 2016 A summary of the weather year based on data from the Zumwalt weather station Figure 1. An unusual summer storm on July 10, 2016 brought the second-largest precipitation day
Climate Zones FACT-FILE. What s the difference between weather and climate? Is latitude important?
 FACT-FILE What s the difference between weather and climate? Climate is average weather. Meteorologists (scientists who study weather) work out what the average is by using information about temperature
Go to Grade 6 Everyday Mathematics Sample Lesson
 McGraw-Hill makes no representations or warranties as to the accuracy of any information contained in this McGraw-Hill Material, including any warranties of merchantability or fitness for a particular
UNIVERSITY OF CAMBRIDGE INTERNATIONAL EXAMINATIONS International General Certificate of Secondary Education GEOGRAPHY 0460/01
 UNIVERSITY OF CAMBRIDGE INTERNATIONAL EXAMINATIONS International General Certificate of Secondary Education GEOGRAPHY 0460/01 Paper 1 Additional Materials: Answer Booklet/Paper; Ruler May/June 2005 1 hour
Elementary Social Studies Content Area Assessment Task. Winter 2010 EDUC 203
 1 Elementary Social Studies Content Area Assessment Task Winter 2010 EDUC 203 Students: Fourth grade class in Watsonville, CA. Approximately 90% Latino, primarily of Mexicandescent. About 80% participate
How does the greenhouse effect maintain the biosphere s temperature range? What are Earth s three main climate zones?
 Section 4 1 The Role of Climate (pages 87 89) Key Concepts How does the greenhouse effect maintain the biosphere s temperature range? What are Earth s three main climate zones? What Is Climate? (page 87)
Paper 2. Calculator allowed. Mathematics test. First name. Last name. School. Remember KEY STAGE 3 TIER 5 7. satspapers.org
 Ma KEY STAGE 3 Mathematics test TIER 5 7 Paper 2 Calculator allowed First name Last name School 2009 Remember The test is 1 hour long. You may use a calculator for any question in this test. You will need:
Our climate system is based on the location of hot and cold air mass regions and the atmospheric circulation created by trade winds and westerlies.
 CLIMATE REGIONS Have you ever wondered why one area of the world is a desert, another a grassland, and another a rainforest? Or have you wondered why are there different types of forests and deserts with
Pages 63 Monday May 01, 2017
 Pages 6 Notebook check: Biome basics and A Modern Desert Biome Warm up: Copy the graph below, title it Defining factor a biome: temperature and precipitation Pages 6 an based on regarding Learning scale:
Betty LaDuke. Biomes of the World PRESERVATION OF OREGON S ARTISTIC HERITAGE PROJECT. Grade Level no grade level listed on the word document
 Betty LaDuke PRESERVATION OF OREGON S ARTISTIC HERITAGE PROJECT Biomes of the World Grade Level no grade level listed on the word document Theme The artist in his or her environment Curriculum Framework
CLIMATE EDUCATION FRAMEWORK
 3.3 1 3.3 RAIN OBJECTIVES The students Invent and make rain gauges. Measure and record the depth of rainfall. Compare the depth of rain falling in different places. CLIMATE EDUCATION FRAMEWORK 3-5Weather.A.1